Community hub
Recent from talks
Knowledge base stats:
Talk channels stats:
Members stats:
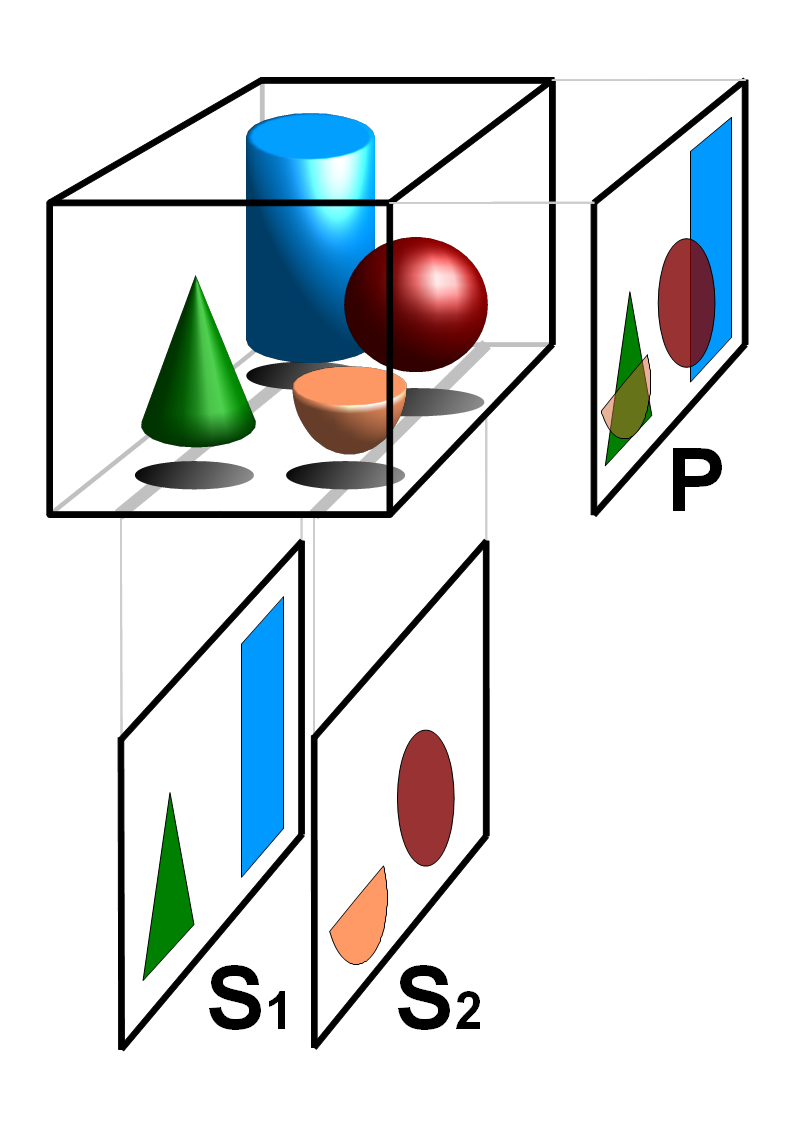
Tomography
Tomography is imaging by sections or sectioning that uses any kind of penetrating wave. The method is used in radiology, archaeology, biology, atmospheric science, geophysics, oceanography, plasma physics, materials science, cosmochemistry, astrophysics, quantum information, and other areas of science.
The word tomography is derived from Ancient Greek τόμος tomos, "slice, section" and γράφω graphō, "to write" or, in this context as well, "to describe." A device used in tomography is called a tomograph, while the image produced is a tomogram.
In many cases, the production of these images is based on the mathematical procedure tomographic reconstruction, such as X-ray computed tomography technically being produced from multiple projectional radiographs. Many different reconstruction algorithms exist. Most algorithms fall into one of two categories: filtered back projection (FBP) and iterative reconstruction (IR). These procedures give inexact results: they represent a compromise between accuracy and computation time required. FBP demands fewer computational resources, while IR generally produces fewer artifacts (errors in the reconstruction) at a higher computing cost.
Although MRI (magnetic resonance imaging), optical coherence tomography and ultrasound are transmission methods, they typically do not require movement of the transmitter to acquire data from different directions. In MRI, both projections and higher spatial harmonics are sampled by applying spatially varying magnetic fields; no moving parts are necessary to generate an image. On the other hand, since ultrasound and optical coherence tomography uses time-of-flight to spatially encode the received signal, it is not strictly a tomographic method and does not require multiple image acquisitions.
Some recent advances rely on using simultaneously integrated physical phenomena, e.g. X-rays for both CT and angiography, combined CT/MRI and combined CT/PET.
Discrete tomography and Geometric tomography, on the other hand, are research areas[citation needed] that deal with the reconstruction of objects that are discrete (such as crystals) or homogeneous. They are concerned with reconstruction methods, and as such they are not restricted to any of the particular (experimental) tomography methods listed above.
A new technique called synchrotron X-ray tomographic microscopy (SRXTM) allows for detailed three-dimensional scanning of fossils.
The construction of third-generation synchrotron sources combined with the tremendous improvement of detector technology, data storage and processing capabilities since the 1990s has led to a boost of high-end synchrotron tomography in materials research with a wide range of different applications, e.g. the visualization and quantitative analysis of differently absorbing phases, microporosities, cracks, precipitates or grains in a specimen. Synchrotron radiation is created by accelerating free particles in high vacuum. By the laws of electrodynamics this acceleration leads to the emission of electromagnetic radiation (Jackson, 1975). Linear particle acceleration is one possibility, but apart from the very high electric fields one would need it is more practical to hold the charged particles on a closed trajectory in order to obtain a source of continuous radiation. Magnetic fields are used to force the particles onto the desired orbit and prevent them from flying in a straight line. The radial acceleration associated with the change of direction then generates radiation.
Hub AI
Tomography AI simulator
(@Tomography_simulator)
Tomography
Tomography is imaging by sections or sectioning that uses any kind of penetrating wave. The method is used in radiology, archaeology, biology, atmospheric science, geophysics, oceanography, plasma physics, materials science, cosmochemistry, astrophysics, quantum information, and other areas of science.
The word tomography is derived from Ancient Greek τόμος tomos, "slice, section" and γράφω graphō, "to write" or, in this context as well, "to describe." A device used in tomography is called a tomograph, while the image produced is a tomogram.
In many cases, the production of these images is based on the mathematical procedure tomographic reconstruction, such as X-ray computed tomography technically being produced from multiple projectional radiographs. Many different reconstruction algorithms exist. Most algorithms fall into one of two categories: filtered back projection (FBP) and iterative reconstruction (IR). These procedures give inexact results: they represent a compromise between accuracy and computation time required. FBP demands fewer computational resources, while IR generally produces fewer artifacts (errors in the reconstruction) at a higher computing cost.
Although MRI (magnetic resonance imaging), optical coherence tomography and ultrasound are transmission methods, they typically do not require movement of the transmitter to acquire data from different directions. In MRI, both projections and higher spatial harmonics are sampled by applying spatially varying magnetic fields; no moving parts are necessary to generate an image. On the other hand, since ultrasound and optical coherence tomography uses time-of-flight to spatially encode the received signal, it is not strictly a tomographic method and does not require multiple image acquisitions.
Some recent advances rely on using simultaneously integrated physical phenomena, e.g. X-rays for both CT and angiography, combined CT/MRI and combined CT/PET.
Discrete tomography and Geometric tomography, on the other hand, are research areas[citation needed] that deal with the reconstruction of objects that are discrete (such as crystals) or homogeneous. They are concerned with reconstruction methods, and as such they are not restricted to any of the particular (experimental) tomography methods listed above.
A new technique called synchrotron X-ray tomographic microscopy (SRXTM) allows for detailed three-dimensional scanning of fossils.
The construction of third-generation synchrotron sources combined with the tremendous improvement of detector technology, data storage and processing capabilities since the 1990s has led to a boost of high-end synchrotron tomography in materials research with a wide range of different applications, e.g. the visualization and quantitative analysis of differently absorbing phases, microporosities, cracks, precipitates or grains in a specimen. Synchrotron radiation is created by accelerating free particles in high vacuum. By the laws of electrodynamics this acceleration leads to the emission of electromagnetic radiation (Jackson, 1975). Linear particle acceleration is one possibility, but apart from the very high electric fields one would need it is more practical to hold the charged particles on a closed trajectory in order to obtain a source of continuous radiation. Magnetic fields are used to force the particles onto the desired orbit and prevent them from flying in a straight line. The radial acceleration associated with the change of direction then generates radiation.