

Community hub
Recent from talks
Contribute something
Nothing was collected or created yet.
Traffic collision
View on Wikipedia


A traffic collision, also known as a motor vehicle collision or car crash, occurs when a vehicle collides with another vehicle, pedestrian, animal, road debris, or other moving or stationary obstruction, such as a tree, pole or building. Traffic collisions often result in injury, disability, death, and property damage as well as financial costs to both society and the individuals involved. Road transport is statistically the most dangerous situation people deal with on a daily basis, but casualty figures from such incidents attract less media attention than other, less frequent types of tragedy.[1] The commonly used term car accident is increasingly falling out of favor with many government departments and organizations: the Associated Press style guide recommends caution before using the term and the National Union of Journalists advises against it in their Road Collision Reporting Guidelines.[2][3] Some collisions are intentional vehicle-ramming attacks, staged crashes, vehicular homicide or vehicular suicide.
Several factors contribute to the risk of collisions, including vehicle design, speed of operation, road design, weather, road environment, driving skills, impairment due to alcohol or drugs, and behavior, notably aggressive driving, distracted driving, speeding and street racing.

In 2013, 54 million people worldwide sustained injuries from traffic collisions.[4] This resulted in 1.4 million deaths in 2013, up from 1.1 million deaths in 1990.[5] About 68,000 of these occurred with children less than five years old.[5] Almost all high-income countries have decreasing death rates, while the majority of low-income countries have increasing death rates due to traffic collisions. Middle-income countries have the highest rate with 20 deaths per 100,000 inhabitants, accounting for 80% of all road fatalities with 52% of all vehicles. While the death rate in Africa is the highest (24.1 per 100,000 inhabitants), the lowest rate is to be found in Europe (10.3 per 100,000 inhabitants).[6]
Gallery
[edit]-
 Accident danger zone - Belarusian road sign
 -
 Accident area - Chinese road sign
 -
 Pedestrian accident blackspot ahead - Hong Kong road sign
 -
 A traffic accident has occurred - Danish road sign
 -
 Slow down, accident prone area - Filipino road sign
 -
 Accident - Bangladeshi road sign
 -
 Accident ahead - Thai road sign
 -
 Accident - Portuguese road sign
 -
 Accident - Azerbaijani road sign
 -
 A traffic accident has occurred - Bulgarian road sign
 -
 Traffic accident - Polish road sign
 -
 Accident ahead - Bosnian-Herzegovinian road sign
 -
 Traffic accident - Croatian road sign
 -
 Accident - Romanian road sign
 -
 Accident - Czech road sign
 -
 Accident - Estonian road sign
 -
 Accident - New Zealand road sign
 -
 Risk of accident with pedestrian - plate indicating a place of frequent accidents of nature portrayed by the plate - Polish road sign
 -
 variant – risk of rear-end accident with another vehicle
 -
 variant – risk of head-on accident with another vehicle
 -
 variant – risk of accident with a tram
 -
 variant – risk of accident with a train
 -
 T-15 "plate indicating a place of frequent accidents caused by slippery road surface due to rain"


Terminology
[edit]
Traffic collisions can be classified by general types. Types of collision include head-on, road departure, rear-end, side collisions, and rollovers.
Many different terms are commonly used to describe vehicle collisions. The World Health Organization uses the term road traffic injury,[7] while the U.S. Census Bureau uses the term motor vehicle accidents (MVA),[8] and Transport Canada uses the term "motor vehicle traffic collision" (MVTC).[9] Other common terms include auto accident, car accident, car crash, car smash, car wreck, motor vehicle collision (MVC), personal injury collision (PIC), road accident, road traffic accident (RTA), road traffic collision (RTC), and road traffic incident (RTI) as well as more unofficial terms including smash-up, pile-up, and fender bender
Criticism of "accident" terminology
[edit]Many organizations, companies and government agencies have begun to avoid the term accident, instead preferring terms such as collision, crash or incident.[10][11][12] This is because the term accident may imply that there is no one to blame or that the collision was unavoidable, whereas most traffic collisions are the result of driver error such as driving under the influence, excessive speed, distractions such as mobile phones, other risky behavior, poor road design, or other preventable factors.[13][14][15][16]
In 1997, George L. Reagle, the Associate Administrator for Motor Carriers of the Federal Motor Carrier Safety Administration wrote a letter stating that "A crash is not an accident", emphasizing that the Department's Research and Special Programs Administration, the Federal Highway Administration, and the National Highway Traffic Safety Administration had all declared that "accident" should be avoided in their published writings and media communications.[17] In 2016, the Associated Press updated its style guide to recommend that journalists use "crash, collision, or other terms" rather than "accident" unless culpability is proven. The AP also recommends avoiding "accident" when negligence is proven or claimed because the term "can be read as exonerating the person responsible."[18] In 2021, the American Automobile Association (AAA) passed a resolution to replace "car accident" with "car crash" in their vocabulary.[19] In 2022, the traffic management company INRIX announced that "accident" would be removed from their lexicon.[20] In 2023, the National Union of Journalists in the UK published the Road Collision Reporting Guidelines which includes a recommendation that journalists should "Avoid use of the word ‘accident’ until the facts of a collision are known."[21]
The Maryland Department of Transportation's Highway Safety Office emphasizes that "crashes are no accident", saying that "Using the word accident suggests that an incident was unavoidable, but many roadway crashes can be attributed to human error."[22] The Michigan Department of Transportation states that "accident" should be dropped in favor of "crash", saying that "Traffic crashes are fixable problems, caused by inattentive drivers and driver behavior. They are not accidents."[18] In line with their Vision Zero commitments, the Portland Bureau of Transportation recommends using "crash" rather than "accident".[23]
On the contrary, some have criticized the use of terminology other than accident for holding back safety improvements, based on the idea that such terms perpetuate a culture of blame that may discourage the involved parties from fully disclosing the facts, and thus frustrate attempts to address the real root causes.[24]
Intent
[edit]Some traffic collisions are caused intentionally by a driver. For example, a collision may be caused by a driver who intends to commit vehicular suicide.[25] Collisions may also be intentionally caused by people who hope to make an insurance claim against the other driver or may be staged for such purposes as insurance fraud.[26][27] Motor vehicles may also be involved in collisions as part of a deliberate effort to hurt other people, such as in a vehicle-ramming attack[28] or vehicular homicide.[29]
Health effects
[edit]Physical
[edit].jpg)
A number of physical injuries can commonly result from the blunt force trauma caused by a collision, ranging from bruising and contusions to catastrophic physical injury (e.g., paralysis), traumatic or non-traumatic cardiac arrest and death. The CDC estimates that roughly 100 people die in motor vehicle crashes each day in the United States.[30]
Psychological
[edit]Following collisions, long-lasting psychological trauma may occur.[31] These issues may make those who have been in a crash afraid to drive again. In some cases, psychological trauma may affect individuals' lives, causing difficulty going to work, attending school, or performing family responsibilities.[32]
Causes
[edit]Road incidents are caused by a large number of human factors such as failing to act according to weather conditions, road design, signage, speed limits, lighting conditions, pavement markings, and roadway obstacles.[33] A 1985 study by K. Rumar, using British and American crash reports as data, suggested 57% of crashes were due solely to driver factors, 27% to the combined roadway and driver factors, 6% to the combined vehicle and driver factors, 3% solely to roadway factors, 3% to combined roadway, driver, and vehicle factors, 2% solely to vehicle factors, and 1% to combined roadway and vehicle factors.[34] Reducing the severity of injury in crashes is more important than reducing incidence and ranking incidence by broad categories of causes is misleading regarding severe injury reduction. Vehicle and road modifications are generally more effective than behavioral change efforts with the exception of certain laws such as required use of seat belts, motorcycle helmets, and graduated licensing of teenagers.[35]
Human factors
[edit]Human factors in vehicle collisions include anything related to drivers and other road users that may contribute to a collision. Examples include driver behavior, visual and auditory acuity, decision-making ability, and reaction speed.
A 1985 report based on British and American crash data found driver error, intoxication, and other human factors contribute wholly or partly to about 93% of crashes.[34] A 2019 report from the U.S. National Highway Traffic Safety Administration found that leading contributing factors for fatal crashes included driving too fast for conditions or in excess of the speed limit, operating under the influence, failure to yield right of way, failure to keep within the proper lane, operating a vehicle in a careless manner, and distracted driving.[36]
Drivers distracted by mobile devices had nearly four times greater risk of crashing their cars than those who were not. Research from the Virginia Tech Transportation Institute has found that drivers who are texting while driving are 23 times more likely to be involved in a crash as non-texting drivers.[37] Dialing a phone is the most dangerous distraction, increasing a drivers' chance of crashing by 12 times, followed by reading or writing, which increased the risk by ten times.[38]
An RAC survey of British drivers found 78% of drivers thought they were highly skilled at driving, and most thought they were better than other drivers, a result suggesting overconfidence in their abilities. Nearly all drivers who had been in a crash did not believe themselves to be at fault.[39] One survey of drivers reported that they thought the key elements of good driving were:[40]
- controlling a car including a good awareness of the car's size and capabilities
- reading and reacting to road conditions, weather, road signs, and the environment
- alertness, reading and anticipating the behavior of other drivers.
Although proficiency in these skills is taught and tested as part of the driving exam, a "good" driver can still be at a high risk of crashing because:
the feeling of being confident in more and more challenging situations is experienced as evidence of driving ability, and that 'proven' ability reinforces the feelings of confidence. Confidence feeds itself and grows unchecked until something happens – a near-miss or an accident.[40]
An Axa survey concluded Irish drivers are very safety-conscious relative to other European drivers. This does not translate to significantly lower crash rates in Ireland.[41]
Accompanying changes to road designs have been wide-scale adoptions of rules of the road alongside law enforcement policies that included drink-driving laws, setting of speed limits, and speed enforcement systems such as speed cameras. Some countries' driving tests have been expanded to test a new driver's behavior during emergencies, and their hazard perception.
There are demographic differences in crash rates. For example, although young people tend to have good reaction times, disproportionately more young male drivers feature in collisions,[42] with researchers observing that many exhibit behaviors and attitudes to risk that can place them in more hazardous situations than other road users.[40] This is reflected by actuaries when they set insurance rates for different age groups, partly based on their age, sex, and choice of vehicle. Older drivers with slower reactions might be expected to be involved in more collisions, but this has not been the case as they tend to drive less and, apparently, more cautiously.[43] Attempts to impose traffic policies can be complicated by local circumstances and driver behavior. In 1969 Leeming warned that there is a balance to be struck when "improving" the safety of a road.[44]
Conversely, a location that does not look dangerous may have a high crash frequency. This is, in part, because if drivers perceive a location as hazardous, they take more care. Collisions may be more likely to happen when hazardous road or traffic conditions are not obvious at a glance, or where the conditions are too complicated for the limited human machine to perceive and react in the time and distance available. High incidence of crashes is not indicative of high injury risk. Crashes are common in areas of high vehicle congestion, but fatal crashes occur disproportionately on rural roads at night when traffic is relatively light.
This phenomenon has been observed in risk compensation research, where the predicted reductions in collision rates have not occurred after legislative or technical changes. One study observed that the introduction of improved brakes resulted in more aggressive driving,[45] and another argued that compulsory seat belt laws have not been accompanied by a clearly attributed fall in overall fatalities.[46] Most claims of risk compensation offsetting the effects of vehicle regulation and belt use laws have been discredited by research using more refined data.[35]
In the 1990s, Hans Monderman's studies of driver behavior led him to the realization that signs and regulations had an adverse effect on a driver's ability to interact safely with other road users. Monderman developed shared space principles, rooted in the principles of the woonerven of the 1970s. He concluded that the removal of highway clutter, while allowing drivers and other road users to mingle with equal priority, could help drivers recognize environmental clues. They relied on their cognitive skills alone, reducing traffic speeds radically and resulting in lower levels of road casualties and lower levels of congestion.[47]
Some crashes are intended; staged crashes, for example, involve at least one party who hopes to crash a vehicle in order to submit lucrative claims to an insurance company.[48] In the United States during the 1990s, criminals recruited Latin American immigrants to deliberately crash cars, usually by cutting in front of another car and slamming on the brakes. It was an illegal and risky job, and they were typically paid only $100. Jose Luis Lopez Perez, a staged crash driver, died after one such maneuver, leading to an investigation that uncovered the increasing frequency of this type of crash.[49]
Motor vehicle speed
[edit]
The U.S. Department of Transportation's Federal Highway Administration reviewed research on traffic speed in 1998.[50] The summary says that:
- The evidence shows the risk of having a crash is increased both for vehicles traveling slower than the average speed and for those traveling above the average speed.
- The risk of being injured increases exponentially with speeds much faster than the median speed.
- The severity/lethality of a crash depends on the vehicle speed change at impact.
- There is limited evidence suggesting lower speed limits result in lower speeds on a system-wide basis.
- Most crashes related to speed involve speed too fast for the conditions.
- More research is needed to determine the effectiveness of traffic calming.
In the U.S. in 2018, 9,378 people were killed in motor vehicle crashes involving at least one speeding driver, which accounted for 26% of all traffic-related deaths for the year.[51]
In Michigan in 2019, excessive speed was a factor in 18.8% of the fatalities that resulted from fatal motor vehicle crashes and in 15.6% of the suspected serious injuries resulting from crashes.[52]
The Road and Traffic Authority (RTA) of the Australian state of New South Wales (NSW) asserts speeding (traveling too fast for the prevailing conditions or above the posted speed limit[53]) is a factor in about 40 percent of road deaths.[54] The RTA also says speeding increases the risk of a crash and its severity.[54] On another web page, the RTA qualifies its claims by referring to one specific piece of research from 1997, and writes "Research has shown that the risk of a crash causing death or injury increases rapidly, even with small increases above an appropriately set speed limit."[55]
The contributory factor report in the official British road casualty statistics shows for 2006, that "exceeding the speed limit" was a contributory factor in 5% of all casualty crashes (14% of all fatal crashes), and "traveling too fast for conditions" was a contributory factor in 11% of all casualty crashes (18% of all fatal crashes).[56]
In France, in 2018, the speed limit was reduced from 90 km/h to 80 km/h on a large part of the local outside built-up area road network in the sole aim of reducing the number of road fatalities.
Assured clear distance ahead
[edit]A common cause of collisions is driving faster than one can stop within their field of vision.[57] Such practice is illegal[58][59] and is particularly responsible for an increase in fatalities at night – when it occurs most.[60][61]
Driver impairment
[edit]

Driver impairment describes factors that prevent the driver from driving at their normal level of skill. Common impairments include:
- Alcohol
- According to the Government of Canada, coroner reports from 2008 suggested almost 40% of fatally injured drivers consumed some quantity of alcohol before the collision.[64]
- Physical impairment
- Poor eyesight and/or physical impairment, with many jurisdictions setting simple sight tests and/or requiring appropriate vehicle modifications before being allowed to drive.
- Youth
- Insurance statistics demonstrate a notably higher incidence of collisions and fatalities among drivers aged in their teens or early twenties, with insurance rates reflecting this data. These drivers have the highest incidence of both collisions and fatalities among all driver age groups, a fact that was observed well before the advent of mobile phones.
Females in this age group exhibit somewhat lower collision and fatality rates than males but still register well above the median for drivers of all ages.[65] Also within this group, the highest collision incidence rate occurs within the first year of licensed driving. For this reason, many US states have enacted a zero-tolerance policy wherein receiving a moving violation within the first six months to one year of obtaining a license results in automatic license suspension. South Dakota is the only state that allows fourteen-year-olds to obtain drivers' licenses.
- Old age
- Old age, with some jurisdictions requiring driver retesting for reaction speed and eyesight after a certain age.
- Sleep deprivation
Various factors such as fatigue or sleep deprivation might increase the risk, or the number of hours of driving might increase the risk of an incident.[66] 41% of drivers self-report having fallen asleep at the wheel.[67]: 41 It is estimated that 15% of fatal crashes involve drowsiness (10% of daytime crashes, and 24% of nighttime crashes). Work factors can increase the risk of drowsy driving such as long or irregular hours or driving at night.[67]
- Drug use
- Including some prescription drugs, over-the-counter drugs (notably antihistamines, opioids and muscarinic antagonists), and illegal drugs.
- Distraction
- Research suggests that the driver's attention is affected by distracting sounds such as conversations and operating a mobile phone while driving. Many jurisdictions now restrict or outlaw the use of some types of phones in the car. Recent research conducted by British scientists suggests that music can also have an effect; classical music is considered to be calming, yet too much could relax the driver to a condition of distraction. On the other hand, hard rock may encourage the driver to step on the acceleration pedal, thus creating a potentially dangerous situation on the road.[68]
Cell phone use is an increasingly significant problem on the roads and the U.S. National Safety Council compiled more than 30 studies postulating that hands-free is not a safer option because the brain remains distracted by the conversation and cannot focus solely on the task of driving.[69]
Combinations
[edit]Several conditions can combine to create a more dangerous situation, for example, low doses of alcohol and cannabis have a more severe effect on driving performance than either in isolation.[70] Taking recommended doses of several drugs together, which individually do not cause impairment, may cause drowsiness. This could be more pronounced in an elderly person whose renal function is less efficient than a younger person's.[71]
Road design
[edit]
A 1985 US study showed that about 34% of serious crashes had contributing factors related to the roadway or its environment. Most of these crashes also involved a human factor.[34] The road or environmental factor was either noted as making a significant contribution to the circumstances of the crash or did not allow room to recover. In these circumstances, it is frequently the driver who is blamed rather than the road; those reporting the collisions have a tendency to overlook the human factors involved, such as the subtleties of design and maintenance that a driver could fail to observe or inadequately compensate for.[72]
Research has shown that careful design and maintenance, with well-designed intersections, road surfaces, visibility and traffic control devices, can result in significant improvements in collision rates.

Individual roads also have widely differing performance in the event of an impact. In Europe, there are now EuroRAP tests that indicate how "self-explaining" and forgiving a particular road and its roadside would be in the event of a major incident.
In the UK, research has shown that investment in a safe road infrastructure program could yield a 1⁄3 reduction in road deaths, saving as much as £6 billion per year.[73] A consortium of 13 major road safety stakeholders had formed the Campaign for Safe Road Design, which was calling on the UK Government to make safe road design a national transport priority.
Vehicle design and maintenance
[edit]
- Seat belts
Research has shown that, across all collision types, it is less likely that seat belts were worn in collisions involving death or serious injury, rather than light injury; wearing a seat belt reduces the risk of death by about 45 percent.[74] Seat belt use is controversial, with notable critics such as Professor John Adams suggesting that their use may lead to a net increase in road casualties due to a phenomenon known as risk compensation.[75] Observation of driver behaviors before and after seat belt laws does not support the risk compensation hypothesis.
Several driving behaviors were observed on the road before and after the belt use law was enforced in Newfoundland, and in Nova Scotia during the same period without a law. Belt use increased from 16 percent to 77 percent in Newfoundland and remained virtually unchanged in Nova Scotia. Four driver behaviors (speed, stopping at intersections when the control light was amber, turning left in front of oncoming traffic, and gaps in following distance) were measured at various sites before and after the law. Changes in these behaviors in Newfoundland were similar to those in Nova Scotia, except that drivers in Newfoundland drove slower on expressways after the law, contrary to the risk compensation theory.[76]
- Maintenance
A well-designed and well-maintained vehicle, with good brakes, tires and well-adjusted suspension will be more controllable in an emergency and thus be better equipped to avoid collisions. Some mandatory vehicle inspection schemes include tests for some aspects of roadworthiness, such as the UK's MOT test or German TÜV conformance inspection.
The design of vehicles has also evolved to improve protection after collision, both for vehicle occupants and for those outside of the vehicle. Much of this work was led by automotive industry competition and technological innovation, leading to measures such as Saab's safety cage and reinforced roof pillars of 1946, Ford's 1956 Lifeguard safety package, and Saab and Volvo's introduction of standard fit seatbelts in 1959. Other initiatives were accelerated as a reaction to consumer pressure, after publications such as Ralph Nader's 1965 book Unsafe at Any Speed accused motor manufacturers of indifference to safety.
In the early 1970s, British Leyland started an intensive program of vehicle safety research, producing a number of prototype experimental safety vehicles demonstrating various innovations for occupant and pedestrian protection such as airbags, anti-lock brakes, impact-absorbing side-panels, front and rear head restraints, run-flat tires, smooth and deformable front-ends, impact-absorbing bumpers, and retractable headlamps.[77] The design has also been influenced by government legislation, such as the Euro NCAP impact test.
Common features designed to improve safety include thicker pillars, safety glass, interiors with no sharp edges, stronger bodies, other active or passive safety features, and smooth exteriors to reduce the consequences of an impact on pedestrians.
The UK Department for Transport publish road casualty statistics for each type of collision and vehicle through its Road Casualties Great Britain report.[78] These statistics show a ten-to-one ratio of in-vehicle fatalities between types of cars. In most cars, occupants have a 2–8% chance of death in a two-car collision.
- Center of gravity
Some crash types tend to have more serious consequences. Rollovers have become more common in recent years, perhaps due to the increased popularity of taller SUVs, people carriers, and minivans, which have a higher center of gravity than standard passenger cars. Rollovers can be fatal, especially if the occupants are ejected because they were not wearing seat belts (83% of ejections during rollovers were fatal when the driver did not wear a seat belt, compared to 25% when they did).[74] After a first-generation Mercedes-Benz A-Class notoriously failed a 'moose test' (sudden swerving to avoid an obstacle) in 1997, some manufacturers enhanced suspension using stability control linked to an anti-lock braking system to reduce the likelihood of rollover.[79] After retrofitting these systems to its models in 1999–2000, Mercedes saw its models involved in fewer crashes.[80]
Now, about 40% of new US vehicles, mainly the SUVs, vans and pickup trucks that are more susceptible to rollover, are being produced with a lower center of gravity and enhanced suspension with stability control linked to its anti-lock braking system to reduce the risk of rollover and meet US federal requirements that mandate anti-rollover technology by September 2011.[81]
- Motorcycles
Motorcyclists and pillion-riders have little protection other than their clothing and helmets.[82]This difference is reflected in the casualty statistics, where they are more than twice as likely to suffer severely after a collision. In 2005, there were 198,735 road crashes with 271,017 reported casualties on roads in Great Britain. This included 3,201 deaths (1.1%) and 28,954 serious injuries (10.7%) overall. Of these casualties 178,302 (66%) were car users and 24,824 (9%) were motorcyclists, of whom 569 were killed (2.3%) and 5,939 seriously injured (24%).[83]Motorcyclists in urban areas are also more prone to deadly accidents because urban areas are more populous and roads are more crowded with vehicles.[84]
Sociological factors
[edit]Studies in United States have shown that poor people have a greater risk of dying in a car crash than people who are well-off.[85] Car deaths are also higher in poorer states.There is also data that suggests that there is no significant association between injurity severity and socioeconomic status, despite the fact that people with low socioeconomic status are more at risk to be hospitalized for injuries sustained in traffic collisions.[86][87]
Similar studies in France or Israel have shown the same results.[88][89][90] This may be due to working-class people having less access to secure equipment in cars, having older cars which are less protected against crash, and needing to cover more distance to go to work each day.
COVID-19 lockdown impact
[edit]While the advent of the COVID lockdown meant a decrease in road traffic in the United States, the rates of incidents, speeding, and traffic fatalities rose in 2020 and 2021 (rate as measured against vehicle miles traveled).[91] The traffic fatality rate jumped to 1.25 per 100 million vehicle miles traveled, up from 1.06 during the same period in 2019. Reasons cited for the increases are greater speeds, not wearing seatbelts, and driving while impaired.[91]
In their preliminary report covering the first six months of 2021, the US nonprofit public safety advocacy group, the National Safety Council (NSC) estimated of total motor-vehicle deaths for the first six months of 2021 were 21,450, up 16% from 2020 and up 17% from 18,384 in 2019. The estimated mileage death rate in 2021 was 1.43 deaths per 100 million vehicle miles traveled, up 3% from 1.39 in 2020 and up 24% from 1.15 in 2019.[92]
Preliminary data also show that even as traffic levels returned to normal after the onset of COVID in March–April 2020, drivers continued to drive at excessive speeds.[93] A 2020 study conducted by INRIX, private company that analyzes traffic patters, behaviors and congestion, showed that as traffic levels returned to normal during the three-month period August to October 2020, growth in collisions (57%), outpaced the growth in miles traveled (22%) resulting in a higher than normal collision rate during this period.[33]
In France, the Ministry of Interior reported that traffic incidents, crash-related injuries, and fatalities dropped in 2020 compared with 2019. Fatalities dropped 21.4%, injuries dropped 20.9%, and incidents overall dropped 20%.[94] It also reported that the number of vehicles on the road dropped by 75%, which suggests the rate (incidents per vehicle-mile) increased.
Other
[edit]Other possibly hazardous factors that may alter a driver's soundness on the road include:
- Irritability[95]
- Following specifically distinct rules too bureaucratically, inflexibly or rigidly when unique circumstances might suggest otherwise[96]
- Sudden swerving into somebody's blind spot without first clearly making oneself visible through the wing mirror[97]
- Unfamiliarity with one's dashboard features, center console or other interior handling devices after a recent car purchase[98]
- Lack of visibility due to windshield design, dense fog or sun glare[99]
- People-watching.
- Traffic safety culture, a variety of aspects of safety culture could impact on the number of crashes.[100]
Prevention
[edit]Many interventions have been implemented or proposed regarding the prevention of motor vehicle crashes. Other interventions are aimed at pedestrian or cyclist safety, and reducing the severity of injuries or death in collisions that do occur. In the United States, younger drivers (aged 16-20) have a much higher fatality rate than other drivers. Graduated driver's licensing, with restrictions for younger drivers such as limiting the number of passengers in the car, or restrictions on night driving, have shown success with regards to reducing fatal crashes in teenagers.[101][102] Technology that monitors teenage drivers' behavior and provides feedback and recommendations has also been associated with improved safety for teenage drivers.[101]
Law enforcement patrols to enforce road safety laws such as seatbelt use, safe speed and drug or alcohol impaired driving has been associated with reduced road fatalities.[101] Automated traffic enforcement measures, such as speed cameras or sensors, have reduced crashes resulting in injuries by 20-25%.[103]
Accident avoidance technology in cars such as forward collision warning, driver monitoring with alarms for distraction, sleeping, or impairment, lane keep assist, electronic stability control and traction control may also reduce collisions and fatalities, but data is lacking.[101]
Roundabouts reduce motor vehicle fatalities at intersections by reducing the speed of travel through an intersection and changing the vector of travel. Installation of roundabouts has been shown to reduce all crashes by 38% and crashes resulting in serious injury or death by 90%.[104]
Reducing road speed limits, installing physical barriers to separate cyclists and pedestrians from the roadway and motor vehicles, improved lighting and discouraging non-intersection crossing (jaywalking) has been shown to improve safety of pedestrians and cyclists.[101]
Vehicle safety features such as seatbelts, advanced airbags have been shown to reduce serious injuries or fatalities from traffic collisions.[101] Seatbelt non-use is thought to contribute to about 50% of all traffic collision deaths.[101]
Improvements in post-crash medical care such as improved emergency medical service response times, less distance to a trauma center are associated with a lower fatality rate from traffic collisions.[101]
Electronic collision notification systems are sensors in the car or someone's cell phone that can alert emergency services in the event of a major collision using the local cellular network. Improved cell phone network coverage, better integration with emergency services, and removal of subscriptions fees are interventions advocated by some public health experts to make these potentially lifesaving collision notification systems available to all.[101]
United Nations
[edit]Owing to the global and massive scale of the issue, the United Nations and its subsidiary bodies have passed resolutions and held conferences on the issue. The first United Nations General Assembly resolution and debate was in 2003[105] The World Day of Remembrance for Road Traffic Victims was declared in 2005. In 2009 the first high level ministerial conference on road safety was held in Moscow.[citation needed]
The World Health Organization, in its Global Status Report on Road Safety 2009, estimates that over 90% of the world's fatalities on the roads occur in low-income and middle-income countries, which have only 48% of the world's registered vehicles, and predicts road traffic injuries will rise to become the fifth leading cause of death by 2030.[106]
The United Nations' Sustainable Development Goal 3, target 3.6 is directed at reducing road injuries and deaths. February 2020 saw a global ministerial conference which brought the Stockholm Declaration, setting a target to reduce global traffic deaths and injuries by 50% within ten years. The decade of 2021–2030 was declared the second decade of road safety.[citation needed]
Collision migration
[edit]Collisions migration refers to a situation where action to reduce road traffic collisions in one place may result in those collisions resurfacing elsewhere.[107] For example, an accident blackspot may occur at a dangerous bend.[108] The treatment for this may be to increase signage, post an advisory speed limit, apply a high-friction road surface, add crash barriers or any one of a number of other visible interventions. The immediate result may be to reduce collisions at the bend, but the subconscious relaxation on leaving the "dangerous" bend may cause drivers to act with fractionally less care on the rest of the road, resulting in an increase in collisions elsewhere on the road, and no overall improvement over the area. In the same way, increasing familiarity with the treated area will often result in a reduction over time to the previous level of care and may result in faster speeds around the bend due to perceived increased safety (risk compensation).
Epidemiology
[edit]

In 2004, 50 million more were injured in motor vehicle collisions. In 2013, between 1.25 million and 1.4 million people were killed in traffic collisions,[5][112] up from 1.1 million deaths in 1990.[5] That number represents about 2.5% of all deaths.[5] Approximately 50 million additional people were injured in traffic collisions,[112] a number unchanged from 2004.[7][113]
India recorded 105,000 traffic deaths in a year, followed by China with over 96,000 deaths.[114] This makes motor vehicle collisions the leading cause of injury and death among children worldwide 10–19 years old (260,000 children die a year, 10 million are injured)[115] and the sixth leading preventable cause of death in the United States.[116] In 2019, there were 36,096 people killed and 2.74 million people injured in motor vehicle traffic crashes on roadways in the United States.[117] In the state of Texas alone, there were a total of 415,892 traffic collisions, including 3,005 fatal crashes in 2012. In Canada, they are the cause of 48% of severe injuries.[118]
Crash rates
[edit]The safety performance of roadways is almost always reported as a rate. That is, some measure of harm (deaths, injuries, or number of crashes) divided by some measure of exposure to the risk of this harm. Rates are used so the safety performance of different locations can be compared, and to prioritize safety improvements.
Common rates related to road traffic fatalities include the number of deaths per capita, per registered vehicle, per licensed driver, or per vehicle mile or kilometer traveled. Simple counts are almost never used. The annual count of fatalities is a rate, namely, the number of fatalities per year.
There is no one rate that is superior to others in any general sense, it depends on the question asked and the available data. Some agencies concentrate on crashes per total vehicle distance traveled and others combine rates. Iowa, for example, selects high collision locations based on a combination of crashes per million miles traveled, crashes per mile per year, and value loss (crash severity).[119]
.png)
Fatality
[edit]The definition of a road-traffic fatality varies from country to country. In the United States, the definition used in the Fatality Analysis Reporting System (FARS)[121] run by the National Highway Traffic Safety Administration (NHTSA) is a person who dies within 30 days of a crash on a US public road involving a vehicle with an engine, the death being the result of the crash.

In the U.S., therefore, if a driver has a non-fatal heart attack that leads to a road-traffic crash that causes death, that is a road-traffic fatality. If the heart attack causes death prior to the crash, it is not a road-traffic fatality.
The definition of a road-traffic fatality can change with time in the same country. For example, fatality was defined in France as a person who dies in the six days (pre 2005) after the collision and was subsequently changed to the 30 days (post 2005) after the collision.[122]
History
[edit]
The world's first recorded road traffic death involving a motor vehicle occurred on 31 August 1869.[124] Irish scientist Mary Ward died when she fell out of her cousins' steam car and was run over by it.[note 1]
The British road engineer J. J. Leeming, compared the statistics for fatality rates in Great Britain, for transport-related incidents both before and after the introduction of the motor vehicle, for journeys, including those once by water that now are undertaken by motor vehicle:[44] For the period 1863–1870 there were: 470 fatalities per million of population (76 on railways, 143 on roads, 251 on water); for the period 1891–1900 the corresponding figures were: 348 (63, 107, 178); for the period 1931–1938: 403 (22, 311, 70) and for the year 1963: 325 (10, 278, 37).[44] Leeming concluded that the data showed that "travel accidents may even have been more frequent a century ago than they are now, at least for men".[44]


He also compared the circumstances around road deaths as reported in various American states before the widespread introduction of 55 mph (89 km/h) speed limits and drunk-driving laws.[44]
They took into account thirty factors which it was thought might affect the death rate. Among these were included the annual consumption of wine, of spirits and of malt beverages—taken individually—the amount spent on road maintenance, the minimum temperature, certain of the legal measures such as the amount spent on police, the number of police per 100,000 inhabitants, the follow-up programme on dangerous drivers, the quality of driver testing, and so on. The thirty factors were finally reduced to six by eliminating those found to have small or negligible effect. The final six were:
- The percentage of the total state highway mileage that is rural
- The percent increase in motor vehicle registration
- The extent of motor vehicle inspection
- The percentage of state-administered highway that is surfaced
- The average yearly minimum temperature
- The income per capita
These are placed in descending order of importance. These six accounted for 70% of the variations in the rate.
United States judges prioritized pedestrians' rights in city streets when early 20th century automobiles appeared. Pedestrian injuries were regarded as the fault of a motorist driving too fast. As automobile ownership increased, the rate of traffic deaths in the United States doubled from 1915 to 1921 when it reached 12 deaths per 100,000 Americans. The right to walk was considered dispensable a century later in 2021, when the annual death rate was 12.9 per 100,000. Safety focus on protecting the occupants of automobiles has victimized bicyclists and pedestrians whose injuries are attributed to individual carelessness. From 2010 to 2019, fatalities rose 36% for bicyclists and nearly doubled for those on foot. Reasons include larger vehicles, faster driving, and digital distractions making walking and biking in the United States far more dangerous than in other comparable nations.[125]
The world's first autonomous car incident resulting in the death of a pedestrian occurred on 18 March 2018 in Arizona.[126] The pedestrian was walking her bicycle outside of the crosswalk,[127] and died in the hospital after she was struck by a self-driving car being tested by Uber.
Society and culture
[edit]Economic costs
[edit]
The global economic cost of MVCs was estimated at $518 billion per year in 2003, and $100 billion in developing countries.[113] The Centers for Disease Control and Prevention estimated the U.S. cost in 2000 at $230 billion.[128] A 2010 US report estimated costs of $277 billion, which included lost productivity, medical costs, legal and court costs, emergency service costs (EMS), insurance administration costs, congestion costs, property damage, and workplace losses. "The value of societal harm from motor vehicle crashes, which includes both economic impacts and valuation for lost quality-of-life, was $870.8 billion in 2010. Sixty-eight percent of this value represents lost quality-of-life, while 32 percent are economic impacts."[129]
Traffic collision affect the national economy as the cost of road injuries are estimated to account for 1.0% to 2.0% of the gross national product (GNP) of every country each year.[130] A recent study from Nepal showed that the total economic costs of road injuries were approximately $122.88 million, equivalent to 1.52% of the total Nepal GNP for 2017, indicating the growing national financial burden associate with preventable road injuries and deaths.[131]
The economic cost to the individuals involved in an MVC varies widely depending on geographic distribution, and varies largely on depth of accident insurance cover, and legislative policy. In the UK for example, a survey conducted using 500 post-accident insurance policy customers, showed an average individual financial loss of £1300.00.[132] This is due in part to voluntary excesses that are common tactics used to reduce overall premium, and in part due to under valuation of vehicles. By contrast, Australian insurance policy holders are subject to an average financial loss of $950.00 AUD.[133]
Legal consequences
[edit]There are a number of possible legal consequences for causing a traffic collision, including:
- Traffic citations: drivers who are involved in a collision may receive one or more traffic citations for improper driving conduct such as speeding, failure to obey a traffic control device, or driving under the influence of drugs or alcohol.[134] Convictions for traffic violations are usually penalized with fines, and for more severe offenses, the suspension or revocation of driving privileges.[135]
- Civil lawsuits: a driver who causes a traffic collision may be sued for damages resulting from the collision, including damages to property and injuries to other persons. Companies can be held liable if their employees cause motor vehicle crashes under a theory of vicarious liability. Other times, injured people can file a product liability lawsuit against a company that designed or distributed a dangerous vehicle or car part.
- Criminal prosecution: More severe driving misconduct, including impaired driving, may result in criminal charges against the driver. In the event of a fatality, a charge of vehicular homicide is occasionally prosecuted, especially in cases involving alcohol.[136] Convictions for alcohol offenses may result in the revocation or long term suspension of the driver's license, and sometimes jail time, mandatory drug or alcohol rehabilitation, or both.[137]
Fraud
[edit]Sometimes, people may make false insurance claims or commit insurance fraud by staging collisions or jumping in front of moving cars.[138]
United Kingdom
[edit]In the United Kingdom, the Pre-Action Protocol for Low Value Personal Injury Claims in Road Traffic Accidents from 31 July 2013, otherwise known as the RTA Protocol,
describes the behaviour the court expects of the parties prior to the start of proceedings where a claimant claims damages valued at no more than the Protocol upper limit as a result of a personal injury sustained by that person in a road traffic accident.[139]
As of February 2022[update] the "upper limit" is £25,000 for an accident which occurred on or after 31 July 2013; the limit under a previous version of the protocol was £10,000 for an accident which had occurred on or after 30 April 2010 but before 31 July 2013.[139]
United States
[edit]Motor vehicle crashes are the leading cause of death in the workplace in the United States accounting for 35 percent of all workplace fatalities.[140] In the United States, individuals involved in motor vehicle collisions may be held financially liable for the consequences of a collision, including property damage, and injuries to passengers and drivers. Where another driver's vehicle is damaged as the result of a crash, some states allow the owner of the vehicle to recover both the cost of repair for the diminished value of the vehicle from the at-fault driver.[141] Because the financial liability that results from causing a crash is so high, most U.S. states require drivers to carry liability insurance to cover these potential costs. In the event of serious injuries or fatalities, it is possible for injured persons to seek compensation in excess of the at-fault driver's insurance coverage.[142]
Liability rules vary from state to state, with some laws adopting a tort system and others a no-fault insurance system. Most use a tort-based system, wherein injured people seek financial compensation from at-fault parties' insurance carriers. Twelve states take the no-fault approach, where injured parties file their primary claims with their own insurer.
Tort reform has changed the legal landscape. For example, Michigan had a unique no-fault system that guaranteed lifetime benefits for people injured in motor vehicle collisions. This changed in 2020, when the state legislature amended the laws, allowing people to opt for less coverage.[143] While the aim of these laws is to reduce the cost of insurance premiums, catastrophically injured claimants might find themselves underinsured.
In some cases, involving a defect in the design or manufacture of motor vehicles, such as where defective design results in SUV rollovers[144] or sudden unintended acceleration,[145] crashes caused by defective tires,[146] or where injuries are caused or worsened as a result of defective airbags,[147] it is possible that the manufacturer will face a class action lawsuit.
Art
[edit]
Cars have come to represent a part of the American Dream of ownership coupled with the freedom of the road. The violence of a car wreck provides a counterpoint to that promise and is the subject of artwork by a number of artists, such as John Salt and Li Yan. Though English, John Salt was drawn to American landscapes of wrecked vehicles like Desert Wreck (airbrushed oil on linen, 1972).[148] Similarly, Jan Anders Nelson works with the wreck in its resting state in junkyards or forests, or as elements in his paintings and drawings. American Landscape [149] is one example of Nelson's focus on the violence of the wreck with cars and trucks piled into a heap, left to the forces of nature and time. This recurring theme of violence is echoed in the work of Li Yan. His painting Accident Nº 6 looks at the energy released during a crash.[150][151][152]
Andy Warhol used newspaper pictures of car wrecks with dead occupants in a number of his Disaster series of silkscreened canvases.[153] John Chamberlain used components of wrecked cars (such as bumpers and crumpled sheet metal fenders) in his welded sculptures.[154]
Crash is a 1973 novel by English author J. G. Ballard about car-crash sexual fetishism that was made into a film by David Cronenberg in 1996.
See also
[edit]- Accident management
- Assured Clear Distance Ahead
- Black ice
- Crash test
- Crashworthiness
- Defensive driving
- Forensic engineering
- Global road safety for workers
- Hill jumping
- List of countries by traffic-related death rate
- Lists of traffic collisions
- Multiple-vehicle collision
- Powell v Moody, English case law
- Roadkill
- Roadside memorial
- Skid mark
- Solomon curve
- Totaled
- Transportation safety in the United States
- Underride collision
- Unsafe at Any Speed
- Traffic collision reconstruction
- Vehicle extrication
- Warning triangle
- Whiplash
- Work-related road safety in the United States
Notes
[edit]- ^ Although some sources assert Mary Ward to be the first person killed by a motor vehicle, a steam carriage fatal collision in July 1834 preceded Ward's demise. In the 1834 event, a steam carriage constructed by John Scott Russell and operating a public transport service between Glasgow and Paisley overturned, causing a boiler explosion which killed four or five passengers and injured others. Russell's carriage comprised a steam engine pulling a combined passenger and fuel tender; Mary Ward's collision may be characterized as the first fatality involving a vehicle in the form of a contemporary motorcar, in which the engine is mounted and passengers ride on the same frame.
References
[edit]- ^ Peden, Margie; Scurfield, Richard; Sleet, David; et al. (2004). World report on road traffic injury prevention. Geneva: World Health Organization. ISBN 9241562609. Retrieved 9 October 2020.
- ^ Reid, Carlton (17 November 2019). "Crash Not Accident: Better Road-Safety Reporting Could Save Lives, Show Researchers". Forbes. Archived from the original on 13 April 2023. Retrieved 12 April 2023.
- ^ "Media guidelines for reporting road collisions" (PDF). Archived from the original (PDF) on 13 December 2021.
- ^ Vos, Theo (22 August 2015). "Global, regional, and national incidence, prevalence, and years lived with disability for 301 acute and chronic diseases and injuries in 188 countries, 1990–2013: a systematic analysis for the Global Burden of Disease Study 2013". Lancet. 386 (9995): 743–800. doi:10.1016/s0140-6736(15)60692-4. PMC 4561509. PMID 26063472.
- ^ a b c d e Murray, Christopher J L (17 December 2014). "Global, regional, and national age-sex specific all-cause and cause-specific mortality for 240 causes of death, 1990–2013: a systematic analysis for the Global Burden of Disease Study 2013". Lancet. 385 (9963): 117–71. doi:10.1016/S0140-6736(14)61682-2. PMC 4340604. PMID 25530442.
- ^ Global status report on road safety 2013: Supporting a decade of action (in English and Russian). Geneva, Switzerland: WHO. 2013. ISBN 978-92-4-156456-4. Archived from the original (PDF) on 20 March 2013. Retrieved 3 October 2014.
- ^ a b "World report on road traffic injury prevention". WHO. Archived from the original on 6 February 2014.
- ^ "The 2009 Statistical Abstract: Motor Vehicle Accidents and Fatalities". U.S. Census Bureau. Archived from the original on 25 December 2007.
- ^ "Statistics and Data – Road and Motor Vehicle Safety – Road Transportation". Transport Canada. Archived from the original on 19 November 2013.
- ^ Knechel, Nancy (November 2015). "When a Crash Is Really an Accident: A Concept Analysis". Journal of Trauma Nursing. 22 (6): 321–329. doi:10.1097/JTN.0000000000000167. PMC 4654670. PMID 26574946.
- ^ Antolin, Noehealani; Reyes, Ana; Charupoom, Merika; Bacani, Nicole; Batra, Kavita; Tango, Bertile; Kuhls, Deborah (26 January 2024). "Crash vs. Accident: An Important Distinction". Nevada Traffic Research & Education Newsletter. 13 (1).
- ^ "Current Incidents". Traffic Scotland. Archived from the original on 13 January 2022. Retrieved 19 March 2015.
- ^ Richtel, Matt (22 May 2016). "It's No Accident: Advocates Want to Speak of Car 'Crashes' Instead". The New York Times. Archived from the original on 9 August 2018. Retrieved 30 May 2018.
- ^ Badger, Emily (24 August 2015). "When a car 'crash' isn't an 'accident' — and why the difference matters". The Washington Post. Archived from the original on 31 January 2017. Retrieved 30 May 2018.
- ^ "Saving Lives and Protecting People from Injuries and Violence" (PDF). National Center for Injury Prevention and Control. Archived from the original (PDF) on 9 August 2020. Retrieved 8 March 2020.
- ^ Hot Fuzz clip: Accident Implies There's Nobody To Blame, 9 October 2014, archived from the original on 30 October 2021, retrieved 14 June 2021
- ^ "A Crash is Not an Accident". Federal Motor Carrier Safety Administration. Retrieved 12 April 2023.
- ^ a b "Crash Not Accident". Michigan Department of Transportation. Retrieved 12 April 2023.
- ^ "2021 RESOLUTUION: CRASH, NOT ACCIDENT". American Automobile Association. Retrieved 13 April 2023.
- ^ "Why INRIX Now Uses "Crash" (Not "Accident")". INRIX. Retrieved 13 April 2023.
- ^ Laker, Laura (2023). "Road Collision Reporting Guidelines" (PDF).
- ^ "Crashes Are No Accident". Maryland Department of Transportation. Retrieved 12 April 2023.
- ^ "Why we say "crash" not "accident"". Portland Bureau of Transportation. Retrieved 12 April 2023.
- ^ Charles, Geoffrey (11 March 1969). "Cars And Drivers Accident prevention instead of blame". The Times.
Quoting from JJ Leeming in Accidents and their prevention: "Blame for accidents seems to me to be at best irrelevant and at worst actively harmful." ... "Much of the Leeming case is that by attributing blame and instituting proceedings against the motorist, the law virtually guarantees that none of the participants will be wholly truthful, so that the factors that really led to the accident are never discovered."
- ^ Allen, Samantha (15 March 2016). "The Brutal Truth About Car Crash Suicide". The Daily Beast Company LLC. Retrieved 3 December 2017.
- ^ Crosby, Rachel (18 September 2017). "24 face fraud charges in Las Vegas car crash scheme". Las Vegas Review-Journal. Retrieved 3 December 2017.
- ^ "Staged Collisions: Separating Accidents from Fraud" (PDF). Insurance Institute of Ireland. 7 April 2014. Archived from the original (PDF) on 4 December 2017. Retrieved 3 December 2017.
- ^ Palmer, Ken (6 July 2017). "Police: Lansing man deliberately caused crash that injured woman". Lansing State Journal. Retrieved 3 December 2017.
- ^ "The Facts: Vehicular Homicide and the Impaired Driver". United States Department of Transportation. Archived from the original on 28 April 2009. Retrieved 28 May 2023.
- ^ "Transportation Safety". CDC. Retrieved 26 February 2023.
- ^ Academy staff (September 2004). "The Shocking Truth about Road Trauma – Key text". NOVA – Science in the News. Austrian Academy of Science. Archived from the original on 6 January 2013. Retrieved 20 November 2014.
- ^ Butler, Dennis J.; Moffic, H. Steven; Turkal, Nick W. (1 August 1999). "Post-traumatic Stress Reactions Following Motor Vehicle Accidents". American Family Physician. 60 (2): 524–530. PMID 10465227. Retrieved 7 May 2018.
- ^ a b Pishue, Bob (2020). "COVID-19 Effect on Collisions on Interstates and Highways in the US". nationalacadamies.org. INRIX Research. Retrieved 10 January 2022.
- ^ a b c Harry Lum; Jerry A. Reagan (Winter 1995). "Interactive Highway Safety Design Model: Accident Predictive Module". Public Roads Magazine. Archived from the original on 17 October 2021.
- ^ a b Robertson, LS. Injury Epidemiology: Fourth Edition. Free online at www.nanlee.net.
- ^ "Traffic Safety Facts 2019". NHTSA. National Highway Traffic Safety Administration. August 2021. p. 123. Retrieved 20 November 2021.
- ^ "New data from Virginia Tech Transportation Institute provides insight into cell phone use and driving distraction". www.vtnews.vt.edu. Archived from the original on 25 February 2021. Retrieved 11 March 2021.
- ^ St. Fleur, Nicholas (24 February 2016). "Reading This While You Drive Could Increase Your Risk of Crashing Tenfold". New York Times. Retrieved 29 February 2016.
- ^ "I'm a good driver: you're not!". Drivers.com. 11 February 2000.
- ^ a b c The Good, the Bad and the Talented: Young Drivers' Perspectives on Good Driving and Learning to Drive (PDF) (Road Safety Research Report No. 74 ed.). Transport Research Laboratory. January 2007. Archived from the original (PDF) on 16 February 2008. Retrieved 4 January 2008.
- ^ "Home". Galway Independent. Archived from the original on 10 May 2009. Retrieved 15 January 2012.
- ^ Thew, Rosemary (2006). "Royal Society for the Prevention of Accidents Conference Proceedings" (PDF). Driving Standards Agency. Archived from the original (PDF) on 16 February 2008.
Most at risk are young males between 17 and 25 years
- ^ "forecasting older driver's accident rates". Department for Transport. Archived from the original on 6 February 2007.
- ^ a b c d e Leeming, J.J. (1969). Road Accidents: Prevent or Punish?. Cassell. ISBN 978-0-304-93213-9.
- ^ Sagberg; Fosser; Saetermo (1997). An investigation of behavioral adaptation to airbags and antilock brakes among taxi drivers (29 ed.). Accident Analysis and Prevention. pp. 293–302.
- ^ Adams, John (1982). "The efficacy of seat belt legislation" (PDF). SAE Transactions. Archived from the original (PDF) on 23 June 2006. Retrieved 3 January 2008.
- ^ Ben Hamilton-Baillie (Autumn 2005). "Streets ahead" (PDF). Countryside Voice. Archived from the original (PDF) on 13 April 2008. Retrieved 10 March 2008.
- ^ Lascher, Edward L. and Michael R. Powers. The economics and politics of choice no-fault insurance. Springer, 2001
- ^ Dornstein, Ken. Accidentally, on Purpose: The Making of a Personal Injury Underworld in America. Palgrave Macmillan, 1998, p.3
- ^ "Synthesis of Safety Research Related to Speed and Speed Limits" (PDF). U.S. Department of Transportation. Archived from the original (PDF) on 28 May 2010. Retrieved 5 March 2008.
- ^ NHTSA (April 2020). "Traffic Safety Facts – Speeding". NHTSA (National Highway Traffic Safety Administration). Retrieved 28 April 2021.
- ^ Michigan Traffic Crash Facts (2019). "Fact Sheets – Speeding" (PDF). Michigan Traffic Crash Facts. Retrieved 28 April 2021.
- ^ "Problem definition and countermeasures". NSW Roads and Traffic Authority. Archived from the original on 21 November 2002. Retrieved 20 May 2008.
- ^ a b "The biggest killer on our roads". NSW Roads and Traffic Authority. Archived from the original on 21 November 2002. Retrieved 5 March 2008.
- ^ "Speeding research". NSW Roads and Traffic Authority. Archived from the original on 21 November 2002. Retrieved 5 March 2008.
- ^ "Road Casualties Great Britain: 2006" (PDF). UK Department for Transport. Archived from the original (PDF) on 13 April 2008. Retrieved 5 March 2008.
- ^ Leibowitz, Herschel W.; Owens, D. Alfred; Tyrrell, Richard A. (1998). "The assured clear distance ahead rule: implications for nighttime traffic safety and the law". Accident Analysis & Prevention. 30 (1): 93–99. doi:10.1016/S0001-4575(97)00067-5. PMID 9542549.
- ^ "Assured Clear Distance Ahead Law & Legal Definition". US Legal, Inc. Retrieved 27 August 2013.
ACDA or "assured clear distance ahead" requires a driver to keep his motor vehicle under control so that he can stop in the distance in which he can clearly see.
- ^ Lawyers Cooperative Publishing. New York Jurisprudence. Automobiles and Other Vehicles. Miamisburg, OH: LEXIS Publishing. p. § 720. OCLC 321177421.
It is negligence as a matter of law to drive a motor vehicle at such a rate of speed that it cannot be stopped in time to avoid an obstruction discernible within the driver's length of vision ahead of him. This rule is known generally as the 'assured clear distance ahead' rule * * * In application, the rule constantly changes as the motorist proceeds, and is measured at any moment by the distance between the motorist's vehicle and the limit of his vision ahead, or by the distance between the vehicle and any intermediate discernible static or forward-moving object in the street or highway ahead constituting an obstruction in his path. Such rule requires a motorist in the exercise of due care at all times to see, or to know from having seen, that the road is clear or apparently clear and safe for travel, a sufficient distance ahead to make it apparently safe to advance at the speed employed.
- ^ Varghese, Cherian; Shankar, Umesh (May 2007). "Passenger Vehicle Occupant Fatalities by Day and Night – A Contrast". Washington, DC: National Highway Traffic Safety Administration. National Center for Statistics and Analysis.
The passenger vehicle occupant fatality rate at nighttime is about three times higher than the daytime rate. ... The data shows a higher percentage of passenger vehicle occupants killed in speeding-related crashes at nighttime.
- ^ McKernan, Megan (13 May 2015). "AAA Tests Shine High-Beam on Headlight Limitations". NewsRoom.AAA.com. AAA Automotive Research Center. Retrieved 3 July 2018.
AAA's test results suggest that halogen headlights, found in over 80 percent of vehicles on the road today, may fail to safely illuminate unlit roadways at speeds as low as 40 mph. ... high-beam settings on halogen headlights ... may only provide enough light to safely stop at speeds of up to 48 mph, leaving drivers vulnerable at highway speeds ... Additional testing found that while the advanced headlight technology found in HID and LED headlights illuminated dark roadways 25 percent further than their halogen counter parts, they still may fail to fully illuminate roadways at speeds greater than 45 mph. High-beam settings on these advanced headlights offered significant improvement over low-beam settings, lighting distances of up to 500 feet (equal to 55 mph). Despite the increase, even the most advanced headlights fall 60 percent short of the sight distances that the full light of day provides.
- ^ "www.infrastructure.gov.au" (PDF). Archived from the original (PDF) on 26 August 2021. Retrieved 25 October 2009.
- ^ "Regulatory Impact and Small Business Analysis for Hours of Service Options". Federal Motor Carrier Safety Administration. Archived from the original on 19 June 2013. Retrieved 22 February 2008.
- ^ "Road Safety in Canada" (PDF). Transport Canada. p. 17.
- ^ Kelley-Baker, Tara; Romano, Eduardo (November 2011). "Female involvement in U.S. nonfatal crashes under a three-level hierarchical crash model". Accident Analysis and Prevention. 42 (6): 2007–2012. doi:10.1016/j.aap.2010.06.010. ISSN 1879-2057. PMC 3286870. PMID 20728655.
- ^ Kaywood, A (1982). Drive Right for Safety and Savings. Scott, Foresman. p. 248. ISBN 9780673100863.
- ^ a b Higgins, J. Stephen; Michael, Jeff; Austin, Rory; Åkerstedt, Torbjörn; Van Dongen, Hans P. A.; Watson, Nathaniel; Czeisler, Charles; Pack, Allan I.; Rosekind, Mark R. (25 January 2017). "Asleep at the Wheel—The Road to Addressing Drowsy Driving". Sleep. 40 (2). doi:10.1093/sleep/zsx001. ISSN 0161-8105. PMID 28364516.
- ^ "Hard-Rock and Classic Music Could Lead to Road Accidents, New Survey Says". Infoniac.com. Retrieved 13 November 2011.
- ^ "Understanding the Distracted Brain, Why Driving While Using Hands-Free Cell Phones is Risky Behavior" (PDF). National Safety Council. 2012.
- ^ Road Safety Part 1: Alcohol, drugs, ageing & fatigue (Research summary, TRL Report 543 ed.). UK Department for Transport. Spring 2003. Archived from the original on 29 January 2007. Retrieved 1 January 2008.
- ^ Road Safety Part 1: Alcohol, drugs, ageing & fatigue (Research summary, Transport Research Laboratory Road Safety Report No. 24 ed.). UK Department for Transport. Spring 2003. Archived from the original on 2 February 2010. Retrieved 1 January 2008.
- ^ Ray Fuller; Jorge A. Santos (2002). Human Factors for Highway Engineers. Emerald. p. 15. ISBN 978-0080434124.
- ^ Hill, Joanne. "Getting Ahead: Returning Britain to European leadership in road casualty reduction" (PDF). Campaign for Safe Road Design. Archived from the original (PDF) on 22 September 2013. Retrieved 1 October 2008.
- ^ a b Broughton, J.; Walter, L. (February 2007). Trends in Fatal Car Accidents: Analysis of CCIS Data. Project Report PPR 172. Transport Research Laboratory.
- ^ David Bjerklie (30 November 2006). "The Hidden Danger of Seat Belts". Time Inc. ISSN 0040-781X. Archived from the original on 10 December 2006. Retrieved 26 February 2008.
- ^ Lund, Adrian K.; Zador, Paul (March 1984). "Mandatory belt use and driver risk taking". Risk Analysis. 4 (1): 41–53. Bibcode:1984RiskA...4...41L. doi:10.1111/j.1539-6924.1984.tb00130.x.
- ^ "Safety First: the SSV/SRV cars". AROnline. Keith Adams. Archived from the original on 8 October 2007.
- ^ "Annual transport accidents and casualties". UK Department for Transport. Archived from the original on 16 December 2007. Retrieved 1 January 2008.
- ^ "The charming story of electronic stability control". vehicledynamicsinternational.com. 19 December 2023. Retrieved 4 September 2025.
- ^ "Fahrunfalle: Dank ESP verunglucken Mercedes-Personenwagen seltener (in German)". Mercedes-Benz. Archived from the original (Graph of accident share) on 16 February 2008. Retrieved 28 December 2007.
Road accidents are rare with ESP Mercedes passenger cars
- ^ Thomas, Ken (15 September 2006). "U.S. to Require Anti-Rollover Technology on New Cars by 2012". Insurance Journal. Archived from the original on 26 December 2007. Retrieved 28 December 2007.
- ^ Vasan, S.S.; Gururaj, G. (22 October 2021). "Unhelmeted two-wheeler riders in India". The National Medical Journal of India. 34 (3): 171–172. doi:10.25259/NMJI_455_18. PMID 34825550. S2CID 240491852.
- ^ Road Casualties in Great Britain, Main Results (Transport Statistics Bulletin ed.). Office for National Statistics. 2005. Archived from the original on 17 July 2007. Retrieved 1 January 2008.
- ^ Hashim, Istabrak Naseer; Obaid, Ihsan Ali (27 August 2024). "Identify Factors that Contribute to the Severity of Motorcycle Crash: A Scientometric Analysis". Journal of University of Babylon for Engineering Sciences. 32 (4): 159–171. doi:10.29196/4fvv8w61 (inactive 26 September 2025). ISSN 2616-9916.
{{cite journal}}: CS1 maint: DOI inactive as of September 2025 (link) - ^ "The hidden inequality of who dies in car crashes". The Washington Post. 1 October 2015. Retrieved 24 January 2018.
But that progress obscures a surprising type of inequality: The most disadvantaged are more likely — and have grown even more likely over time — to die in car crashes than people who are well-off
- ^ Chen, H. Y.; Ivers, R. Q.; Martiniuk, A. L. C.; Boufous, S.; Senserrick, T.; Woodward, M.; Stevenson, M.; Norton, R. (1 November 2010). "Socioeconomic status and risk of car crash injury, independent of place of residence and driving exposure: results from the DRIVE Study". Journal of Epidemiology & Community Health. 64 (11): 998–1003. doi:10.1136/jech.2009.091496. ISSN 0143-005X. PMID 19822556.
- ^ "The Geography of Car Deaths in America". Bloomberg.com. CityLab. 15 October 2015. Retrieved 24 January 2018.
Car deaths are also higher in poorer states. The road death rate is negatively associated with GDP per capita (-.47) and even more so with per capita income (-.66).
- ^ Grossetete, Mathieu (August 2016). "Des accidents de la route pas si accidentels" (in French). Le Monde diplomatique. Retrieved 24 January 2018.
Alors qu'ils ne représentent que 13,8 % de la population française âgée de 15 ans et plus, les ouvriers comptaient pour 22,1 % des 3 239 personnes décédées sur la route en 2007 et pour 19 % des blessés hospitalisés. À l'inverse, les cadres supérieurs, professions libérales et chefs d'entreprise (8,4 % de la population) ne totalisaient que 2,9 % des morts et blessés
- ^ Grossetete, Mathieu (2010). L'enracinement social de la mortalité routière (in French). Actes de la recherche en sciences sociales. ISBN 9782021030297. Retrieved 10 February 2018.
- ^ Yair G, Mahalel D. (30 September 2010). "Who by accident? The social morphology of car accidents". Risk Anal. 30 (9): 1411–23. Bibcode:2010RiskA..30.1411F. doi:10.1111/j.1539-6924.2010.01423.x. PMID 20840490. S2CID 43096927.
For example, we find that drivers from low socioeconomic backgrounds are overinvolved in severe accidents with fatal outcomes
- ^ a b Calvert, Scott (1 October 2020). "Rate of Crash Deaths on U.S. Roads Rose During Coronavirus Pandemic". Dow Jones & Company. Retrieved 5 January 2022.
In first half of 2020, traffic volumes fell but speeding and other risky behaviors were up
- ^ "Preliminary Semiannual Estimates". NSC.org. National Safety Council. July 2021. Retrieved 5 January 2022.
- ^ Craven McGinty, Jo (8 January 2021). "Car-Crash Death Rate Surged in 2020". Dow Jones Inc. Retrieved 10 January 2022.
- ^ "Chiffres de sécurité routière en 2020". interieur.gouv.fr. French Ministry of Interior. 29 January 2021. Retrieved 5 January 2022.
- ^ Mindell, Jodi (2010). A Clinical Guide to Pediatric Sleep. p. 259.
- ^ Bryan, Carson (2008). William Divot Mulligan. Xulon Press. p. 127. ISBN 9781606474723.
- ^ Visagie, Brian (2014). The K53 Yard Test Made Easy: A Practical Guide for Learner Drivers. p. 48.
- ^ Katz, Diane (1979). Integrated Safe Driving Information System Development: Final report. p. 27.
- ^ Popular Mechanics – Mar 1959 – Page 94, Vol. 111, No. 3
- ^ Varmazyar, S., Mortazavi, S. B., Arghami, S., & Hajizadeh, E. (2016). Relationship between organisational safety culture dimensions and crashes. International journal of injury control and safety promotion, 23(1), 72–78.
- ^ a b c d e f g h i Klauer, Sheila G.; Doerzaph, Zachary R. (31 July 2025). "Motor Vehicle Crash Prevention". New England Journal of Medicine. 393 (5): 479–486. doi:10.1056/NEJMra2216360. PMID 40742261.
- ^ Williams, Allan F. (December 2017). "Graduated driver licensing (GDL) in the United States in 2016: A literature review and commentary". Journal of Safety Research. 63: 29–41. doi:10.1016/j.jsr.2017.08.010. PMID 29203021.
- ^ Thomas, Libby J.; Srinivasan, Raghavan; Decina, Lawrence E.; Staplin, Loren (January 2008). "Safety Effects of Automated Speed Enforcement Programs: Critical Review of International Literature". Transportation Research Record: Journal of the Transportation Research Board. 2078 (1): 117–126. doi:10.3141/2078-16.
- ^ Retting, Richard (1 April 2001). "Crash and injury reduction following installation of roundabouts in the United States". American Journal of Public Health. 91 (4): 628–631. doi:10.2105/ajph.91.4.628. PMC 1446639. PMID 11291378.
- ^ United Nations General Assembly Session 57 Verbatim Report 86. Global road safety crisis. page 2. 22 May 2003. Retrieved accessdate.
- ^ "Road Traffic Deaths Index 2009 Country Rankings". Retrieved 2 February 2010.
- ^ Jiao, Chengwu; Yang, Manjuan; Hao, Yubo (2009). "Analysis of Characters and Causes of Road Traffic Accident Migration". Icctp 2009. Ninth International Conference of Chinese Transportation Professionals (ICCTP). pp. 1–7. doi:10.1061/41064(358)94. ISBN 9780784410646.
- ^ "Accident 'migration' after remedial treatment at accident blackspots". trafficresearch.co.uk. 12 August 2020. Archived from the original on 9 May 2021. Retrieved 12 May 2016.
- ^ "OECD Data / Road Accidents". data.OECD.org. Organisation for Economic Co-operation and Development (OECD). 15 December 2023. Archived from the original on 6 July 2023.
- ^ Leonhardt, David (11 December 2023). "The Rise in U.S. Traffic Deaths / What's behind America's unique problem with vehicle crashes?". The New York Times. Archived from the original on 14 December 2023.
- ^ "Death rate from road accidents". Our World in Data. Retrieved 5 March 2020.
- ^ a b World health statistics 2018: monitoring health for the SDGs, sustainable development goals (PDF). World Health Organization. 2018. ISBN 9789241565585.
- ^ a b "World report on road traffic injury prevention" (PDF). World Health Organization.
- ^ ´"Nearly 300 Indians die daily on roads, shows report". Business Standard. 17 August 2009.
- ^ "UN raises child accidents alarm". BBC News. 10 December 2008. Retrieved 25 May 2010.
- ^ Mokdad AH, Marks JS, Stroup DF, Gerberding JL (March 2004). "Actual causes of death in the United States, 2000" (PDF). JAMA. 291 (10): 1238–45. doi:10.1001/jama.291.10.1238. PMID 15010446.
- ^ NHTSA (December 2020). "Overview of Motor Vehicle Crashes in 2019". National Highway Traffic Safety Administration. Retrieved 11 March 2021.
- ^ "Motor Vehicle Collisions Most Frequent Cause of Severe Injuries". Archived from the original on 26 November 2006.
- ^ Hallmark, Shauna (June 2002). "Evaluation of the Iowa DOT's Safety Improvement Candidate List Process" (PDF) (Final Report). Center for Transportation Research and Education, Iowa State university. Archived from the original (PDF) on 24 September 2015. Retrieved 20 November 2014.
- ^ "Fatality Facts 2022: State by state". IIHS-HLDI crash testing and highway safety. Retrieved 28 February 2025.
- ^ "FARS". Fars.nhtsa.dot.gov. Retrieved 13 November 2011.
- ^ International Road Assistance Programme – International Transport Statistics Database
- ^ The first known account of this crash dates to 1801."Le fardier de Cugnot". Archived from the original on 26 February 2011.
- ^ "Mary Ward 1827–1869". King's County Chronicle. Offaly Historical & Archaeological Society. 2 September 2007. Archived from the original on 1 February 2010. Retrieved 20 November 2014.
- ^ Norton, Peter (10 June 2022). "When Cities Made Monuments to Traffic Deaths". Bloomberg.com. Bloomberg News. Retrieved 12 June 2022.
- ^ "Self-Driving Uber Car Kills Pedestrian in Arizona, Where Robots Roam". The New York Times. 19 March 2018. Retrieved 19 March 2018.
- ^ "Self-driving Uber kills Arizona woman in first fatal crash involving pedestrian". The Guardian. 19 March 2018. Retrieved 19 March 2018.
- ^ "CDC – Motor Vehicle Safety". Centers for Disease Control and Prevention. 24 June 2021.
- ^ "The Economic and Societal Impact of Motor Vehicle Crashes, 2010", by Lawrence Blincoe, Ted R. Miller, Ph.D., Eduard Zaloshnja, Ph.D., Bruce A. Lawrence, Ph.D., DOT HS 812 013, Washington, D.C.: May 2014.
- ^ Margie, Peden (2004). World report on road traffic injury prevention. Geneva: World Health Organization. ISBN 9241562609.
- ^ Banstola, Amrit; Kigozi, Jesse; Barton, Pelham; Mytton, Julie (25 June 2020). "Economic Burden of Road Traffic Injuries in Nepal". International Journal of Environmental Research and Public Health. 17 (12): 4571. doi:10.3390/ijerph17124571. PMC 7345187. PMID 32630384.
- ^ Robottom, Adam (26 July 2021). "UK Car Insurance Company Statistical Value". CarCrashProfit. Archived from the original on 28 January 2022. Retrieved 19 September 2021.
- ^ Wanworth, Mark. "Quarterly General Insurance Statistics". (APRA) Australia Prudential Regulatory Authority. Retrieved 15 September 2021.
- ^ Cooper, Peter J. (Summer 1997). "The relationship between speeding behaviour (as measured by violation convictions) and crash involvement". Journal of Safety Research. 28 (2): 83–95. doi:10.1016/S0022-4375(96)00040-0.
- ^ Shapiro, Joseph (29 December 2014). "Can't Pay Your Fines? Your License Could Be Taken". NPR. All Things Considered. Retrieved 31 October 2017.
- ^ Roper, Eric (22 May 2016). "In crashes that kill pedestrians, the majority of drivers don't face charges". Star Tribune. Retrieved 31 October 2017.
- ^ Nichols, James L.; Ross, H. Laurence (1991). "The Effectiveness of Legal Sanctions in Dealing with Drinking Drivers" (PDF). Journal of Safety Research. 22 (2): 93. Archived from the original (PDF) on 2 January 2015.
- ^ Galperina, Marina (13 June 2012). "Why Russians Are Obsessed With Dash-Cams". Jalopnik. Retrieved 19 November 2012.
- ^ a b Ministry of Justice (2013), Pre-Action Protocol for Low Value Personal Injury Claims in Road Traffic Accidents from 31 July 2013, updated 10 February 2022, accessed 2 June 2022
- ^ Peden, Margie; Scurfield, Richard; Sleet, David; Mohan, Dinesh; Hyder, Adnan A.; Jarawan, Eva; Mathers, Colin (2004). World report on road traffic injury prevention. Geneva: World Health Organization. p. 44. ISBN 92-4-156260-9.
- ^ "What is diminished value?". Insurance Information Institute. Retrieved 31 October 2017.
- ^ Gusner, Penny (23 February 2012). "Do I have to pay if my liability limits are exceeded?". Nasdaq. Retrieved 31 October 2017.
- ^ "Brief Explanation of Michigan's No-Fault Insurance" (PDF). Michigan.gov. Retrieved 31 July 2024.
- ^ "Ford Settles Explorer Rollover Suit". CBS News. 28 November 2007. Retrieved 31 October 2017.
- ^ Barash, Martina (12 October 2017). "Tesla's Access to Car Data: A New Tool in Disputes". Bloomberg BNA. Retrieved 31 October 2017.
- ^ "Consumers Claim Tires Are Defective, File Class-Action Suit Against Goodyear". Wall Street Journal. 24 November 2000. Retrieved 31 October 2017.
- ^ Wattles, Jackie (21 May 2017). "Have an exploding airbag? You might get $500". CNN Money. Retrieved 31 October 2017.
- ^ "Desert Wreck". es.pinterest.com. Retrieved 13 February 2016.
- ^ "American Landscape". www.janandersnelsonart.com. Retrieved 13 February 2016.
- ^ "Accident Nº 6 detail". www.saatchigallery.com. Archived from the original on 16 February 2016. Retrieved 13 February 2016.
- ^ "Accident Nº 6 detail". www.saatchigallery.com. Archived from the original on 16 February 2016. Retrieved 13 February 2016.
- ^ "Wreckage in Art: A Driving Force in the Work of Jan Anders Nelson". medium.com. 23 May 2016. Retrieved 23 May 2016.
- ^ "Andy Warhol Death And Disaster". YouTube. 20 November 2008. Archived from the original on 30 October 2021. Retrieved 14 February 2016.
- ^ Kennedy, Randy (21 December 2011). "John Chamberlain, Who Wrested Rough Magic From Scrap Metal, Dies at 84". The New York Times. Retrieved 14 February 2016.
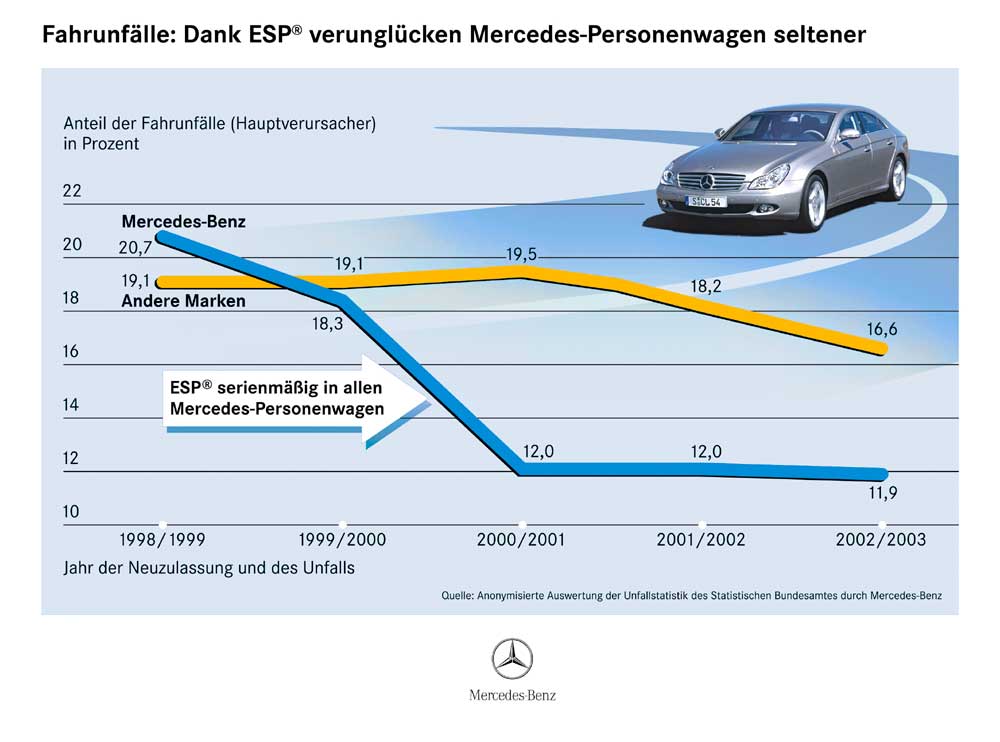
External links
[edit]- WHO road traffic injuries
- NHTSA Accident Statistics
- U.S. DOT Fatality Analysis Reporting System FARS
| Main topics |  | |
|---|---|---|
| Road collisions | ||
| Causes | ||
| Lists of traffic collisions | ||
| Related lists | ||
| International | |
|---|---|
| National | |
| Other | |
Traffic collision
View on GrokipediaTerminology and Classification
Definition and Scope
A traffic collision is an unintended event involving the impact of a motor vehicle in transport with another vehicle, a pedestrian, a cyclist, an animal, road debris, or a fixed object such as a guardrail or tree, occurring on a public roadway and resulting in property damage, injury, or fatality.[11] This definition, adopted in engineering and safety standards, focuses on the physical dynamics of the contact and its harmful outcomes, excluding non-impact events like rollovers without collision or mechanical breakdowns absent external force.[12] Traffic safety analyses distinguish collisions from "accidents," as the latter term erroneously suggests randomness or unavoidability, whereas data from crash investigations reveal most such events stem from identifiable causal chains, primarily human actions, rendering them preventable through intervention.[11] The scope encompasses incidents on trafficways—defined as portions of roadways open to public travel, including highways, streets, and alleys—but excludes off-road occurrences, private property crashes without public road involvement, or deliberate acts like vehicular homicide.[13] Collisions may involve single vehicles striking stationary objects or multi-party interactions, such as chain-reaction pileups, and are reportable under standards requiring at least one motorized vehicle and either injury, death, or damage surpassing jurisdictional thresholds (e.g., $1,000 in many U.S. states).[14] Globally, organizations like the World Health Organization classify road traffic crashes within this framework, prioritizing those with verifiable injury or mortality for epidemiological tracking, though minor unreported fender-benders fall outside formal scopes despite contributing to overall risk assessment.[15] In investigative contexts, the scope extends to sequence-of-events analysis, capturing pre-impact maneuvers (e.g., swerving) and post-impact effects, but causal attribution requires evidence beyond mere contact, such as vehicle dynamics reconstruction or witness data.[16] This precision aids in differentiating collisions from non-collision harms like single-vehicle overturns due to speed alone, ensuring resources target modifiable factors over fatalistic interpretations.[11]Types and Severity Levels
Traffic collisions, also known as motor vehicle crashes, are classified primarily by the manner of collision, which describes the initial harmful event producing injury or property damage, as standardized in the American National Standards Institute (ANSI) D.16 Manual on Classification of Motor Vehicle Traffic Crashes.[11] These include non-collision events (such as vehicle overturn or fire) and collision types differentiated by impact direction and objects involved, such as vehicle-to-vehicle, vehicle-to-pedestrian, or vehicle-to-fixed object.[11] Single-vehicle crashes account for a significant portion of incidents, often involving fixed objects like trees or barriers, while multi-vehicle crashes encompass chain reactions.[17] Key collision types by impact configuration include:- Rear-end collisions: Occur when one vehicle strikes the back of another, frequently in stop-and-go traffic; these represent a common urban crash type but have lower fatality rates compared to angular impacts.[18]
- Head-on collisions: Involve frontal impacts between opposing vehicles, often resulting from lane departures or wrong-way driving; these are among the most lethal due to high closure speeds.[19]
- Side-impact or angular collisions (e.g., T-bone): Feature perpendicular strikes, typically at intersections without adequate protection, and are associated with the highest fatality risk per crash due to side structure vulnerabilities.[20]
- Sideswipe collisions: Involve glancing tangential contacts, often during lane changes or merging, leading primarily to property damage rather than severe injuries.[21]
- Rollover collisions: Encompass vehicle overturns, either single-vehicle or post-impact, with elevated risks for SUVs and trucks due to higher centers of gravity; non-collision overturns alone contribute to about 3% of fatal crashes.[17]
- Pedestrian and cyclist involvements: Classified separately when vehicles strike vulnerable road users, with outcomes heavily influenced by impact speed and user exposure.[17]
Primary Causes
Human Error and Behavioral Factors
Human error constitutes the predominant cause of traffic collisions, accounting for 94% to 96% of incidents in the United States according to analyses of crash data.[27] Globally, behavioral factors linked to driver actions similarly dominate, with estimates indicating human error involvement in up to 95% of cases across various jurisdictions.[28] These errors stem from failures in perception, decision-making, and execution, often exacerbated by cognitive biases or momentary lapses rather than inherent unpredictability.[29] From first principles, human errors dominate because drivers serve as the controllers in the driving loop, subject to inherent biological limits such as reaction times of approximately 0.2–1 second, which are affected by age, fatigue, and impairment; psychological factors including distraction (e.g., phone use), overconfidence leading to speeding, and risk misjudgment; and variability from slowed reactions under impairment, drowsiness (equivalent to a blood alcohol concentration of 0.05–0.08), and emotions like road rage. Statistics show that a significant majority of traffic collisions occur close to the driver's home, with commonly cited figures of approximately 52% within 5 miles from analyses referencing NHTSA data, and 77% of traffic injuries within 10 miles based on trauma registry studies; this pattern is attributed to driver complacency due to familiarity with local routes, contributing to lapses such as inattention or excessive speed.[30] In contrast, vehicles are reliable more than 98% of the time, and roads are predictable on most days.[31][7][32] Speeding ranks among the leading behavioral contributors, implicated in 29% of all fatal crashes in 2023, resulting in 11,775 deaths in the United States.[33] Excessive speed reduces reaction time and increases crash severity, with risks escalating nonlinearly; for instance, injury risk rises from 15% at 40 mph to 78% at 55 mph in certain scenarios.[34] Internationally, speeding contributes to 5% to 80% of fatalities depending on the country, underscoring its causal role in kinetic energy amplification during impacts.[35] Distracted driving, encompassing activities like cellphone use or inattention, led to 3,275 fatalities in 2023, representing 8% of deadly crashes.[36] This behavior divides attention from the road, with drivers aged 25-34 overrepresented at 24% of distracted-involved fatal incidents.[37] Cognitive distractions, such as mind wandering, contribute comparably to manual ones, impairing hazard detection.[38] Impaired driving from alcohol or drugs accounts for substantial morbidity, with 12,429 alcohol-related deaths in 2023—about 30% of total traffic fatalities.[39] [40] Drug impairment, including cannabinoids detected in 25% of tested fatally injured drivers, compounds risks, often co-occurring with alcohol in 55.8% of positive cases among seriously injured road users.[41] Impairment degrades judgment and coordination, akin to fatigue effects.[42] Drowsy driving elevates crash odds by 1.29 to 1.34 times, with risks doubling after fewer than five hours of sleep.[43] [44] It underlies 8.8% to 9.5% of all crashes and up to 10.8% of severe ones, based on naturalistic studies measuring eyelid closure, though underreporting persists due to evidential challenges.[45] Night-shift workers face heightened near-crash events from accumulated sleep debt.[46] Additional factors include aggressive maneuvers like tailgating or improper lane changes, which amplify collision probabilities through reduced safety margins, though precise attribution varies by dataset.[47] These behaviors collectively highlight volitional choices over deterministic externalities, with empirical countermeasures targeting enforcement and awareness yielding measurable reductions.[48]Vehicle and Mechanical Failures
Vehicle and mechanical failures account for approximately 2% of critical reasons in traffic collisions analyzed in the National Motor Vehicle Crash Causation Survey conducted by the National Highway Traffic Safety Administration (NHTSA) from 2004 to 2007, though some estimates from federal data suggest involvement in up to 12% of crashes when including contributory factors.[7][49] These failures often stem from manufacturing defects, inadequate maintenance, or component degradation over time, and their impact is amplified in high-speed or heavy-vehicle scenarios where sudden loss of control leads to severe outcomes.[50] Among specific defects, brake failures represent a leading cause, comprising 42% of mechanical issues in a 2024 analysis of U.S. crash data involving defective vehicles, often resulting from worn pads, fluid leaks, or hydraulic system malfunctions that prevent deceleration.[50] Tire-related problems, including blowouts and tread separation, follow closely at 22-43% of such incidents, exacerbated by underinflation, age-related cracking, or improper loading, which can cause vehicle instability and swerving.[50][51] Steering and suspension failures, accounting for smaller shares but critical in directional control loss, arise from issues like faulty linkages or worn bushings, while engine stalls or accelerator malfunctions contribute through sudden power loss.[52][53] Commercial vehicles, such as trucks, exhibit higher rates of mechanical causation due to heavier loads and extended operation; NHTSA data indicates that defects like faulty brakes or tires in these fleets correlate with disproportionate fatality risks.[49] Preventive measures, including regular inspections and adherence to recall programs, mitigate these risks, as evidenced by post-recall reductions in defect-related crashes reported by NHTSA.[54] However, owner neglect—such as skipping maintenance—often underlies failures classified as mechanical, blurring lines with human error in causal attribution.[7]Environmental and Infrastructure Contributors
Adverse weather conditions, including rain, snow, ice, and fog, significantly contribute to traffic collisions by reducing visibility, impairing vehicle traction, and prompting sudden maneuvers. According to the Federal Highway Administration (FHWA), approximately 12% of all U.S. crashes—equating to nearly 745,000 incidents annually—are weather-related, resulting in over 3,800 fatalities and 268,000 injuries based on five-year averages through recent data.[55] Rain alone accounts for 8-10% of fatal crashes in analyzed datasets, as it increases hydroplaning risk and extends stopping distances on wet surfaces.[56] Winter weather events, such as snow and ice, are linked to about 1,000 U.S. fatalities per year, often due to black ice formation and reduced road grip, which exacerbate driver errors in low-traction environments.[57] Roadway atmospheric conditions, including poor lighting and fog, further elevate collision risks by limiting sightlines; National Highway Traffic Safety Administration (NHTSA) analyses identify these as critical pre-crash factors in a subset of investigated incidents.[7] Environmental contributors interact with geography, as rural roads—comprising 50% of fatal crashes despite lower traffic volumes—often lack drainage systems that mitigate flooding or icing, amplifying weather impacts.[58] Infrastructure deficiencies, such as pavement roughness and defects like potholes, directly correlate with higher crash rates by destabilizing vehicles and forcing evasive actions. A National Bureau of Economic Research study demonstrates a positive relationship between road roughness (measured via international roughness index) and crash frequency, with deteriorated surfaces increasing instability and reducing driver control.[59] Poor road design elements, including sharp curves, inadequate lane widths under 9 feet, and non-compliant roadside hazards (e.g., fixed obstacles without sufficient offset), elevate fatal crash odds by up to 1.3 times compared to compliant designs.[60][61] Winding uphill or downhill segments show fatality rates over four times higher than straight roads (3.09% versus 0.74%), attributable to geometric misalignment with vehicle dynamics.[62] Unsafe roadside infrastructure, such as unyielding barriers or vegetation encroaching on clear zones, intensifies injury severity in run-off-road collisions, as evidenced by analyses linking design non-compliance to greater vehicle excursion and impact forces.[63] Inadequate maintenance exacerbates these risks; safety inspections revealing deficiencies like uneven surfaces or missing signage predict elevated crash severity, particularly at intersections with poor geometric alignment.[64] Rural infrastructure often compounds issues through narrower shoulders and higher speeds on undivided roads, contributing to disproportionate fatal outcomes.[58]Health Consequences
Immediate Physical Trauma
Immediate physical trauma in traffic collisions arises from biomechanical forces including direct blunt impact, rapid deceleration, rotational shear, and, less commonly, penetrating injuries from debris or glass. These forces occur at the moment of collision, often before any protective response, leading to tissue disruption, vascular damage, and organ failure. In frontal impacts, occupants compress against vehicle interiors or restraints, while side collisions involve lateral intrusion; rear-end crashes generate whiplash via inertial loading of the head and neck relative to the torso. Ejection amplifies severity through secondary impacts with ground or other objects.[65][66] Traumatic brain injury (TBI), encompassing concussions, contusions, and diffuse axonal shearing, predominates as a cause of immediate fatality and disability, resulting from skull impacts or sudden angular acceleration exceeding 100 g-forces. Cervical spine fractures and dislocations frequently accompany TBI due to hyperflexion or hyperextension, with whiplash-associated disorders involving ligamentous tears and muscle strains in up to 33% of non-fatal cases among car occupants. Thoracic trauma, such as rib fractures, sternal breaks, and aortic transection from deceleration-induced intimal tears, accounts for substantial mortality, as blood pressure spikes shear the vessel intima at speeds over 40 km/h.[65][67][66] Abdominal injuries, including lacerations to the spleen, liver, or kidneys from seatbelt loading or dashboard compression, often lead to rapid hemorrhage; these occur in frontal crashes and contribute to 10-15% of trauma deaths via exsanguination within minutes. Extremity fractures, comprising long-bone breaks in legs and arms from pedal intrusion or door deformation, represent over 50% of skeletal injuries in reviewed cohorts, with pelvic ring disruptions in side impacts exacerbating bleeding risks. Soft tissue damage, such as lacerations and contusions, affects skin and subcutaneous layers universally but rarely proves immediately life-threatening absent vascular involvement.[65] Severity correlates directly with delta-V (change in velocity), where collisions exceeding 50 km/h yield Abbreviated Injury Scale (AIS) scores of 3+ in multiple body regions, per NHTSA crash reconstructions; unbelted occupants face 3-5 times higher intrusion-related trauma risk compared to restrained ones. Immediate fatalities, comprising 30-50% of crash deaths, stem primarily from unsurvivable head or cervical trauma, incompatible chest compression, or basilar skull fractures, underscoring the causal primacy of kinetic energy transfer over occupant factors in acute outcomes.[69][70]Long-Term and Psychological Effects
Survivors of traffic collisions frequently endure chronic pain, which persists in a substantial proportion of cases; for instance, in a cohort of road crash victims, 70% of adults reported pain one year post-incident, often linked to musculoskeletal injuries like whiplash or fractures that fail to heal fully.[71] Permanent medical impairment, including reduced mobility and disability, occurs in 2% to 23% of car occupants, with higher rates among vulnerable groups such as cyclists (up to 46%), stemming from spinal cord injuries or joint damage that impairs daily function over years.[72] Traumatic brain injuries (TBIs), a leading cause of long-term disability in collisions, affect an estimated 34 million people globally annually from road traffic crashes, resulting in outcomes like cognitive deficits and neurological disorders; notably, about 50% of adults with mild TBIs do not return to pre-injury health levels by six months, with persistent symptoms including headaches, memory impairment, and motor coordination issues.[73][74] Psychological sequelae are prevalent, with 10% to 20% of motor vehicle crash survivors developing ongoing mental health difficulties, primarily posttraumatic stress disorder (PTSD), depression, and anxiety.[75] PTSD manifests commonly after serious collisions, characterized by intrusive recollections, avoidance behaviors (such as driving phobia), and hyperarousal, often persisting beyond the acute phase due to the trauma's intensity and perceived threat to life.[76][77] Depression and anxiety frequently co-occur, exacerbating functional decline; research indicates nearly half of traffic injury survivors face elevated psychological distress risk, influenced by factors like injury severity and perceived crash responsibility, though recovery trajectories vary with early intervention.[78][79] These effects can compound physical disabilities, leading to diminished quality of life and higher rates of secondary health issues, such as substance use disorders as maladaptive coping mechanisms.[80]Epidemiological Data
Global Mortality and Injury Rates
In 2021, road traffic collisions resulted in an estimated 1.19 million deaths globally, equivalent to a mortality rate of 15 deaths per 100,000 population.[81] This figure represents a modest decline from 1.35 million deaths in 2016, though progress has stalled in recent years, with low- and middle-income countries bearing over 90% of fatalities despite comprising 53% of the world's vehicles.[81] Road traffic deaths account for approximately 2.3% of all global mortality and rank as the leading cause among individuals aged 5–29 years.[82] Non-fatal injuries from road traffic collisions affect between 20 and 50 million people annually, with many cases leading to permanent disability, hospitalization, or reduced quality of life.[2] Alternative estimates from the Global Burden of Disease study suggest around 50.3 million incident cases of road injuries in 2021, highlighting variability due to differences in data collection methodologies and underreporting, particularly in regions with limited surveillance systems.[83] Injury severity varies widely, but empirical data indicate that non-fatal outcomes often involve fractures, traumatic brain injuries, and spinal damage, contributing significantly to disability-adjusted life years lost.[2] These rates reflect causal factors such as disproportionate vulnerability among pedestrians and motorcyclists in developing regions, where enforcement of safety measures lags.[81] Global estimates rely heavily on WHO-compiled data from national registries, which face challenges including inconsistent definitions of "road traffic injury" and incomplete vital registration in over 100 countries, potentially biasing figures downward.[81] Despite these limitations, the data underscore that road traffic collisions remain a preventable epidemic, with empirical evidence linking higher rates to rapid motorization without corresponding infrastructure or behavioral adaptations.[2]Regional and Temporal Trends
Globally, annual road traffic deaths totaled approximately 1.19 million in the period covered by the latest comprehensive assessment, reflecting a 5% decline from 2010 levels despite population growth and rising vehicle ownership.[84] The global fatality rate per 100,000 population decreased by 16% over the same timeframe, attributable to widespread adoption of safety measures such as seatbelt laws, vehicle standards, and infrastructure improvements in higher-income settings.[3] However, this progress lags behind the United Nations' Sustainable Development Goal target of halving road traffic deaths by 2030, with absolute numbers remaining stagnant relative to increasing motorization in populous low- and middle-income countries.[85] Regionally, disparities are stark, with over 90% of fatalities occurring in low- and middle-income countries, which account for only about 60% of the world's vehicles.[3] The African Region records the highest death rate at 19 per 100,000 population, driven by factors including poor road infrastructure, limited enforcement of traffic laws, and high pedestrian and motorcyclist vulnerability.[3] In contrast, the European Region exhibits the lowest rate, approximately 5 per 100,000, supported by stringent regulations, advanced emergency response, and high vehicle safety compliance.[3] The South-East Asia Region bears the largest absolute burden, with 330,222 deaths annually, representing 28% of the global total, amid rapid urbanization and mixed traffic flows involving pedestrians, two-wheelers, and heavy vehicles.[3] Temporal trends diverge by development level: high-income countries have achieved consistent rate reductions, exemplified by the United States' drop to 1.26 fatalities per 100 million vehicle miles traveled in 2023 from peaks exceeding 2.5 in prior decades, owing to technological advancements like electronic stability control and distracted driving countermeasures.[86] In low-income regions, such as parts of Africa, fatalities have risen in recent years despite global declines, correlating with accelerated vehicle proliferation outpacing safety investments.[87] Developing economies in Asia and Latin America show mixed patterns, with some nations like China reporting annual mortality decreases of 4-9% in phases from 2004-2020 through enforced helmet laws and road expansions, yet overall vulnerability persists due to uneven regulatory implementation.[88] These patterns underscore that while engineering and policy interventions yield causal reductions in collision severity and frequency in resource-rich areas, causal drivers like human error and inadequate infrastructure amplify risks where economic constraints limit countermeasures.[89]| WHO Region | Estimated Annual Deaths | Fatality Rate (per 100,000 population) |
|---|---|---|
| Africa | High relative to population | 19 |
| Europe | Lower absolute | ~5 |
| South-East Asia | 330,222 (28% global) | Variable, elevated in low-income subsets |
| Global Average | 1.19 million | 17.4 |
Prevention Approaches
Individual Responsibility and Education
Individual responsibility in preventing traffic collisions centers on deliberate adherence to safe driving practices, such as obeying speed limits, avoiding impairment from alcohol or drugs, refraining from distractions like mobile phone use, and consistently using safety restraints. Empirical data from the World Health Organization indicate that wearing seat-belts reduces the risk of death among vehicle occupants by up to 50%, while child restraints achieve a 71% reduction in fatalities for young passengers.[2] Similarly, National Highway Traffic Safety Administration (NHTSA) statistics for 2023 show that speeding contributed to 11,775 fatalities, and distraction-affected crashes claimed 3,275 lives, underscoring how personal choices directly influence collision risks.[90][36] Education plays a role in fostering these behaviors, though its overall impact on crash reduction remains contested in rigorous studies. Systematic reviews of driver education programs, including those for novices and older drivers, find little to no evidence of sustained reductions in crashes or injuries, potentially due to inadequate teaching methods or failure to address risk compensation where trained drivers engage in riskier behaviors.[91] High school-based driver education, in particular, consistently shows no crash reduction per licensed driver, with some analyses attributing early popularity to flawed early studies.[92] NHTSA evaluations classify pre-licensure training as unproven or ineffective long-term for preventing citations, crashes, injuries, or deaths.[93] Certain targeted interventions yield more promising results. A University of Nebraska-Lincoln study of teen drivers found that mandatory driver's education reduced moving violations by nearly half (10.4% vs. 18.3% for untrained peers) and lowered crash involvement.[94] Graduated driver licensing (GDL) programs with mandated training have demonstrated effectiveness in curbing severe early-licensure crashes.[95] Defensive driving courses, especially online formats from organizations like the National Safety Council, correlate with up to 70% fewer violations post-training, indirectly supporting fewer incidents through heightened awareness.[96] Public awareness campaigns on behaviors like impairment avoidance have meta-analytically reduced overall road crashes by approximately 9%.[97] From a causal perspective, individual accountability emphasizes proactive risk avoidance over reliance on external systems, as human error accounts for the majority of collisions. While systemic biases in academic research may underemphasize personal agency in favor of infrastructural solutions, data affirm that voluntary compliance with evidence-based practices—such as maintaining vehicle readiness and yielding appropriately—substantially mitigates preventable harms without requiring institutional overreach.[98]Technological Interventions
Electronic stability control (ESC) systems, mandated in all new U.S. vehicles since 2012, detect loss of traction and apply brakes selectively to individual wheels to maintain vehicle stability, reducing fatal single-vehicle crashes by 38 percent in passenger cars and 56 percent in SUVs according to NHTSA estimates.[99] Overall, ESC lowers all fatal crash risks by 14 percent for cars and 28 percent for light trucks and vans.[100] These gains stem from preventing skids and rollovers, which account for a significant portion of single-vehicle incidents, with real-world data confirming 30-50 percent reductions in fatal single-vehicle crashes for cars and 50-70 percent for SUVs.[101] Automatic emergency braking (AEB), a core advanced driver assistance system (ADAS), uses sensors to detect imminent collisions and applies brakes autonomously if the driver fails to respond, achieving over 40 percent reductions in rear-end crash rates for equipped pickup trucks.[102] IIHS studies show AEB combined with forward collision warnings reduces rear-end crashes by 41 percent overall and insurance claims by up to 43 percent across severities.[103][104] Broader ADAS features, including lane departure warnings and blind-spot detection, correlate with 11-55 percent lower accident rates when properly engaged, though effectiveness depends on driver compliance and system limitations in adverse conditions.[105] Passive safety technologies like seat belts and airbags mitigate injury severity upon collision. Seat belts reduce serious crash-related fatalities by about 50 percent by restraining occupants against inertial forces.[106] Airbags, designed to supplement belts, lower frontal crash death risks by 11 percent when used with belts and up to 61 percent in combination, cushioning impacts that would otherwise cause direct contact with vehicle interiors.[107][108] Emerging vehicle-to-vehicle (V2V) communication enables real-time data sharing on speed, position, and hazards among equipped vehicles, potentially preventing intersection and chain-reaction crashes by extending awareness beyond line-of-sight, with modeled benefits including up to 80 percent avoidance of certain collision types.[109] However, deployment remains limited, focusing on cooperative maneuvers and early warnings rather than proven widespread reductions. Autonomous vehicles (AVs) show promise in empirical data: Waymo's rider-only operations report 88 percent fewer serious injury crashes and 93 percent fewer pedestrian-involved incidents compared to human benchmarks over millions of miles driven by January 2025.[110] Tesla's Autopilot data from Q3 2025 indicates a sixfold reduction in crash risk per million miles versus non-assisted driving.[111] These systems leverage sensors and algorithms to eliminate human error in routine scenarios, though challenges persist in edge cases like complex urban environments.[112]Policy and Infrastructure Measures
Policies such as mandatory seatbelt laws have demonstrably reduced traffic fatalities; in the United States, primary enforcement seatbelt laws were associated with a 7-9% decrease in motor vehicle crash mortality rates between 1999 and 2015, controlling for other factors. [113] Similarly, lowering legal blood alcohol concentration (BAC) limits to 0.08% or below correlated with significant reductions in fatalities, with states implementing such thresholds seeing up to an 11% drop in alcohol-impaired driving deaths. [113] [114] Enforcement mechanisms, including random breath testing and sobriety checkpoints, provide strong evidence of effectiveness in curbing alcohol-related collisions, with meta-analyses showing reductions of 10-20% in such crashes following widespread implementation. [115] Speed limit regulations, when paired with strict enforcement, contribute to lower fatality rates; for instance, the U.S. National Maximum Speed Law of 55 mph in 1974 reduced highway deaths by an estimated 3,000-5,000 annually during its enforcement, though subsequent repeals led to rebounds. [116] Graduated driver licensing for teens, restricting nighttime and passenger limits, has been linked to 10-30% reductions in youth crash involvement across adopting jurisdictions. [114] Red light cameras, as automated enforcement tools, further mitigate intersection collisions, yielding a 25% average decrease in right-angle crashes where deployed. [113] Infrastructure interventions emphasize forgiving road designs that accommodate human error. Roundabouts, for example, can reduce severe injury crashes by 70-80% at intersections compared to signalized alternatives, due to slower entry speeds and elimination of high-speed T-bone impacts. [117] Safety barriers and median treatments prevent crossover collisions, with cable median barriers showing up to 65% efficacy in reducing head-on fatalities on divided highways. [118] Traffic calming measures, such as speed humps, chicanes, and narrowed lanes in residential areas, achieve 20-40% reductions in injury crashes by inducing voluntary speed compliance. [119] [120] Rumble strips along shoulders and centerlines effectively deter lane departures, preventing 300-600 fatal crashes annually in the U.S. when systematically applied. [121] Enhanced lighting at high-risk spots and blackspot remediation—targeting crash-prone locations with geometric fixes—yield 30-50% drops in nighttime incidents and overall collisions, respectively. [122] These measures, prioritized under frameworks like the U.S. Federal Highway Administration's Proven Safety Countermeasures, rely on data-driven site selection to maximize causal impact over broad interventions. [118]Legal and Economic Ramifications
Liability Determination and Insurance
Liability in traffic collisions is typically established through an assessment of negligence, defined as the failure to exercise reasonable care that a prudent driver would under similar circumstances, leading to the incident.[123] Investigators, including police officers and insurance adjusters, evaluate evidence such as police reports citing traffic violations (e.g., failure to yield, speeding, or driving under the influence), witness testimonies, photographs or videos of the scene, and the location and extent of vehicle damage, which can indicate the point of impact and directional forces involved.[124][125] For instance, in rear-end collisions, the following driver is presumptively at fault unless evidence shows otherwise, such as sudden braking without cause by the lead vehicle.[126] Most jurisdictions employ comparative negligence doctrines to apportion fault proportionally among parties, rather than assigning full blame to one. Under pure comparative negligence, a party can recover damages reduced by their percentage of fault, even if exceeding 50%; modified versions bar recovery if fault exceeds 50% or 51%, depending on the jurisdiction.[127][128] This approach recognizes that collisions often result from multiple contributing factors, such as partial signal non-compliance or distracted driving by both parties, with fault percentages derived from evidentiary weight rather than binary determinations.[129] Insurance systems hinge on established liability to process claims and allocate costs. In at-fault (tort) regimes, predominant in most countries including 38 U.S. states, the liable driver's bodily injury and property damage liability coverage compensates the victim's medical bills, lost wages, and vehicle repairs, subject to policy limits; the at-fault party may face premium surcharges or policy non-renewal.[130][131] No-fault systems, implemented in 12 U.S. states and territories like New York and Michigan, mandate personal injury protection (PIP) coverage where each driver's insurer pays their own medical and wage-loss claims regardless of fault, aiming to expedite payouts but restricting lawsuits to severe injuries exceeding thresholds (e.g., $10,000 in economic losses or significant disfigurement).[130][132] Uninsured or underinsured motorist coverage supplements in both systems when the at-fault party lacks adequate limits, covering gaps based on verified liability.[133] Claim denials or disputes often lead to arbitration or litigation, where courts uphold or adjust insurer fault assessments grounded in the negligence standard.[134]Enforcement and Penalties
Enforcement of traffic laws aims to deter behaviors contributing to collisions through visible police presence, targeted operations, and automated technologies. In the United States, agencies such as state police and local departments conduct patrols, sobriety checkpoints, and radar enforcement to detect speeding, impaired driving, and reckless operation, with sobriety checkpoints proven effective in reducing alcohol-related fatalities when combined with publicity and swift prosecution.[39] Automated systems, including speed and red-light cameras, monitor violations without continuous officer involvement; studies in urban areas show these reduce collision rates by lowering average speeds and altering driver behavior near enforcement zones, with one analysis estimating a 20-30% drop in injury crashes post-installation.[135][136] Penalties escalate with offense severity and prior violations, typically including fines, demerit points on licenses, suspension or revocation of driving privileges, and criminal charges. For minor infractions like speeding without injury, first offenses often incur fines under $500 and 2-4 points, though repeat violations trigger license suspension; evidence indicates point systems deter recidivism by accumulating toward disqualification after 12-15 points in many jurisdictions.[137][138] Driving under the influence (DUI) carries harsher consequences, classified as misdemeanors for first offenses with fines up to $1,000-$2,500, jail time of days to months, and mandatory ignition interlocks, escalating to felonies for repeats or fatalities with imprisonment of 3-28 years and fines exceeding $25,000.[139] Hit-and-run incidents, involving failure to stop and report, result in misdemeanors for property damage (up to 1 year jail, $5,000 fine) or felonies for injuries/deaths (5-30 years imprisonment in states like Louisiana).[140][141] Effectiveness of penalties hinges on certainty and swiftness of enforcement rather than severity alone; research shows mandatory fines and demerit points for DUI correlate with 8% reductions in alcohol-related fatalities, while strong laws targeting repeat offenders decrease crashes involving priors by up to 39%.[142][143] However, isolated fine increases yield mixed long-term results on violation rates, with deterrence stronger when paired with high detection probability via cameras or checkpoints, as drivers respond more to perceived risk of apprehension than maximum punishment.[144][145] Internationally, similar graduated penalties, including disqualification and imprisonment for speeding or impairment, support behavior change when enforcement is consistent, though under-resourced systems in low-income regions limit impact.[146]Broader Economic Burdens
Traffic collisions impose substantial macroeconomic burdens beyond direct medical and property damage expenses, encompassing lost productivity, congestion-induced delays, excess fuel consumption, and administrative overheads. Globally, road traffic crashes are estimated to cost approximately 3% of gross domestic product (GDP) in most countries, with low- and middle-income nations bearing a disproportionately higher relative load due to limited infrastructure and healthcare resources.[147][2] Some analyses project cumulative global costs from fatal and non-fatal injuries reaching $1.8 trillion annually by mid-century projections, equivalent to a significant share of worldwide health expenditures.[3] Lost productivity represents a primary indirect cost, arising from fatalities, permanent disabilities, and temporary incapacitation of victims, particularly in working-age populations. In the United States, the 2019 economic valuation of motor vehicle crashes totaled $340 billion, with over half attributed to productivity losses from premature deaths and reduced workforce participation.[148][149] Congestion from collision-related road closures exacerbates this by causing widespread travel delays and increased fuel usage; for instance, crash-induced delays alone contribute billions in annual time and energy losses, compounding economic inefficiency in urban areas.[148] Administrative and legal expenditures further amplify the burden, including insurance processing, emergency response, and litigation. Empirical models indicate that a 1% increase in road accidents correlates with a 0.42% decline in real GDP, reflecting cascading effects on economic output through disrupted supply chains and reduced business competitiveness.[150] In high-income contexts like Europe and the US, total crash costs range from 0.4% to 4.1% of GDP, underscoring the need for targeted interventions to mitigate these systemic drags on growth.[151]Historical Context
Origins in Early Motorization
The advent of motorized road vehicles in the late 19th century introduced novel risks of collision, as these machines operated on pathways originally designed for pedestrians, horses, and slower carriages, without established rules or infrastructure adaptations. Experimental steam and gasoline-powered prototypes, such as Karl Benz's 1885 Patent-Motorwagen, achieved speeds up to 16 km/h (10 mph), but their rarity limited incidents initially.[152] The first recorded automobile-related fatality worldwide occurred on July 31, 1869, in Parsonstown, Ireland (now Birr), when microscopist Mary Ward was thrown from and crushed under an experimental steam carriage built by her cousin Charles Parsons during a test drive.[153] This incident highlighted early mechanical unreliability and the hazards of open, unguarded vehicles lacking safety features like enclosed cabins or restraints. In the United States, the earliest documented non-fatal automobile collision happened on August 14, 1891, in Ohio City, Ohio, when inventor James William Lambert's gasoline buggy—the first such vehicle built domestically—struck a hitching post while maneuvering at low speed, damaging the front wheels but causing no injuries.[154] Vehicle-to-vehicle crashes emerged soon after; on May 30, 1896, during a "horseless carriage" race in New York City, Henry Wells's Duryea Motor Wagon collided with a bicycle, injuring the rider and marking one of the first inter-vehicle incidents in urban settings.[155] The first U.S. pedestrian death by automobile followed on September 13, 1899, when businessman Henry H. Bliss was struck and killed by an electric taxicab at 74th Street and Central Park West in Manhattan, amid growing vehicular presence in cities.[156] These events stemmed from fundamental causal factors: drivers unfamiliar with steering and braking, roads unpaved and shared with animal traffic, and absence of signals or signage, leading to misjudged speeds and paths. Mass motorization amplified collision frequency, particularly after Henry Ford's assembly-line production of the Model T beginning December 1, 1908, which democratized car ownership and swelled U.S. vehicle registrations from about 200,000 in 1908 to over 8 million by 1920.[157] Fatalities rose correspondingly; in 1913, the U.S. recorded approximately 4,200 motor vehicle deaths, equating to a rate of 33.38 per 10,000 registered vehicles, driven by urban congestion, rudimentary tires prone to blowouts, and headlight limitations at night.[158] Cities like Detroit, a nascent auto hub, saw acute spikes: between June and August 1908 alone, 31 pedestrians and others died in crashes, often involving children or horse-drawn vehicles, underscoring the chaos of integrating faster machines into mixed-traffic environments without speed limits or licensing.[159] Empirical data from this era reveal that over 80% of early accidents involved pedestrians or cyclists, reflecting the predominance of human error in navigation and the lack of yielding norms, rather than vehicle defects alone.[160] ![Accident_Vanderkindere.jpg][float-right] By the 1910s, public awareness grew, with newspapers documenting "jaywalking" risks and mechanical failures like brake shortages contributing to wrecks, yet regulatory responses lagged behind technological proliferation.[152] In Europe, similar patterns unfolded; Britain's Roads Act of 1896 permitted self-propelled vehicles up to 14 mph with a flag-waving attendant, but collisions persisted due to enforcement gaps. Overall, early motorization's collision origins trace to the causal mismatch between human-operated, high-momentum devices and unprepared roadways, setting precedents for subsequent safety engineering.[161]Evolution Through Regulatory Eras
The earliest regulatory responses to traffic collisions arose in the late 19th and early 20th centuries as automobiles transitioned from novelties to common transport, with jurisdictions imposing basic speed limits and licensing to curb reckless operation. In the United States, New York enacted the first motor vehicle law in 1901 requiring registration and operator identification, while states like Massachusetts introduced driver's licenses by 1903 to verify competence amid rising pedestrian and horse-drawn vehicle conflicts.[162] By the 1910s, as Ford's Model T enabled mass motoring—reaching 15 million units sold by 1927—collisions escalated due to untrained drivers and inadequate roads, prompting innovations like the first electric traffic signal in Cleveland in 1914 and stop signs in Detroit in 1915.[163] These measures, often locally enforced, emphasized driver responsibility over vehicle design, with the American Association of State Highway Officials adopting the Manual on Uniform Traffic Control Devices in 1935 to standardize signage and signals, reducing intersection crashes through clearer causality in fault attribution.[164] A transformative era began in the mid-20th century, shifting focus to systemic vehicle and highway safety amid postwar automobile proliferation and fatality spikes exceeding 50,000 annually by 1966. President Lyndon B. Johnson signed the National Traffic and Motor Vehicle Safety Act and Highway Safety Act on September 9, 1966, empowering federal oversight via the National Highway Traffic Safety Administration (established 1970) and mandating initial Federal Motor Vehicle Safety Standards (FMVSS) effective January 1, 1968, which required dual braking systems, side marker lights, and energy-absorbing steering columns to mitigate crash impacts.[165] These standards addressed causal factors like structural failure in collisions, with subsequent rules enforcing three-point seat belts in front seats by 1968 and padded instrument panels, contributing to a cumulative prevention of over 860,000 fatalities from 1968 to 2019 through enhanced crashworthiness.[166] The 1956 Interstate Highway System Act indirectly bolstered safety by standardizing divided highways, though pre-1966 efforts remained fragmented, relying on state-level enforcement of speed and alcohol limits with limited empirical backing.[163] From the 1970s onward, regulations integrated behavioral enforcement with technological mandates, targeting high-risk factors like impairment and ejection. The Emergency Highway Energy Conservation Act of 1974 imposed a national 55 mph speed limit—initially for fuel savings but empirically linked to a 7-10% fatality drop via reduced kinetic energy in crashes—repealed in 1995 amid state pushback.[167] Drunk driving laws hardened in the 1980s following Mothers Against Drunk Driving's advocacy, with all states adopting 0.08% blood alcohol concentration limits by 2004 and administrative license suspension, correlating to a 16% decline in alcohol-related fatalities from 1982 to 1995.[168] Airbag requirements phased in for passenger vehicles from 1989 to 1998, while the 1990s saw universal child restraint mandates and graduated licensing for teens, reducing youth crash rates by up to 40%.[169] The 21st century emphasized active safety, with electronic stability control mandated for all vehicles by 2012 (preventing 5,300-9,600 deaths yearly) and rearview cameras required since 2018, alongside pending 2029 automatic emergency braking standards projected to avert 360,000 crashes.[170] These eras reflect a causal progression from reactive driver controls to proactive engineering, though efficacy varies by compliance and jurisdiction, with global bodies like the UN's World Forum for Harmonization adopting similar FMVSS-inspired protocols since 1952.[171]Key Debates and Controversies
Individual Accountability vs. Systemic Excuses
In traffic collision analyses, empirical data consistently attributes the vast majority of incidents to individual driver behaviors rather than systemic deficiencies. The National Highway Traffic Safety Administration (NHTSA) estimates that human error contributes to approximately 94% of motor vehicle crashes in the United States, based on a comprehensive survey of over 5,000 crashes involving passenger vehicles.[10] This figure encompasses recognition errors (e.g., inattention or failure to detect hazards), accounting for 41% of critical reasons, and decision errors (e.g., aggressive driving or excessive speed), comprising 33%.[10] Vehicle-related issues and environmental factors, by contrast, play minimal roles, at roughly 2% and 3% respectively.[172] Proponents of systemic explanations often invoke infrastructure flaws, socioeconomic disparities, or institutional biases as root causes, suggesting that individual actions are mere symptoms of broader failures. However, such attributions lack robust causal support when scrutinized against crash data; for instance, studies indicate that socioeconomic status correlates weakly with accident rates after controlling for behavioral factors like speeding or impairment, which remain the dominant predictors across demographics.[173] Interventions emphasizing personal responsibility, such as random breath testing for alcohol-impaired driving, have demonstrated strong efficacy in reducing fatal crashes by 10-20%, outperforming purely infrastructural fixes in controlled evaluations.[115] This underscores a causal chain where individual choices—volitional acts like distracted phone use or DUI—initiate most collisions, rather than deterministic systemic forces. Critiques of overreliance on systemic narratives highlight their potential to erode deterrence; jurisdictions with lenient enforcement, framing violations as societal inevitabilities, exhibit persistently higher recidivism rates among offenders. For example, repeat DUI convictions, driven by individual disregard for laws, account for 20-30% of alcohol-related fatalities despite comprising a small fraction of drivers.[97] While road design improvements (e.g., roundabouts reducing intersection crashes by 40%) contribute marginally, they cannot negate the agency of drivers who exceed speeds or ignore signals, as evidenced by pre- and post-intervention data showing behavioral compliance as the key variable.[174] Prioritizing accountability through graduated licensing and penalties has correlated with 15-25% declines in youth crash rates in multiple U.S. states, affirming that causal realism favors holding actors responsible over diluting blame across unprovable systemic proxies.[175] This tension manifests in policy debates, where "Safe Systems" frameworks advocate designing for inevitable human fallibility, yet overlook how such approaches may foster moral disengagement—drivers rationalizing violations via justifications like "systemic pressure" rather than self-control. Empirical reviews of accident liability reveal stable individual differences in risk-taking propensity, independent of external conditions, supporting targeted behavioral interventions over wholesale systemic overhauls.[176][173] Ultimately, data-driven accountability aligns with observed reductions in collisions, whereas unchecked systemic excuses risk perpetuating preventable errors under the guise of inevitability.Promises and Pitfalls of Autonomous Vehicles
Autonomous vehicles (AVs) hold potential to mitigate traffic collisions primarily by addressing human error, which empirical analyses attribute to approximately 94% of crashes.[110] National Highway Traffic Safety Administration (NHTSA) data indicate that advanced driver assistance systems, precursors to full AVs, could substantially reduce incidents stemming from distraction, impairment, or fatigue, with projections suggesting thousands of annual lives saved if scaled.[177] A 2024 peer-reviewed study in Nature Communications analyzed matched cases and found AVs equipped with accident avoidance features lowered crash risks from human factors like distraction by enabling proactive interventions unavailable to human drivers.[178] Deployment data from leading AV operators provide mixed but promising indicators. Waymo's rider-only operations in select cities demonstrated a disengagement rate of 0.076 per 1,000 miles in recent evaluations, outperforming human benchmarks in controlled urban environments and yielding crash rates below national averages for comparable miles driven.[179] Similarly, NHTSA's vision for automated driving systems emphasizes their capacity to handle dynamic roadway tasks without human variability, potentially enhancing overall safety through consistent adherence to traffic laws and rapid response times.[180] However, these gains are context-specific, often limited to geofenced areas with favorable conditions, and require human oversight or remote intervention in edge cases. Despite these advantages, AVs have encountered significant pitfalls, evidenced by rising incident volumes. NHTSA's Standing General Order database recorded over 3,900 crashes involving AVs from 2019 through mid-2024, with Tesla vehicles accounting for 53.9% of 3,979 incidents reported between June 2021 and June 2024.[181][182] California's Department of Motor Vehicles logged 880 AV collision reports as of October 17, 2025, including high-profile cases like Cruise's 2023 pedestrian dragging incident and multiple Tesla Autopilot-related fatalities investigated by NHTSA.[183] These events highlight software misjudgments, such as failure to detect static obstacles or predict erratic human drivers, contributing to rear-end collisions and loss-of-control scenarios at rates sometimes exceeding human drivers in uncontrolled testing.[181] Technical limitations exacerbate risks in non-ideal conditions. AV sensors, reliant on lidar, radar, and cameras, degrade in adverse weather—fog, heavy rain, or snow scatters signals and obscures visibility, impairing object detection and localization.[184] Federal Highway Administration research underscores that such conditions limit AV functionality, with precipitation alone causing up to 20% performance drops in perception accuracy during tests.[185] Complex scenarios, including construction zones, erratic pedestrians, or occluded hazards, further challenge current algorithms, as disengagement reports from California in 2023 revealed over 6,570 interventions across 5.2 million driverless kilometers, predominantly for safety-critical maneuvers.[186] Ethical dilemmas, often framed via the "trolley problem," pose additional conceptual pitfalls, though real-world AV designs prioritize crash avoidance over binary sacrifice choices. Proponents argue that AVs should minimize harm through probabilistic decision-making, but surveys like MIT's Moral Machine reveal cultural variances in preferences—e.g., sparing children over elders—complicating uniform programming.[187] Critics, including Brookings Institution analyses, contend such hypotheticals overemphasize rare inevitabilities while underplaying empirical prevention via superior sensing, as AVs logged no at-fault fatalities in millions of miles for some fleets, contrasting human rates.[188] Regulatory scrutiny, including NHTSA probes into systemic flaws, underscores the need for transparent validation before widespread adoption to avoid unintended escalations in collision severity.[189]References
- https://www.[researchgate](/page/ResearchGate).net/publication/393273148_Different_types_of_injury_associated_with_road_traffic_accidents