

Community hub
0 subscribers8 pages, 0 posts
Recent from talks
All channels
Be the first to start a discussion here.
Be the first to start a discussion here.
Be the first to start a discussion here.
Be the first to start a discussion here.
Contribute something
Welcome to the community hub built to collect knowledge and have discussions related to Speed limit.
Nothing was collected or created yet.
Speed limit
View on Wikipediafrom Wikipedia

Speed limits on road traffic, as used in most countries, set the legal maximum speed at which vehicles may travel on a given stretch of road.[1] Speed limits are generally indicated on a traffic sign reflecting the maximum permitted speed, expressed as kilometres per hour (km/h) or miles per hour (mph) or both. Speed limits are commonly set by the legislative bodies of national or provincial governments and enforced by national or regional police and judicial authorities. Speed limits may also be variable, or in some places nonexistent, such as on most of the Autobahnen in Germany.[2]
The first numeric speed limit for mechanically propelled road vehicles was the 10 mph (16 km/h) limit introduced in the United Kingdom in 1861.[3]
Speed limits are frequently introduced for health reasons with a goal to improve road traffic safety and reduce the number of casualties from traffic collisions. There is a relationship between speed and health impacts, whereby it has been posited that a 5% increase in speed is linked to a 10% increase in injury, and a 20% increase in deaths.[4] Speed limits tend to be stricter in areas with more pedestrians, in particular those frequented by children.[4] The World Health Organization (WHO) identified speed control as one of a number of steps that can be taken to reduce road casualties.[n 1] As of 2021, the WHO estimates that approximately 1.3 million people die of road traffic crashes each year.[5]
Authorities may also set speed limits to reduce the environmental impact of road traffic (vehicle noise, vibration, emissions) or to enhance the safety of pedestrians, cyclists, and other road-users. For example, a draft proposal from Germany's National Platform on the Future of Mobility task force recommended a blanket 130 km/h (81 mph) speed limit across the Autobahnen to curb fuel consumption and carbon emissions.[6] Some cities have reduced limits to as little as 30 km/h (19 mph) for both safety and efficiency reasons.[7] However, some research indicates that changes in the speed limit may not always alter average vehicle speed.[8] Lower speed limits could reduce the use of over-engineered vehicles.[9]
History
[edit]The examples and perspective in this section may not represent a worldwide view of the subject. (August 2015) |

In Western cultures, speed limits predate the use of motorized vehicles. In 1652, the American colony of New Amsterdam passed a law stating, "No wagons, carts or sleighs shall be run, rode or driven at a gallop". The punishment for breaking the law was "two pounds Flemish", the equivalent of US$50 in 2019.[10] The 1832 Stage Carriage Act introduced the offense of endangering the safety of a passenger or person by "furious driving" in the United Kingdom (UK).[11] In 1872, then-President of the United States Ulysses S. Grant was arrested for speeding in his horse-drawn carriage in Washington, D.C.[12][13]
A series of Locomotive Acts (in 1861, 1865 and 1878) created the first numeric speed limits for mechanically propelled vehicles in the UK; the 1861 Act introduced a UK speed limit of 10 mph (16 km/h) on open roads in town, which was reduced to 2 mph (3 km/h) in towns and 4 mph (6 km/h) in rural areas by the 1865 "Red Flag Act".[14] The Locomotives on Highways Act 1896, which raised the speed limit to 14 mph (23 km/h) is celebrated by the annual London to Brighton Veteran Car Run.[15]
On 28 January 1896, the first person to be convicted of speeding is believed to be Walter Arnold of East Peckham, Kent, UK, who was fined 1 shilling plus costs for speeding at 8 mph (13 km/h).[16][17][18]

In 1901, Connecticut was the first state in the United States to impose a numerical speed limit for motor vehicles, setting the maximum legal speed to 12 mph (19 km/h) in cities and 15 mph (24 km/h) on rural roads. Speed limits then propagated across the United States; by 1930 all but 12 states had established numerical limits.[10]
In 1903, in the UK, the national speed limit was raised to 20 mph (32 km/h); however, as this was difficult to enforce due to the lack of speedometers, the 1930 "Road Traffic Act" abolished speed limits entirely. In 1934, a new limit of 30 mph (48 km/h) was imposed in urban centers, and in July 1967, a 70 mph (110 km/h) national speed limit was introduced.[20]
In Australia, during the early 20th century, there were people reported for "furious driving" offenses. One conviction in 1905 cited a vehicle furiously driving 20 mph (32 km/h) when passing a tram traveling at half that speed.[21]
In May 1934, the Nazi-era "Road Traffic Act" imposed the first nationwide speed limit in Germany.[citation needed]
In the 1960s, in continental Europe, some speed limits were established based on the V85 speed, (so that 85% of drivers respect this speed).[22]
In 1974, Australian speed limits underwent metrication: the urban speed limit of 35 mph (56 km/h) was converted to 60 km/h (37 mph); the rural speed limits of 60 mph (97 km/h) and 65 mph (105 km/h) were changed to 100 km/h (62 mph) and 110 km/h (68 mph) respectively.[23]
In 2010, Sweden defined the Vision Zero program,[22] a multi-national road traffic safety project that aims to achieve a highway system with no fatalities or serious injuries involving road traffic.
Regulations
[edit]

Kilometres per hour (km/h)
Miles per hour (mph)
Both
No speed limit units
Most countries use the metric speed unit of kilometres per hour, while others, including the United States and United Kingdom and Belize, use speed limits given in miles per hour.
Vienna Convention on Road Traffic
[edit]In countries bound by the Vienna Conventions on Road Traffic (1968 & 1977), Article 13 defines a basic rule for speed and distance between vehicles:[24]
Every driver of a vehicle shall in all circumstances have his vehicle under control to be able to exercise due and proper care and to be at all times in a position to perform all manœuvres required of him. He shall, when adjusting the speed of his vehicle, pay constant regard to the circumstances, in particular the lie of the land, the state of the road, the condition and load of his vehicle, the weather conditions and the density of traffic, so as to be able to stop his vehicle within his range of forward vision and short of any foreseeable obstruction. He shall slow down and if necessary stop whenever circumstances so require, and particularly when visibility is not excellent.
Reasonable speed
[edit]Most legal systems expect drivers to drive at a safe speed for the conditions at hand, regardless of posted limits.
In the United Kingdom, and elsewhere in common law, this is known as the reasonable man requirement.[25]
The German Highway Code (Straßenverkehrs-Ordnung) section on speed begins with the statement (translated to English):[26]
Any person driving a vehicle may only drive so fast that the car is under control. Speeds must be adapted to the road, traffic, visibility and weather conditions as well as the personal skills and characteristics of the vehicle and load.
In France, the law clarifies that even if the speed is limited by law and by local authority, the driver assumes the responsibility to control a vehicle's speed, and to reduce that speed in various circumstances (such as when overtaking a pedestrian or bicycle, individually or in a group; when overtaking a stopped convoy; when passing a transportation vehicle loading or unloading people or children; when the road does not appear clear, or risky; when visibility is low, etc.).[27] If drivers do not control their speed, or do not reduce it in such cases, they can be penalized. Other qualifying conditions include driving through fog, heavy rain, ice, snow, gravel,[28] or when drivers encounter sharp corners, a blinding glare,[29] darkness, crossing traffic,[30] or when there is an obstructed view of orthogonal traffic—such as by road curvature, parked cars, vegetation, or snow banks—thus limiting the Assured Clear Distance Ahead (ACDA).[31][32]
In the United States, this requirement is referred to as the basic rule,[33] as outlined by US federal government law (49 CFR 392.14[34]), which applies in all states as permitted under the commerce clause and due process clause.[35][36] The basic speed law is almost always supplemented by specific maximum or minimum limits but applies regardless. In California, for instance, Vehicle Code section 22350 states that "No person shall drive a vehicle upon a highway at speed greater than is reasonable... and in no event at a speed which endangers the safety of persons or property".[37] The reasonable speed may be different than the posted speed limit. Basic rule speed laws are statutory reinforcements of the centuries-old common law negligence doctrine as specifically applied to vehicular speed.[38] Citations for violations of the basic speed law without a crash[39] have sometimes been ruled unfairly vague or arbitrary, hence a violation of the due process of law, at least in the State of Montana.[40] Even within states, differing jurisdictions (counties and cities) choose to prosecute similar cases with differing approaches.[41]
Excessive speed
[edit]Consequential results of basic law violations are often categorized as excessive speed crashes; for example, the leading cause of crashes on German autobahns in 2012 fell into that category: 6,587 so-called "speed related" crashes claimed the lives of 179 people, which represented almost half (46.3%) of 387 autobahn fatalities in 2012.[42] However, "excessive speed" does not necessarily mean the speed limit was exceeded, rather that police determined at least one party traveled too fast for existing conditions.[42][43][44] Examples of conditions where drivers may find themselves driving too fast include wet roadways (due to rain, snow, or ice), reduced visibility (due to fog[45] or "white out" snow[46]), uneven roads, construction zones,[47] curves,[48] intersections, gravel roads,[49] and heavy traffic.[50] Per distance traveled, consequences of inappropriate speed are more frequent on lower speed, lower quality roads;[51] in the United States, for example, the "speeding fatality rate for local roads is three times that for Interstates".[52]
For speed management, a distinction can exist between excess speed, which consists of driving in excess of the speed limit, and inappropriate speed, which consists of going too fast for the conditions.[53]
Maximum speed limits
[edit].png)
Most countries have a legally assigned numerical maximum speed limit which applies on all roads when no other speed limit indications are present; lower speed limits are often shown on a sign at the start of the restricted section, although the presence of streetlights or the physical arrangement of the road may sometimes also be used instead. A posted speed limit may only apply to that road or to all roads beyond the sign that defines them depending on local laws.
The speed limit is commonly set at or below the 85th percentile speed (the operating speed which no more than 15% of traffic exceeds),[54][55][56] and in the US is frequently set 4 to 8 mph (6 to 13 km/h) below that speed.[57] Thus, if the 85th percentile operating speed as measured by a "Traffic and Engineering Survey" exceeds the design speed, legal protection is given to motorists traveling at such speeds (design speed is "based on conservative assumptions about the driver, the vehicle, and roadway characteristics").[58] The theory behind the 85th percentile rules is that, as a policy, most citizens should be deemed reasonable and prudent, and limits must be practical to enforce.[59][60] However, there are some circumstances where motorists do not tend to process all the risks involved, and as a mass, choose a poor 85th percentile speed.[citation needed] This rule, in practice, is a process for "voting the speed limit" by driving, in contrast to delegating the speed limit to an engineering expert.[61][62]
The maximum speed permitted by statute, as posted, is normally based on ideal driving conditions and the basic speed rule always applies.[63] Violation of the statute generally raises a rebuttable presumption of negligence.[64]
On international European roads, speed should be taken into account during the design stage.[citation needed]
| Road classification | 60 km/h | 80 km/h (50 mph) | 100 km/h (60 mph) | 120 km/h (75 mph) | 140 km/h (85 mph) |
|---|---|---|---|---|---|
| Motorway | x | 80 | 100 | 120 | 140 |
| Express road | 60 | 80 | 100 | 120 | x |
| Road | 60 | 80 | 100 | x | x |
Minimum speed limits
[edit]Some roads also have minimum speed limits, usually where slow speeds can impede traffic flow or be dangerous.[65] The use of minimum speed limits is not as common as maximum speed limits, since the risks of speed are less common at lower speeds.[22] In some jurisdictions, laws requiring a minimum speed are primarily centered around red-light districts or similar areas, where they may colloquially be referred to as kerb crawling laws.[66]
Middle speed limits
[edit]Traffic rules limiting only middle speeds are rare. One such example exists on the ice roads in Estonia, where it is advised to avoid driving at the speed of 25–40 km/h (16–25 mph) as the vehicle may create resonance that may in turn induce the breaking of ice. This means that two sets of speeds are allowed: under 25 km/h (16 mph) and between 40–70 km/h (25–43 mph).[67]
Variable speed limits
[edit]

In Germany, the first known experiments with variable speed limit signs took place in 1965 on a 30-kilometre (19 mi) stretch of German motorway, the A8 between Munich and the border city of Salzburg, Austria. Mechanically variable message signs could display speeds of 60, 80 and 100 km/h, as well as text indicating a "danger zone" or "accident". Personnel monitored traffic using video technology and manually controlled the signage.[68] Beginning in the 1970s, additional advanced traffic control systems were put into service. Modern motorway control systems can work without human intervention using various types of sensors to measure traffic flow and weather conditions. In 2009, 1,300 kilometres (810 mi) of German motorways were equipped with such systems.[69]
In the United States, heavily traveled portions of the New Jersey Turnpike began using variable speed limit signs in combination with variable message signs in the late 1960s. Officials can adjust the speed limit according to weather, traffic conditions, and construction.[70] More typically, variable speed limits are used on remote stretches of highway in the United States in areas with extreme changes in driving conditions.[71] For example, variable limits were introduced in October 2010 on a 52-mile (84 km) stretch of Interstate 80 in Wyoming, replacing the winter season speed reduction from 75 to 65 mph (121 to 105 km/h) that had been in place since 2008.[72][73] This Variable Speed Limit system has been proven effective in terms of reducing crash frequency and road closures.[74][75] Similarly, Interstate 90 at Snoqualmie Pass and other mountain passes in Washington State have variable speed limits as to slow traffic in severe winter weather.[71][76] As a response to fog-induced chain-reaction collisions involving 99 vehicles in 1990, a variable speed limit system covering 19 miles (31 km) of Interstate 75 in Tennessee was implemented in fog-prone areas around the Hiwassee River.[77] The Georgia Department of Transportation installed variable speed limits on part of Interstate 285 around Atlanta in 2014. These speeds can be as low as 35 mph (56 km/h) but are generally set to 35 mph (56 km/h).[78] In 2016, the Oregon Department of Transportation installed a variable speed zone on a 30 mi (48 km) stretch of Interstate 84 between Baker City and Ladd Canyon. The new electronic signs collect data regarding temperature, skid resistance, and average motorist speed to determine the most effective speed limit for the area before presenting the limit on the sign. This speed zone was scheduled to be activated November 2016.[citation needed] Ohio established variable speed limits on three highways in 2017, then in 2019 granted the authority to the Ohio Department of Transportation to establish variable limits on any of its highways.[79][80]
In the United Kingdom, a variable speed limit was introduced on part of the M25 motorway in 1995, on the busiest 14-mile (23 km) section from junction 10 to 16. Initial results suggested savings in journey times, smoother-flowing traffic, and a decrease in the number of crashes; the scheme was made permanent in 1997.[81] However, a 2004 National Audit Organisation report noted that the business case was unproved; conditions at the site of the Variable Speed Limits trial were not stable before or during the trial, and the study was deemed neither properly controlled nor reliable. Since December 2008 the upgraded section of the M1 between the M25 and Luton has had the capability for variable speed limits.[82] In January 2010 temporary variable speed cameras on the M1 between J25 and J28 were made permanent.[83]
New Zealand introduced variable speed limits in February 2001. The first installation was on the Ngauranga Gorge section of the dual carriageway on State Highway 1, characterized by steep terrain, numerous bends, high traffic volumes, and a higher than average accident rate. The speed limit is normally 80 km/h (50 mph).[84]
Austria undertook a short-term experiment in 2006, with a variable limit configuration that could increase statutory limits under the most favorable conditions, as well as reduce them. In June 2006, a stretch of motorway was configured with variable speed limits that could increase the general Austrian motorway limit of 130 to 160 km/h (81 to 99 mph).[85] Then Austrian Transport Minister Hubert Gorbach called the experiment "a milestone in European transport policy-despite all predictions to the contrary"; however, the experiment was discontinued.[citation needed]
Roads without speed limits
[edit]Just over half of the German autobahns have only an advisory speed limit (a Richtgeschwindigkeit), 15% have temporary speed limits due to weather or traffic conditions, and 33% have permanent speed limits, according to 2008 estimates.[86] The advisory speed limit applies to any road in Germany outside of towns which is either a dual carriageway or features at least two lanes per direction, regardless of its classification (e.g. Autobahn, Federal Highway, State Road, etc.), unless there is a speed limit posted, although it is less common for non-autobahn roads to be unrestricted. All other roads in Germany outside of towns, regardless of classification, do have a general speed limit of 100 km/h (62 mph), which is usually reduced to 80 km/h (50 mph) at Allée-streets (roads bordered by trees or bushes on one or both sites).[87] Travel speeds are not regularly monitored in Germany; however, a 2008 report noted that on the autobahn in Niemegk (between Leipzig and Berlin) "significantly more than 60% of road users exceed 130 km/h (81 mph) [and] more than 30% of motorists exceed 150 km/h (93 mph)".[88] Measurements from the state of Brandenburg in 2006 showed average speeds of 142 km/h (88 mph) on a 6-lane section of autobahn in free-flowing conditions.[89]
Prior to German reunification in 1990, accident reduction programs in eastern German states were primarily focused on restrictive traffic regulation. Within two years of reunification, the availability of high-powered vehicles and a 54% increase in motorized traffic led to a doubling of annual traffic deaths,[90] despite "interim arrangements [which] involved the continuation of the speed limit of 100 km/h (62 mph) on autobahns and of 80 km/h (50 mph) outside cities". An extensive program of the four Es (enforcement, education, engineering, and emergency response) brought the number of traffic deaths back to pre-unification levels after a decade of effort, while traffic regulations were conformed to western standards (e.g., 130 km/h (81 mph) freeway advisory limit, 100 km/h (62 mph) on other rural roads).[91]
Many rural roads on the Isle of Man have no speed limits;[92] a 2004 proposal to introduce general speed limits of 60 mph (97 km/h) and 70 mph (110 km/h) on Mountain Road, for safety reasons, was not pursued following consultation.[92] Measured travel speeds on the island are relatively low.[93]
The Indian states of Andhra Pradesh,[94] Maharashtra,[95] and Telangana[96] also do not have speed limits by default.
Roads formerly without speed limits
[edit]Many roads without a maximum limit became permanently limited following the 1973 oil crisis. For example, Switzerland and Austria had no maximum restriction prior to 1973 on motorways and rural roads, but imposed a temporary 100 km/h (62 mph) maximum limit in response to higher fuel prices; the limit on motorways was increased to 130 km/h (81 mph) later in 1974.[97][98][99]

Montana and Nevada were the last remaining U.S. states relying exclusively on the basic rule, without a specific, numeric rural speed limit before the National Maximum Speed Law of 1974.[100] After the repeal of federal speed mandates in December 1995, Montana was the only state to revert to the basic rule for daylight rural speed regulation. The Montana Supreme Court ruled that the basic rule was too vague to allow citation, prosecution, and conviction of a driver; concluding enforcement was a violation of the due process requirement of the Montana Constitution.[101] In response, Montana's legislature imposed a 75 mph (121 km/h) limit on rural freeways in 1999.[102]
Australia's Northern Territory had no rural speed limit until 2007, and again from 2014 to 2016. Sections of the Stuart Highway had no limits as part of an open speed limit trial.[103]
Method
[edit]Several methods exist to set up a speed limit:[104]
- Engineering
- Harm minimization
- Economic optimization
- Expert system
For instance, the Injury Minimization (known as Safe System) method takes into account the crash types that are likely to occur, the impact forces that result, and the tolerance of the human body to withstand these forces to set speed limit. This method is used in countries such as the Netherlands and Sweden.[105]
Operating speed
[edit]The Operating speed method sets the maximum speed at or around the 85th percentile speed, referred to as the 85th percentile rule.[106] It refers to a speed where 85% of vehicles travel at or below.[107][108][109][110] This reduces the need to enforce the speed limit, but also allows drivers to fail to select the appropriate travel speed, when they misjudge the risk their environment induces. This is one method used in the United States of America.[105] In France and many other European countries the vehicle traffic law known as V85 uses this principle to set the legal speed limit of a motorway such that 15% of drivers exceed the limit.[111][112]
Critics of the guideline say that it is inappropriate to let drivers set the speed limit for a road via their own recorded speed.[107][109] Once a speed limit has been set using the 85% rule, motorists tend to drive faster than that new speed limit.[107][109] A speed limit set using this methodology also does not take into account the safety of pedestrians in the area or bicyclists using the road.[107][109][113]
Public safety advocates have advocated for the Federal Highway Administration to change their guidance on the usage of the 85th percentile rule in updates to Manual on Uniform Traffic Control Devices.[113]
Enforcement
[edit]
Speed limit enforcement is the action taken by appropriately empowered authorities to check that road vehicles are complying with the speed limit. Methods used include roadside speed monitoring, set up and operated by the police, and automated roadside speed camera systems, which may incorporate the use of an automatic number-plate recognition system.[citation needed]
In 2012, in the UK, 30% of drivers did not comply with speed limits.[22]
In Europe, between 2009 and 2012, 20% of European drivers have been fined for excessive speed.[22] In 2012, in Europe, 62% of people supported the idea of setting up speed-limiting devices,[22] with adequate tolerance levels in order to limit driver confusion. One efficient scheme consists of penalty points and charges for speeding slightly over the speed limit.[22]
Another possibility is to alter the roadway by implementing traffic calming measures, vehicle activated signs, or safety cameras.[114]
The city of Munich has adopted self-explaining roads: roadway widths, intersection controls, and crossing types have been harmonized so that drivers assume the speed limit without a posted sign.[114]
Effectiveness
[edit]Compliance
[edit]Speed limits are more likely to be complied with if drivers have an expectation that the speed limits will be consistently enforced.[115]
To be effective and abided by, the speed limits need to be perceived as credible; they should be reasonable regarding factors such as how well the driver can see ahead and to the sides on a particular road.[22] Speed limits also need to conform to road infrastructure, education, and enforcement activity.[22]
(ONISR, 28 janvier 2019)[116] View source data.
In the UK, in 2017, the average free flow speed for each vehicle type is correlated with the applicable speed limit for that road type and for motorways and national speed limit single carriageway roads, the average free flow speed is below the designated speed limit for each vehicle type, except motorcycles on motorways.[117]
View source data.
Relationship with crash frequency
[edit]A 1998 US Federal Highway Administration report cited a number of studies regarding the effects of reductions in speed limits and the observed changes in speeding, fatalities, injuries and property damage which followed.[118] Some states increase penalties for more serious offenses, by designating as reckless driving, speeds greatly exceeding the maximum limit.[citation needed]
A 2018 OECD-ITF case study established a strong relationship between speed and crash frequency: when the mean speed decreases, the number of crashes and casualties decreases; to the contrary, when speed increases, the number of crashes and casualties increases. In no case was an increase in mean speed associated with a decrease in the number of crashes or casualties.[119]
View source data.
Relationship between change of mean speed and change of fatalities
Source OECD-ITF[119]
Source OECD-ITF[119]
| Country (year of research publication) | Speed limit reduction | Reported change |
|---|---|---|
| Australia (1992) | 110 to 100 km/h (68 to 62 mph) | Injury crashes declined by 19% |
| Australia (1996) | 5–20 km/h (3.1–12.4 mph) decreases | No significant change (4% increase relative to sites not changed) |
| Denmark (1990) | 60 to 50 km/h (37 to 31 mph) | Fatal crashes declined by 24% Injury crashes declined by 9% |
| Germany (1994) | 60 to 50 km/h (37 to 31 mph) | Crashes declined by 20% |
| Sweden (1990) | 110 to 90 km/h (68 to 56 mph) | Speeds declined by 14 km/h (8.7 mph) Fatal crashes declined by 21% |
| Switzerland (1994) | 130 to 120 km/h (81 to 75 mph) | Speeds declined by 5 km/h (3.1 mph) Fatal crashes declined by 12% |
| UK (1991) | 60 to 40 mph (97 to 64 km/h) | Speeds declined by 4 mph (6 km/h) Crashes declined by 14% |
| US (22 states) (1992) | 5 to 15 mph (8 to 24 km/h) decreases | No significant changes |
| NYC, US | 30 to 25 mph (48 to 40 km/h) decreases | 28% reduction in all fatalities and 48 percent reduction in pedestrian fatalities[120] |
| France (2018/'19) | Speed reduced from 90 to 80 km/h (56 to 50 mph) (-11%) since July 2018, on 400,000 kilometers of the secondary network covered by 1,000 speed cameras.[121]
Five million euros have been spent on communication to explain the benefits of the speed reduction to 80 km/h (50 mph), using various media, including television, radio, and social media (including 2 million euros for the "13 mètres" advertising movie explaining that speed reduction reduced braking distance by 13 m (43 ft)).[122] |
Effective median speed was reduced from 87.0 km/h (54.1 mph) in June 2018 to 82.6 km/h (51.3 mph) (-5%) in July 2018. Median speed was reduced of 3.9 km/h (2.4 mph) (-4.5%) from 87.0 to 83.2 km/h (54.1 to 51.7 mph) in September 2018.[116]
France to reach its historical best year for road fatalities, stopping a sequence of five years of increasing fatalities:
In 2020, previous results are confirmed for the year 2019: mean car speed was reduced between 2.9 and 3.9 km/h, while mean speed of trucks was reduced by 2 km/h without speed limit change. By the same time, fatalities were reduce by 125 in the second semester 2018, by 84 in the first semester 2019, and 127 for the second semester 2019.[126] However, results were not repeated in overseas territories. Final report considered speed limit change induced a 3.5 km/h (2.2 mph) speed decrease and saved 349 lives during the two years which last 20 months[127] |
| Spain (2019) | Decrease speed from 100 to 90 km/h (62 to 56 mph) | In Spain the year 2019 was the best year with the fewest people killed outside a built-up area.
The number of people killed outside built-up areas decreased by 7.6% while the number of people killed on regular roads decreased by 9.5%. The number of people killed in cars outside built-up areas decrease by 16% from 598 to 503.[128] |
| Country | Speed limit increase | Reported change |
|---|---|---|
| Australia (1992) | 100 to 110 km/h (62 to 68 mph) | Injury crashes increased by 25% |
| Australia (Victoria) (1996) | 5–20 km/h (3.1–12.4 mph) increases | Crashes increased overall by 8%, 35% decline in zones raised from 60 to 80 km/h (37 to 50 mph) |
| Netherlands (2012) | 120 to 130 km/h (75 to 81 mph) | Effect as of yet unclear, more research needed |
| US (1989) | 55 to 65 mph (89 to 105 km/h) | Fatal crashes increased by 21% |
| US (1990) | 55 to 65 mph (89 to 105 km/h) | Fatal crashes increased by 22% Speeding increased by 48% |
| US (40 states) (1990) | 55 to 65 mph (89 to 105 km/h) | Fatalities increased by 15% Decrease or no effect in 12 states |
| US (Iowa) (1996) | 55 to 65 mph (89 to 105 km/h) | Fatal crashes increased by 36% |
| US (Michigan) (1991) | 55 to 65 mph (89 to 105 km/h) | Fatal and injury crashes increased significantly on rural freeways |
| US (Michigan) (1992) | Various | No significant changes |
| US (Ohio) (1992) | 55 to 65 mph (89 to 105 km/h) | Injury and property damage increased but not fatal crashes.[129] |
| US (40 states) (1994) | 55 to 65 mph (89 to 105 km/h) | Statewide fatality rates decreased 3–5% (Significant in 14 of 40 states) |
| US (22 states) (1997) | 5 to 15 mph (8 to 24 km/h) increase | No significant changes |
South Dakota increased its maximum speed limit from 65 to 75 mph (105 to 121 km/h) in 1996. Annual surveys of speed on South Dakota Interstate roads show that from 2000 to 2011, the average speed rose from 71 to 74 mph (114 to 119 km/h).[130] A 1999 study found that the U.S. states that increased speed limits in the wake of the repeal of federally mandated speed limits had a 15% increase in fatalities.[131]
The Synthesis of Safety Research Related to Speed and Speed Limits report sponsored by the Federal Highway Administration, published in 1998, found that changing speed limits on low and moderate speed roads appeared to have no significant effect on traffic speed or the number of crashes, whilst on high-speed roads such as freeways, increased speed limits generally resulted in higher traffic speeds and more crashes. The report stated that limited evidence suggests that speed limits have a positive effect on a system wide basis.[n 2]
Research in 1998 showed that the reduction of some 30 mph (48 km/h) United Kingdom speed limits to 20 mph (32 km/h) had achieved only a 1 mph (1.6 km/h) drop in speeds and no discernible reduction in accidents; 20 mph (32 km/h) speed limit zones, which use self-enforcing traffic calming, achieved average speed reductions of 10 mph (16 km/h); child pedestrian accidents were reduced by 70% and child cyclist accidents by 48%.[132] Zones where speeds are set at 30 km/h (or 20 mph) are gaining popularity[133] as they are found to be effective at reducing crashes and increasing community cohesion.[134]
Studies undertaken in conjunction with Australia's move from 60 km/h (37 mph) speed limits to 50 km/h (31 mph) in built-up areas found that the measure was effective in reducing speed and the frequency and severity of crashes.[135] A study of the impact of the replacement of 60 km/h (37 mph) with 50 km/h (31 mph) speed limits in New South Wales, Australia, showed only a 0.5 km/h (0.3 mph) drop in urban areas and a 0.7 km/h (0.4 mph) drop in rural areas. The report noted that widespread community compliance would require a combination of strategies including traffic calming treatments.[136] Information campaigns are also used by authorities to bolster support for speed limits, for example the "Speeding. No one thinks big of you." campaign in Australia in 2007.
Justification
[edit]Speed limits are set primarily to balance road traffic safety concerns with the effect on travel time and mobility. Speed limits are also sometimes used to reduce consumption of fuel or in response to environmental concerns (e.g. to reduce vehicle emissions or fuel use).[137] Some speed limits have also been initiated to reduce gas-oil imports during the 1973 oil crisis.[138]
Road traffic safety
[edit]
According to a 2004 report from the World Health Organization, 22% of all injury mortality worldwide was from road traffic injuries in 2002,[n 3] and without "increased efforts and new initiatives" casualty rates would increase by 65% between 2000 and 2020.[n 4] The report identified that the speed of vehicles was "at the core of the problem",[n 5] and recommended that speed limits be set appropriately for the road function and design, along with the implementation of physical measures related to the road and the vehicle, and increased effective enforcement by the police.[n 6] Road incidents are said to be the leading cause of deaths among children 10–19 years of age (260,000 children die a year; 10 million are injured).[139]
Maximum speed limits place an upper limit on speed choice and, if obeyed, can reduce the differences in vehicle speeds by drivers using the same road at the same time.[n 7] Traffic engineers observe that the likelihood of a crash happening is significantly higher if vehicles are traveling at speeds faster or slower than the mean speed of traffic;[n 8] when severity is taken into account, the risk is lowest for those traveling at or below the median speed and "increases exponentially for motorists travelling much faster".[n 9]

It is desirable to attempt to reduce the speed of road vehicles in some circumstances because the kinetic energy involved in a motor vehicle collision is proportional to the square of the speed at impact. The probability of a fatality is, for typical collision speeds, empirically correlated to the fourth power of the speed difference (depending on the type of collision, not necessarily the same as travel speed) at impact,[140] rising much faster than kinetic energy.[citation needed]
Kinetic energy:

Braking distance during danger

This graph was using the legacy Graph extension, which is no longer supported. It needs to be converted to the new Chart extension. |
Typically motorways have higher speed limits than conventional roads because motorways have features which decrease the likelihood of collisions and the severity of impacts. For example, motorways separate opposing traffic and crossing traffic, employ traffic barriers, and prohibit the most vulnerable users such as pedestrians and bicyclists. Germany's crash experience illustrates the relative effectiveness of these strategies on crash severity: on autobahns 22 people died per 1,000 injury crashes, a lower rate than the 29 deaths per 1,000 injury accidents on conventional rural roads. However, the rural risk is five times higher than on urban roads; speeds are higher on rural roads and autobahns than urban roads, increasing the severity potential of a crash.[42] The net effect of speed, crash probability, and impact mitigation strategies may be measured by the rate of deaths per billion-travel-kilometres: the autobahn fatality rate is 2 deaths per billion-travel-kilometres, lower than either the 8.7 rates on rural roads or the 5.3 rate in urban areas. The overall national fatality rate was 5.6, slightly higher than urban rate and more than twice that of autobahns.[143]
The 2009 technical report An Analysis of Speeding-Related Crashes:Definitions and the Effects of Road Environments by the National Highway Traffic Safety Administration showed that about 55% of all speeding-related crashes when fatal listed "exceeding posted speed limits" among their crash factors, and 45% had "driving too fast for conditions" among their crash factors. However, the authors of the report did not attempt to determine whether the factors were a crash cause, contributor, or an unrelated factor.[144] Furthermore, separate research finds that only 1.6% of crashes are caused by drivers that exceed the posted speed limit.[145] Finally, exceeding the posted limit may not be a remarkable factor in the crash analysis as there are roadways where virtually all motorists are in technical violation of the law.[146]
The speed limit will also take note of the speed at which the road was designed to be driven (the design speed), which is defined in the US as "a selected speed used to determine the various geometric design features of the roadway".[147] However, traffic engineers recognize that "operating speeds and even posted speed limits can be higher than design speeds without necessarily compromising safety"[148] since design speed is "based on conservative assumptions about driver, vehicle and roadway characteristics".[58]
Vision Zero, which envision reducing road fatalities and serious injuries to zero by 2020, suggests the following "possible long term maximum travel speeds related to the infrastructure, given best practice in vehicle design and 100% restraint use":[149]
| Type of infrastructure and traffic | Possible travel speed (km/h) |
|---|---|
| Locations with possible conflicts between pedestrians and cars | 30 km/h (19 mph) |
| Intersections with possible side impacts between cars | 50 km/h (31 mph) |
| Roads with possible frontal impacts between cars, including rural roads[150] | 70 km/h (43 mph) |
| Roads with no possibility of a side impact or frontal impact (only impact with the infrastructure) | 100 km/h (62 mph)+ |
"Roads with no possibility of a side impact or frontal impact" are sometimes designated as Type 1 (motorways/freeways/Autobahns), Type 2 ("2+2 roads"), or Type 3 ("2+1 roads").[151] These roadways have crash barriers separating opposing traffic, limited access, grade separation and prohibitions on slower and more vulnerable road users. Undivided rural roads can be quite dangerous even with speed limits that appear low by comparison. For example, in 2011, Germany's 100 km/h (62 mph)-limited rural roads had a fatality rate of 8.7 deaths per billion travel-km, over four times higher than the autobahn rate of 2 deaths.[143] Autobahns accounted for 31% of German road travel in 2011,[143] but just 11% (453 of 4,009) of traffic deaths.
In 2018, an IRTAD WG published a document which recommended maximum speed limits, taking into account forces the human body can tolerate and survive.[119]
| Type of infrastructure and traffic | Possible travel speed (km/h) |
|---|---|
| Locations (built up areas) with possible conflicts between pedestrians and cars | 30 km/h (19 mph) or 40 km/h (25 mph) |
| Intersections with possible side impacts between cars | 50 km/h (31 mph) |
| rural roads without median barrier, with risk of head-on collisions | 70 km/h (43 mph) or 80 km/h (50 mph) |
| Source IRTAD, 2018 | |
Fuel efficiency
[edit]Fuel efficiency sometimes affects speed limit selection. The United States instituted a National Maximum Speed Law of 55 mph (89 km/h), as part of the Emergency Highway Energy Conservation Act, in response to the 1973 oil crisis to reduce fuel consumption.[152] According to a report published in 1986 by The Heritage Foundation, a Conservative advocacy group, the law was widely disregarded by motorists and hardly reduced consumption at all.[153] In 2009, the American Trucking Associations called for a 65 mph (105 km/h) speed limit, and also national fuel economy standards, claiming that the lower speed limit was not effective at saving fuel.[154]
Environmental considerations
[edit]Speed limits can also be used to improve local air quality issues or other factors affecting environmental quality[155] (e.g. the "environmental speed limits" in an area of Texas).[156] The European Union is also increasingly using speed limits as in response to environmental concerns.[137] European studies have stated that, whereas the effects of specific speed reduction schemes on particulate emissions from trucks are ambiguous, lower maximums speed for trucks consistently result in lower emissions of CO2 and better fuel efficiency.[155]
Advocacy
[edit]Speed limits, and especially some of the methods used to attempt to enforce them, have always been controversial. A variety of organisations and individuals either oppose or support the use of speed limits and their enforcement.
Opposition
[edit]Speed limits and their enforcement have been opposed by various groups and for various reasons since their inception. In the UK, the Motorists' Mutual Association (est. 1905) was formed initially to warn members about speed traps; the organisation would go on to become the AA.[157]
More recently, advocacy groups seek to have certain speed limits as well as other measures removed. For example, automated camera enforcement has been criticised by motoring advocacy groups including the Association of British Drivers, and the German Auto Club (ADAC).[158]
Arguments used by those advocating a relaxation of speed limits or their removal include:
- A 1994 peer-reviewed paper by Charles A. Lave et al. titled "Did the 65 mph Speed Limit Save Lives?" which states as evidence that a higher speed limit may create a positive shift in traffic to designated safer roads.[159]
- A 1998 report in the Wall Street Journal titled "Highways are safe at any speed", stating when speed limits are set artificially low, tailgating, weaving and speed variance (the problem of some cars traveling significantly faster than others) make roads less safe.[160]
- A 2007 ePetition to the UK government calling for speed cameras to be scrapped on the basis that the benefits were exaggerated and that they may actually increase casualty levels, conducted by Safe Speed, a UK advocacy organisation campaigning for higher speed limits, which received over 25,000 signatures.[161][162][163]
- A 2008 declaration by the German Automobile Manufacturer's Association calling general limits "patronizing",[164] arguing instead for variable speed limits. The Association also stated that "raising the speed limits in Denmark (in 2004 from 110 to 130 km/h (68 to 81 mph))[165][166] and Italy (2003 increase on six-lane highways from 130 to 150 km/h (81 to 93 mph)) had no negative impact on traffic safety. The number of accidental deaths even declined".[167]
- In a 2010 ADAC report, it was said that an autobahn speed limit was unnecessary because numerous countries with a general highway speed limit had worse safety records than Germany.[158] However, more recent data show that Germany ranks in the lower middle field in a Europe-wide comparison regarding the number of fatalities per billion vehicle kilometers traveled on motorways.[168] ETSC considers that those data are not comparable, because estimations of the number of kilometers traveled are not estimated the same way in different countries.[169] Since 2020, the ADAC is "nicht mehr grundsätzlich" ("no longer in principle") against a speed limit on autobahns.[170]
Support
[edit]Various other advocacy groups press for stricter limits and better enforcement. The Pedestrians Association was formed in the United Kingdom in 1929 to protect the interests of the pedestrian. Their president published a critique of motoring legislation and the influence of motoring groups in 1947 titled "Murder most foul", which laid out in an emotional but detailed view of the situation as they saw it, calling for tighter speed limits.[171] Historically, the Pedestrians' Association and the Automobile Association were described as "bitterly opposed" in the early years of United Kingdom motoring legislation.[172] More recently organisations such as RoadPeace, Twenty is Plenty, and Vision Zero have campaigned for lower speed limits in residential areas. In the United States, advocacy groups favoring stricter limits and better enforcement include the Advocates for Highway and Auto Safety, Insurance Institute for Highway Safety and the National Safety Council.
In the US, the DOT FHWA has written in a report that "For a given roadway type, there is a strong statistical relationship between speed and crash risk for speeds in the range of 15 mph to 75 mph (25 km/h to 120 km/h). When the mean speed of traffic is reduced, the number of crashes and the severity of injuries will almost always go down.".[173]
Signage
[edit]
,_StVO_1981.svg)
Most countries worldwide measure speed limits in kilometres per hour, while the United Kingdom, United States, and several smaller countries measure speed limits in miles per hour instead. Signs in Samoa display both units simultaneously.
There are two basic designs for speed limit signs: the Vienna Convention on Road Signs and Signals specifies a white or yellow circle with a red border, while the Manual on Uniform Traffic Control Devices (MUTCD) published by the United States Federal Highway Administration specifies a white rectangle with the legend SPEED LIMIT. Vienna-style speed limit signs originated in Europe and are used in most of the world, including many countries that otherwise follow the MUTCD. Variations on the MUTCD design are used in Canada, Guam, Liberia, Puerto Rico,[175] the mainland United States, the U.S. Virgin Islands. Australia also used a variation on the MUTCD design until the country metricated in 1974. The Central American Integration System (SICA) equivalent to the US MUTCD, specifies a variation on the MUTCD design as an option, though not widely used.[176]
In the United States, Canada, Australia and Peru, speed limit signs are rectangular. In most of the United States, speed limit signs bear the words SPEED LIMIT above the numeric speed limit, as specified in the MUTCD. However, in Alaska and California, speed limits are often labeled MAXIMUM SPEED instead. In Oregon, most speed limit signs are simply labeled SPEED. Canada has similar signs bearing the legend MAXIMUM, which has a similar meaning in English and French, the country's two main languages. Peru uses a similar, reversed variation of the MUTCD order in which the words VELOCIDAD MAXIMA (speed limit) are placed below the numeric limit. Australia uses the same rectangular design, but inscribes the numeric speed limit within a red circle as in Vienna Convention signs.[177] The MUTCD formerly specified an optional metric design that included the words SPEED LIMIT and the numeric limit inscribed within a black circle, though it was rarely used in the United States;[178] this design is still occasionally found in Liberia.[179][180][181] Speed limit signs of Mexico and Panama are square, unlike the United States.
In the European Union, large signposts showing the national (maximum) speed limits of the respective country are usually erected immediately after border crossings, with a repeater sign some 200 to 500 m (660 to 1,640 ft) after the first. Some places provide an additional "speed zone ahead" ahead of the restriction, and speed limit reminder signs may appear at regular intervals, which may be painted on the road surface.[182]
In Ontario, the type, location, and frequency of speed limit signs are covered by regulation 615 of the Ontario Highway Traffic Act.[183]
Maximum speed limit
[edit]_city_limit_sign.JPG)
-
 Speed limit sign for 50 km/h (Vienna Convention Sign C14, most of the world follows this pattern)
 -
 UK sign for 50 mph
 -

-
 Alternative Vienna Convention sign with an amber background used in few countries, such as Sweden, Finland and Iceland
 -
 Ireland includes the text "km/h" since going metric in 2005
 -
 Indonesia (in km/h) includes the text "km" on the top right corner; this model was also used by a number of European countries such as Germany, Italy and Switzerland until the 1960s.
 -
 Japan uses blue numerals; km/h
 -
 China (Mainland); km/h
 -

-
-

-
 Canada (Ontario)
 -
 Canada (Yukon and British Columbia)
 -
 United States (in mph)
 -
 United States (Oregon variant)
 -
![United States (New York variant; "CITY", "VILLAGE", "TOWN", or a variant of the word "AREA" can be used in place of "STATE")[184]](//upload.wikimedia.org/wikipedia/commons/thumb/e/e4/NYSDOT_NYR2-2.svg/120px-NYSDOT_NYR2-2.svg.png)
-
 United States (metric)
 -
 Peru (metric, all speed limit signs are rectangular, and the reversed MUTCD order is used there)


.svg)


.svg)
.svg)
.svg)


![United States (New York variant; "CITY", "VILLAGE", "TOWN", or a variant of the word "AREA" can be used in place of "STATE")[184]](https://en.wikipedia.org/wiki/File:NYSDOT_NYR2-2.svg)


Some speed limits are applicable to a zone.
-
 Zone 30 entry in Germany with 30 km/h speed limit
 -
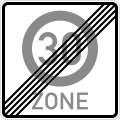 Zone 30 end in Germany
 -
 Zone 30 entry in France with 30 km/h speed limit
 -
 Zone 30 end in France

,_StVO_2013.svg)
.svg)
.svg)
Minimum speed limit
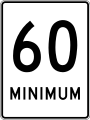
[edit]Minimum speed limits are often expressed with signs using blue circles, based on the obligatory sign specifications of the Vienna Convention on Road Signs and Signals. In the United States, minimum speed limit signs are identical to their respective maximum speed limit signs, with SPEED LIMIT replaced with MINIMUM SPEED.[citation needed] Some South American countries such as Argentina, use a blue sign with a red border[citation needed] Japan[185] and South Korea[citation needed] use their normal speed limit sign, with a line below the limit. Columbia also uses a normal speed limit sign with the word MIN below the numbers.[citation needed]
-
 Common minimum speed limit sign
 -

-
 Argentina, km/h
 -
-
 Chile; km/h
 -
 China (Mainland); km/h
 -
 Colombia; km/h
 -
 Indonesia (includes the text "km" on the top right corner); km/h
 -
 Japan; km/h
 -
 Philippines; km/h
 -
 South Korea; km/h
 -
 UK minimum speed limit sign, in mph
 -
 United States; mph
 -
 United States (dual maximum and minimum speeds)
 -
 United States (metric)
 -
 United States (metric, dual maximum and minimum speeds)


.svg)
.svg)

.svg)
.svg)
.svg)


Special speed limits
[edit]In some countries, speed limits may apply to certain classes of vehicles or special conditions such as night-time. Usually, these speed limits will be reduced from the normal limit for safety reasons.
-
 Australia – Speed limit during certain times
 -
 Australia – Road Train speed limit
 -
 New Zealand – Limited Speed Zone (Maximum speed limit is 100 km/h (62 mph), reduces to 50 km/h (31 mph) if dangerous conditions exist such as bad weather)
 -
 Romania – Car and truck speed limit
 -
 United States – Roadworks zone speed limit
 -
 United States – Trucks speed limit
 -
 United States – Towed vehicles speed limit
 -
 United States – Night time speed limit
 -
 Unique speed limit sign in the United States on evacuation routes requiring drivers to maintain the maximum safe speed


Speed limit derestriction
[edit]

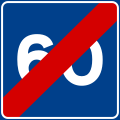
In some countries, derestriction signs are used to mark where a speed zone ends. The speed limit beyond the sign is the prevailing limit for the general area; for example, the sign might be used to show the end of an urban area. In the United Kingdom, the sign means that the national speed limit applies (60 mph (97 km/h) on open roads and 70 mph (110 km/h) on dual carriageways and motorways). In New Zealand it means you are on an open road, but the maximum legal speed of 100 km/h (62 mph) still applies.[186] On roads without general speed limits, such as portions of the German Autobahn and rural areas on the Isle of Man, it means the end of all quantitative speed limits.[187]
-
 Common maximum speed limit derestriction sign
 -
 Common minimum speed limit derestriction sign
 -
 Common advisory speed limit derestriction sign
 -
![Australia,[188] now relatively rare](//upload.wikimedia.org/wikipedia/commons/thumb/a/ac/Australia_road_sign_R4-2.svg/120px-Australia_road_sign_R4-2.svg.png)
-
 Australia
 -

-
 China (Mainland)
 -

-

-
 Japan – Left arrow (Right arrow means "from here")
 -

-
 Philippines
 -
 End speed limit 35 mph United States
 -
 End speed limit (custom) United States (archaic)


![Australia,[188] now relatively rare](https://en.wikipedia.org/wiki/File:Australia_road_sign_R4-2.svg)
.svg)

.svg)

_and_507-C.svg)
_and_507-A.svg)

.svg)


Advisory speed limit
[edit]
Advisory speed limits may provide a safe suggested speed in an area, or warn of the maximum safe speed for dangerous curves.[citation needed]
In Germany, an advisory speed limit may be combined with a traffic signal to recommend the speed at which drivers should drive to reach the next light at its green phase, thereby avoiding a stop.[189][190]
Technology
[edit]Some European cars include in-vehicle systems that support drivers’ compliance with the speed limit, known as intelligent speed adaptation (ISA). ISA supports drivers in complying with the speed limit in various parts of the network, while speed limiters for heavy goods vehicles and coaches only govern the maximum speed. These systems have positive effects on speed behaviour, and improve safety. A speed-limiting device, such as ISA are considered useful by 25% of European car drivers.[191] In 2019, Google Maps integrated alerts for speed traps within its application, along with audible alerts for nearby speed cameras.[192] The technology was first developed by Waze, with requests for it to be removed from the application by police officers.[193]
See also
[edit]Notes
[edit]- ^ World Health Organization (2004)
- ^ Federal Highway Administration (1998, p. 2) 'In general, changing speed limits on low and moderate speed roads appears to have little or no effect on speed and thus little or no effect on crashes, thereby suggesting that drivers travel at speeds they feel are reasonable and safe for the road and traffic regardless of the posted limit. However, on freeways and other high-speed roads, the speed limit increases generally lead to higher speeds and crashes. The change in speed is roughly one-fourth the change in speed limit. Results from international studies suggest that for every 1 mph (1.6 km/h) change in speed, injury accidents will change by 5 percent (3 percent for every 1 km/h (0.62 mph)). However, limited evidence suggests the net effect of speed limits may be positive on a system wide basis.'
- ^ World Health Organization (2004) p. 34 fig 2.1
- ^ World Health Organization (2004) p. 3
- ^ World Health Organization (2004) p. 76
- ^ World Health Organization (2004) p. 127
- ^ Federal Highway Administration (1998, p. 2)
- ^ British Columbia Ministry of Transportation (2003), p. v 'The likelihood of a crash occurring is significantly greater for motorists traveling at speed slower and faster than the mean speed of traffic'
- ^ Federal Highway Administration (1998, p. 2) 'When the consequences of crashes are taken into account, the risk of being involved in an injury crash is lowest for vehicles that travel near the median speed or slower and increases exponentially for motorists traveling much faster'
Documents referenced from 'Notes' section
[edit]- Federal Highway Administration (1998). "Synthesis of Safety Research Related to Speed and Speed Limits" (PDF). Archived from the original (PDF) on 28 May 2010. Retrieved 23 September 2013.
- British Columbia Ministry of Transportation (Spring 2003). "Review and Analysis of Posted Speed Limits and Speed Limit Setting Practices in British Columbia" (PDF). Retrieved 16 May 2019.
- World Health Organization (2004). World report on road traffic injury prevention. World Health Organization. ISBN 92-4-156260-9. Retrieved 13 April 2010.
- Department for Transport (2008). "Reported Road Casualties Great Britain: 2008 Annual Report" (PDF). Retrieved 9 January 2010.
References
[edit]- ^ MINIMUM SPEED: REGULATION AND PENALTIES IN AUSTRIA, 23.02.2016, Autorevue Austria.
- ^ "Driving on the Autobahn". www.german-way.com. Retrieved 14 April 2019.
- ^ Aubin, Jean-Pierre; Désilles, Anya (13 July 2016). Traffic Networks as Information Systems: A Viability Approach. Springer. ISBN 9783642547713.
- ^ a b Ritchie, Hannah (8 September 2025). "How Britain built some of the world's safest roads". Our World in Data.
- ^ Pietrasik, T (21 June 2021). "Road traffic injuries". www.who.int. Retrieved 25 December 2021.
- ^ "Germany considers Autobahn speed limit to fight climate change". The Local Germany. 21 January 2019. Retrieved 14 April 2019.
- ^ "The impact of lowered speed limits in urban and metropolitan areas" (PDF).
- ^
Parker, M. R. Jr. (1997). Effects of Raising and Lowering Speed Limits on Selected Roadway Sections, FHWA-RD-9 7-084 (PDF). Washington DC: Federal Highway Commission. pp. 85–87. Retrieved 5 February 2017.
There is statistically sufficient evidence [...] to reject the hypothesis that driver speeds do not change when posted speed limits are either raised or lowered.
- ^
Great Britain: Parliament: House of Commons: Transport Committee (2 August 2005) [November 2004]. "Memorandum by Greenspeed (RP22)". Road Pricing: The Next Steps; Seventh Report of Session 2004-05, Volume 2. Volume 218 of Paper (Great Britain. Parliament. (Session 2004-05). House of Commons)). London: The Stationery Office (published 2005). p. 171. ISBN 9780215025661. Retrieved 9 December 2021.
The introduction of lower speed limits could be extremely cheap and need not be delayed. [...] Just as modern cars have top speeds suitable for German Autobahns, if the 70 mph (110 km/h) limit is maintained car design will not make the changes necessary to an integrated and sustainable transport system.
- ^ a b "Connecticut enacts first speed-limit law". history.com. 13 November 2009. Retrieved 14 April 2019.
- ^ Willett, T.C. (2001) [1964]. Criminal on the Road: A Study of Serious Motoring Offences and Those Who Commit Them. Abingdon, UK: Routledge. p. 64. ISBN 0415264162.
- ^ Kemp, Ben (18 May 2018). "The Thin Blue Line". Ulysses S. Grant Cottage National Historic Landmark. Retrieved 2 April 2023.
- ^ Rosenwald, Michael S. (16 December 2018). "The police officer who arrested a president". The Washington Post. Retrieved 2 April 2023.
- ^ "Locomotive Act 1861". www.legislation.gov.uk. Retrieved 14 April 2019.
- ^ "History of the Run". Veteran Car Run 2024. Retrieved 9 September 2025.
- ^ "Motoring firsts". National Motoring Museum. Archived from the original on 14 January 2016. Retrieved 1 December 2009.
- ^ Davis, Adam Hart. "The Eureka Years". BBC Radio 4.
- ^ "US History, Criminal Justice, The first speeding ticket". Archived from the original on 3 May 2010.
- ^ "D. C. Pastor Fined for Speed and Contempt in N. H. Police Court". The Washington Times. 20 August 1920. p. 1.
- ^ "The history of speed limits in the UK". Read Cars. 20 June 2017. Retrieved 14 April 2019.
- ^ "Keeping Order: Motor-Car Regulation and the Defeat of Victoria's 1905 Motor-Car Bill". Archived from the original on 18 March 2015. Retrieved 25 February 2015.
On 7 April 1905, E Norton Grimwade ...appeared in the District Court [charged with] 'furious' driving [because] he passed a tram ... Several people ... [estimated] the car's speed at 20 mph ... It was going twice as fast as the tram.
- ^ a b c d e f g h i "Speed limits: A review of compliance" (PDF). www.racfoundation.org. 2012. Retrieved 29 December 2020.
- ^ Cowley, J.E. (January 1980). A Review of Rural Speed Limits in Australia. Victoria, Australia: The Office of Road Safety Commonwealth Department of Transport. pp. 6–7.
- ^ Vienna Convention on Road Traffic
- ^ "Road Traffic Act 1991". Office of Public Sector Information. Retrieved 3 May 2010.
A person is guilty of an offence if he intentionally and without lawful authority or reasonable cause— (a) causes anything to be on or over a road, or (b) interferes with a motor vehicle, trailer or cycle, or (c) interferes (directly or indirectly) with traffic equipment, in such circumstances that it would be obvious to a reasonable person that to do so would be dangerous. (2) In subsection (1) above "dangerous" refers to danger either of injury to any person while on or near a road, or of serious damage to property on or near a road; and in determining for the purposes of that subsection what would be obvious to a reasonable person in a particular case, regard shall be had not only to the circumstances of which he could be expected to be aware but also to any circumstances shown to have been within the knowledge of the accused.
- ^ "§ 3 StVO 2013 - Einzelnorm". www.gesetze-im-internet.de.
- ^ "Section 2 : Maîtrise de la vitesse. (Articles R413-17 à R413-19) - Légifrance". www.legifrance.gouv.fr.
- ^ "On Gravel Roads, People Drive At Speed They Are Comfortable With, Regardless Of Posted Limit". Retrieved 13 October 2010.
"We found that people are driving at speeds based on their perceptions and existing conditions – regardless of the speed limit," said Dissanayake, who also is a faculty member with K-State's University Transportation Center...when it came to speed limits, and the actual speeds are driven, the difference was not significant between 35 mph (56 km/h) and 55 mph (89 km/h) roads. An example is the gravel roadways in Johnson County and Miami County. The study found that though two-speed limits exist, the driving characteristics were the same. While Johnson County's speed limit is 35 mph (56 km/h) and posted, the average actual speed of 37.5 mph (60.4 km/h) was higher than the average actual speed of 35.8 mph (57.6 km/h) in Miami County, where the speed limit is 55 mph (89 km/h) and not posted.
- ^ "Hatzakorzian v. Rucker-Fuller Desk Co., 197 Cal. 82". Official California Reports, Vol. 197, p. 82 (California Supreme Court reporter). 21 September 1925.
Under the circumstances of the present case – the narrowness of the unpaved portion of the highway, the darkness of the night and the blinding of Kennell by the glare of the lights reflected from the headlights of the approaching machine – the highway over which Kennell was traveling was beset by danger of an extraordinary character from the time his vision became so obscured as to make it impossible for him to see plainly the road before him to the time that he struck the deceased. Thus the ordinary care with which Kennell was charged in driving his car over the highway required such an amount of such care as was commensurate with the exactions of the extraordinary dangerous circumstances under which he was then operating his car. The respective rights and duties of drivers of automobiles and other vehicles and of pedestrians have repeatedly been by the courts of this state clearly pointed out...
- ^ "Allin v. Snavely". Official California Appellate Reports (Report). 2nd Series Vol. 100. 14 November 1950. p. 411. Retrieved 27 July 2013.
"A driver by insisting on his lawful right of way may violate the basic speed law as provided by Veh. Code, § 22350, and thus become guilty of negligence." (CA Reports Headnote #[2])
- ^ "Riggs v. Gasser Motors". Official California Appellate Reports (Report). 2nd Series Vol. 22. 25 September 1937. p. 636. Retrieved 27 July 2013.
It is common knowledge that intersecting streets in cities present a continuing hazard, the degree of hazard depending upon the extent of the use of the intersecting streets and the surrounding circumstances or conditions of each intersection. Under such circumstances, the basic [speed] law...is always governing.
See Official Reports Opinions Online - ^ "Leeper v. Nelson, 139 Cal. App. 2d 65". Official California Appellate Reports (2nd Series Vol. 139, p. 65). 6 February 1956. Retrieved 27 July 2013.
The operator of an automobile is bound to anticipate that he may meet persons or vehicles at any point of the street, and he must in order to avoid a charge of negligence, keep a proper lookout for them and keep his machine under such control as will enable him to avoid a collision with another automobile driven with care and caution as a reasonably prudent person would do under similar conditions.
See Huetter v. Andrews, 91 Cal. App. 2d 142, Berlin v. Violett, 129 Cal.App. 337, Reaugh v. Cudahy Packing Co., 189 Cal. 335, and Official Reports Opinions Online - ^ "An Analysis of Speeding-Related Crashes:Definitions and the Effects of Road Environments" (PDF). U.S. Department of Transportation, National Highway Traffic Safety Administration. February 2009. Archived from the original (PDF) on 20 March 2009. Retrieved 25 April 2010.
Appendix: The basic rules governing the speed of vehicles in Kansas, Kentucky, Maryland, Montana, North Carolina, and Wisconsin.
- ^ "49 CFR 392.14 - Hazardous conditions; extreme caution". LII / Legal Information Institute.
- ^ "State v. Stanko". Supreme Court of Montana. 1998.
- ^ "Section 2 – Driving Safely". Commercial Driver License Manual 2005. United States Department of Transportation. July 2014. pp. 2–15, 2–19, 2–26, 13–1. Archived from the original (PDF) on 26 July 2014.
[pg 2-15] 2.6.4 – Speed and Distance Ahead: You should always be able to stop within the distance you can see ahead. Fog, rain, or other conditions may require that you slow down to be able to stop in the distance you can see. ... [pg 2-19] 2.8.3 – Drivers Who Are Hazards: Vehicles may be partly hidden by blind intersections or alleys. If you only can see the rear or front end of a vehicle but not the driver, then he or she can't see you. Be alert because he/she may back out or enter into your lane. Always be prepared to stop. ... [pg 2-26] 2.11.4 – Vehicle Factors: Headlights. At night your headlights will usually be the main source of light for you to see by and for others to see you. You can't see nearly as much with your headlights as you see in the daytime. With low beams, you can see ahead about 250 feet and with high beams about 350-500 feet. You must adjust your speed to keep your stopping distance within your sight distance. This means going slowly enough to be able to stop within the range of your headlights. ... [pg 13-1] 13.1.2 – Intersections As you approach an intersection: Check traffic thoroughly in all directions. Decelerate gently. Brake smoothly and, if necessary, change gears. If necessary, come to a complete stop (no coasting) behind any stop signs, signals, sidewalks, or stop lines maintaining a safe gap behind any vehicle in front of you. Your vehicle must not roll forward or backward. When driving through an intersection: Check traffic thoroughly in all directions. Decelerate and yield to any pedestrians and traffic in the intersection. Do not change lanes while proceeding through the intersection. Keep your hands on the wheel.
- ^ "California Vehicle Code section 22350: Basic Speed Law". California Department of Motor Vehicles. 20 September 1963. Archived from the original on 5 May 2010. Retrieved 25 April 2010.
No person shall drive a vehicle upon a highway at speed greater than is reasonable or prudent having due regard for weather, visibility, the traffic on, and the surface and width of, the highway, and in no event at a speed which endangers the safety of persons or property.
- ^ "Reaugh v. Cudahy Packing Co., 189 Cal. 335". Official California Reports, Vol. 189, p. 335, (California Supreme Court reporter). 27 July 1922. Retrieved 27 July 2013.
This is but a reiteration of the rule, in statutory form, which has always been in force without regard to a statutory promulgation to the effect that drivers or operators of vehicles, and more particularly motor vehicles, must be specially watchful in anticipation of the presence of others at places where other vehicles are constantly passing, and where men, women, and children are liable to be crossing, such as corners at the intersections of streets or other similar places or situations where people are likely to fail to observe an approaching automobile.
- ^ "TEMECULA: Inquiries prompt new speed survey". 13 August 2015.
- ^ "FindLaw's Supreme Court of Montana case and opinions". Findlaw.
- ^ Vincenzes, Brent. "4 ways Virginia Reckless Driving charges are handled differently in Fairfax County, Arlington, Alexandria, and Stafford". Archived from the original on 24 April 2015. Retrieved 21 April 2015.
- ^ a b c "Unfallentwicklung auf deutschen Straßen 2012 (Accident trends on German roads 2012)" (PDF). www.destatis.de. Statistisches Bundesamt (Federal Statistics Office). 10 July 2013. Retrieved 23 September 2013.
(Seite 19) Mit 29 Getöteten je 1 000 Unfälle mit Personenschaden ist das Todesrisiko auf Landstraßen fünfmal höher als auf Innerortsstraßen und auch höher als auf Autobahnen, auf denen 22 Personen je 1000 Unfälle starben. Ein Grund für das wesentlich höhere Risiko auf Landstraßen und Autobahnen ist, dass hier wesentlich schneller gefahren wird als auf Innerortsstraßen und dadurch die Unfallschwere steigt... (Seite 20) Hauptunfallursache auf Autobahnen ist die "nicht angepasste Geschwindigkeit." Im Jahr 2012 waren mehr als ein Drittel aller Unfälle mit Personenschaden auf Autobahnen Unfälle, bei denen mindestens einem Beteiligten dieses Fehlverhalten zur Last gelegt wurde. Bei insgesamt 6 587 sogenannten Geschwindigkeitsunfällen kamen 179 Menschen zu Tode, das heißt nahezu die Hälfte (46,3 %) aller Getöteten auf Autobahnen... (Seite 20) Hierbei ist allerdings zu berücksichtigen, dass die Unfallursache "nicht angepasste Geschwindigkeit" häufig nicht bedeutet, dass die zulässige Höchstgeschwindigkeit überschritten worden ist. "Nicht angepasste Geschwindigkeit" wird von der Polizei bei einem Unfall auch dann als Ursache erfasst, wenn ein Beteiligter für die vorliegenden Straßen- oder Witterungsverhältnisse zu schnell gefahren ist.
- ^ "A 95: Polizei geschockt über "immenses Tempo" [Translation: A 95: Police Shocked At High Speed]". Merkur Online [The Mercury online version]. 5 August 2013. Retrieved 29 September 2013.
den stellvertretenden Kommandanten der Feuerwehr aus Hohenschäftlarn (Kreis München), Daniel Buck... war mit seinen Kollegen einer der ersten an der Unfallstelle, an der ein Porschefahrer (51) so schnell in den Toyota einer 67-jährigen Weilheimerin bretterte, dass sich ihr Auto mehrmals überschlug. Die Frau musste noch vor Ort reanimiert werden, starb jedoch später im Krankenhaus. Die beiden Männer im Porsche kamen mit leichten Verletzungen davon... Auf Höhe des Dreiecks Starnberg verlor er auf der linken Spur die Kontrolle über sein Auto. Er kam ins Schleudern, schoss rechts über einen Grünstreifen und kam auf dem Zubringer aus Starnberg wieder auf die Fahrbahn. Dort rammte er die 67-jährige Weilheimerin in ihrem Toyota... Zeugen vor Ort schätzen, dass der Sportwagen mit rund 300 Kilometer pro Stunde unterwegs war... Ein Zeuge hatte seinen Tempomat auf 140 Stundenkilometer eingestellt und war von dem Sportwagen überholt worden. "Er schätzt, der Porsche war doppelt so schnell," sagt Buck. Und: "...Schneller wie 160 Kilometer pro Stunde ist hier absolut unangemessen.". [Translation: deputy commander of the fire brigade from Hohenschaeftlarn county (Munich), Daniel Buck...was one of the first with his colleagues at the accident site where a Porsche driver (age 51) bashed into the Toyota driven by a 67-year-old Weilheim in Oberbayern resident, rolling her car over several times. The woman had to be resuscitated on site but died later in hospital. The two men in the Porsche escaped with minor injuries... At the peak of the Starnberg interchange in the left lane, he lost control of his car. He went into a skid, shot right through a grass strip to ram the 67-year-old Weilheimer resident in her Toyota... Witnesses on site estimated that the sports car was traveling about 300 kilometers per hour... One witness had his cruise control set at 140 kilometers per hour and was overtaken by the sports car. "He estimates the Porsche was twice as fast," says Buck. And: "This is simply irresponsible; even as fast as 160 kilometers per hour is inappropriate. "]
- ^ "Autobahn Pileup: 52-Car German Crash Kills 3 (VIDEO)". Huffington Post. 19 November 2011.
- ^ Kennedy, Maev (6 September 2013). "'All you could hear was cars crashing': 120-car pile-up on Sheppey bridge". The Guardian.
- ^ "Girl killed, 138 cars involved in two massive pileups". Fox 19. 21 January 2013. Archived from the original on 9 November 2013. Retrieved 6 November 2013.
- ^ "Detectives: Excessive Speed Factor In 422 Crash Death". The Post. 10 July 2013. Archived from the original on 2 April 2015. Retrieved 6 November 2013.
- ^ "Kyle Stein charged in Colerain Twp. crash that killed Rachel McGrath and Eric Moormann". Archived from the original on 7 November 2013. Retrieved 6 November 2013.
[The teenage driver] lost control of the vehicle on a "curvy portion" of Sheed Road in Colerain Township and struck a parked Ford Titanium. The crash killed both passengers, [the driver] was traveling in excess of the posted 35 mph (56 km/h) speed limit to "catch up to a new model Audi R8 to get a better look at this costly vehicle"
- ^ "Teen dies when fast Camaro crashes on gravel road in Spring Arbor Township". Detroit Free press. 13 October 2013. Archived from the original on 9 November 2013. Retrieved 6 November 2013.
- ^ "Too Fast for Conditions". Federal Motor Carrier Safety Administration (U.S. Department of Transportation). Archived from the original on 5 November 2013. Retrieved 31 October 2013.
- ^ "No sign of alcohol for 6 teens killed in OH crash". 4 April 2013.
the SUV was traveling between 62 mph (100 km/h) and 70 mph (110 km/h) on a 35 mph (56 km/h) road before it flipped into a pond in a dark, unlit area in Warren on March 10, [2013], killing the 19-year-old driver and five of the seven boys riding with her
- ^ "Speeding Counts on All Roads" (PDF). FHWA Safety (November 2000). Archived from the original (PDF) on 16 October 2013. Retrieved 14 October 2013.
almost 50 percent of speeding-related fatalities occur on lower speed collector and local roads, which carry only 28.1 percent of the total vehicle miles traveled in the United States... the deadly consequences of speeding on local and collector roads becomes even more dramatic. The speeding fatality rate for local roads is three times that for Interstates
- ^ "Speed Enforcement" (PDF). ec.europa.eu. 2018. Retrieved 29 December 2020.
- ^ Speed Zoning Information (PDF) (Report). Institute of Transportation Engineers. 22 March 2004. Archived from the original (PDF) on 5 July 2010. Retrieved 17 September 2009.
- ^ MUTCD Sections 2B.13-16 #12
- ^ "California Vehicle Code § 21400(b)". The State of California. 1 January 2012. Retrieved 7 April 2020.
- ^ Fitzpatrick, Kay; Carlson, Paul; Brewer, Marcus A.; Wooldridge, Mark D.; Miaou, Shaw-Pin (6 October 2003). NCHRP Report 504 – Design Speed, Operating Speed, and Posted Speed Practices (PDF). Transportation Research Board of the National Academies. Washington, D.C.: National Academies Press. p. 88. ISBN 0-309-08767-8. ISSN 0077-5614. Archived (PDF) from the original on 21 October 2014. Retrieved 16 September 2009.
- ^ a b Krammes, R.A.; Fitzpatrick, Kay; Blaschke, J.D.; Fambro, D.B. (March 1996). Speed: Understanding Design, Operating, and Posted Speed (PDF) (Report). College Station, TX: Texas Transportation Institute. Research Report 1465-1.
- ^ "Establishing Speed Limits". azdot.gov.
- ^ "Establishing Speed Limits: a case of "Majority Rule"" (PDF). Kansas Department of Transportation.
- ^ Public opposition to speed limits being set by an authority, often arise because such agency has been viewed as abusing its power—such as by arbitrary indiscretion or by creating "speed traps." Because an expert can theoretically calculate a safer speed limit, than the populace's vote by driving, it is beneficial that local governments preserve strong public trust with their integrity in speed regulation. See A Policy on Geometric Design of Highways and Streets, AASHTO, 4th Ed., 2001; ISBN 1-56051-156-7
- ^ "USLIMITS2 - Safety - Federal Highway Administration". Federal Highway Administration (FHWA).
- ^ "Riggs v. Gasser Motors, 22 Cal. App. 2d 636". Official California Appellate Reports (2nd Series, Vol. 22, p. 22). 25 September 1937.
- ^ "Alarid v. Vanier, 50 Cal.2d 617". Official California Reports, 2nd Series Vol. 50, p. 617 (California Supreme Court reporter). 17 July 1958. See Official California Reports online
- ^ Haney, James E. (1974). The relationships between speed, speed limits, and motor vehicle accidents. An annotated bibliography.
- ^ Hubbard, Phil. "Out of touch and out of time? The contemporary policing of sex work." Sex work now. Willan, 2013. 22-53.
- ^ "Traffic rules on ice roads". Transport Administration of the Republic of Estonia. Archived from the original on 26 January 2021.
- ^ Peter Schick (June 2003), (translation) "Influence of Traffic Control Systems on Freeway Capacity and Stability of Traffic Flow"; Original Title "Einfluss von Streckenbeeinflussungsanlagen auf de Kapazitaet von Autobahnabschnitten sowie die Stabilitaet des Verkehrsflusses" (PDF), University of Stuttgart, p. 20, doi:10.18419/opus-175, ISBN 9783980821841, retrieved 16 October 2010,
(translation) "The first experiment was carried out in 1965 on a 30 km section of the A8 from Salzburg to Munich. The system consisted of mechanically variable message signs at a distance of 2 km, which could display speeds of 60, 80 and 100 km/h, and "danger zone" and "accident." Personnel monitored traffic using video technology and manually controlled the signage. Studies reported a decrease in traffic disruptions and breakdowns, harmonization of the velocity distribution and an increase in performance (Zackor 1972, see also Chapter 3.2.2)." German text: "Die erste linienhafte Beeinflussung des Verkehrs erfolgte im Jahr 1965 durch die Errichtung einer Wechselverkehrszeichenanlage auf einem 30 km langen Abschnitt der A8 auf der Richtungsfahrbahn Salzburg – München. Die Anlage bestand aus neben der Fahrbahn angebrachten mechanischen Wechselverkehrszeichen im Abstand von 2 km, die StVO-gerechte Zeichen für die Geschwindigkeitsbegrenzungen 60, 80 und 100 km/h sowie "Gefahrstelle" und "Unfall" anzeigen konnten (Abb. 2-1). Diese Zeichen wurden vom Betreiberpersonal, das mittels Videotechnologie eine Übersicht über das Verkehrsgeschehen hatte, manuell geschaltet. Somit konnte erstmals auf einer Autobahn die Geschwindigkeit des Verkehrs beeinflusst sowie eine Unfallwarnung vorgenommen werden. Die ersten Erfahrungen und wissenschaftlichen Untersuchungen berichten von einer Abnahme der Störungen und Verkehrszusammenbrüche, einer Harmonisierung der Geschwindigkeitsverteilung sowie einer Steigerung der Leistungsfähigkeit (ZACKOR 1972, siehe auch Kapitel 3.2.2).
- ^ Ralf Schmahld (6 August 2009), (translation) "20 years waiting in traffic jams"; Original Title "20 Jahre im Stau gestanden", Reise (Travel) magazine, retrieved 16 October 2010,
(translation) "A total of 1,300 kilometers of motorways now have traffic control systems for the harmonization of the traffic flow by speed limits and traffic warning, and the government expects to expand their use: 2500 km stretch of motorway could be controlled by these dynamic control systems." German text: "An insgesamt 1.300 Kilometern der Bundesautobahnen seien inzwischen Streckenbeeinflussungsanlagen zur Harmonisierung des Verkehrsablaufs durch Geschwindigkeitsbeschränkungen und Gefahrenwarnung installiert worden, teilt die Regierung weiter mit. 2.500 Kilometer Autobahnstrecke könnten mittels dynamischer Netzbeeinflussungsanlagen gesteuert werden"
- ^ Mark Robinson (9 January 2000), Examples of Variable Speed Limit Applications. Speed Management Workshop (PDF), Transportation Research Board. 79th Annual Meeting, archived from the original (PDF) on 27 September 2011, retrieved 17 October 2010,
"New Jersey. Status: Active (installed in the late 1960s). Objective: to provide early warning to motorists of slow traffic or hazardous road conditions. Setting: Urban/Rural - New Jersey Turnpike.
- ^ a b "Repository Notice - Bureau of Transportation Statistics". ntl.bts.gov. Archived from the original on 2 January 2019. Retrieved 1 January 2019.
- ^ "WYDOT proposes to lower I-80 speed limit". KSL-TV. 29 September 2008. Retrieved 16 October 2010.
The Wyoming Department of Transportation says it plans to impose a speed limit of 65 mph (105 km/h) on a 52 mi (84 km) stretch of the interstate between Laramie and Rawlins. The reduction from the existing speed limit of 75 mph (121 km/h) will take effect Oct. 15 and continue for six months. Also, WYDOT intends to install variable speed-limit signs on the same stretch of highway so the limit can be lowered further because of bad weather. The section is between the Quealy Dome Interchange, 20 mi (32 km) west of Laramie, and the Peterson Interchange, 22 mi (35 km) east of Rawlins, the agency said.
- ^ "Wyoming seasonal speed limit will vary with conditions". Land Line Magazine. 15 October 2010. Archived from the original on 8 December 2010. Retrieved 16 October 2010.
"When it's all horizontal and drifts, it kills the visibility, and we have a horrible time trying to keep people on the road," Wyoming DOT engineer Tim McGary told Land Line Now on Sirius XM. McGary says this winter, truckers on I-80 will no longer see that 65 mph (105 km/h) seasonal speed limit between Laramie and Rawlins. Instead, the whole 52 mi (84 km) stretch will have the electronic, variable speed limit signs that the DOT started installing last year. The variable signs allow the DOT to lower or raise the speed limit in 5 mph (8.0 km/h) increments depending on the weather conditions. And McGary says they work. The statistics are kind of showing that if we're on top of things with our plow operators and troopers out there, and we get the speed limits reduced appropriately to the weather conditions, people are complying pretty well with that," McGary said. "Our crash rates have gone down, and we're hoping to continue that trend."
- ^ Saha, P.; Young, R. (1 August 2014). Weather-Based Safety Analysis for the Effectiveness of Rural Variable Speed Limit (VSL) Corridors (PDF). Transportation Research Board 93rd Annual Meeting. No. 14-2293. Archived from the original (PDF) on 23 February 2015.
- ^ R. Young; V. Sabawat; P. Saha; Y. Sui (1 May 2012). Rural Variable Speed Limits: Phase II (Report). FHWA-WY-13/03F. Retrieved 10 April 2022.
Final Report: FHWA-WY-13/03F (PDF) (Report). May 2013. Archived from the original (PDF) on 22 May 2015. Retrieved 11 April 2022. - ^ "Managing Speed". Public Roads. www.tfhrc.gov. January–February 2003. Archived from the original on 21 September 2008. Retrieved 6 July 2008.
- ^ "Tennessee Low Visibility Warning System" (PDF). Federal Highway Administration. Archived from the original (PDF) on 7 May 2004. Retrieved 17 October 2010.
- ^ "Moving speed limits on I-285". Atlanta Journal-Constitution. 29 September 2014. Retrieved 22 August 2015.
- ^ Ohio Rev. Code §4511.21(H)(3)
- ^ Felton, Chad (5 April 2019). "ODOT: Variable speed limits only used to improve safety". The News-Herald. Willoughby, OH. Retrieved 6 April 2019.
- ^ Report (HC 15, 2004-05): Tackling congestion by making better use of England's motorways and trunk roads (Full Report) (PDF), National Audit Office, 26 November 2004, p. 21, archived from the original (PDF) on 30 October 2008, retrieved 17 September 2009,
The initial results of the one year trial of Variable Speed Limits indicated savings in journey times, smoother flowing traffic and a fall in the number of accidents. Based on these findings, the Agency converted the trial into a permanent facility in 1997. Variable Speed Limits have generally been popular with road users who have reported perceived benefits, including less congestion and less stressful journeys. The Agency could not prove a business case to use the measure elsewhere. Conditions at the site of the Variable Speed Limits trial were not stable before or during the trial, or in the period of extended monitoring that followed it. Traffic volumes changed and the Agency introduced new technology and new lighting and widened the motorway at both ends of the trial site, preventing it from establishing properly controlled and reliable "before and after" data to assess the measure's impact. Without reliable data, the Agency could not prove a business case to use the measure elsewhere. As a result, in 2002 the Agency extended the Variable Speed Limits trial, at a further budgeted cost of £3.9 million, to cover an additional eight kilometres of the M25, where conditions were expected to be more stable, in order to collect sufficient before and after data to prepare a business case.
- ^ "M1 Junctions 6A to 10 Official Completion Ceremony" (PDF). Highways Agency. Archived from the original (PDF) on 15 November 2009.
- ^ "M1 works speed cameras will stay". BBC News. 3 January 2010. Retrieved 13 April 2010.
- ^ Andrew W Fergus and David J Turner (MWH NZ Ltd.) (22–25 September 2002). "Monitoring Incident and Travel Behaviour Through the Use of ATMS Architecture" (PDF). Archived from the original (PDF) on 5 August 2010. Retrieved 21 October 2010.
initial results of a Transfund Research project being undertaken to evaluate the effectiveness of Variable Message Speed Signs (VMSS) within the Ngauranga Active Traffic Management System (NATMS). NATMS is an incident based system whose objective is to facilitate the passage of traffic through a very demanding section of state highway just north of Wellington... A unique feature of the NATMS is the use of VMSS which display a mandatory speed imposed by controllers in response to an incident or prevailing traffic conditions... In February 2001 Transit New Zealand (TNZ) commissioned the operation of the Ngauranga Active Traffic Management System (NATMS) on State Highway 1, north of Wellington, New Zealand. The NATMS covers a 4 km stretch of State Highway between Johnsonville and the SH1 / SH2 Interchange. The NATMS is the first system in New Zealand to use Automatic Incident Detection (AID) and was chosen because of the challenging driving conditions which are compounded by steep terrain, numerous bends and a high degree of weaving between lanes. This, in conjunction with a volume over 60,000 vehicles per day and an accident rate higher than the national average were contributing factors in the introduction of the NATMS.
- ^ "German: Ein Monat 'Tempo 160' auf der A10. English: A month of 'Tempo 160' on the A10". Archived from the original on 18 July 2011. Retrieved 16 April 2010.
"German: Den 'Tempo 160-Test' auf der A10 bezeichnete Gorbach "allen Unkenrufen zum Trotz" als 'Meilenstein in der europäischen Verkehrspolitik'. Er betonte im Rahmen einer Pressekonferenz in Wien, dass mit Tempo 160 'nicht die Raser gefördert, sondern die Geschwindigkeit flexibilisiert' werden soll. English: '[The then Austrian Minister for Transportation Hubert] Gorbach said the 'Test Speed 160' on the A10 [motorway] was 'a milestone in European transport policy-despite all predictions to the contrary.' He said at a press conference in Vienna that a 160 limit 'does not promote speeding, but more flexible travel speeds'.
- ^ "SPEED Fact Sheet. German Autobahn: The Speed Limit Debate" (PDF). European Transport Safety Council. February 2008. Archived from the original (PDF) on 6 January 2011. Retrieved 16 October 2010.
Currently, 52% of the German motorways do not have a speed limit, 15% have temporary speed limits due to weather or traffic conditions, and 33% have permanent speed limits. On unlimited sections, there is a 130 km/h recommendation.
- ^ "§ 3 StVO: Speed". Bundesministerium der Justiz und für Verbraucherschutz. Retrieved 29 April 2014.
Diese Geschwindigkeitsbeschränkung gilt nicht [...] auf anderen Straßen mit Fahrbahnen für eine Richtung, die durch Mittelstreifen oder sonstige bauliche Einrichtungen getrennt sind. Sie gilt ferner nicht auf Straßen, die mindestens zwei durch Fahrstreifenbegrenzung (Zeichen 295) oder durch Leitlinien (Zeichen 340) markierte Fahrstreifen für jede Richtung haben.
- ^ "Lärmaktionsplan 2008 der Stadt Gera" [Noise Action Plan of Gera 2008] (PDF).
Die Berechnung basiert dabei auf der in Deutschland gültigen Richtgeschwindigkeit von 130 km/h. Die real gefahrene Geschwindigkeit auf "freigegebenen" Autobahnabschnitten liegt jedoch deutlich höher, wie das in Abb. 54 dargestellte Beispiel von der A9 im Bereich Niemegk zeigt. Die V85 liegt teilweise bei über 170 km/h. Im Schnitt fahren deutlich über 60 % der Verkehrsteilnehmer schneller als 130 km/h. Mehr als 30 % der Verkehrsteilnehmer fahren im Schnitt schneller als 150 km/h
(English translation) Calculations are based on the German recommended a speed of 130 km/h. Actual driving speeds on motorway sections is much higher, as shown in Figure 54, for example, the A9 in Niemegk. The V85 [85th percentile speed] exceeds 170 km/h. On average, significantly more than 60% of road users exceed 130 km/h. More than 30% of motorists exceed 150 km/h. - ^ "Auswirkungen eines allgemeinen Tempolimits auf Autobahnen im Land Brandenburg" (PDF). Brandenburg. October 2007. Archived from the original (PDF) on 7 September 2012. Retrieved 4 December 2010.
(German)Auf einer 6-streifigen Autobahn ergibt sich für den Pkw-Verkehr im Mittel eine Geschwindigkeit von 142 km/h. (English)On clear stretches of 6-lane highway, cars average a speed of 142 km/h
- ^ "East German Traffic Deaths Jumped Dramatically After Reunification; Researchers Cite Rapid Increase In Young, Unskilled Drivers". ScienceDaily.
- ^ "Traffic Safety - The German Experience after Reunification" (PDF). German Society for Technical Cooperation. 6 November 2004. Archived from the original (PDF) on 24 September 2015. Retrieved 17 September 2009.
- ^ a b "No All-Island Speed Limit". Isle of Man Guide. 6 November 2004. Retrieved 17 September 2009.
- ^ "Transport Implications of the Isle of Man Strategic Plan: Report" (PDF). JMP Consulting. 27 April 2007. Archived from the original (PDF) on 25 January 2011. Retrieved 26 September 2010.
- ^ "The Table of Maximum Speed Limits at a Glance" (PDF).
- ^ "Data". Retrieved 29 December 2020.
- ^ "TRANSPORT DEPARTMENT GOVERNMENT OF TELANGANA - INDIA". www.transport.telangana.gov.in.
- ^ "The duties of the Swiss Federal Roads Office - ASTRA - Bundesamt". 2009. Archived from the original on 6 July 2011. Retrieved 26 October 2010.
Outside of built-up areas: Prior to 1973: no restriction 1973: 100 km/h (provisional) 1977: 100 km/h (definitive) 1985: 80 km/h (trial) 1989: 80 km/h (definitive), national referendum on 26 November 1989 Motorways: Prior to 1973: no restriction 1973: 100 km/h (temporary), due to oil crisis 1974: 130 km/h (provisional) 1977: 130 km/h (definitive) 1985: 120 km/h (trial) 1989: 120 km/h (definitive), national referendum on 26 November 1989
- ^ "Seit 35 Jahren Tempolimit auf Autobahnen - oesterreich.ORF.at". oesv1.orf.at.
- ^ "Willkommen | ÖAMTC". 4 December 2023.
- ^ Darren L. Jorgenson; Kumares C. Sinha (April 2000). "The Development of a Speed Monitoring Program for Indiana (FHWA/IN/JTRP-98/19)". Indiana Department of Transportation. Retrieved 26 September 2010.
CHAPTER 1: INTRODUCTION : 1.1 Background Information "Before 1974, Interstate highways through various states had different speed limits, except Montana and Nevada, which had none."
- ^ "FindLaw's MT case and opinions". Findlaw.
- ^ "Sky no longer the limit on 'Montanabahn'". Deseret News. 28 May 1999. Retrieved 18 April 2022.
- ^ "The need for speed on Stuart Highway". Australian Broadcasting Corporation (ABC). 15 October 2013. Retrieved 7 December 2020.
- ^ Dell'Acqua, Gianluca; Wegman, Fred (16 March 2017). Transport Infrastructure and Systems: Proceedings of the AIIT International Congress on Transport Infrastructure and Systems (Rome, Italy, 10-12 April 2017). CRC Press. ISBN 978-1-315-28188-9.
- ^ a b "Methods and Practices for Setting Speed Limits: An Informational Report - Safety | Federal Highway Administration". Federal Highway Administration (FHWA).
- ^ Taylor, Brian D.; Hong Hwang, Yu (30 June 2020). "Eighty-Five Percent Solution: Historical Look at Crowdsourcing Speed Limits and the Question of Safety". Transportation Research Record. 2674 (9): 346–357. doi:10.1177/0361198120928995. Retrieved 25 May 2024.
- ^ a b c d Tchir, Jason (30 May 2021). "Shouldn't speed limits be designed for the '85th percentile' of drivers?". The Globe and Mail. Archived from the original on 2 June 2021. Retrieved 15 May 2024.
The 85th percentile is an old tool for setting speeds on new roads, experts say – but it doesn't mean all limits should be decided by the fast crowd. 'It's got a history that goes back 50-plus years,' said Jeff Lindley, chief technical officer for the Institute of Transportation Engineers (ITE). 'Over the years, I would say there has been an overreliance on [the 85th percentile] as a way to set and adjust speed limits in a way that wasn't intended.'
- ^ McKinley, Jesse (23 March 2023). "Is 70 M.P.H. the New 65? Legislators Say N.Y. Roads Are Just Too Slow". The New York Times. Retrieved 15 September 2023.
States set speed limits using a variety of methods and measurements, including the so-called 85 percentile rule, which refers to the speed 'at or below which 85 percent of the drivers travel on a road segment', according to the Federal Highway Administration.
- ^ a b c d Minor, Nathaniel (15 September 2023). "A lower speed limit could be coming to a Colorado road near you". Colorado Public Radio. Retrieved 15 September 2023.
Traditionally, U.S. traffic engineers use the '85th percentile' method that sets limits at the speed at or below which 85 percent of drivers travel in normal conditions. This federally approved approach has been used by state and local transportation agencies since at least the '60s, but street safety advocates and city transportation officials deride the method because it usually leads to higher speed limits and faster speeds, which is associated with more serious crashes.
- ^ "Setting Speed Limits". Institute of Transportation Engineers. Retrieved 18 January 2024.
- ^ Lamm, R., Choueiri, E.M. (1987). Rural Roads Speed Inconsistencies Design Methods, Research Report for the State University of New York. Research Foundation, Parts I and II, Albany, N.Y., U.S.A,;1; 1987.[need quotation to verify]
- ^ Anonymous (17 October 2016). "Current speed limit policies - Mobility and transport - European Commission". Mobility and transport - European Commission. Archived from the original on 28 August 2018. Retrieved 29 November 2018.
- ^ a b Sánchez, Vanessa G. (25 May 2024). "'So Much Death': Lawmakers Weigh Stricter Speed Limits, Safer Roads for Pedestrians". U.S. News & World Report. KFF Health News. Retrieved 25 May 2024.
Road safety advocates argue the federal government missed an opportunity to eliminate outdated standards for setting speed limits when it revised traffic guidelines last year. The agency could have eliminated guidance recommending setting speed limits at or below how fast 85% of drivers travel on uncongested roads. Critics contend that what's known as the 85th percentile rule encourages traffic engineers to set speed limits at levels unsafe for pedestrians.
- ^ a b "Speed limit compliance and enforcement" (PDF). niassembly.gov.uk. 27 February 2014. Retrieved 29 December 2020.
- ^ Bauernschuster, Stefan; Rekers, Ramona (2022). "Speed limit enforcement and road safety". Journal of Public Economics. 210 104663. doi:10.1016/j.jpubeco.2022.104663. hdl:10419/215026. ISSN 0047-2727.
- ^ a b [1][dead link]
- ^ "Vehicle Speed Compliance Statistics" (PDF). assets.publishing.service.gov.uk. 2017. Retrieved 29 December 2020.
- ^ a b c Table 3, J. Stuster and Z. Coffman, Synthesis of Safety Research Related to Speed and Speed Management, FHWA-RD-98-154, July 1998
- ^ a b c "Speed crash risk" (PDF). itf-oecd.org. Retrieved 29 December 2020.
- ^ "30km/h speed limit eyed for all Auckland CBD roads". Radio New Zealand. 26 September 2018.
- ^ a b c "80 km/h: deux fois plus de véhicules flashés en juillet". LExpress.fr (in French). 31 July 2018. Archived from the original on 9 June 2019. Retrieved 9 June 2019.
- ^ "80 km/h, la com' à 5 millions d'euros". LExpress.fr (in French). 29 June 2018.
- ^ "Accidents" (PDF). www.onisr.securite-routiere.interieur.gouv.fr. Retrieved 29 December 2020.[permanent dead link]
- ^ "Is your département planning to scrap France's 80km/h speed limit?" (PDF). The Local France. 22 May 2019. Retrieved 29 December 2020.
- ^ "Speed Camera Blackspots in France 2016". www.french-property.com. 7 March 2018.
- ^ "80 km/h speed limit on rural single carriageways | French road safety observatory". www.onisr.securite-routiere.gouv.fr.
- ^ "Presentation" (PDF). www.onisr.securite-routiere.interieur.gouv.fr. Archived from the original (PDF) on 4 December 2020. Retrieved 29 December 2020.
- ^ "Finaliza con 1.098 fallecidos, el mínimo histórico de víctimas mortales en carretera" (PDF). www.dgt.es (in Spanish). 2019. Archived from the original (PDF) on 26 January 2021. Retrieved 29 December 2020.
- ^ EFFECTS OF THE 65-MPH SPEED LIMIT ON TRAFFIC ACCIDENTS IN OHIO (Report). University of Cincinnati. 1992. Retrieved 10 July 2010.
fatal accident rates on rural Interstate highways posted at 65 mph or rural non-Interstate highways posted at 55 mph had not significantly changed after the implementation of the 65-mph speed limit.
- ^ "South Dakota Speed Monitoring" (PDF). South Dakota Department of Transportation. 2012. Retrieved 19 December 2014.
- ^ Farmer, Charles M.; Retting, Richard A.; Lund, Adrian K. (1 September 1999). "Changes in motor vehicle occupant fatalities after repeal of the national maximum speed limit". Accident Analysis & Prevention. 31 (5): 537–543. doi:10.1016/S0001-4575(99)00010-X. PMID 10440551.
- ^ "Written Answers to Questions: Road Accidents". Hansard. House of Commons. 31 January 2003. Archived from the original on 24 April 2010. Retrieved 23 April 2010.
TRL research on urban speed management methods published in 1998 (TRL Report 363) found only an average 1 mph drop in speeds and no discernible accident reduction in accidents in 20 mph limits using only signs. Advisory speed limits are not normally approved in England and Wales. However, the more successful 20 mph zones that use self enforcing traffic calming features achieved average speed reductions of around 10 mph which produced a 70 per cent. reduction in child pedestrian accidents and 48 per cent. reduction in child cyclist accidents.
- ^ "Streetfilms | No Need for Speed: 20's Plenty for Us".
- ^ Joshua Hart. "Driven To Excess: A Study of Motor Vehicle Impacts on Three Streets in Bristol UK" (PDF). Archived from the original (PDF) on 26 April 2012. Retrieved 27 November 2011.
- ^ "A 50 km/h default urban speed limit for Australia?" (PDF). Monash University Accident Research Centre. Retrieved 26 April 2010.
After Norway reduced its urban speed limit from 60 km/h to 50 km/h, the average speed fell by 3.5-4 km/h, and the number of fatal accidents was reduced by 45 per cent (Norwegian Traffic Safety Handbook, cited in 9)... The bulk of the casualty crash benefit relates to the implementation of 50 km/h default speed limits on urban arterials currently zoned 60 km/h. Extending the default 50 km/h urban speed limit to all residential streets across Australia contributes about 6% of the total saving in casualty crashes.
- ^ "Evaluation of a 50 km/h Default Urban Speed Limit for Australia". Monash University Accident Research Centre. November 2001. Retrieved 15 September 2012.
The trial achieved reductions in average speeds of 1.5 to 2 km/h in some councils and a 7% reduction in the number of casualties and casualty crashes in the trial LGAs compared to the rest of the State.
- ^ a b "Current speed limit policies". European Commission. Archived from the original on 25 January 2013. Retrieved 23 April 2010.
A speed limit is based on both safety and mobility considerations and increasingly also on environmental considerations.
- ^ "Nixon signs national speed limit into law". history.com. 16 November 2009. Retrieved 6 November 2019.
- ^ "UN raises child accidents alarm". BBC News. 10 December 2008.
- ^ Synthesis of Safety Research Related to Speed and Speed Limits (PDF) (Report). Federal Highway Administration. 1998. Archived from the original (PDF) on 28 May 2010. Retrieved 17 September 2009.
- ^ Source: Reproduced from AASHTO (2010)
- ^ "Countermeasures guide" (PDF). www.onisr.securite-routiere.gouv.fr. Retrieved 29 December 2020.[permanent dead link]
- ^ a b c "Traffic and Accident Data: Summary Statistics - Germany" (PDF). Bundesanstalt für Straßenwesen [Federal Highway Research Institute]. December 2012. Archived from the original (PDF) on 26 June 2013. Retrieved 10 September 2013.
- ^ Liu, Cejun; Chen, Chou-Lin (2009). An Analysis of Speeding-Related Crashes:Definitions and the Effects of Road Environments (PDF) (Report). National Highway Traffic Safety Administration. Archived from the original (PDF) on 20 March 2009.
- ^ "State Reports Show Speeding Not a Significant Cause of Accidents". www.thenewspaper.com.
- ^ Friedman, Scott (7 February 2012). "Nearly Everyone Speeds on Dallas Co. Freeways". NBC 5 Dallas-Fort Worth.
- ^ Design Speed, Operating Speed, and Posted Speed Practices (PDF) (Report). National Cooperative Highway Research Program. Report 504.
- ^ Design Speed, Operating Speed, and Posted Speed Practices (PDF) (Report). National Cooperative Highway Research Program. Report 504.
A significant concern with the 1954 design speed concept was the language of the definition and its relationship with operational speed measures. The term "maximum safe speed" is used in the definition, and it was recognized that operating speeds and even posted speed limits can be higher than design speeds without necessarily compromising safety. In 1997, Fambro et al. (15) recommended a revised definition of design speed for the Green Book while maintaining the five provisions noted above. The definition recommended was, "The design speed is a selected speed used to determine the various geometric design features of the roadway." The term "safe" was removed to avoid the perception that speeds greater than the design speed were "unsafe." The AASHTO Task Force on Geometric Design voted in November 1998 to adopt this definition, and it was included in the 2001 Green Book (17).
- ^ Claes Tingvall & Narelle Haworth. "Vision Zero - An ethical approach to safety and mobility".
Table 1. Possible long term maximum travel speeds related to the infrastructure, given best practice in vehicle design and 100% restraint use...
- ^ "EU wants to slash rural speed limit". Irish Independent. 13 October 2010. Retrieved 10 November 2010.
Europe's top road safety agency warned yesterday that the speed limit on our killer rural roads is too high and should be slashed by a third...The general speed limit of 100 km/h on main rural roads which do not have dividing crash barriers should be cut to 70 km/h or less, an official report recommended yesterday.
- ^ "NRA New Divided Road Types: Type 2 and Type 3 Dual-carriageways" (PDF). (Ireland) National Road Authority. Archived from the original (PDF) on 3 January 2011. Retrieved 22 November 2010.
Type 2 Dual Carriageway: A divided all-purpose road with two lanes in each direction Type 3 Dual Carriageway: A divided all purpose road with two lanes in one direction of travel and one lane in the other direction. the two-lane section, which provides the overtaking opportunity, alternates with a one-lane section at intervals
- ^ "Nevada brief in Nevada v. Skinner". Archived from the original on 28 November 2010.
- ^ Copulos, Milton R. (9 September 1986). "The High Cost of the 55 MPH Speed Limit". The Heritage Foundation. Archived from the original on 10 May 2007. Retrieved 19 April 2007.
- ^ "Trucking Industry Asks Congress for National 65 mph Speed Limit". Environment News Service. 27 January 2009. Archived from the original on 31 January 2009. Retrieved 8 February 2009.
- ^ a b Int Panis L, et al. (2011). "PM, NOX and CO2 emission reductions from speed management policies in Europe". Transport Policy. 18 (1): 32–37. doi:10.1016/j.tranpol.2010.05.005.
- ^ "Vehicular Speed-Limit Reduction". Texas Commission on Environmental Quality. 2002. Archived from the original on 26 January 2010. Retrieved 13 April 2010.
- ^ "AA History, The story of the AA since 1905". The Automobile Association. Retrieved 26 October 2008.
A group of motoring enthusiasts met at the Trocadero restaurant in London's West End on 29 June to form the Automobile Association (the AA) – a body initially intended to help motorists avoid police speed traps.
- ^ a b "Autobahn-Temporegelung". Archived from the original on 1 January 2015. Retrieved 22 November 2010.
German:Der ADAC hält ein allgemeines Tempolimit auf Autobahnen für nicht erforderlich... Ein Zusammenhang zwischen generellem Tempolimit und dem Sicherheitsniveau auf Autobahnen ist nicht feststellbar. Die Zahl der Getöteten auf Autobahnen pro einer Milliarde Fahrzeugkilometer liegt in Deutschland bei 2,2, mit fallender Tendenz. Zahlreiche Länder mit genereller Geschwindigkeitsbeschränkung schneiden schlechter ab, z.B. Dänemark, Belgien, Österreich, USA. In Österreich, wo ein generelles Tempolimit von 130 km/h gilt, ist die Getötetenrate auf Autobahnen etwa 1,5-mal höher als in Deutschland. English: ADAC holds a general speed limit on motorways to be unnecessary... A connection between general speed limit on highways and safety is undetectable. The number of deaths on motorways per 1 billion vehicle-kilometers in Germany is 2.2 with a falling trend. Many countries fare worse with a general speed limit than Germany (e.g. Denmark, Belgium, Austria, USA). In Austria, where speed is generally 130, the death rate on motorways is about 1.5 times higher
, Press Release, June 2010. - ^ Lave, Charles; Elias, Patrick (February 1994). "Did the 65 mph speed limit save lives?" (PDF). Accident Analysis & Prevention. 26 (1). Elsevier: 49–62. doi:10.1016/0001-4575(94)90068-X. PMID 8110357. S2CID 21929276. Archived from the original (PDF) on 12 May 2011. Retrieved 20 April 2010.
This study analyzes the statewide consequences of raising the speed limit, treating highways and enforcement as a total system. We find that the 65 mph speed limit reduced the statewide fatality rate by 3.4%-5.1%, compared to those states that did not raise their speed limit.on rural interstate highways [p.49] VMT grew 1.62 times faster in the 65 mph states than it did in the 55 mph states...These numbers are consistent with the expected pattern of traffic shifts [p.53]
- ^ Peters, Eric (24 November 1998). "Highways Are Safe at Any Speed" (PDF). Wall Street Journal. Archived from the original (PDF) on 12 April 2012. Retrieved 17 February 2012.
When speed limits are set arbitrarily low–as under the old system–tailgating, weaving and "speed variance" (the problem of some cars traveling significantly faster than others) make roads less safe
- ^ "Speed limits". Safe Speed. Retrieved 17 April 2010.
Note that the "average" driver at the 50% percentile has a greater crash risk than the 85th percentile driver. Below the 30th percentile, crash risk is significantly increased, and these speeds tend to be used by less skilled and competent drivers ... Doddery old fool at 30 mph / 50 km/h on a UK "A" road suitable for 60 mph / 100 km/h. Of course, he has an elevated crash risk. He does not know what he is doing ... A single vehicle in lane 3 of a busy motorway. It's obvious that as the speed is reduced below 55 mph / 90 km/h the crash risk will increase
- ^ Smith, Paul (14 March 2007). "Welcome to Safe Speed". Safe Speed. Retrieved 18 April 2010.
In March we learned via Freedom of Information request that the speed camera side effects research (announced in May 2005) had been axed. It is inconceivable that the side effects DON'T cost more than 25 lives per year, meaning that speed cameras are making road safety worse. But DfT doesn't want to hear this, which is the only possible reason for axing the most important research. So here's the truth. Speed camera policy has failed catastrophically. Department for Transport KNOWS that it has failed but won't admit their deadly mistake and pull the plug.
- ^ Smith, Paul (23 June 2007). "Scrap speed cameras now". The Telegraph. London. Archived from the original on 12 January 2022. Retrieved 17 April 2010.
- ^ "VDA opposes using speed limit to patronize the public: General Speed Limit Will Not Help with Climate Protection or Safety". Verband der Automobilindustrie. March 2008. Archived from the original on 28 September 2011. Retrieved 2 July 2011.
A general speed limit on Germany's autobahns will not offer additional benefits in terms of climate protection or driving safety," said VDA Managing Director Dr. Kunibert Schmidt... "Much more important than the mantra-like repetition of old demands are measures designed to prevent motorists from driving at speeds that are not in line with weather conditions and the flow of the surrounding traffic - the leading cause of motor vehicle accidents.
- ^ "Higher speed limits reducing accidents on rural roads: Few accidents stem from cars overtaking". Archived from the original on 21 February 2014. Retrieved 22 February 2014.
Nine years ago the speed limit on certain motorways was increased from 110 km/h to 130 km/h, and this resulted in fewer traffic fatalities on those stretches of road.
- ^ Carsten Thomsen (11 June 2012). "Socialists open up several highways to 130 km / h (S åbner for flere motorveje med 130 km/t)".
Socialists are now open to raising the speed limit to 130 km/h on several of the country's motorways. Previously, the party was strongly opposed when the Liberal government in 2005 raised the speed limit from 110 to 130 on several stretches. However, it has not resulted in increased fatalities. Which it has convinced the Socialists, says Transport Coordinator Rasmus Prehn. 'There might be places where you can raise the limit from 110 km/h to 130 km/h. There should be a detailed assessment of that. What is important is that people get a feeling that there is a correlation between how things are and how fast you can drive, says Rasmus Prehn. The number of fatalities last year was 220, which is the lowest since World War II. Only 12 were killed on motorways. (ORIGINAL DANISH: Socialdemokraterne åbner nu for at hæve fartgrænsen til 130 kilometers i timen på flere af landets motorvejsstrækninger. Partiet var ellers stærkt imod, da VK-regeringen i 2005 hævede fartgrænsen fra 110 til 130 på en lang række strækninger. Men det har ikke betydet flere dræbte i trafikken. Og det har overbevist Socialdemokraterne. trafikordfører Rasmus Prehn. Der kan godt være steder, hvor man kan hæve grænsen fra 110 km/t til 130 km/t. Det skal der en nærmere vurdering til. Men det, der er vigtigt, er, at folk får en oplevelse af, at der er en sammenhæng mellem hvordan forholdene er, og hvor hurtigt man må køre, siger Rasmus Prehn. Antallet af trafikdræbte var sidste år 220. Det er det laveste siden Anden Verdenskrig. Kun 12 omkom på motorveje.)
- ^ "Fakten gegen ein generelles Tempolimit ("Facts Against A General Speed Limit")". 31 March 2007. Archived from the original on 28 September 2011. Retrieved 2 July 2011.
Thus, Denmark in April 2004 increased its speed limit 110 km/h to 130 km/h on all highways. Italy enacted its 2003 speed limit on six-lane highways of 130 km/h to 150 km/h...Raising the speed limits in Denmark and Italy had no negative impact on traffic safety. The number of accidental deaths even declined over the year before the increase in the limit of -10% (Italy) or -15% (Denmark).(German) So hat Dänemark im April 2004 sein Tempolimit von 110 km/h auf 130 km/h auf allen Autobahnen heraufgesetzt. Italien setzte 2003 sein Tempolimit auf sechsspurigen Autobahnen von 130 km/h auf 150 km/h herauf. Auch die schwedische Regierung hat jetzt eine Anhebung des Tempolimits auf ausgewählten Streckenabschnitten wie auch auf vierspurigen Landstraßen beschlossen. ...Die Anhebung der Tempolimits in Dänemark und Italien hatten keinerlei negative Auswirkungen auf die Verkehrssicherheit. Die Zahl der Unfalltoten sank sogar gegenüber dem Jahr vor der Anhebung des Limits um –10 % (Italien) bzw. –15 %(Dänemark).
- ^ "Infografik: Todesfälle auf Autobahnen im Europa-Vergleich". Statista Infografiken (in German). Retrieved 6 June 2021.
- ^ RANKING EU PROGRESS ON IMPROVING MOTORWAY SAFETY: PIN Flash Report 28 (PDF) (Report). March 2015.
- ^ Luther, Carsten (24 January 2020). "ADAC sperrt sich nicht mehr gegen Tempolimit auf Autobahnen". Die Zeit. Retrieved 6 June 2021.
- ^ J.S.Dean (18 April 2010). "Murder most foul".
- ^ Willett 1964, Criminal on the Road, p. 102.
- ^ Methods and Practices for Setting Speed Limits: An Informational Report, page 4, April 2012
- ^ "Autobahnrichtgeschwindigkeitsverordnung" (PDF) (in German). German Federal Government. Archived (PDF) from the original on 29 September 2007. Retrieved 28 October 2007.
- ^ Manual de Señales de Tránsito para las Vías Públicas de Puerto Rico (PDF) (in Spanish). Puerto Rico Department of Transportation and Public Works. 1979. p. 5. Archived from the original (PDF) on 7 July 2019.
- ^ "Catálogo de Señales Manual SIECA 2000" (PDF). Catálogo de Señales Manual SIECA 2000. 1 January 2000.
- ^ "Traffic Operations : Road Signs". Government of South Australia. 23 August 2002. Archived from the original on 2 July 2009. Retrieved 26 September 2010.
Most regulatory signs are rectangular with a black legend on a white background...[exceptions include] speed restriction signs (symbol enclosed in a red circle)"
- ^ "Frequently Asked Questions - General Questions on the MUTCD". Manual on Uniform Traffic Control Devices. United States Department of Transportation. 8 March 2017. Retrieved 22 November 2019.
- ^ "Image by mkanyala". Mapillary. 11 September 2017. Retrieved 21 April 2019.
- ^ "Image by mkanyala". Mapillary. 11 September 2017. Retrieved 21 April 2019.
- ^ "Image by mkanyala". Mapillary. 11 September 2017. Retrieved 21 April 2019.
- ^ "Information about the Speed Limit in force". European Commission. EU Mobility and Transport. 17 October 2016. Retrieved 28 January 2020.
- ^ "Regulation 615 of the H.T.A." E-laws Government Website. 24 July 2014. Retrieved 28 March 2015.
- ^ New York State Department of Transportation (2011). "New York State Supplement to the Manual on Uniform Traffic Control Devices for Streets and Highways" (PDF). Section 2B.13.
The NYR2-4, NYR2-5, and NYR2-6 signs...shall be used for posting area speed limits which are essentially city-wide, village-wide, and town-wide, respectively.... The word 'AREA' in the NYR2-3 sign may be replaced by other generic legend (for example, 'CAMPUS', 'PLAZA', 'MALL', 'PARK', etc.) where it would more clearly and appropriately identify a physically defined area.
- ^ "Driving in Japan - essential info if you plan to drive in Japan (2018)". Kyushu Journeys. 13 February 2018. Retrieved 29 May 2021.
- ^ "About limits - Speed limits". The official New Zealand Road Code. New Zealand Transport Agency. Retrieved 8 August 2012.
Open road speed limits - The signs below mean that the maximum speed that you can travel at is 100 km/h.
- ^ "Safer Isle of Man roads depend on difficult decisions, says forum". 30 May 2022. Retrieved 9 February 2025.
- ^ "Rule 21" (PDF). Australian Road Rules. 12 January 2011. Archived from the original (PDF) on 5 May 2012. Retrieved 8 August 2012.
- ^ Forschungsgesellschaft für Straßen- und Verkehrswesen (2000). Begriffsbestimmungen, Teil: Verkehrsplanung, Straßenentwurf und Straßenbetrieb. FGSV Verlag. p. 81.
- ^ Andreas Richter (2005). Geschwindigkeitsvorgabe an Lichtsignalanlagen. DUV. pp. 33–34. ISBN 3-8244-0828-7.
- ^ "Speed and speed management" (PDF). ec.europa.eu. 2015. Retrieved 29 December 2020.
- ^ Schoon, Ben (16 January 2019). "Google Maps appears to be testing speed trap icons w/ audible alerts, rolling out for some users". 9to5Google. Retrieved 16 January 2019.
- ^ "Police Ask Waze To Remove Speed Trap Alerts To Protect Cops". Consumerist. 26 January 2015. Retrieved 16 January 2019.
Further reading
[edit]- Actual Speeds on the Roads Compared to the Posted Limits, Final Report 551, Arizona Dept of Transportation, October 2004.
- Effects of Raising and Lowering Speed Limits on Selected Roadway Sections Archived 2008-06-25 at the Wayback Machine, United States Publication No. FHWA-RD-97-084, January 1997.
- Effect of 20 mph traffic speed zones on road injuries in London, 1986–2006: controlled interrupted time series analysis British Medical Journal 2009.
- Engineering Speed Limits – FHWA Safety Program United States Department of Transportation – Federal Highway Administration, Office of Safety, 1200 New Jersey Avenue, SE, Washington DC 20590.
- "Reducing Speeding-Related Crashes Involving Passenger Vehicles". National Transportation Safety Board, 490 L'Enfant Plaza, SW, Washington, D.C. 20594, July 2017.
- Special Report 254: Managing Speed, Transportation Research Board, 1998.
- The Speeding Driver: Who, How and Why? A research report by the Scottish government into the psychology of the speeding driver.
- Transport, Local Government and the Regions – Ninth Report The comprehensive UK report into the effects of speeding.
- Elvik, R. (2012). "Speed Limits, Enforcement, and Health Consequences". Annual Review of Public Health. 33: 225–238. doi:10.1146/annurev-publhealth-031811-124634. PMID 22224882.
- "3.11 Fartsgrenser". Trafikksikkerhetshåndboken (in Norwegian). Oslo, Norway: Transportøkonomisk Institutt. 2000. Retrieved 8 August 2012.
- Khondaker, Bidoura; Kattan, Lina (September 2015). "Variable speed limit: A microscopic analysis in a connected vehicle environment". Transportation Research Part C: Emerging Technologies. 58: 146–159. Bibcode:2015TRPC...58..146K. doi:10.1016/j.trc.2015.07.014.
Law review
[edit]- R. A. Vinluan (2008). "Indefiniteness of automobile speed regulations as affecting validity". American Law Reports--Annotated, 3rd Series. Vol. 6. The Lawyers Co-operative Publishing Company; Bancroft-Whitney; West Group Annotation Company. p. 1326.
- C. C. Marvel (2010). "Meaning of "residence district," "business district," "school area," and the like, in statutes and ordinances regulating speed of motor vehicles". American Law Reports--Annotated, 2nd Series. Vol. 50. The Lawyers Co-operative Publishing Company; Bancroft-Whitney; West Group Annotation Company. p. 343.
External links
[edit]Wikimedia Commons has media related to Speed limit signs and Driver speed and relative risk of an accident.
- A Walk Through The History of Speed Limit Signs in The US
- John F. Carr's State Traffic and Speed Laws
- Global map of speed limits from OpenStreetMap Archived 2015-11-13 at the Wayback Machine
| International | |
|---|---|
| National | |
| Other | |
Speed limit
View on Grokipediafrom Grokipedia
A speed limit is the maximum lawful speed at which a motor vehicle may travel on a specific roadway, as established by legal authority and typically enforced through posted signage and penalties for noncompliance.[1] These limits aim to align travel speeds with the geometric and environmental characteristics of the road, thereby minimizing collision risks and severities, since kinetic energy scales with the square of velocity, amplifying crash impacts at higher speeds.[2] Empirical analyses confirm that reductions in average speeds correlate with fewer fatalities and injuries, though posted limits exert influence primarily when credible relative to prevailing driver behavior and backed by consistent enforcement.[3][4]
Speed limits originated in the late 19th century amid the rise of motorized transport, with the United Kingdom imposing a 10 mph (16 km/h) cap in 1861, followed by U.S. states like Connecticut setting 12 mph urban and 15 mph rural maxima in 1901 to curb early accident rates.[5] Limits vary widely by jurisdiction, road classification, and conditions—typically 30–50 km/h (20–30 mph) in residential zones for pedestrian protection, escalating to 100–130 km/h (60–80 mph) on controlled-access highways designed for higher-volume, faster flow.[1] Enforcement relies on visual signs, automated cameras, and radar-equipped patrols, with variable limits adapting to weather or traffic in advanced systems.[6]
Debates surround their efficacy, as raising U.S. interstate limits post-1995 repeal of the 55 mph national mandate increased mean speeds yet yielded no proportional surge in fatalities, indicating drivers adjust velocities based on perceived hazards beyond mere postings—a pattern underscoring the limits' role in signaling rather than dictating absolute compliance.[7][8] Proponents cite physics-driven severity reductions from moderated speeds, while critics highlight inefficiencies in uniform caps ignoring road-specific engineering or human factors like visual cues that naturally constrain unsafe velocities.[2]
Outside Europe and North America, the United Arab Emirates posts the world's highest at 160 km/h on certain highways like Abu Dhabi-Al Ain.[50] Many developing nations maintain lower rural limits around 80-90 km/h due to road quality and enforcement challenges.[50]
These disparities highlight that while WHO estimates link each 1% mean speed increase to a 4% rise in fatal crash risk via extended braking distances and impact forces, international variance often traces to systemic elements like seatbelt usage (near-universal in Europe vs. variable in the US) and rural road dominance in fatality statistics, rather than maxima alone; Germany's model implies that permitting self-regulated high speeds in controlled environments yields outcomes rivaling restrictive regimes when paired with causal safeguards against human error.[128][126] Mainstream advocacy for uniform reductions overlooks such evidence, potentially overemphasizing speed while underweighting behavioral and infrastructural realism.
Montana exemplified a more radical shift by eliminating numerical daytime speed limits on interstates and rural highways in December 1995 under its "reasonable and prudent" rule, following the federal repeal, which permitted drivers to self-regulate based on conditions.[170] Initial data from 1996-1999 showed Montana's overall fatality rate dropping to historic lows (1.48 per 100 million vehicle-miles traveled in 1999), with proponents attributing this to uniform high speeds reducing variance, though total fatal accidents on interstates rose from 101 in 1995 (pre-shift baseline) to 143 by 1997 amid higher traffic volumes and speeds averaging 75-80 mph.[24][121] By 1999, amid rising fatalities (up 40% on unlimited stretches), the state legislature reimposed 75 mph limits on interstates effective January 1, 2000, after audits confirmed speed variance below 10 mph under the prior rule but elevated crash severity from absolute speeds exceeding design thresholds.[170][171] Germany's Autobahn system represents a policy of selective non-limitation, with approximately 50% of its 13,000 km lacking a general speed cap (advisory 130 km/h recommended) since post-World War II reconstructions prioritized engineering standards over uniform caps, resisting EU-wide limit pressures.[172] Empirical records indicate Autobahn fatality rates at 1.74 deaths per billion vehicle-km (2010s average), lower than the U.S. interstate rate of 3.38, due to strict vehicle inspections, divided lanes, and driver training, though unlimited sections exhibit 25% higher death rates per kilometer than limited ones, with 67% of 2006 motorway fatalities occurring on unrestricted portions despite comprising 70% of mileage.[134][136] A 2021 econometric study projected that imposing a 130 km/h limit could reduce Autobahn fatalities by 15-47% (potentially averting 140 deaths annually), as higher speeds amplify kinetic energy and stopping distances, yet political resistance persists, citing minimal overall contribution to Germany's low national road death rate (2.7 per billion km versus EU average).[173][136][111]
History
Early origins and initial regulations
The earliest formal speed limits emerged in the United Kingdom amid the introduction of steam-powered road locomotives in the mid-19th century, aimed at mitigating risks to pedestrians, horse-drawn carriages, and infrastructure. The Locomotives on Highways Act 1861 established the first numeric restrictions worldwide for self-propelled vehicles, capping speeds at 10 miles per hour (16 km/h) on turnpike roads and public highways, with a reduced limit of 5 miles per hour (8 km/h) through cities, towns, or villages.[9][10] These limits reflected empirical observations of steam vehicles' potential to cause accidents due to poor braking and visibility, though enforcement relied on rudimentary methods like timed distances between landmarks. The subsequent Locomotive Act 1865 imposed even tighter constraints on lighter "road locomotives," limiting them to 4 mph (6 km/h) in rural areas and 2 mph (3 km/h) in urban zones, while requiring a three-person crew—including a flagman preceding the vehicle by 60 yards (55 m) carrying a red flag during daylight or a red lantern at night to warn approaching traffic.[11][9] Such regulations, motivated by lobbying from railway and horse interests fearing competition, severely hampered steam vehicle adoption until the Locomotives on Highways Act 1896 liberalized them by raising the rural limit to 14 mph (23 km/h), abolishing the flagman requirement, and reclassifying lighter automobiles separately.[9] In the United States, precursors to motorized speed limits appeared in colonial ordinances; in 1652, New Amsterdam (now New York City) banned wagons from exceeding a brisk walking pace—estimated at about 3-4 mph (5-6 km/h)—on snow-covered hills to avert runaway crashes.[12] The advent of automobiles prompted dedicated motor vehicle laws, with Connecticut enacting the first such state statute on May 21, 1901, restricting speeds to 12 mph (19 km/h) within cities and 15 mph (24 km/h) on rural roads, based on assessments of early vehicles' control limitations and road conditions.[5] New York followed in 1903 with comparable urban and rural caps, initiating a patchwork of state-level rules that prioritized collision avoidance over uniform national standards.[13]20th-century developments and national mandates
In the early 20th century, the proliferation of automobiles prompted jurisdictions worldwide to raise speed limits as vehicle technology advanced and road networks expanded. In the United States, Connecticut enacted the nation's first state speed limit law in 1901, capping speeds at 12 mph in cities and 15 mph on country roads, but by the 1920s, most states had increased urban limits to 25-35 mph and rural highway speeds to 40-50 mph to reflect improved braking and tire capabilities. [14] [15] Enforcement relied on local police using stopwatches, as radar technology emerged only later in the 1940s. [16] European nations similarly adjusted limits through national legislation amid growing motorization. The United Kingdom's Road Traffic Act 1930 abolished the prior uniform 20 mph cap from 1903, replacing it with a 30 mph limit in built-up areas while permitting "reasonable and prudent" speeds elsewhere, a policy aimed at reducing restrictive bureaucracy and accommodating faster vehicles. [17] Germany's Reichsautobahn network, initiated in 1932, featured advisory speeds rather than strict mandates on many sections, emphasizing design for high velocities up to 100 mph without formal limits to showcase engineering prowess. Other countries, including France and Italy, codified national frameworks by the 1930s, typically setting urban limits at 30-40 km/h and higher on interurban roads, driven by rising accident rates from inexperienced drivers. [18] World War II necessitated temporary national reductions for resource conservation; the U.S. Office of Defense Transportation imposed a 35 mph "Victory Speed Limit" in 1942 to save gasoline and rubber, while similar measures curtailed civilian speeds across Europe under wartime rationing. [13] Postwar reconstruction saw limits rebound, with U.S. states commonly adopting 50-60 mph for divided highways by the 1950s, supported by the Federal-Aid Highway Act of 1956's interstate system. [19] The first U.S. federal national mandate arrived in 1974 via the Emergency Highway Energy Conservation Act, enforcing a 55 mph maximum on interstate highways in response to the Arab oil embargo, overriding state variations that had previously ranged from 40 to 80 mph. [20] [21] In Europe, countries like Sweden experimented with higher limits in the 1960s before reversing due to fatality spikes, establishing 110 km/h motorway standards by decade's end. These mandates reflected a shift toward centralized safety and efficiency policies, balancing empirical crash data against economic pressures from fuel scarcity and infrastructure costs.Post-1970s reforms and repeals
In the United States, the National Maximum Speed Law of 1974, which imposed a 55 mph limit nationwide to conserve fuel during the oil crisis, faced growing opposition by the 1980s due to perceived ineffectiveness and disregard by drivers. An amendment in 1987 permitted states to raise limits to 65 mph on rural interstates while maintaining the 55 mph cap elsewhere, reflecting partial relaxation amid evidence that higher speeds on safer roads did not proportionally increase fatalities.[8] The push for full repeal intensified as states sought autonomy, culminating in the National Highway System Designation Act signed by President Bill Clinton on November 28, 1995, which eliminated federal speed limit mandates entirely and restored state authority.[22] [23] Following the 1995 repeal, most states promptly increased interstate limits to 65 mph or higher, with some reaching 70 or 75 mph by the late 1990s, based on engineering studies indicating that modern highways and vehicles could safely accommodate elevated speeds.[8] In Montana, the repeal automatically reinstated the state's pre-1974 "reasonable and prudent" standard, which eschewed numerical daytime limits on interstates in favor of conditions-based driving, leading to average speeds exceeding 80 mph without a corresponding surge in accidents during the initial period.[24] This approach was challenged in 1998 when the Montana Supreme Court ruled the vague statute unconstitutional for failing to provide fair notice of prohibited conduct, prompting legislative action.[25] By May 1999, Montana enacted numerical limits of 75 mph on interstates daytime and 70 mph nighttime, alongside 70 mph daytime on two-lane roads, marking a shift back to fixed enforcement thresholds.[26] Internationally, post-1970s reforms were less focused on outright repeals and more on targeted adjustments, often upward in response to infrastructure improvements. In parts of Europe, such as Germany, advisory limits on autobahns remained non-binding where conditions allowed, avoiding strict numerical caps despite pressures for uniformity following the 1973 oil crisis introductions. However, comprehensive repeals were rare outside the U.S., with many nations retaining or refining limits amid debates over fuel efficiency versus mobility. Studies post-reform, including those analyzing U.S. changes, indicated that fatality rates did not rise proportionally with higher limits when accounting for vehicle safety advancements, challenging assumptions that speed alone drives crash severity.[8][23]Recent global trends (2000–2025)
In the United States, maximum speed limits on rural interstates and highways trended upward from the early 2000s, with many states increasing limits from 65 mph (105 km/h) or 70 mph (113 km/h) to 75 mph (121 km/h) or higher by the 2010s, reflecting adoption of the 85th percentile rule that sets limits near prevailing traffic speeds for better compliance and flow. By 2025, nine states—Idaho, Montana, Nevada, North Dakota, Oklahoma, South Dakota, Texas, Utah, and Wyoming—authorized 80 mph (129 km/h) limits on select rural segments, while Florida enacted legislation in March 2025 raising rural interstate limits to 70 mph (113 km/h) from 65 mph (105 km/h) and permitting up to 70 mph on certain four-lane rural highways. These adjustments, often justified by improved vehicle safety features and road designs, have been linked in studies to modest travel time savings but elevated fatality risks, with each 5 mph increase associated with an 8.5% rise in interstate deaths.[27][28][29][30] Europe saw a countervailing emphasis on reductions, particularly in urban and residential zones, motivated by crash reduction data and emissions targets amid growing environmental regulations. From the 2010s onward, numerous cities implemented 30 km/h (19 mph) default limits, yielding empirical drops of 23% in overall crashes, 37% in fatalities, and 38% in serious injuries per a review of implementations across the continent; no major European city reported regretting such changes post-adoption, with sustained benefits in casualty rates observed in places like those adopting post-2004 reforms. Motorway limits remained stable at 120–130 km/h (75–81 mph) in most nations, though the Netherlands imposed daytime reductions to 100 km/h (62 mph) on some highways starting in 2020 for nitrogen oxide compliance, reversible outside peak hours. The European Union mandated intelligent speed assistance technology in new vehicles from July 2024, capping speeds electronically to enforce limits and reflecting a policy shift toward automated compliance over signage alone.[31][32][34] In Australia and New Zealand, trends were mixed, with rural highway increases debated but often stalled by safety advocacy. Australia maintained 110–130 km/h (68–81 mph) maxima on many interstates but faced proposals in 2025 to lower default urban limits, countering public polls favoring hikes to 130 km/h for productivity; New Zealand incrementally raised some rural limits in the 2010s while expanding 30 km/h zones in cities, though 2024 increases on select roads drew criticism for potentially undermining fatality reductions achieved since 2000. In Asia, expressway limits rose modestly, such as India's standardization to 120 km/h (75 mph) on new highways by the 2020s, prioritizing infrastructure expansion over strict caps. Globally, variable and dynamic limits gained traction via digital signage and weather-adjusted systems, as in seasonal Finnish reductions from 100 km/h to 80 km/h yielding 14% fewer accidents, while enforcement technologies proliferated amid divergent rationales—economic efficiency in sparse areas versus casualty minimization in dense ones.[35][36][37]Legal Framework
International standards and conventions
The Vienna Convention on Road Signs and Signals, adopted in 1968 under the United Nations Economic Commission for Europe (UNECE), establishes uniform standards for traffic signs to facilitate international road travel and enhance safety through consistent visual communication.[38] This convention specifies the design of speed limit signs as circular with a red border, a white background, and a black Arabic numeral indicating the maximum speed in kilometers per hour, designated as sign C,14.[38] Sign sizes vary by road type: standard signs measure 60 cm in diameter for general use, larger 80 cm versions for high-speed roads, and even bigger for very high-speed traffic to ensure visibility.[38] Over 70 countries, primarily in Europe, Asia, and Africa, are contracting parties, though major exceptions like the United States and Canada adhere to domestic standards such as the Manual on Uniform Traffic Control Devices rather than fully adopting Vienna signage.[39] Complementing signage standards, the Vienna Convention on Road Traffic (1968) mandates that signatories post speed limits clearly but delegates the establishment of actual numerical limits to national legislation, reflecting the absence of binding international maximum speeds.[40] Article 18 requires drivers to obey posted limits and adapt to conditions, with special limits for vehicles like those carrying children or hazardous goods determined domestically.[40] This approach prioritizes sovereignty in setting limits based on local infrastructure, traffic density, and enforcement capacity, while promoting harmonized rules for cross-border consistency; as of 2023, 78 states are parties.[41] An earlier framework, the 1949 Geneva Convention on Road Traffic, similarly emphasized signage uniformity but has been largely superseded by the Vienna instruments in adopting nations.[42] UNECE vehicle regulations under the 1958 Agreement further address speed through technical standards for vehicles rather than roads. UN Regulation No. 89 (1993, amended) requires heavy goods vehicles over 12 tonnes and buses to incorporate speed-limiting devices capping maximum speeds at 90 km/h, with adjustable limiters for certain categories to reduce accident severity from high-speed commercial traffic.[43] Compliance is verified via type approval testing, where vehicles must not exceed the limit under full throttle; over 50 countries apply this for new vehicles.[43] Related rules, such as Regulation No. 39 for speedometers, ensure accurate measurement up to at least 120 km/h or the vehicle's maximum, supporting enforcement of national limits.[44] These provisions focus on vehicle capabilities aligning with typical road speeds, informed by empirical data on crash kinematics where kinetic energy scales quadratically with velocity, but do not prescribe road limits themselves.[44]National and regional variations
Speed limits exhibit significant national and regional differences, influenced by road infrastructure, traffic density, vehicle capabilities, and policy priorities. Most countries enforce maximum limits on highways ranging from 100 to 120 km/h, with urban areas typically capped at 50 km/h or lower. Exceptions include unrestricted sections on Germany's Autobahn network, where an advisory limit of 130 km/h applies but exceeding it is not penalized absent unsafe conditions.[45] In contrast, some urban areas in Europe have adopted 30 km/h zones to prioritize pedestrian safety and reduce emissions, such as Amsterdam's expansion to cover 80% of city streets by 2023.[46] In Europe, motorway limits generally reach 130 km/h, though enforcement and signage vary; Poland and Bulgaria permit 140 km/h on select highways, among the highest in the region.[47] The United Kingdom maintains 70 mph (113 km/h) on motorways and dual carriageways, with urban defaults at 30 mph (48 km/h).[47] France sets 130 km/h on motorways in dry conditions, reducing to 110 km/h in rain.[48] North America shows pronounced regional variation within federal systems. In the United States, states set limits independently, with rural interstates reaching 85 mph (137 km/h) in Texas, while others like Hawaii cap at 60 mph (97 km/h).[49] The Insurance Institute for Highway Safety reports maximums of 70-80 mph across most states, with trucks often limited to 65-70 mph.[30] Canada aligns closer to 100-110 km/h on provincial highways. Asia features diverse standards; China's expressways allow 100-120 km/h, with national highways at 80 km/h.[50] Australia defaults to 50 km/h in built-up areas and 100 km/h elsewhere, with some highways posted at 130 km/h; states like New South Wales enforce 110 km/h on designated routes.[51]| Region/Country | Urban (km/h) | Rural/Highway (km/h) | Motorway Max (km/h) |
|---|---|---|---|
| Germany | 50 | 100 | Unrestricted (advisory 130) |
| United States (Texas) | 30-70 | 70-75 mph (113-121) | 85 mph (137) |
| Poland | 50 | 90 | 140 |
| Australia (NSW) | 50 | 100 | 110-130 |
| China | 30-60 | 80-100 | 120 |
| UAE | 40-60 | 100-120 | 160 (select) |
Types of speed limits
Speed limits are broadly classified into regulatory (enforceable maximum speeds) and advisory (recommended speeds for safety), with regulatory types further divided by their fixed or variable nature, statutory basis, or temporary application. Regulatory speed limits establish legal maxima, enforceable through fines or penalties for exceedance, while advisory limits guide drivers on conditions like curves or intersections without direct legal enforcement.[52][53] Statutory or default speed limits apply by law to specific road categories in the absence of signage, often set legislatively at levels like 55 mph (89 km/h) for rural highways or 30 mph (48 km/h) in urban areas across many U.S. states. These serve as baselines overridden only by posted signs or special regulations, ensuring a uniform minimum standard without requiring universal signage.[1][54] Posted or absolute speed limits consist of fixed numerical maxima displayed on regulatory signs, determined via engineering surveys assessing road geometry, traffic volume, and crash history; for instance, U.S. federal guidelines recommend basing them on the 85th percentile of prevailing speeds under free-flow conditions. These supersede statutory limits and are legally binding, with exceedance constituting a violation regardless of conditions in absolute jurisdictions.[1][55] In contrast, some systems incorporate a "basic speed law" or prima facie rule, where posted limits create a presumption of unreasonableness if exceeded, but drivers may defend speeds as safe based on evidence like visibility and traffic density.[56] Variable or dynamic speed limits adjust in real-time via electronic signs responding to factors such as congestion, weather, or incidents, with systems in place on over 1,000 km of European motorways by 2010 and expanding U.S. implementations on urban freeways. These can be mandatory (lowering enforcement thresholds during hazards) or advisory, aiming to harmonize flows and reduce rear-end crashes by 10-30% in monitored trials, though effectiveness depends on driver compliance and sensor accuracy.[57] Temporary or special condition speed limits impose reduced maxima for short-term scenarios, including construction zones (often 10-20 mph below normal), school zones (e.g., 20 mph or 32 km/h during active hours in many countries), or weather-related advisories; enforcement typically doubles fines in work areas to deter speeding amid hazards. These are posted via portable or electronic signs and revert upon condition resolution.[1][53] Advisory speed limits, marked by yellow diamond signs, suggest safe speeds for non-standard features like sharp curves or pedestrian crossings, derived from stopping distance formulas or vehicle dynamics (e.g., for lateral friction on bends). Non-compliance is not a standalone offense but may contribute to citations under reckless driving statutes if it leads to unsafe operation.[52][58] Minimum speed limits, less common, prohibit excessively slow travel on high-speed roads (e.g., below 40 mph or 64 km/h on interstates) to prevent hazards from speed differentials.[59] Vehicle-specific limits, such as lower maxima for trucks (e.g., 70 mph or 113 km/h vs. 80 mph or 129 km/h for cars on some U.S. segments), address handling differences.[30][60]Determination Methods
Engineering-based approaches
Engineering-based approaches to determining speed limits focus on roadway geometry, vehicle dynamics, and driver perception-reaction capabilities to establish speeds that align with safe operating conditions under typical environmental factors. These methods prioritize physical constraints, such as stopping distances and curve negotiation, over arbitrary impositions, drawing from standards like those in the AASHTO Policy on Geometric Design of Highways and Streets (Green Book).[61][54] Core elements include calculating minimum sight distances and matching limits to design speeds, which are selected early in road planning to dictate features like lane widths, shoulder provisions, and alignment consistency.[61] A foundational metric is the design speed, defined as the maximum safe speed for which specific geometric elements are designed, typically ranging from 20 to 70 mph (32 to 113 km/h) depending on functional class. This speed influences horizontal curve radii via the formula for minimum radius , where is speed in mph, is superelevation rate (max 8-12% in the US), and is side friction factor (e.g., 0.10-0.16 for higher speeds). Roads designed below this speed may require reduced limits to prevent side friction demands exceeding tire-pavement capabilities, with ball-bank tests measuring acceptable lateral acceleration (up to 0.12-0.16g).[61][62] Vertical alignments, including grades and crest curves, further constrain speeds by affecting sight lines and vehicle control, with K-values (rate of vertical curvature) scaled to design speed to maintain headlight or eye-level visibility.[54] Stopping sight distance (SSD) represents a critical engineering threshold, ensuring drivers can perceive and halt before hazards. SSD comprises brake reaction distance (typically 2.5 seconds at driver eye height of 3.5 feet) plus braking distance, approximated as in feet, with in mph, s, ft/s² deceleration, ft/s², and as grade. For instance, at 60 mph, SSD exceeds 500 feet on level terrain, dictating minimum curve lengths and obstacle clearances; deficiencies prompt speed reductions to avoid collisions where kinetic energy scales with . Passing and decision sight distances extend these principles for overtaking maneuvers, often doubling SSD on two-lane roads.[61][63] The 85th percentile speed, derived from free-flow traffic data via speed studies (e.g., using pneumatic tubes or radar over 1-2 hours), sets limits within 5 mph of the speed at or below which 85% of vehicles travel, reflecting natural operating speeds consistent with geometry. FHWA guidelines endorse this for credibility, as mismatches increase variance and crashes; adjustments apply for pedestrian volumes, schools, or crash clusters (e.g., dropping 5 mph if rates exceed state averages).[64][54][65] For curves, specialized assessments like GPS mapping or accelerometers infer safe speeds, ensuring limits do not exceed those yielding side friction below 0.15g. Overall, these approaches integrate via tools like USLIMITS2 software, balancing inferred speeds from existing geometry with forward-looking design to minimize causal risks from mismatched capabilities.[64][66]Driver behavior models
Driver behavior models for speed limit determination emphasize empirical observations of how motorists select operating speeds under uncongested conditions, positing that prudent drivers calibrate their velocities based on perceived roadway geometry, visibility, traffic density, and environmental cues to maintain acceptable risk levels. These models assume that aggregate driver choices reflect a collective assessment of safe speeds, informed by first-hand experience rather than imposed regulations, with deviations often signaling either aggressive or overly cautious tendencies. Traffic engineers derive limits from field-measured speed distributions to minimize variance, as uniform speeds reduce collision probabilities more effectively than arbitrary reductions in mean velocity.[67][68] The cornerstone of these models is the 85th percentile operating speed, calculated from free-flow traffic data where vehicles travel without interference, setting the limit at the velocity matched or exceeded by no more than 15% of drivers. This threshold emerged from early 20th-century traffic studies and was formalized in U.S. guidelines by the 1960s, predicated on the view that the upper 15% represents outliers exceeding reasonable prudence for given conditions. Compliance tends to improve when limits align with this percentile, yielding lower speed differentials—typically under 10 km/h standard deviation—which correlate with reduced crash severity, as evidenced by before-after analyses of limit adjustments on rural interstates showing 8-11% fewer total incidents when raised to within 5 mph of observed 85th percentile speeds.[67][69][70] Advanced models integrate human factors such as curve geometry, superelevation, and signage to predict speed choice, using regression equations where expected speed decreases with tighter radii (e.g., approximations) or adverse weather, drawing from roadside surveys of over 1,000 drivers revealing that perceived risk from lateral acceleration thresholds governs deceleration on bends. Hybrid approaches combine these with psychological elements, like target risk homeostasis, where drivers maintain constant perceived hazard by offsetting safety features (e.g., wider lanes) with higher speeds, as simulated in models validating observed variances across diverse roadways. Empirical validation from Quebec highways (2000-2018) confirms that limit increases to match behavioral norms elevate mean and 85th percentile speeds by 3-5 km/h but stabilize distributions, underscoring causal links between homogeneity and safety over absolute minima.[71][72][73] Critiques from pedestrian-centric frameworks, often advanced by urban advocacy groups, argue the 85th percentile overprioritizes vehicular flow on mixed-use arterials, potentially inflating limits where vulnerable users prevail; however, rural and freeway data consistently demonstrate that deviations below observed behaviors foster noncompliance and heightened variance, elevating rear-end crash risks by up to 4 mph in mean-85th spreads under enforced lower caps. Peer-reviewed syntheses affirm that while absolute speed correlates with fatality kinetics (), behavioral alignment mitigates this via reduced interpersonal conflicts, with international comparisons (e.g., European curves) mirroring U.S. findings on geometry-driven choices.[74][75][76]Balancing safety, economics, and infrastructure
Determining speed limits requires reconciling empirical evidence on crash risks with the economic imperatives of efficient mobility and the engineering tolerances of roadways. Safety analyses underscore that crash severity escalates nonlinearly with velocity, as kinetic energy scales with the square of speed, amplifying fatalities and injuries; for example, the Insurance Institute for Highway Safety documented that each 5 mph increment in state maximum limits on interstates correlates with an 8.5% increase in fatality rates, alongside a 2.8% rise on other roads.[77] This causal linkage prompts conservative limit-setting to cap absolute speeds, particularly on undivided or high-volume arterials, though uniform speed compliance—rather than absolute caps—may mitigate variance-related risks more effectively than blanket reductions.[75] Economic evaluations reveal trade-offs where higher limits yield travel time savings—valued at approximately $20–$30 per vehicle-hour in freight contexts—but incur outsized costs from heightened crash externalities, including medical expenses, litigation, and productivity losses exceeding $1 trillion annually in the U.S. from speed-related incidents.[75] A nationwide restriction to 65 mph was projected to save $13 billion yearly, including $2 billion in trauma care, by curbing speed's disproportionate role in severe collisions, though such models undervalue long-haul efficiency gains in low-density corridors where fatality upticks post-repeal have been modest or absent.[78] Infrastructure economics further complicate this: elevated speeds accelerate pavement degradation, necessitating 20–50% higher maintenance budgets for asphalt and bridges designed below 70 mph, while optimal limits enhance throughput by aligning with road capacity, as excessive speeds reduce headways and precipitate congestion.[60][79] Road design standards integrate these factors via methodologies like the 85th percentile rule, which posts limits near prevailing free-flow speeds (typically 5–10 mph below the pace of 85% of vehicles) to foster credibility and compliance, adjusted downward for geometric constraints such as tight radii or inadequate shoulders that limit safe stopping distances.[60] In practice, agencies like the Federal Highway Administration advocate multifaceted assessments incorporating crash data, economic valuations (e.g., valuing statistical life at $10–$12 million), and inferred design speeds to avoid over- or under-posting that erodes enforcement efficacy or induces risky passing.[2] Empirical reviews, such as those from the Transportation Research Board, caution against politically driven hikes ignoring infrastructure deficits, as seen in jurisdictions where post-1995 U.S. repeals of the 55 mph mandate boosted average speeds by 5–7 mph without commensurate productivity surges, given offsetting fuel and delay costs.[2] Conversely, variable limits attuned to real-time conditions—via sensors adjusting for weather or volume—optimize this balance by preserving capacity (up to 10–15% higher flow) while dynamically enforcing safety thresholds.[80]Enforcement Practices
Traditional methods and penalties
Traditional speed enforcement primarily involves direct intervention by police officers using manual observation and measurement techniques, predating widespread automated systems. Visual estimation requires trained officers to gauge vehicle speed based on observed motion against fixed references like road markings or landmarks, often serving as probable cause for further verification; accuracy improves with experience but remains subjective and prone to error margins of up to 10-15% at higher speeds.[81][82] Pacing constitutes a core manual method, wherein an officer in a patrol vehicle follows the target vehicle for a sufficient distance—typically 0.25 to 0.5 miles—to match its speed while monitoring the cruiser's calibrated speedometer, ensuring the followed vehicle maintains a safe gap to avoid detection. This technique, effective for confirming speeds in real-time, has been standard since early automotive policing and remains viable in areas with low traffic density.[83][84] Handheld radar guns, introduced commercially in the U.S. in 1954 following World War II Doppler technology adaptations, enable non-contact speed detection by emitting microwave signals and calculating velocity from frequency shifts, with typical ranges of 0.25 to 1 mile; operators must verify device calibration daily per standards like those from the International Association of Chiefs of Police. Lidar (laser) variants, deployed from the 1980s, offer narrower beams for precision in congested settings but require line-of-sight.[16][85] Penalties for violations detected via these methods are predominantly civil infractions, escalating with speed excess, prior offenses, and jurisdiction. Fines commonly range from 150 for 1-10 mph over the limit to $500+ for 20+ mph excesses, often including court costs; for example, in Pennsylvania, 11+ mph over incurs 3 demerit points and fines starting at $35 plus $2 per mph over. Demerit systems accumulate points leading to license suspension—e.g., 11 points in Pennsylvania trigger 5 days per point for first offenses—while extreme cases (e.g., 30+ mph over) may invoke reckless driving charges with jail terms up to 6 months.[86][87] Insurance surcharges typically add $100-$500 annually per violation. Internationally, practices vary, with income-based fines in Finland (up to €100,000 for severe cases) emphasizing deterrence over fixed amounts.[88]Technological aids and surveillance
Technological aids for speed limit enforcement include radar and lidar devices, which measure vehicle speeds by emitting radio waves or laser pulses and calculating return times.[89] Radar guns, often handheld and used by officers, detect Doppler shifts in reflected signals to estimate speed, with accuracies typically within 1-2 mph at ranges up to 1,000 feet.[90] Lidar systems, employing infrared lasers, provide pinpoint accuracy by targeting specific vehicles, achieving errors under 1 mph and functioning effectively in adverse weather compared to radar's susceptibility to interference from multiple vehicles.[91] Automated speed cameras represent a core surveillance mechanism, operating fixed or mobile to monitor traffic continuously without constant human oversight. Fixed cameras, installed at high-risk sites like school zones, use integrated radar or lidar to trigger high-resolution photography of license plates and drivers upon speed exceedance, with systems processing violations remotely for ticketing.[92] Mobile variants, mounted on vehicles or poles, allow flexible deployment, while average-speed cameras employ paired units over distances—such as the UK's SPECS system—to compute mean velocities, reducing spot-speed evasion and covering up to 10 miles with ANPR for vehicle tracking.[93] Automatic Number Plate Recognition (ANPR) enhances surveillance by integrating optical character recognition with speed detection, enabling real-time database cross-checks for stolen vehicles or warrants alongside violations.[94] Modern systems fuse ANPR with 4D radar or AI-driven video analytics for all-weather operation, detecting speeds via millimeter-wave signals that differentiate vehicle trajectories amid traffic density.[95] In the United States, states like New York deploy school-zone cameras enforcing 20-25 mph limits during school hours, capturing evidence that has led to over 1 million citations since 2014, though programs face legal challenges over revenue distribution.[96] Emerging aids include intelligent speed assistance (ISA) in vehicles, which uses GPS and cameras to warn or limit speeds based on mapped limits, mandated in new EU cars from 2022 for enhanced passive surveillance.[89] Drone-based lidar and networked camera grids further extend coverage, with pilots in work zones using aerial monitoring to enforce variable limits dynamically.[97] These technologies prioritize evidence-based prosecution, minimizing officer exposure risks, though calibration standards—such as annual NIST-traceable tests for lidar—ensure reliability against claims of inaccuracy.[91]Revenue generation versus safety priorities
Critics of speed limit enforcement argue that in numerous jurisdictions, the primary objective has shifted toward revenue generation rather than enhancing road safety, with automated systems like speed cameras often deployed in locations optimized for violation detection over high-risk areas. In the United States, local governments collected approximately $9 billion in fines and fees in 2020, a substantial portion derived from traffic violations including speeding tickets, with over 730 municipalities relying on such revenues for at least 10% of their budgets, sufficient to fund entire police forces in smaller communities. This financial dependency has led to accusations of "speed traps" and revenue-motivated policing, where enforcement practices target drivers in low-risk zones to maximize citations, potentially undermining public trust in the system's safety rationale.[98][99] Empirical studies present mixed evidence on the balance between these priorities, with some demonstrating safety gains from automated enforcement, such as a 20-37% reduction in collisions in certain U.S. cities, yet opponents highlight that site selection criteria frequently prioritize fiscal returns over crash data. For instance, traffic citations form a multi-billion-dollar industry annually, with estimates suggesting upfront profits from fines ranging from $3.75 to $7.5 billion based on average ticket costs, raising questions about whether enforcement scales with actual safety needs or budgetary shortfalls. In the United Kingdom, speeding fines generated over £300 million in 2024, amid evaluations showing variable net benefits; while some camera sites yield safety improvements, others incur operating costs exceeding fine income without proven crash reductions, suggesting deployment decisions influenced by revenue projections.[100][101][102] Further scrutiny reveals causal disconnects, as increased enforcement in revenue-dependent areas correlates more strongly with fiscal pressures than with disproportionate safety risks, with research indicating that heightened revenue needs prompt targeting of typically under-enforced groups like wealthier drivers to boost yields. Cost-benefit analyses of programs like those in Great Britain affirm overall safety enhancements from cameras, including reduced fatalities, but acknowledge that political and budgetary incentives can lead to overuse, eroding deterrence if perceived as profit-driven rather than protective. Such dynamics underscore a tension where verifiable safety outcomes coexist with enforcement expansions that prioritize fiscal sustainability, prompting advocacy for reforms like earmarking revenues exclusively for road improvements to realign incentives with causal safety mechanisms.[103][104][105]Empirical Effectiveness
Data on crash rates and fatalities
Empirical evidence indicates a nonlinear relationship between vehicle speed and crash severity, with fatalities rising disproportionately due to kinetic energy scaling with the square of velocity. A meta-analysis of evaluation studies estimated that a 1% increase in mean speed correlates with a 4% increase in fatal crashes, reflecting heightened impact forces and reduced reaction times. Speeding is implicated in 28% of fatalities in high-income countries and up to 57% in low- and middle-income countries, contributing to 5-80% of fatal incidents depending on road type and jurisdiction.[106][107] In the United States, raising interstate speed limits has been associated with elevated fatality rates in multiple analyses. The 1987 increase to 65 mph on rural interstates in 40 states resulted in fatalities approximately 15% higher than projected, equating to an estimated 457-1,100 additional deaths annually on those roads. The 1995 repeal of the National Maximum Speed Limit, allowing states to set higher limits (often 70-75 mph), correlated with a 3.2% overall rise in road fatalities from 1995 to 2005, attributing 12,545 deaths and 36,583 injuries to the policy change, with the sharpest increases (up to 9.1%) on rural interstates. A subsequent NHTSA evaluation of post-1995 increases found interstate fatalities rose by 4-6% beyond trends, though some econometric models highlight confounders like improved vehicle safety and seatbelt use mitigating absolute impacts. Countervailing studies using vector autoregression suggest no significant fatality uptick after controlling for traffic volume and economic factors, underscoring debates over causality.[108][8][109] Internationally, Germany's Autobahn provides a natural experiment with about 52% of sections lacking numeric speed limits (advising 130 km/h self-restraint). Fatality rates on these unrestricted segments exceed limited ones by 25%, with 67% of Autobahn deaths occurring on no-limit portions despite comprising 60% of mileage, yielding 1.74 deaths per million vehicle-kilometers overall—lower than the U.S. interstate average of 3.38 but attributable to superior infrastructure, strict lane discipline, and vehicle standards rather than absent limits. A 2021 analysis projected a 130 km/h cap could avert 20% of Autobahn fatalities (around 40-50 annually), as higher variances and extreme speeds amplify severity in multi-vehicle collisions. Conversely, urban 20-30 km/h zones in Europe show modest reductions: a UK intervention yielded 10-20% fewer casualties, though volume dropped more than speeds, complicating attribution. These patterns affirm that while engineered high-capacity roads tolerate elevated speeds with lower baseline risks, limit increases generally elevate crash rates and fatalities via induced speeding, with effects varying by enforcement and road class.[110][111][112]Speed variance versus absolute limits
Empirical analyses consistently demonstrate that speed variance—the standard deviation of vehicle speeds on a roadway—exerts a stronger influence on crash rates than absolute speed alone, with higher variance elevating collision risk due to increased relative speeds between vehicles.[113][114] This relationship holds across multiple studies, as divergent speeds necessitate more lane changes, overtaking maneuvers, and braking adjustments, amplifying rear-end and sideswipe incidents.[115] For instance, a Virginia Transportation Research Council analysis of freeway data found that crash rates rose with increasing standard deviation of speeds under varied traffic conditions, independent of mean speed.[116] Absolute speed limits, when set below the 85th percentile of free-flowing traffic speeds, often exacerbate variance by encouraging bimodal distributions: compliant drivers cluster at the limit, while others exceed it, heightening differential velocities.[117] In such scenarios, safety declines despite the cap, as evidenced by research showing that aligning limits with prevailing speeds reduces variance and crashes more effectively than rigid enforcement of suboptimal thresholds.[118] Conversely, policies promoting flow uniformity, such as variable or advisory limits adjusted to conditions, yield lower variance and improved outcomes; a synthesis of U.S. studies confirmed that reduced variation cuts passing-related crashes, even at elevated mean speeds.[75][119] Montana's 1995 repeal of numerical daytime speed limits on rural interstates, replaced by a "reasonable and prudent" standard, illustrates this dynamic: average speeds rose to approximately 75-80 mph, but variance decreased due to self-selection of uniform higher velocities, correlating with a drop in fatalities per vehicle-mile traveled to the state's lowest recorded rate by 1999.[24][120] This outcome persisted initially despite higher kinetic energy potentials, underscoring causal primacy of variance over absolute velocity in many collision types; however, subsequent national trends post-reinstatement in 1999 showed mixed results, with some analyses attributing later fatality upticks to external factors like increased travel rather than variance resurgence.[121] International parallels, including Dutch efforts to design "self-explaining" roads that cue consistent speeds without signage, further validate variance minimization as a robust safety lever, though absolute speed retains relevance for severe crash kinetics.[122] Critics of variance-focused approaches, often from regulatory bodies, emphasize that higher mean speeds invariably amplify injury severity in fixed-object or head-on impacts, yet disaggregated data reveal variance's outsized role in frequent rear-end crashes comprising over 30% of incidents.[123][124]Comparative international outcomes
Countries with permissive speed limit policies, such as Germany's Autobahn network where no general maximum applies on approximately 70% of its length (with a recommended 130 km/h), demonstrate road fatality rates that challenge simplistic causal links between higher limits and poorer safety outcomes. In 2021, Germany's overall road traffic death rate stood at 3.7 per 100,000 population, lower than the European Union average of 4.6 and markedly below the United States' 12.4, despite the latter's interstate limits reaching 140 km/h in select areas. On the Autobahn itself, fatalities occur at a rate of about 1.6 per billion vehicle-kilometers traveled, comparable to or lower than restricted motorways in neighboring countries like the Netherlands (2.0 per billion vkm at 130 km/h limits) and reflecting factors such as reduced speed variance among experienced drivers, superior infrastructure design, and rigorous vehicle inspections. In contrast, empirical analyses in the United States link incremental speed limit increases to elevated crash severity; a 5 mph (8 km/h) rise on interstates correlated with an 8.5% uptick in fatalities from 1993 to 2008, attributing this to higher mean speeds and kinetic energy (where crash fatality risk rises nonlinearly with velocity squared).[125] Nordic countries like Sweden (120 km/h motorway limit) and Norway (110 km/h), which prioritize "Vision Zero" approaches with extensive automated enforcement, report lower rates of 2.2 and 2.0 per 100,000 population, respectively, but these gains stem more from homogeneous traffic flows, advanced crash barriers, and cultural compliance than limits alone—Sweden's pre-2010 experiments with differentiated limits showed minimal additional safety benefits from reductions.[126] Japan, capping expressways at 100-120 km/h, achieves 3.6 per 100,000 through stringent licensing and low alcohol tolerance, yet its outcomes align closely with Germany's despite lower maxima, underscoring enforcement and driver selection over absolute limits.| Country | Max Motorway Limit (km/h) | Death Rate (per 100,000 pop., 2021) | Notes on Key Factors |
|---|---|---|---|
| Germany | Unlimited (parts) | 3.7 | Low variance, strict licensing |
| Sweden | 120 | 2.2 | Vision Zero, cameras |
| Norway | 110 | 2.0 | Enforcement focus |
| United States | Up to 140 | 12.4 | High variance, longer trips[127] |
| Japan | 100-120 | 3.6 | Cultural discipline |
Justifications and Critiques
Safety rationales and empirical scrutiny
Proponents of speed limits argue that they mitigate crash severity through fundamental physical principles. The kinetic energy of a moving vehicle, given by the formula , where is mass and is velocity, increases quadratically with speed, meaning crashes at higher velocities dissipate far greater energy, elevating the risk of severe injury or death.[114] Similarly, stopping distance under braking approximates proportionality to the square of speed, as derived from kinematics equations incorporating reaction time and friction; for instance, doubling speed from 50 km/h to 100 km/h can quadruple the required braking distance on dry pavement.[129] These relationships underpin safety rationales, positing that enforced lower speeds reduce both crash frequency—via shorter decision-reaction windows at high velocities—and especially severity, where small speed increments yield disproportionate harm.[130] Empirical data from controlled analyses supports a positive correlation between speed limits and fatality outcomes in many contexts. A meta-analysis of U.S. regression studies found that a 5 mph (8 km/h) increase in interstate speed limits correlates with an 8.5% rise in fatalities, attributing this to elevated average speeds and crash energies post-1995 repeal of the national 55 mph cap.[125] International Transport Forum case studies across Europe and North America confirm that a 10% mean speed increase typically raises crash risk by 20-30% for injury accidents and over 40% for fatalities, driven by both incidence and physics-based severity.[114] Urban trials, such as 30 km/h zones, report 40%+ reductions in pedestrian fatalities, aligning with expectations from reduced kinetic impacts.[131] However, scrutiny reveals limitations in causal attribution, with speed variance often proving a stronger predictor of crash frequency than absolute speed levels. Research on U.S. interstates indicates that greater heterogeneity in vehicle speeds—e.g., mixing slow and fast traffic—elevates overall fatality rates more than uniform high speeds, as variance heightens rear-end and lane-change collision probabilities.[132] Post-limit increases in states like New York (to 65 mph) saw crash rates decline by 4%, suggesting adaptive driver behavior or confounding factors like improved vehicle safety mitigate raw speed effects.[133] Germany's Autobahn, where about 50-60% of sections lack posted limits (advisory 130 km/h), maintains a highway fatality rate of roughly 1.6 per billion km traveled—comparable to or below limited European peers—owing to superior road design, rigorous licensing, and self-regulation among experienced drivers, challenging blanket assertions that unrestricted high speeds inherently doom safety.[134] [135] While unlimited stretches account for disproportionate fatalities (around 70% despite comprising half the network), this stems partly from higher traffic volumes and speeds, not variance alone; proposals for universal limits project only modest gains (e.g., 140 fewer annual deaths), per data analyses, amid debates over enforcement biases in source institutions favoring restriction.[136] Empirical models thus emphasize context—road geometry, traffic homogeneity, and behavioral adaptation—over rigid limits, as absolute speed controls may induce variance if mismatched to conditions, underscoring that safety derives more from systemic factors than isolated velocity caps.[114]Economic costs and benefits
Lower speed limits impose economic costs primarily through increased travel times, which reduce productivity and raise logistics expenses. For instance, reducing urban speeds from 25 mph to 20 mph over 5 miles for 1,000 vehicles daily results in an annual time cost of approximately £234,000, based on average wage valuations.[137] Higher speed limits, conversely, yield benefits via time savings; a policy brief on U.S. truck speeds estimates that raising limits from 55 mph to 65-70 mph could shorten travel times and enhance economic efficiency for freight transport, though offset by potential crash increases.[138] These time-related gains diminish on congested roads, where elevated speeds can exacerbate braking variability and capacity losses, indirectly harming throughput and revenues.[139] Accident-related costs represent a countervailing benefit of stricter limits, as higher velocities amplify crash severity and societal expenses. A U.S. analysis projects annual savings of $13 billion from capping speeds at 65 mph, including $2 billion in reduced trauma care, by mitigating injury and fatality externalities.[78] Empirical modeling indicates that a 10 mph highway speed limit increase correlates with 9-15% more accidents and 34-60% more fatalities, implying elevated insurance, medical, and property damage outlays that often exceed time savings in net present value terms.[7] Cost-benefit assessments, such as those for German Autobahnen, affirm that imposing a 130 km/h limit generates positive welfare by curbing these externalities, despite foregone velocity benefits.[140] Enforcement of speed limits entails direct fiscal burdens, including personnel, technology, and infrastructure. Automated camera programs, while cost-effective for lives saved, incur upfront equipment and operational expenses varying by scale, with vendor contracts often structured per deployment rather than fixed fees.[141] Broader analyses, including OECD evaluations, highlight challenges in quantifying enforcement against diffuse benefits like reduced crash externalities, but consistently note that violation fines generate revenue—though prioritizing safety over income is debated, as aggressive ticketing can distort local budgets without proportional risk reduction.[142] Overall, while higher limits promise productivity uplifts, evidence from varied contexts suggests crash cost savings under lower caps frequently dominate, yielding net economic advantages when externalities are fully internalized.[143][144]Environmental and fuel efficiency claims
Advocates for stricter speed limits often assert that reducing maximum allowable speeds lowers overall fuel consumption and greenhouse gas emissions, primarily by curbing aerodynamic drag, which rises quadratically with velocity, and by smoothing traffic to minimize acceleration and idling events.[145] Empirical fuel economy curves for passenger cars indicate peak efficiency at steady speeds of 80-100 km/h (50-60 mph), with mileage declining by 15-20% at 120 km/h (75 mph) compared to 90 km/h (55 mph) due to increased drag and engine load, as demonstrated in controlled tests across multiple vehicle models.[146] For heavy-duty trucks, efficiency optima shift higher, often around 90-110 km/h, but still degrade at speeds exceeding 120 km/h, supporting claims that highway limits above these thresholds elevate fleet-wide consumption.[147] Urban speed limit reductions, such as from 50 km/h to 30 km/h, have shown modest emission benefits in peer-reviewed analyses, with traffic simulations projecting CO2 cuts of over 10% through reduced stop-start cycles and lower average speeds, though real-world gains depend on compliance and pre-existing congestion.[148] A natural experiment in Oslo from 2004-2011, involving temporary speed limit drops to 60 km/h on major roads, correlated with localized declines in NO2 and particulate matter, attributing reductions to decreased vehicle speeds and emissions per kilometer traveled.[149] Systematic reviews of high-speed environments confirm that lowering limits from 120 km/h or higher yields clearer NOx and CO2 reductions, as higher velocities amplify incomplete combustion and evaporative losses, though benefits diminish if drivers maintain elevated speeds via non-compliance.[150] On unrestricted highways like Germany's Autobahn, where average speeds reach 120-140 km/h in unlimited sections, fuel use per 100 km rises nonlinearly; a 2023 study estimated that imposing a nationwide 130 km/h cap could trim CO2 emissions by 3-5 million tons annually while generating €1 billion in net welfare gains from fuel savings and health benefits, offsetting higher crash risks.[151] Counterarguments highlight that such projections often overlook traffic homogenization effects—where moderate limits reduce speed variance and platooning inefficiencies—or the rebound from faster trip times enabling more total vehicle-km traveled, potentially negating per-trip savings.[152] In controlled highway tests, raising limits from 80 km/h to 120 km/h increased carbon emissions by 20-30% for light vehicles due to elevated steady-state consumption, underscoring causal links but also revealing that urban-focused policies yield smaller proportional impacts than highway ones.[153] These claims face scrutiny for modeling assumptions that assume perfect enforcement and ignore modal shifts; for instance, while physics dictates higher fuel burn at supra-optimal speeds, empirical data from differential speed limits for cars versus trucks show only marginal aggregate reductions (1-3%) in emissions, as trucking costs rise without proportional environmental offsets.[154] Environmental rationales thus hold empirical validity for capping excessive speeds but overstate universality, particularly where limits fall below efficiency optima, inducing congestion that elevates idling emissions beyond drag-related gains.[155]Individual liberty and overregulation concerns
Critics of speed limits from libertarian and individualist perspectives argue that fixed numerical caps represent paternalistic overreach by the state, presuming regulators' superior judgment over drivers' assessments of road conditions, vehicle performance, and personal risk. This approach undermines personal autonomy and responsibility, treating competent adults as incapable of self-regulating speeds absent government mandates, akin to broader nanny-state policies that prioritize uniformity over contextual decision-making. Such regulations are seen as infringing on the right to freedom of movement, a cornerstone of liberal societies, by imposing arbitrary constraints without direct evidence of harm to third parties when drivers exercise due care. Montana's "reasonable and prudent" standard, in effect for daytime driving from December 18, 1995, to December 31, 1998, offered a practical counterexample, replacing numerical limits with a requirement for speeds appropriate to prevailing conditions, thereby granting drivers greater discretion. During this period, typical interstate speeds reached 75-85 mph or higher without fixed enforcement thresholds, reflecting self-imposed limits based on traffic flow and visibility rather than statutory ceilings. The policy's termination in 1999, following a state supreme court ruling deeming the vague standard unenforceable and amid federal pressure for uniformity via highway funding conditions, highlighted conflicts between localized liberty experiments and centralized regulatory demands.[156][157] Enforcement of speed limits fosters overregulation through pervasive surveillance tools like speed cameras and proposals for intelligent speed assistance devices that cap vehicle velocities electronically, further eroding privacy and choice. For instance, California's 2024 legislative efforts to mandate speed limiters on new vehicles, restricting operation to 10 mph above posted limits, exemplify escalating intrusions that transform personal automobiles into state-monitored instruments of compliance. Opponents contend these measures conflate risk mitigation with regimentation, disregarding drivers' incentives to avoid accidents given their own liability, and prioritize bureaucratic control over voluntary adaptation to dynamic road environments.[158]Controversies and Advocacy
Debates over unrestricted roads
Proponents of unrestricted roads, defined as highways without enforced numerical speed limits and relying instead on advisory speeds, infrastructure design, and driver prudence, emphasize personal responsibility and empirical safety outcomes in well-maintained systems. In Germany, where approximately half of the Autobahn network lacks a posted limit but features an advisory 130 km/h, advocates such as the German Automobile Club (ADAC) argue that such sections demonstrate lower accident severity due to reduced speed variance and high driver discipline, with the network's fatality rate at 1.6 per billion vehicle-kilometers traveled as of 2023, below the European average.[135] They contend that blanket limits would erode automotive engineering standards and travel efficiency without proportional safety gains, as data from unrestricted segments show crashes often stem from impairment or inattention rather than speed alone.[159] Critics, including environmental organizations and safety advocates, counter that unrestricted access enables excessive speeds correlating with higher kinetic energy in collisions—proportional to velocity squared—thus amplifying fatalities and injury severity. A 2019 analysis by the European Transport Safety Council estimated that a 130 km/h cap on the Autobahn could prevent around 140 deaths annually by mitigating high-speed impacts, while Germany's Federal Environment Agency projected annual CO2 savings of over 2 million metric tons from such a measure.[136] [160] These groups highlight that while overall German road fatalities have declined, Autobahn crashes involving speeds above 150 km/h remain disproportionately lethal, and polls indicate majority public support for limits amid rising fuel costs and emissions targets.[161][111] Historical U.S. experiments, such as Montana's daytime "reasonable and prudent" policy from 1979 to 1998—which avoided numerical limits on interstates—fueled similar debates, with supporters claiming it aligned speeds naturally and reduced enforcement costs.[121] However, a 1998 Montana Supreme Court ruling deemed the standard unconstitutionally vague, prompting numerical caps at 75 mph; subsequent data showed interstate fatalities rising over 100% in initial years post-implementation, though causation is disputed due to confounding factors like traffic volume growth.[25][121] Opponents of unrestricted approaches cite a Dutch study indicating mandatory limits on formerly unlimited motorways reduced crash costs by 206-218 million euros annually through moderated speeds.[162] The debate persists transnationally, balancing causal evidence of speed's role in crash physics against observations of adaptive driver behavior in engineered environments. ![Montana reasonable and prudent speed limit sign][float-right] Libertarian perspectives frame unrestricted roads as a bulwark against regulatory overreach, arguing that competent adults, equipped with modern vehicles' safety features, outperform paternalistic laws in risk assessment.[159] Yet, empirical scrutiny reveals trade-offs: while unrestricted zones like Germany's may foster uniformity, international comparisons show higher limits post-1995 U.S. repeal of the 55 mph federal mandate correlated with 3,000-4,000 additional annual fatalities, underscoring speed's non-linear risk escalation.[8] Advocacy for retention often invokes cultural symbols, as in Germany's election-year clashes where conservative parties resist limits to preserve "driving freedom," despite progressive pushes tying them to climate goals—potentially inflating environmental claims beyond verified causal impacts.[161][135]Political and ideological divides
In the United States, empirical analysis of state-level speed limit policies reveals a correlation with political ideology, wherein constituencies in Republican-dominated areas are associated with higher statutory limits, reflecting preferences for reduced regulatory intervention and greater emphasis on driver autonomy and economic efficiency in transportation.[163] This pattern contrasts with more regulatory approaches in Democrat-leaning jurisdictions, where lower limits are often justified through appeals to collective safety and environmental goals, though such policies have faced criticism for prioritizing precautionary principles over data-driven assessments of risk, such as the 85th percentile rule that aligns limits with prevailing safe speeds observed in traffic flows.[164] Libertarian perspectives, rooted in individual liberty and skepticism of state paternalism, contend that speed limits infringe on personal responsibility unless directly tied to demonstrable harm to others, advocating instead for privatization of roadways where owners could set rules based on liability and insurance incentives rather than uniform mandates.[165] Proponents argue this would foster innovation in road design and enforcement, potentially reducing accidents through market-driven standards like variable limits or performance-based contracts, while opponents within libertarian circles acknowledge externalities like crash risks to third parties necessitate some baseline rules, albeit enforced via civil rather than criminal penalties to avoid overreach.[158] Such views highlight causal realism in traffic outcomes, prioritizing engineering factors like sightlines and vehicle capabilities over blanket prohibitions that may encourage uniform speeding without improving net safety. Environmental advocacy, frequently aligned with progressive ideologies, promotes speed limit reductions—such as from 120 km/h to 110 km/h on motorways—as a means to achieve fuel savings of 12-18% and lower emissions, positioning these measures as low-cost interventions in climate policy despite mixed empirical evidence on net atmospheric benefits when accounting for induced travel behaviors and rebound effects.[166] In Europe, this has manifested in debates like Germany's Autobahn proposals, where Green Party initiatives for caps encounter resistance from conservative factions emphasizing freedom of movement and questioning the causal link between moderate speed variances and fatality rates, given data showing no proportional increase in accidents on unlimited sections.[161] Critics from market-oriented viewpoints argue these environmental rationales often overlook opportunity costs, such as prolonged travel times exacerbating congestion emissions, and reflect institutional biases toward interventionism in academia and NGOs that undervalue first-principles evaluations of velocity's role in kinetic energy dissipation versus overall system dynamics.[167]Case studies of policy shifts
In the United States, the National Maximum Speed Law of 1974 imposed a 55 mph limit on interstate highways nationwide in response to the 1973 oil crisis, aiming to conserve fuel; this policy was repealed by the National Highway System Designation Act on November 28, 1995, allowing states to raise limits to 65 mph or higher.[168] Post-repeal, average speeds on rural interstates increased from 57 mph to 65 mph by 1997, and states adopting 65-75 mph limits saw varied safety outcomes, with peer-reviewed analyses attributing a 3.2% rise in overall road fatalities (12,545 additional deaths and 36,583 injuries in fatal crashes from 1995-2005) partly to higher speeds, though confounding factors like improved vehicle safety and seatbelt use mitigated broader trends.[8] [169] Counterstudies, including those examining enforcement shifts, argued that the repeal did not proportionally increase deaths per vehicle-mile traveled, as fatality rates on affected highways rose only modestly (e.g., 17% higher interstate death rates in some states) amid national declines driven by non-speed factors.[169] ![Montana reasonable and prudent speed limit sign][float-right]Montana exemplified a more radical shift by eliminating numerical daytime speed limits on interstates and rural highways in December 1995 under its "reasonable and prudent" rule, following the federal repeal, which permitted drivers to self-regulate based on conditions.[170] Initial data from 1996-1999 showed Montana's overall fatality rate dropping to historic lows (1.48 per 100 million vehicle-miles traveled in 1999), with proponents attributing this to uniform high speeds reducing variance, though total fatal accidents on interstates rose from 101 in 1995 (pre-shift baseline) to 143 by 1997 amid higher traffic volumes and speeds averaging 75-80 mph.[24][121] By 1999, amid rising fatalities (up 40% on unlimited stretches), the state legislature reimposed 75 mph limits on interstates effective January 1, 2000, after audits confirmed speed variance below 10 mph under the prior rule but elevated crash severity from absolute speeds exceeding design thresholds.[170][171] Germany's Autobahn system represents a policy of selective non-limitation, with approximately 50% of its 13,000 km lacking a general speed cap (advisory 130 km/h recommended) since post-World War II reconstructions prioritized engineering standards over uniform caps, resisting EU-wide limit pressures.[172] Empirical records indicate Autobahn fatality rates at 1.74 deaths per billion vehicle-km (2010s average), lower than the U.S. interstate rate of 3.38, due to strict vehicle inspections, divided lanes, and driver training, though unlimited sections exhibit 25% higher death rates per kilometer than limited ones, with 67% of 2006 motorway fatalities occurring on unrestricted portions despite comprising 70% of mileage.[134][136] A 2021 econometric study projected that imposing a 130 km/h limit could reduce Autobahn fatalities by 15-47% (potentially averting 140 deaths annually), as higher speeds amplify kinetic energy and stopping distances, yet political resistance persists, citing minimal overall contribution to Germany's low national road death rate (2.7 per billion km versus EU average).[173][136][111]
Implementation and Signage
Sign design and placement standards
Speed limit signs are primarily regulated by national or regional standards, with the Vienna Convention on Road Signs and Signals (1968) providing an influential international framework for design. Under the convention, the standard speed limit sign (C,14) is circular with a red border, white background, and black numeral indicating the maximum speed in km/h, ensuring uniformity for signatories including most European countries, Australia, and others.[38] Non-signatory nations like the United States deviate, employing rectangular white signs with black "SPEED LIMIT" lettering above a red circle enclosing the limit numeral, as specified in the Manual on Uniform Traffic Control Devices (MUTCD), with sizes such as 24 by 30 inches for single-lane roads.[174] Variations include inclusion of units (e.g., "km/h" in Ireland post-2005 metrication) or alternative backgrounds like amber in Sweden and Finland.[174] Placement standards emphasize visibility and regulatory applicability, requiring signs at the entry to speed zones where the limit takes effect. In the US, MUTCD mandates installation "at or near where the regulations apply," with limits displayed in 5 mph or 10 km/h multiples and reevaluation every five years based on engineering studies.[174] Internationally, guidelines like Australia's AS 1742.5 recommend repeater signs every 200-400 meters in urban areas to reinforce compliance, while heights typically range from 5-7 feet above ground in urban settings to 7-10 feet on highways for optimal driver sightlines.[175] Signs must use retroreflective materials for nighttime visibility and be positioned clear of obstructions, with end-of-limit signage (e.g., diagonal black bar over the numeral) posted at zone terminations.[174] These practices aim to minimize confusion and enhance enforcement, though empirical studies link inconsistent placement to reduced adherence in transitional areas.[55]Variable and advisory limits
![Variable speed limit sign on a highway][float-right] Variable speed limits adjust dynamically based on real-time traffic, weather, or road conditions, typically displayed via electronic signs on freeways to enhance safety and flow.[176] These systems aim to prevent congestion-induced slowdowns that increase rear-end collision risks and to mitigate hazards like reduced visibility in adverse weather.[177] Implementation often involves sensors detecting flow rates or incidents, triggering reductions such as from 70 mph to 50 mph during peak hours or fog.[178] Empirical evaluations indicate variable speed limits can reduce crash rates. A Federal Highway Administration study on U.S. freeway corridors found crash modification factors suggesting 5-15% reductions in total and injury crashes post-implementation, though effects vary by site-specific factors like volume and geometry.[179] In Seattle's I-5 corridor, variable limits improved travel time reliability by 15-30% and correlated with fewer severe incidents during variable enforcement periods starting around 2010.[180] Minnesota's I-35W/I-94 system similarly showed harmonized speeds lowering variance, with observational data from 2000s deployments linking it to decreased bottleneck crashes.[180] However, some analyses, including before-after empirical Bayes methods on Washington's I-5 and SR-520, report modest or context-dependent safety gains, emphasizing enforcement integration for efficacy.[181] Advisory speed limits provide non-mandatory recommendations for segments where geometric or environmental constraints demand speeds below the statutory maximum, such as sharp curves or school zones.[1] In the UK, these appear on rectangular signs, distinct from circular mandatory ones, advising reductions like 30 mph on bends to align with safe stopping distances.[182] U.S. guidelines, per the Manual on Uniform Traffic Control Devices, derive advisory speeds from 85th percentile wet-pavement tests or ball-bank indicators, targeting curves where superelevation falls short.[1] Non-compliance risks liability in crashes, as courts may deem exceeding advisory speeds negligent if conditions warrant.[183] Evidence supports advisory limits' role in hazard mitigation. Iowa Department of Transportation field studies in work zones demonstrated variable advisory systems cut speed variance by up to 20%, correlating with fewer conflicts in uncongested rural sites from 2010s trials.[184] UK road safety data attributes reduced curve-related overturns to driver adherence, though quantification remains challenging without universal enforcement.[185] Both variable and advisory approaches prioritize causal factors like speed differential over absolute limits, with success hinging on visibility, calibration to physics-based stopping models, and minimal over-regulation to maintain credibility.[186]Special zones and exemptions
Special zones designate areas where speed limits are reduced below standard roadway limits to mitigate risks from vulnerable populations, temporary hazards, or environmental factors, with enforcement often intensified through signage, flashing lights, or automated cameras. School zones, typically active during arrival and dismissal hours or when children are visible, commonly enforce limits of 20-30 km/h (12-19 mph) to reduce pedestrian collision severity; for example, many U.S. states set 25 mph (40 km/h), as in California where it applies near schools with posted signs, while European countries like Belgium observe average speeds exceeding 30 km/h limits in such areas despite high noncompliance rates.[187][188] Construction or work zones impose temporary reductions, often 10-20 mph (16-32 km/h) below normal limits, to safeguard workers from errant vehicles; U.S. policies, such as California's manual requiring 10 mph cuts in active zones, pair these with doubled fines for violations when personnel are present, as in Alabama where state highways see enhanced penalties up to $250 minimum.[55][189] Residential, business, or alley districts frequently default to prima facie limits of 25 mph (40 km/h) or 15 mph (24 km/h), reflecting higher densities of non-motorized users; California's Vehicle Code, for instance, sets 25 mph in residential areas unless engineering justifies otherwise.[190] Exemptions primarily apply to authorized emergency vehicles—such as ambulances, fire trucks, and police—permitting speeds exceeding posted limits during responses with activated sirens and lights, contingent on maintaining due regard for life and property to avoid recklessness liability. This is enshrined in statutes like Ohio's code exempting public safety vehicles from speed rules, Virginia's allowances for disregarding limits past signals, and Washington's provisions for exceeding maxima without endangering others.[191][192] Limited exemptions extend to escorted oversize loads, military convoys, or funeral processions in select jurisdictions, though these require permits and adherence to safety protocols; emergency vehicles generally bypass school or construction zone restrictions for urgency, prioritizing response efficacy over static limits.[193]References
- https://www.reddit.com/r/[europe](/page/Europe)/comments/nw4oyt/countries_and_their_speed_limit_map_updated/