.JPG/250px-OAKLAND,_CA,_USA_-_Skyline_and_Bridge_(cropped).JPG "Alameda County, California")
.JPG/2000px-OAKLAND,_CA,_USA_-_Skyline_and_Bridge_(cropped).JPG)
Community hub
Recent from talks
Contribute something
Nothing was collected or created yet.
Alameda County, California
View on Wikipedia
Alameda County (/ˌæləˈmiːdə/ ⓘ AL-ə-MEE-də) is a county located in the U.S. state of California. As of the 2020 census, the population was 1,682,353,[4][6] making it the 7th-most populous county in the state[7] and 21st most populous nationally. The county seat is Oakland.[8] Alameda County is in the San Francisco Bay Area, occupying much of the East Bay region.
Key Information
.jpg)
.JPG)


.jpg)


The Spanish word alameda means either "a grove of poplars...or a tree lined street". The name was originally used to describe the Arroyo de la Alameda; the willow and sycamore trees along the banks of the river reminded the early Spanish explorers of a road lined with trees.[9][10]
Alameda County is part of the San Francisco–Oakland–Berkeley, CA Metropolitan Statistical Area, and the San Jose–San Francisco–Oakland, CA Combined Statistical Area.
History
[edit]The county was formed on March 25, 1853, from a large portion of Contra Costa County and a smaller portion of Santa Clara County.
The county seat at the time of the county's formation was located at Alvarado, now part of Union City. In 1856, it was moved to San Leandro, where the county courthouse was destroyed by the devastating 1868 quake on the Hayward Fault. The county seat was then re-established in the town of Brooklyn from 1872 to 1875. Brooklyn is now part of Oakland, which has been the county seat since 1873.
Much of what is now an intensively urban region was initially developed as a trolley car suburb of San Francisco in the late 19th and early 20th centuries. The Key System moved commuters to and from the Key System Mole, where ferries bridged the gap across San Francisco Bay.
The historical progression from Native American tribal lands to Spanish then Mexican ranches, then to farms, ranches, and orchards, then to multiple city centers and suburbs, is shared with the adjacent and closely associated Contra Costa County.
Law, government and politics
[edit]
Government
[edit]The Government of Alameda County is defined and authorized under the California Constitution, California law, and the Charter of the County of Alameda.[11] Much of the Government of California is in practice the responsibility of county governments such as the Government of Alameda County, while municipalities such as the City of Oakland and the City of Berkeley provide additional, often non-essential services. The County government provides countywide services such as elections and voter registration, law enforcement, jails, vital records, property records, tax collection, and public health. In addition it is the local government for all unincorporated areas, and provides services such as law enforcement to some incorporated cities under a contract arrangement.
It is composed of the elected five-member Alameda County Board of Supervisors (BOS) as the county legislature, several other elected offices and officers including the Sheriff, the District Attorney, Assessor, Auditor-Controller/County Clerk/Recorder, Treasurer/Tax Collector, and numerous county departments and entities under the supervision of the County Administrator. In addition, several entities of the government of California have jurisdiction conterminous with Alameda County, such as the Alameda County Superior Court.
The current supervisors are:[12]
- David Haubert, district 1,
- Elisa Márquez, district 2,
- Lena Tam, district 3,
- Nate Miley, district 4, and
- Keith Carson, district 5.
The Board elects a president who presides at all meetings of the Board and appoints committees to handle work involving the major programs of the county. If the president is absent for a meeting, the vice president shall be responsible. A Board election occurs every two years for these positions. Supervisor Carson is serving currently as president; Supervisor Miley is vice president.
The county's law enforcement is overseen by an elected Sheriff/Coroner and an elected District Attorney. The Sheriff supervises the deputies of the Alameda County Sheriff's Office, whose primary responsibilities include policing unincorporated areas of the county and cities within the county which contract with the Sheriff's Office for police services; providing security and law enforcement for county buildings including courthouses, the county jail and other county properties; providing support resources, such as a forensics laboratory and search and rescue capabilities, to other law enforcement agencies throughout the county; and serving the process of the county's Superior Court system. The District Attorney's office is responsible for prosecuting all criminal violations of the laws of the state of California, the county, or its constituent municipalities, in the Alameda County Superior Court. The current Sheriff is Yesenia Sanchez, who was elected in 2022, succeeding Greg Ahern, who had served in the post for 16 years. The Sheriff's Office operates two jails: Santa Rita Jail in Dublin, and Glenn E. Dyer Detention Facility in downtown Oakland.
In 2009, Nancy E. O'Malley was appointed Alameda County district attorney after Tom Orloff retired. She served two terms and did not run for reelection in 2022.[13] Pamela Price was elected as district attorney in 2022.[14]
The Alameda County Fire Department (ACFD)[15] was formed on July 1, 1993, as a dependent district, with the Board of Supervisors as its governing body. Municipal and specialized fire departments have been consolidated into the ACFD over the years. 1993 brought in the Castro Valley and Eden Consolidated FD, and the County Fire Patrol. San Leandro joined in 1995, Dublin in 1997, Lawrence Berkeley National Laboratory in 2002, Lawrence Livermore National Laboratory in 2007, The Alameda County Regional Emergency Communications Center in 2008, and Newark and Union City in 2010. Emeryville joined the ACFD in 2012.
The Alameda County Water District is a special district within Alameda County created to distribute water, but it is not operated by Alameda County administrators. It is operated by an elected board of directors.
Alameda County Superior Court operates in twelve separate locations throughout the county, with its central René C. Davidson Courthouse located in Oakland near Lake Merritt. Most major criminal trials and complex civil cases are heard at this location or in courtrooms within the County Administration Building across the street.
State and federal representation
[edit]In the California State Assembly, Alameda County is split between five districts:
- the 14th Assembly district, represented by Democrat Buffy Wicks
- the 16th Assembly district, represented by Democrat Rebecca Bauer-Kahan
- the 18th Assembly district, represented by Democrat Mia Bonta
- the 20th Assembly district, represented by Democrat Liz Ortega
- the 24th Assembly district, represented by Democrat Alex Lee[16]
In the California State Senate, the county is split between four districts:
- the 5th senatorial district, represented by Democrat Jerry McNerney
- the 7th senatorial district, represented by Democrat Jesse Arreguín
- the 9th senatorial district, represented by Democrat Tim Grayson
- the 10th senatorial district, represented by Democrat Aisha Wahab[17]
In the United States House of Representatives, the county is split between four districts:
- California's 10th congressional district, represented by Democrat Mark DeSaulnier
- California's 12th congressional district, represented by Democrat Lateefah Simon
- California's 14th congressional district, represented by Democrat Eric Swalwell
- California's 17th congressional district, represented by Democrat Ro Khanna
Politics
[edit]Since 1932, Alameda County has been a stronghold of the Democratic Party, with Dwight Eisenhower being the only Republican presidential nominee to have carried the county since. Prior to 1932, the county had been a Republican stronghold. Piedmont resident William F. Knowland was the Republican U.S. Senate Leader from 1953 to 1959. Even when Ronald Reagan won the national popular vote by an 18.3% margin in 1984, Walter Mondale won Alameda County by a larger margin. In 2004 it voted for John Kerry, who won over 75% of the vote. Every city and town voted Democratic.[18] George H.W. Bush in 1988 was the last Republican to break 30% of the county's vote and Ronald Reagan in 1984 was the last to break 40% of the vote (carrying 40.01%).[19]
| Year | Republican | Democratic | Third party(ies) | |||
|---|---|---|---|---|---|---|
| No. | % | No. | % | No. | % | |
| 2024 | 140,789 | 21.02% | 499,551 | 74.57% | 29,567 | 4.41% |
| 2020 | 136,309 | 17.62% | 617,659 | 79.83% | 19,785 | 2.56% |
| 2016 | 95,922 | 14.54% | 514,842 | 78.06% | 48,779 | 7.40% |
| 2012 | 108,182 | 18.12% | 469,684 | 78.69% | 19,027 | 3.19% |
| 2008 | 119,555 | 19.19% | 489,106 | 78.52% | 14,252 | 2.29% |
| 2004 | 130,911 | 23.29% | 422,585 | 75.18% | 8,594 | 1.53% |
| 2000 | 119,279 | 24.13% | 342,889 | 69.36% | 32,168 | 6.51% |
| 1996 | 106,581 | 23.07% | 303,903 | 65.77% | 51,560 | 11.16% |
| 1992 | 109,292 | 20.62% | 334,224 | 63.04% | 86,629 | 16.34% |
| 1988 | 162,815 | 33.99% | 310,283 | 64.78% | 5,899 | 1.23% |
| 1984 | 192,408 | 40.01% | 282,041 | 58.65% | 6,425 | 1.34% |
| 1980 | 158,531 | 37.96% | 201,720 | 48.30% | 57,366 | 13.74% |
| 1976 | 155,280 | 38.09% | 235,988 | 57.89% | 16,413 | 4.03% |
| 1972 | 201,862 | 42.84% | 259,254 | 55.02% | 10,079 | 2.14% |
| 1968 | 153,285 | 37.63% | 219,545 | 53.90% | 34,519 | 8.47% |
| 1964 | 142,998 | 33.46% | 283,833 | 66.42% | 509 | 0.12% |
| 1960 | 183,354 | 45.61% | 217,172 | 54.02% | 1,474 | 0.37% |
| 1956 | 192,911 | 52.40% | 174,033 | 47.27% | 1,187 | 0.32% |
| 1952 | 201,976 | 52.69% | 178,239 | 46.50% | 3,079 | 0.80% |
| 1948 | 150,588 | 46.57% | 154,549 | 47.80% | 18,194 | 5.63% |
| 1944 | 122,982 | 41.83% | 169,631 | 57.70% | 1,374 | 0.47% |
| 1940 | 116,961 | 43.56% | 148,224 | 55.21% | 3,311 | 1.23% |
| 1936 | 82,352 | 35.09% | 149,323 | 63.63% | 3,011 | 1.28% |
| 1932 | 89,303 | 43.68% | 106,388 | 52.04% | 8,761 | 4.29% |
| 1928 | 118,539 | 65.42% | 60,875 | 33.60% | 1,780 | 0.98% |
| 1924 | 81,454 | 61.48% | 8,020 | 6.05% | 43,016 | 32.47% |
| 1920 | 73,177 | 69.11% | 21,468 | 20.27% | 11,244 | 10.62% |
| 1916 | 51,417 | 50.34% | 43,748 | 42.84% | 6,966 | 6.82% |
| 1912 | 0 | 0.00% | 24,418 | 36.75% | 42,034 | 63.25% |
| 1908 | 21,380 | 64.24% | 7,110 | 21.36% | 4,793 | 14.40% |
| 1904 | 19,065 | 70.32% | 4,399 | 16.23% | 3,646 | 13.45% |
| 1900 | 14,324 | 64.64% | 6,677 | 30.13% | 1,158 | 5.23% |
| 1896 | 13,429 | 60.43% | 8,394 | 37.77% | 400 | 1.80% |
| 1892 | 8,792 | 47.60% | 7,114 | 38.52% | 2,564 | 13.88% |
| 1888 | 8,840 | 57.18% | 5,693 | 36.82% | 928 | 6.00% |
| 1884 | 7,471 | 60.26% | 4,734 | 38.18% | 193 | 1.56% |
| 1880 | 5,899 | 59.65% | 3,894 | 39.38% | 96 | 0.97% |
On November 4, 2008, Alameda County voted 61.92% against Proposition 8, which won statewide, and which amended the California Constitution to ban same-sex marriage. The county garnered the sixth highest "no" vote, by percentage, of all California counties, and was the second largest county, by total voter turnout, to vote against it.[20]
Voter registration statistics as of October 24, 2022
[edit]| Population and registered voters | ||
|---|---|---|
| Total eligible population[21] | 1,140,774 | |
| Registered voters[21][note 1] | 931,130 | 81.6% |
| Democratic[21] | 562,093 | 60.4% |
| Republican[21] | 100,977 | 10.8% |
| Democratic–Republican spread[21] | +461,116 | +49.6% |
| American Independent[21] | 21,621 | 2.3% |
| Libertarian[21] | 6,351 | 0.6% |
| Green[21] | 5,628 | 0.6% |
| Peace and Freedom[21] | 4,340 | 0.4% |
| Unknown[21] | 26 | 0.0% |
| Other[21] | 5,686 | 0.6% |
| No party preference[21] | 224,408 | 24.1% |
Cities by population and voter registration
[edit]| Cities by population and voter registration as of 2013 | |||||||
|---|---|---|---|---|---|---|---|
| City | Population[22] | Registered voters[23] [note 1] |
Democratic[23] | Republican[23] | D–R spread[23] | Other[23] | No party preference[23] |
| Alameda | 73,239 | 59.7% | 55.0% | 14.2% | +40.8% | 10.0% | 20.8% |
| Albany | 18,217 | 59.1% | 64.0% | 6.5% | +57.5% | 11.8% | 18.9% |
| Berkeley | 111,008 | 72.9% | 64.7% | 4.4% | +60.3% | 15.3% | 17.0% |
| Dublin | 44,171 | 52.7% | 42.7% | 24.6% | +18.1% | 14.3% | 21.3% |
| Emeryville | 9,698 | 64.7% | 59.6% | 7.6% | +52.0% | 15.3% | 19.5% |
| Fremont | 211,748 | 47.9% | 46.4% | 17.5% | +28.9% | 12.2% | 26.0% |
| Hayward | 142,936 | 43.7% | 60.1% | 12.7% | +47.4% | 11.0% | 18.4% |
| Livermore | 79,710 | 61.5% | 39.4% | 33.1% | +6.3% | 12.4% | 18.2% |
| Newark | 42,322 | 48.6% | 53.9% | 16.6% | +37.3% | 10.7% | 21.1% |
| Oakland | 389,397 | 55.4% | 66.7% | 5.9% | +60.8% | 12.1% | 16.9% |
| Piedmont | 10,640 | 79.7% | 56.0% | 19.6% | +36.4% | 8.4% | 17.9% |
| Pleasanton | 69,220 | 61.5% | 38.2% | 31.8% | +6.4% | 12.0% | 20.5% |
| San Leandro | 83,877 | 50.9% | 58.7% | 13.7% | +45.0% | 10.2% | 19.5% |
| Union City | 68,830 | 48.6% | 54.9% | 13.1% | +41.8% | 10.5% | 23.3% |
Geography and climate
[edit]


According to the U.S. Census Bureau, the county has a total area of 821 square miles (2,130 km2), of which 739 square miles (1,910 km2) is land and 82 square miles (210 km2) (10%) is water.[24] The San Francisco Bay borders the county on the west.
The crest of the Berkeley Hills forms part of the northeastern boundary and reaches into the center of the county. A coastal plain several miles wide lines the bay; and is Oakland's most populous region. Livermore Valley lies in the eastern part of the county. Amador Valley abuts the western edge of Livermore Valley and continues west to the Pleasanton Ridge. The ridges and valleys of the Diablo Range, containing the county's highest peaks, cover the very sparsely populated southeast portion of the county.
The Hayward Fault, a major branch of the San Andreas Fault to the west, runs through the most populated parts of Alameda County, while the Calaveras Fault runs through the southeastern part of the county.
The areas near the Bay itself have a maritime warm-summer Mediterranean climate, whereas behind the mountains, summers are significantly warmer. The climate charts below are for Oakland and inland Livermore.
| Climate data for Oakland Museum (1981–2010 normals, extremes 1970–present) | |||||||||||||
|---|---|---|---|---|---|---|---|---|---|---|---|---|---|
| Month | Jan | Feb | Mar | Apr | May | Jun | Jul | Aug | Sep | Oct | Nov | Dec | Year |
| Record high °F (°C) | 78 (26) |
82 (28) |
88 (31) |
97 (36) |
105 (41) |
106 (41) |
103 (39) |
99 (37) |
109 (43) |
103 (39) |
84 (29) |
75 (24) |
109 (43) |
| Mean maximum °F (°C) | 67.0 (19.4) |
72.4 (22.4) |
75.9 (24.4) |
82.8 (28.2) |
85.5 (29.7) |
89.1 (31.7) |
87.3 (30.7) |
88.7 (31.5) |
89.7 (32.1) |
87.8 (31.0) |
75.8 (24.3) |
66.5 (19.2) |
94.7 (34.8) |
| Mean daily maximum °F (°C) | 58.0 (14.4) |
61.8 (16.6) |
63.6 (17.6) |
66.0 (18.9) |
68.8 (20.4) |
71.2 (21.8) |
71.7 (22.1) |
73.0 (22.8) |
74.1 (23.4) |
71.7 (22.1) |
64.6 (18.1) |
58.1 (14.5) |
66.6 (19.2) |
| Daily mean °F (°C) | 51.4 (10.8) |
54.7 (12.6) |
56.4 (13.6) |
58.3 (14.6) |
61.1 (16.2) |
63.5 (17.5) |
64.3 (17.9) |
65.6 (18.7) |
66.0 (18.9) |
63.3 (17.4) |
57.1 (13.9) |
51.8 (11.0) |
59.2 (15.1) |
| Mean daily minimum °F (°C) | 44.7 (7.1) |
47.7 (8.7) |
49.1 (9.5) |
50.5 (10.3) |
53.5 (11.9) |
55.7 (13.2) |
56.9 (13.8) |
58.1 (14.5) |
57.8 (14.3) |
55.1 (12.8) |
49.8 (9.9) |
45.4 (7.4) |
51.9 (11.1) |
| Mean minimum °F (°C) | 38.0 (3.3) |
40.0 (4.4) |
42.2 (5.7) |
45.2 (7.3) |
49.1 (9.5) |
51.9 (11.1) |
54.0 (12.2) |
55.5 (13.1) |
53.8 (12.1) |
49.0 (9.4) |
41.6 (5.3) |
37.3 (2.9) |
36.0 (2.2) |
| Record low °F (°C) | 30 (−1) |
29 (−2) |
34 (1) |
37 (3) |
43 (6) |
48 (9) |
51 (11) |
50 (10) |
48 (9) |
43 (6) |
36 (2) |
26 (−3) |
26 (−3) |
| Average precipitation inches (mm) | 4.59 (117) |
4.65 (118) |
3.52 (89) |
1.32 (34) |
0.73 (19) |
0.12 (3.0) |
0.00 (0.00) |
0.07 (1.8) |
0.23 (5.8) |
1.29 (33) |
3.07 (78) |
4.44 (113) |
24.09 (612) |
| Average precipitation days (≥ 0.01 in.) | 10.2 | 10.5 | 10.7 | 5.9 | 3.4 | 1.0 | 0.1 | 0.4 | 1.2 | 3.5 | 8.1 | 10.4 | 69.1 |
| Source: NOAA[25][26] | |||||||||||||
| Climate data for Livermore, California (1903–2013) | |||||||||||||
|---|---|---|---|---|---|---|---|---|---|---|---|---|---|
| Month | Jan | Feb | Mar | Apr | May | Jun | Jul | Aug | Sep | Oct | Nov | Dec | Year |
| Record high °F (°C) | 77 (25) |
80 (27) |
88 (31) |
96 (36) |
108 (42) |
113 (45) |
113 (45) |
112 (44) |
115 (46) |
106 (41) |
93 (34) |
79 (26) |
113 (45) |
| Mean maximum °F (°C) | 66.9 (19.4) |
71.4 (21.9) |
77.9 (25.5) |
85.8 (29.9) |
94.3 (34.6) |
102.0 (38.9) |
104.3 (40.2) |
102.8 (39.3) |
101.2 (38.4) |
92.6 (33.7) |
79.0 (26.1) |
67.8 (19.9) |
106.3 (41.3) |
| Mean daily maximum °F (°C) | 56.8 (13.8) |
61.2 (16.2) |
65.2 (18.4) |
70.5 (21.4) |
76.4 (24.7) |
83.1 (28.4) |
89.0 (31.7) |
88.2 (31.2) |
86.0 (30.0) |
77.7 (25.4) |
66.3 (19.1) |
57.5 (14.2) |
73.2 (22.9) |
| Mean daily minimum °F (°C) | 36.7 (2.6) |
39.4 (4.1) |
41.3 (5.2) |
43.6 (6.4) |
47.6 (8.7) |
51.7 (10.9) |
54.2 (12.3) |
54.0 (12.2) |
52.5 (11.4) |
47.7 (8.7) |
41.1 (5.1) |
37.0 (2.8) |
45.6 (7.6) |
| Mean minimum °F (°C) | 26.4 (−3.1) |
29.5 (−1.4) |
32.1 (0.1) |
34.9 (1.6) |
39.3 (4.1) |
44.4 (6.9) |
47.7 (8.7) |
47.8 (8.8) |
44.5 (6.9) |
38.3 (3.5) |
30.5 (−0.8) |
26.7 (−2.9) |
24.5 (−4.2) |
| Record low °F (°C) | 18 (−8) |
21 (−6) |
22 (−6) |
29 (−2) |
32 (0) |
38 (3) |
36 (2) |
36 (2) |
35 (2) |
29 (−2) |
22 (−6) |
18 (−8) |
18 (−8) |
| Average precipitation inches (mm) | 2.97 (75) |
2.47 (63) |
2.15 (55) |
1.00 (25) |
.44 (11) |
.11 (2.8) |
.02 (0.51) |
.04 (1.0) |
.22 (5.6) |
.67 (17) |
1.54 (39) |
2.56 (65) |
14.19 (359.91) |
| Average precipitation days (≥ .01 in) | 10 | 9 | 9 | 6 | 3 | 1 | 0 | 0 | 1 | 3 | 7 | 9 | 58 |
| Average snowy days | trace | 0.0 | 0.0 | 0.0 | 0.0 | 0.0 | 0.0 | 0.0 | 0.0 | 0.0 | 0.0 | 0.1 | 0.1 |
| Source: WRCC[27] and pogodaiklimat.ru[28] | |||||||||||||
Adjacent counties
[edit]The City and County of San Francisco, California, borders the county on the west, and has a small land border with the city of Alameda, California due to land filling.[29]
Santa Clara County borders the county on the south.
San Joaquin County borders the county on the east.
Contra Costa County borders the county on the north.
Stanislaus County borders the county on the easternmost end of its southern boundary for 250 feet (76 m).[30]
National protected area
[edit]Demographics
[edit]| Census | Pop. | Note | %± |
|---|---|---|---|
| 1860 | 8,927 | — | |
| 1870 | 24,237 | 171.5% | |
| 1880 | 62,976 | 159.8% | |
| 1890 | 93,864 | 49.0% | |
| 1900 | 130,197 | 38.7% | |
| 1910 | 246,131 | 89.0% | |
| 1920 | 344,177 | 39.8% | |
| 1930 | 474,883 | 38.0% | |
| 1940 | 513,011 | 8.0% | |
| 1950 | 740,315 | 44.3% | |
| 1960 | 908,209 | 22.7% | |
| 1970 | 1,073,184 | 18.2% | |
| 1980 | 1,105,379 | 3.0% | |
| 1990 | 1,279,182 | 15.7% | |
| 2000 | 1,443,741 | 12.9% | |
| 2010 | 1,510,271 | 4.6% | |
| 2020 | 1,682,353 | 11.4% | |
| 2024 (est.) | 1,649,060 | [31] | −2.0% |
| U.S. Decennial Census[32] 1790–1960[33] 1900–1990[34] 1990–2000[35] 2010[36] 2020[37] | |||
2020 census
[edit]| Race / Ethnicity (NH = Non-Hispanic) | Pop 1980[38] | Pop 1990[39] | Pop 2000[40] | Pop 2010[36] | Pop 2020[37] | % 1980 | % 1990 | % 2000 | % 2010 | % 2020 |
|---|---|---|---|---|---|---|---|---|---|---|
| White alone (NH) | 675,338 | 680,017 | 591,095 | 514,559 | 472,277 | 61.10% | 53.16% | 40.94% | 34.07% | 28.07% |
| Black or African American alone (NH) | 200,950 | 222,873 | 211,124 | 184,126 | 159,499 | 18.18% | 17.42% | 14.62% | 12.19% | 9.48% |
| Native American or Alaska Native alone (NH) | 7,446 | 6,763 | 5,306 | 4,189 | 4,131 | 0.67% | 0.53% | 0.37% | 0.28% | 0.25% |
| Asian alone (NH) | 85,899 | 184,813 | 292,673 | 390,524 | 540,511 | 7.77% | 14.45% | 20.27% | 25.86% | 32.13% |
| Native Hawaiian or Pacific Islander alone (NH) | x | x | 8,458 | 11,931 | 13,209 | x | x | 0.59% | 0.79% | 0.79% |
| Other race alone (NH) | 5,784 | 2,911 | 4,676 | 4,191 | 10,440 | 0.52% | 0.23% | 0.32% | 0.28% | 0.62% |
| Mixed race or Multiracial (NH) | x | x | 56,499 | 60,862 | 88,537 | x | x | 3.91% | 4.03% | 5.26% |
| Hispanic or Latino (any race) | 129,962 | 181,805 | 273,910 | 339,889 | 393,749 | 11.76% | 14.21% | 18.97% | 22.51% | 23.40% |
| Total | 1,105,379 | 1,279,182 | 1,443,741 | 1,510,271 | 1,682,353 | 100.00% | 100.00% | 100.00% | 100.00% | 100.00% |
2014
[edit]
A 2014 analysis by The Atlantic found Alameda County to be the fourth most racially diverse county in the United States, in terms of closest to equal representation of each racial and ethnic group,—behind Aleutians West Census Area and Aleutians East Borough in Alaska, and Queens County in New York—as well as the most diverse county in California.[41] The 2020 census shows Alameda as having one of the highest Asian percentages and being one of two counties in the continental US, along with neighboring Santa Clara County, California, to have an Asian plurality - consisting largely of Chinese, Indian and Filipino ancestry.[42]
2011
[edit]| Population, race, and income | |||||
|---|---|---|---|---|---|
| Total population[22] | 1,494,876 | ||||
| White[22] | 690,261 | 46.2% | |||
| Asian[22] | 391,627 | 26.2% | |||
| Hispanic or Latino (of any race)[43] | 332,103 | 22.2% | |||
| Black or African American[22] | 186,326 | 12.5% | |||
| Some other race[22] | 131,958 | 8.8% | |||
| Two or more races[22] | 75,411 | 5.0% | |||
| Native Hawaiian or other Pacific Islander[22] | 12,191 | 0.8% | |||
| American Indian or Alaska Native[22] | 7,102 | 0.5% | |||
| Per capita income[44] | $34,937 | ||||
| Median household income[45] | $70,821 | ||||
| Median family income[46] | $87,012 | ||||
Places by population, race, and income
[edit]| Places by population and race | ||||||||
|---|---|---|---|---|---|---|---|---|
| Place | Type[47] | Population[22] | White[22] | Other[22] [note 2] |
Asian[22] | Black or African American[22] |
Native American[22] [note 3] |
Hispanic or Latino (of any race)[43] |
| Alameda | City | 73,239 | 49.5% | 9.8% | 33.1% | 6.7% | 0.9% | 11.8% |
| Albany | City | 18,217 | 60.7% | 7.0% | 29.1% | 3.0% | 0.1% | 9.7% |
| Ashland | CDP | 22,106 | 53.4% | 11.9% | 16.4% | 17.0% | 1.3% | 46.7% |
| Berkeley | City | 111,008 | 61.5% | 8.0% | 20.6% | 9.3% | 0.6% | 10.5% |
| Castro Valley | CDP | 60,882 | 62.9% | 7.9% | 21.7% | 6.8% | 0.8% | 17.4% |
| Cherryland | CDP | 14,394 | 46.8% | 31.1% | 9.0% | 8.6% | 4.5% | 55.9% |
| Dublin | City | 44,171 | 57.5% | 8.7% | 26.2% | 6.9% | 0.7% | 12.9% |
| Emeryville | City | 9,698 | 44.1% | 5.7% | 36.3% | 13.8% | 0.2% | 8.8% |
| Fairview | CDP | 9,597 | 49.2% | 13.5% | 18.1% | 17.7% | 1.5% | 18.5% |
| Fremont | City | 211,748 | 33.9% | 12.8% | 49.0% | 3.3% | 1.1% | 15.4% |
| Hayward | City | 142,936 | 36.9% | 24.9% | 23.6% | 11.4% | 3.2% | 39.9% |
| Livermore | City | 79,710 | 78.9% | 8.4% | 10.3% | 1.8% | 0.5% | 19.0% |
| Newark | City | 42,322 | 42.1% | 24.4% | 26.2% | 4.3% | 3.0% | 35.2% |
| Oakland | City | 389,397 | 39.0% | 15.7% | 16.1% | 28.1% | 1.1% | 25.0% |
| Piedmont | City | 10,640 | 76.1% | 3.4% | 19.5% | 0.9% | 0.1% | 3.9% |
| Pleasanton | City | 69,220 | 68.0% | 6.2% | 22.9% | 2.5% | 0.4% | 10.6% |
| San Leandro | City | 83,877 | 44.9% | 10.2% | 29.6% | 13.4% | 1.9% | 26.0% |
| San Lorenzo | CDP | 24,096 | 54.1% | 17.2% | 20.8% | 6.5% | 1.4% | 35.9% |
| Sunol | CDP | 760 | 84.3% | 11.6% | 4.1% | 0.0% | 0.0% | 15.8% |
| Union City | City | 68,830 | 21.5% | 17.8% | 53.3% | 6.2% | 1.2% | 21.5% |
| Places by population and income | |||||
|---|---|---|---|---|---|
| Place | Type[47] | Population[48] | Per capita income[44] | Median household income[45] | Median family income[46] |
| Alameda | City | 73,239 | $39,160 | $75,832 | $93,349 |
| Albany | City | 18,217 | $37,552 | $72,479 | $87,500 |
| Ashland | CDP | 22,106 | $20,357 | $48,026 | $53,038 |
| Berkeley | City | 111,008 | $38,896 | $60,908 | $102,976 |
| Castro Valley | CDP | 60,882 | $38,535 | $82,370 | $97,628 |
| Cherryland | CDP | 14,394 | $19,610 | $50,987 | $48,120 |
| Dublin | City | 44,171 | $41,197 | $111,481 | $121,380 |
| Emeryville | City | 9,698 | $52,258 | $69,274 | $99,954 |
| Fairview | CDP | 9,597 | $38,267 | $85,288 | $97,969 |
| Fremont | City | 211,748 | $38,752 | $98,513 | $109,853 |
| Hayward | City | 142,936 | $24,987 | $62,115 | $69,044 |
| Livermore | City | 79,710 | $41,741 | $96,322 | $108,406 |
| Newark | City | 42,322 | $29,375 | $81,777 | $84,244 |
| Oakland | City | 389,397 | $31,675 | $51,144 | $58,237 |
| Piedmont | City | 10,640 | $92,232 | $199,304 | $221,875 |
| Pleasanton | City | 69,220 | $50,745 | $118,713 | $136,464 |
| San Leandro | City | 83,877 | $27,878 | $61,857 | $72,080 |
| San Lorenzo | CDP | 24,096 | $25,553 | $73,053 | $76,365 |
| Sunol | CDP | 760 | $62,651 | $72,656 | $86,250 |
| Union City | City | 68,830 | $29,612 | $82,634 | $91,176 |
2010
[edit]The 2010 United States census reported that Alameda County had a population of 1,510,271. The population density was 2,047.6 inhabitants per square mile (790.6/km2). The racial makeup of Alameda County was 649,122 (43.0%) White, 190,451 (12.6%) African American, 9,799 (0.6%) Native American, 394,560 (26.1%) Asian (9.7% Chinese, 5.5% Filipino, 4.8% Indian, 2.0% Vietnamese, 1.2% Korean, 0.8% Japanese, 2.2% Other Asian), 12,802 (0.8%) Pacific Islander, 162,540 (10.8%) from other races, and 90,997 (6.0%) from two or more races. Hispanic or Latino of any race were 339,889 persons (22.5%): 16.4% Mexican, 0.8% Puerto Rican, 0.2% Cuban, 5.1% Other Hispanic.[49]
|
| Population reported at 2010 United States census | |||||||||
|---|---|---|---|---|---|---|---|---|---|
| The County | Total Population |
White | African American |
Native American |
Asian | Pacific Islander |
other races |
two or more races |
Hispanic or Latino (of any race) |
| Alameda County | 1,510,271 | 649,122 | 190,451 | 9,799 | 394,560 | 12,802 | 162,540 | 90,997 | 339,889 |
| Incorporated cities |
Total Population |
White | African American |
Native American |
Asian | Pacific Islander |
other races |
two or more races |
Hispanic or Latino (of any race) |
| Alameda | 73,812 | 37,460 | 4,759 | 426 | 23,058 | 381 | 2,463 | 5,265 | 8,092 |
| Albany | 18,539 | 10,128 | 645 | 88 | 5,790 | 37 | 607 | 1,244 | 1,891 |
| Berkeley | 112,580 | 66,996 | 11,241 | 479 | 21,690 | 186 | 4,994 | 6,994 | 12,209 |
| Dublin | 46,036 | 23,634 | 4,347 | 246 | 12,321 | 287 | 2,458 | 2,743 | 6,663 |
| Emeryville | 10,080 | 4,490 | 1,764 | 44 | 2,775 | 16 | 348 | 643 | 927 |
| Fremont | 214,089 | 70,320 | 7,103 | 976 | 108,332 | 1,169 | 13,605 | 12,584 | 31,698 |
| Hayward | 144,186 | 49,309 | 17,099 | 1,396 | 31,666 | 4,535 | 30,004 | 10,177 | 58,730 |
| Livermore | 80,968 | 60,418 | 1,702 | 476 | 6,802 | 277 | 6,960 | 4,333 | 16,920 |
| Newark | 42,573 | 17,566 | 2,002 | 279 | 11,571 | 621 | 7,735 | 2,799 | 14,994 |
| Oakland | 390,724 | 134,925 | 109,471 | 3,040 | 65,811 | 2,222 | 53,378 | 21,877 | 99,068 |
| Piedmont | 10,667 | 7,917 | 144 | 6 | 1,939 | 13 | 94 | 554 | 421 |
| Pleasanton | 70,285 | 47,058 | 1,190 | 226 | 16,322 | 134 | 2,002 | 3,353 | 7,264 |
| San Leandro | 84,950 | 31,946 | 10,437 | 669 | 25,206 | 642 | 11,295 | 4,755 | 23,237 |
| Union City | 69,516 | 16,640 | 4,402 | 329 | 35,363 | 892 | 7,253 | 4,637 | 15,895 |
| Census-designated places |
Total Population |
White | African American |
Native American |
Asian | Pacific Islander |
other races |
two or more races |
Hispanic or Latino (of any race) |
| Ashland | 21,925 | 6,705 | 4,269 | 232 | 4,031 | 260 | 5,124 | 1,304 | 9,394 |
| Castro Valley | 61,388 | 35,602 | 4,260 | 329 | 13,140 | 417 | 3,757 | 3,883 | 10,689 |
| Cherryland | 14,728 | 6,035 | 1,698 | 200 | 1,404 | 310 | 4,016 | 1,065 | 7,955 |
| Fairview | 10,003 | 4,499 | 2,105 | 76 | 1,525 | 129 | 913 | 756 | 2,171 |
| San Lorenzo | 23,452 | 11,115 | 1,136 | 228 | 5,054 | 182 | 4,207 | 1,530 | 8,843 |
| Sunol | 913 | 780 | 1 | 6 | 48 | 7 | 19 | 52 | 91 |
| Other unincorporated areas |
Total Population |
White | African American |
Native American |
Asian | Pacific Islander |
other races |
two or more races |
Hispanic or Latino (of any race) |
| All others not CDPs (combined) | 8,857 | 5,579 | 676 | 48 | 712 | 85 | 1,308 | 449 | 2,737 |
2000
[edit]As of the census[51] of 2000, there were 1,443,741 people, 523,366 households, out of which 32.6% had children under the age of 18 living within them, 47.0% married couples living together, 13.0% had a female householder with no husband present, and 35.2% were non-families. 26.0% of all households were made up of individuals, and 7.3% had someone living alone who was 65 years of age or older. The average household size was 2.71 and the average family size was 3.31.
In the county, the population was spread out, with 24.6% under the age of 18, 9.6% from 18 to 24, 33.9% from 25 to 44, 21.7% from 45 to 64, and 10.2% who were 65 years of age or older. The median age was 34 years. For every 100 females there were 96.60 males. For every 100 females age 18 and over, there were 94.00 males.
The median income for a household in the county was $55,946, and the median income for a family was $65,857 (these figures had risen to $66,430 and $81,341 respectively as of a 2007 estimate[52]). Males had a median income of $47,425 versus $36,921 for females. The per capita income for the county was $26,680. About 7.7% of families and 11.0% of the population were below the poverty line, including 13.5% of those under age 18 and 8.1% of those age 65 or over.
In 2000, the largest denominational group was the Catholics (with 306,437 adherents).[53] The largest religious bodies were the Catholic Church (with 306,437 members) and Judaism (with 32,500 members).[53]
2019 United States Census Bureau American Community Survey estimates
[edit]|
Racial Makeup of Alameda County (2019)[54]
|
Racial Makeup of Alameda County excluding Hispanics from racial categories (2019)[54]
NH=Non-Hispanic
|
Racial Makeup of Hispanics in Alameda County (2019)[54]
|
According to 2019 US Census Bureau estimates, Alameda County's population was 38.8% White (30.4% Non-Hispanic White and 8.4% Hispanic White), 10.7% Black or African American, 31.1% Asian, 11.5% Some Other Race, 0.8% Native American and Alaskan Native, 0.8% Pacific Islander and 6.4% from two or more races.[54]
The White population continues to remain the largest racial category in Alameda County and includes the 37.7% of Hispanics who self-identify as White. The remainder of Hispanics self-identify as Other Race (49.2%), Multiracial (8.7%), American Indian and Alaskan Native (1.9%), Black (1.5%), Asian (0.9%), and Hawaiian and Pacific Islander (0.2%).[54]
The Black population continues to decline and at 10.7% (including Black Hispanics)[54] is below the national average of 12.8% (including Black Hispanics).[55] The Black population peaked in the 1980 Census at 18.4%.[56] Alameda county has the 2nd highest percentage of Black residents in California after Solano County at 13.4%.
If Hispanics are treated as a separate category from race, Alameda County's population was 30.4% White, 30.9% Asian, 22.3% Hispanic-Latino, 10.3% Black or African American, 0.5% Some Other Race, 0.3% Native American and Alaskan Native, 0.8% Pacific Islander and 4.4% from two or more races.[57]
Asian Americans are now the largest racial/ethnic group at 30.9% (excluding Asian Hispanics).[54]
White Non-Hispanic Americans are the largest minority group at 30.4% of the population.[54]
By ethnicity, 22.3% of the total population is Hispanic-Latino (of any race) and 77.7% is Non-Hispanic (of any race). If treated as a category separate from race, Hispanics are the third largest minority group in Alameda County.[54]
The largest ancestry group of Hispanics in Alameda County (2018) are of Mexican descent (72.9% of Hispanics) followed by Salvadoran descent (5.5% of Hispanics), Guatemalan descent (3.9%), Puerto Rican descent (3.4%), Spaniard descent (2.0%), Nicaraguan descent (1.7%), Peruvian descent (1.4%), Cuban descent (1.2%), Colombian descent (1.1%), and those of other Hispanic ethnicity or of mixed Hispanic ethnicity (6.9%).[58]
Crime
[edit]The following table includes the number of incidents reported and the rate per 1,000 persons for each type of offense.
| Population and crime rates in 2009 | ||
|---|---|---|
| Population[22] | 1,494,876 | |
| Violent crime[59] | 11,189 | 7.48 |
| Homicide[59] | 138 | 0.09 |
| Forcible rape[59] | 553 | 0.37 |
| Robbery[59] | 5,215 | 3.49 |
| Aggravated assault[59] | 5,283 | 3.53 |
| Property crime[59] | 33,395 | 22.34 |
| Burglary[59] | 11,478 | 7.68 |
| Larceny-theft[59][note 4] | 32,102 | 21.47 |
| Motor vehicle theft[59] | 12,768 | 8.54 |
| Arson[59] | 457 | 0.31 |
Cities by population and crime rates
[edit]| Cities by population and crime rates in 2012 | ||||||||
|---|---|---|---|---|---|---|---|---|
| City | Population[60] | Violent crimes[60] | Violent crime rate per 1,000 persons |
Property crimes[60] | Property crime rate per 1,000 persons | |||
| Alameda | 75,467 | 160 | 2.12 | 1,892 | 25.07 | |||
| Albany | 18,960 | 35 | 1.85 | 537 | 28.32 | |||
| Berkeley | 114,961 | 487 | 4.24 | 5,696 | 49.55 | |||
| Dublin | 49,890 | 84 | 1.79 | 731 | 15.55 | |||
| Emeryville | 10,309 | 175 | 16.98 | 1,735 | 168.30 | |||
| Fremont | 218,927 | 306 | 1.40 | 4,259 | 19.45 | |||
| Hayward | 147,424 | 613 | 4.16 | 4,792 | 32.50 | |||
| Livermore | 82,800 | 301 | 3.64 | 1,805 | 21.80 | |||
| Newark | 43,539 | 169 | 3.88 | 1,349 | 30.98 | |||
| Oakland | 399,487 | 7,963 | 19.93 | 26,342 | 65.94 | |||
| Piedmont | 10,909 | 13 | 1.19 | 333 | 30.53 | |||
| Pleasanton | 71,875 | 49 | 0.68 | 1,279 | 17.79 | |||
| San Leandro | 86,869 | 437 | 5.03 | 3,585 | 41.27 | |||
| Union City | 71,089 | 235 | 3.31 | 1,808 | 25.43 | |||
Education
[edit]The Alameda County Office of Education oversees seventeen K–12 school districts and one K–8 district in Alameda County. In all, there are approximately 10,000 teachers serving 225,000 students. The ACOE also services three community college districts with a total enrollment of approximately 55,000 students.
The Alameda County Library operates libraries in the cities of Albany, Dublin, Fremont, Newark and Union City and the unincorporated communities of Castro Valley and San Lorenzo. The cities of Alameda, Berkeley, Hayward, Livermore, Oakland, San Leandro, and Pleasanton have their own library systems.
Colleges and universities
[edit]Alameda County is home to the University of California, Berkeley, the flagship campus of the University of California system, and one of the largest and most prestigious research universities in the world.
Other colleges and universities located within Alameda county include:
- Berkeley City College
- California State University, East Bay, one of the campuses of the California State University system
- Chabot College, a two-year community college, part of the Chabot-Las Positas Community College District
- College of Alameda, a two-year community college, part of the Peralta Community College District of northern Alameda County
- Graduate Theological Union, a consortium of several Bay Area seminaries, affiliated with the University of California, Berkeley.
- Laney College, a two-year community college, part of the Peralta Community College system
- Las Positas College
- Merritt College, a two-year community college, part of the Peralta Community College system
- Mills College at Northeastern University, a private 4 year women's college and coeducational graduate school
- Ohlone College, part of the Ohlone Community College District
- Samuel Merritt University
Other local colleges and universities which have now closed include:
- SAE Expression College, a for-profit school specializing in creative media
- Holy Names University
Public schools
[edit]- School districts[61]
K–12 unified school districts:
- Alameda Unified School District
- Albany Unified School District
- Berkeley Unified School District
- Castro Valley Unified School District
- Dublin Unified School District
- Emery Unified School District
- Fremont Unified School District
- Hayward Unified School District
- Livermore Valley Joint Unified School District
- New Haven Unified School District
- Newark Unified School District
- Oakland Unified School District
- Piedmont Unified School District
- Pleasanton Unified School District
- San Leandro Unified School District
- San Lorenzo Unified School District
- Sunol Glen Unified School District
Others:
- Lammersville Joint Unified School District (high)
- Mountain House Elementary School District (elementary)
- State-operated schools
Arts
[edit]The Alameda County Arts Commission, a division of the county administration, under the California Arts Council, was created in 1965. Its fifteen appointed members act in an advisory capacity to the board of supervisors, in promoting the arts. The Oakland Museum of California has a substantial collection of California art works and historical artifacts.
Sports
[edit]The following sports teams play in Alameda County:
| Club | Sport | Founded | League | Venue |
|---|---|---|---|---|
| California Golden Bears | NCAA | 1868 | NCAA: ACC | California Memorial Stadium (Football), Haas Pavilion (Basketball), Evans Diamond (Baseball) |
| East Bay FC Stompers | Soccer | 2012 (in San Francisco from 2012 to 2015) | National Premier Soccer League: Golden Gate Conference | Pioneer Stadium |
| Oakland Roots | Soccer | 2018 | USL Championship | Pioneer Stadium |
Events
[edit]The annual county fair is held at the Alameda County Fairgrounds in Pleasanton. The fair runs for four weekends from June to July. Attractions include horse racing, carnival rides, 4-H exhibits, and live bands.
Parks and recreation
[edit]There are more than 350 parks located within the county.[62] The East Bay Regional Park District operates within Alameda and neighboring Contra Costa County, with numerous parks within the county, including Tilden Regional Park, Redwood Regional Park, Anthony Chabot Regional Park, Coyote Hills Regional Park, Ardenwood Historic Farm, Pleasanton Ridge Regional Park and Vargas Plateau Regional Park. Eastshore State Park is located partially along the bay shore of northern Alameda County. The San Francisco Bay Trail, a project of the Association of Bay Area Governments, will run along the bay shore of the county.[63] The Hayward Area Recreation and Park District is the largest special park district in California.
Transportation
[edit]Major highways
[edit] I-80
I-80 I-205
I-205
 I-238 / SR 238
 I-580
I-580 I-680
I-680 I-880
I-880 I-980
I-980 SR 13
SR 13 SR 24
SR 24 SR 61
SR 61 SR 77
SR 77 SR 84
SR 84 SR 92
SR 92 SR 123 – former US 40
 SR 185
 SR 262
Mass transit
[edit]Rail
[edit]- Altamont Corridor Express (ACE) – commuter rail using existing railroad tracks; primarily brings commuters from San Joaquin County to Santa Clara County
- Amtrak
- California Zephyr – intercity train route running between Emeryville and Chicago.
- Capitol Corridor – commuter rail using existing railroad tracks, extending from San Jose to Sacramento, running through western Alameda County
- Coast Starlight – intercity train route running between Los Angeles and Seattle via Oakland and Emeryville
- Gold Runner – Amtrak route between Oakland and Bakersfield through Fresno and the Central Valley
- Bay Area Rapid Transit (BART) – rapid transit commuter rail centered on northwest Oakland, primarily serving commuters to downtown San Francisco and downtown Oakland
- Valley Link – planned commuter rail running between the Tri-Valley and San Joaquin County (expected to commence in 2028)
Bus
[edit]- AC Transit – local bus system in western Alameda County and west Contra Costa County, with additional service across the three bridges from Alameda County to downtown San Francisco, San Mateo, and Palo Alto
- WHEELS – bus system in the cities of southeastern Alameda County
- Union City Transit – local city bus service within Union City in addition to AC Transit
- Emery-Go-Round – free bus service in Emeryville
- Dumbarton Express – additional service across the Dumbarton Bridge between Fremont and Palo Alto
- Santa Clara Valley Transportation Authority (VTA) – commuter service between southern Alameda county and job centers in the Silicon Valley
Ferry
[edit]- Alameda / Oakland Ferry and Harbor Bay Ferry – connect Oakland, Alameda, and Bay Farm Island with downtown San Francisco
Airports
[edit]The main airport is the Oakland San Francisco Bay Airport, with two general aviation airports, the Hayward Executive Airport and Livermore Municipal Airport.
Services
[edit]Alameda Health System operates the public health system in Alameda County. It operates five hospitals (Alameda Hospital, Fairmont Hospital, Highland Hospital, John George Psychiatric Hospital, and San Leandro Hospital), and four primary care medical clinics (called ambulatory wellness centers) within the county.
The Alameda County Community Food Bank nonprofit provides food bank resources to residents. The Family Emergency Shelter Coalition coordinates services for homeless families.
Landmarks
[edit]Alameda County has eight National Historic Landmarks: The Abbey, Joaquin Miller House, First Church of Christ, Scientist, USS Hornet (CVS-12) (aircraft carrier), Lake Merritt Wild Duck Refuge, Lightship WAL-605, Relief, Paramount Theatre, Potomac (Presidential yacht), and Room 307, Gilman Hall, University of California. The county has a large number of National Historic Places, as well as a number of California Historical Landmarks.
Sister counties
[edit]Alameda has two sister county: Taoyuan County, Taiwan (now Taoyuan City) and Zhongshan in China.[64]
Communities
[edit]
Cities
[edit]| No. on Map |
City | Year incorporated |
Population, 2020[65] |
|---|---|---|---|
| 1 | Alameda | 1854 | 78,280 |
| 2 | Albany | 1908 | 20,271 |
| 3 | Berkeley | 1878 | 124,321 |
| 4 | Dublin | 1982 | 72,589 |
| 5 | Emeryville | 1896 | 12,905 |
| 6 | Fremont | 1956 | 230,504 |
| 7 | Hayward | 1876 | 162,954 |
| 8 | Livermore | 1876 | 87,955 |
| 9 | Newark | 1955 | 47,529 |
| 10 | Oakland (county seat) | 1852 | 440,646 |
| 11 | Piedmont | 1907 | 11,270 |
| 12 | Pleasanton | 1894 | 79,871 |
| 13 | San Leandro | 1872 | 91,008 |
| 14 | Union City | 1959 | 70,143 |
Census-designated places
[edit]Unincorporated communities
[edit]Former townships
[edit]
- Oakland Township – the northern portion subsequently became the cities of Berkeley and Albany.
- Alameda Township – now essentially coterminous with the City of Alameda.
- Brooklyn Township – mostly contained within Oakland and Piedmont.
- Eden Township – partly incorporated into San Leandro and Hayward, the rest contains the communities of Castro Valley, San Lorenzo, and other unincorporated areas.
- Washington Township – contains Union City, Newark, Fremont, and small unincorporated areas nearby.
- Murray Township — Contains cities of Dublin, Pleasanton, and Livermore, and substantial unincorporated areas including Sunol.
Population ranking
[edit]The population ranking of the following table is based on the 2020 census of Alameda County.[66]
† county seat
| Rank | City/Town/etc. | Municipal type | Population (2020 Census) |
|---|---|---|---|
| 1 | † Oakland | City | 440,646 |
| 2 | Fremont | City | 230,504 |
| 3 | Hayward | City | 162,954 |
| 4 | Berkeley | City | 124,321 |
| 5 | San Leandro | City | 91,008 |
| 6 | Livermore | City | 87,955 |
| 7 | Pleasanton | City | 79,871 |
| 8 | Alameda | City | 78,280 |
| 9 | Dublin | City | 72,589 |
| 10 | Union City | City | 70,143 |
| 11 | Castro Valley | CDP | 66,441 |
| 12 | Newark | City | 47,529 |
| 13 | San Lorenzo | CDP | 29,581 |
| 14 | Ashland | CDP | 23,823 |
| 15 | Albany | City | 20,271 |
| 16 | Cherryland | CDP | 15,808 |
| 17 | Emeryville | City | 12,905 |
| 18 | Fairview | CDP | 11,341 |
| 19 | Piedmont | City | 11,270 |
| 20 | Sunol | CDP | 922 |
See also
[edit]- USS Alameda County (LST-32), the only US Naval vessel named after the county
- National Register of Historic Places listings in Alameda County, California
- Solar power in Alameda County
- List of counties in California
Notes
[edit]- ^ a b Percentage of registered voters with respect to total population. Percentages of party members with respect to registered voters follow.
- ^ Other = Some other race + Two or more races
- ^ Native American = Native Hawaiian or other Pacific Islander + American Indian or Alaska Native
- ^ Only larceny-theft cases involving property over $400 in value are reported as property crimes.
References
[edit]- ^ "Alameda County". Geographic Names Information System. United States Geological Survey, United States Department of the Interior. Retrieved January 22, 2015.
- ^ "Home | Board of Supervisors | Alameda County". bos.acgov.org.
- ^ "Discovery Peak". Peakbagger.com. Retrieved March 15, 2015.
- ^ a b "U.S. Census Bureau QuickFacts: Alameda County, California". United States Census Bureau. 2020. Retrieved September 20, 2021.
- ^ "Gross Domestic Product: All Industries in Alameda County, CA". fred.stlouisfed.org.
- ^ "Alameda County, California". United States Census Bureau. Retrieved January 30, 2022.
- ^ About Alameda County – County of Alameda – Superior Court of California Archived June 18, 2018, at the Wayback Machine Alameda.courts.ca.gov. Retrieved on July 15, 2013.
- ^ "Find a County". National Association of Counties. Archived from the original on May 31, 2011. Retrieved June 7, 2011.
- ^ "ALAMEDA English Definition and Meaning". Lexico Dictionaries | English. Archived from the original on October 26, 2019.
- ^ "Definition of ALAMEDA". Merriam-Webster.
- ^ California Government Code § 23004
- ^ "Board of Supervisors". Alameda County. Retrieved January 22, 2015.
- ^ Morris, Scott (July 15, 2021). "Alameda County District Attorney Nancy O'Malley is stepping aside". The Oaklandside. Retrieved July 28, 2022.
- ^ Sharpe, Joshua (November 19, 2022). "Civil rights attorney Pamela Price makes history as Alameda County's next district attorney". San Francisco Chronicle. Retrieved September 17, 2023.
- ^ "Alameda County Fire Department". Archived from the original on March 29, 2016. Retrieved June 22, 2010.
- ^ "Members Assembly". State of California. Retrieved November 4, 2025.
- ^ "Senators". State of California. Retrieved November 4, 2025.
- ^ pres_general_ssov_for_all.xls
- ^ a b Leip, David. "Dave Leip's Atlas of U.S. Presidential Elections". uselectionatlas.org. Retrieved August 30, 2018.
- ^ "Statement of Vote" (PDF). www.sos.ca.gov. Archived from the original (PDF) on October 18, 2012.
- ^ a b c d e f g h i j k l "Statement of Vote, November 8, 2022, General Election" (PDF). California Secretary of State. Retrieved May 5, 2023.
- ^ a b c d e f g h i j k l m n o p U.S. Census Bureau. American Community Survey, 2011 American Community Survey 5-Year Estimates, Table B02001. U.S. Census website . Retrieved October 26, 2013.
- ^ a b c d e f California Secretary of State. February 10, 2013 – Report of Registration Archived July 27, 2013, at the Wayback Machine. Retrieved October 31, 2013.
- ^ "2010 Census Gazetteer Files". United States Census Bureau. August 22, 2012. Retrieved September 24, 2015.
- ^ "NowData – NOAA Online Weather Data". National Oceanic and Atmospheric Administration. Retrieved September 29, 2015.
- ^ "CA Oakland Museum". National Oceanic and Atmospheric Administration. Archived from the original on May 24, 2017. Retrieved September 29, 2015.
- ^ "LIVERMORE, CALIFORNIA – Climate Summary". www.wrcc.dri.edu. Retrieved June 5, 2018.
- ^ "Климат Ливермора – Погода и климат". www.pogodaiklimat.ru. Retrieved June 20, 2019.
- ^ "Why Is Part of Alameda Island in San Francisco?". KQED. November 1, 2018.
- ^ "The National Map - Advanced Viewer".
- ^ "QuickFacts Alameda County, California". United States Census Bureau. Retrieved May 9, 2025.
- ^ "Census of Population and Housing from 1790-2000". US Census Bureau. Retrieved January 24, 2022.
- ^ "Historical Census Browser". University of Virginia Library. Retrieved September 24, 2015.
- ^ Forstall, Richard L., ed. (March 27, 1995). "Population of Counties by Decennial Census: 1900 to 1990". United States Census Bureau. Retrieved September 24, 2015.
- ^ "Census 2000 PHC-T-4. Ranking Tables for Counties: 1990 and 2000" (PDF). United States Census Bureau. April 2, 2001. Retrieved September 24, 2015.
- ^ a b "P2: Hispanic or Latino, and Not Hispanic or Latino by Race – 2010: DEC Redistricting Data (PL 94-171) – Alameda County, California". United States Census Bureau.
- ^ a b "P2: Hispanic or Latino, and Not Hispanic or Latino by Race – 2020: DEC Redistricting Data (PL 94-171) – Alameda County, California". United States Census Bureau.
- ^ "California: 1980, General Social and Economic Characteristics, Part 1" (PDF). United States Census Bureau.
- ^ "California: 1990, Part 1" (PDF). United States Census Bureau. Retrieved July 14, 2024.
- ^ "P004: Hispanic or Latino, and Not Hispanic or Latino by Race – 2000: DEC Summary File 1 – Alameda County, California". United States Census Bureau.
- ^ Narula, Svati Kirsten (April 29, 2014). "The 5 U.S. Counties Where Racial Diversity Is Highest—and Lowest". The Atlantic. Retrieved May 8, 2017.
- ^ "Justice Map - Visualize race and income data for your community". Retrieved January 19, 2022.
- ^ a b U.S. Census Bureau. American Community Survey, 2011 American Community Survey 5-Year Estimates, Table B03003. U.S. Census website . Retrieved October 26, 2013.
- ^ a b U.S. Census Bureau. American Community Survey, 2011 American Community Survey 5-Year Estimates, Table B19301. U.S. Census website . Retrieved October 21, 2013.
- ^ a b U.S. Census Bureau. American Community Survey, 2011 American Community Survey 5-Year Estimates, Table B19013. U.S. Census website . Retrieved October 21, 2013.
- ^ a b U.S. Census Bureau. American Community Survey, 2011 American Community Survey 5-Year Estimates, Table B19113. U.S. Census website . Retrieved October 21, 2013.
- ^ a b U.S. Census Bureau. American Community Survey, 2011 American Community Survey 5-Year Estimates. U.S. Census website . Retrieved October 21, 2013.
- ^ U.S. Census Bureau. American Community Survey, 2011 American Community Survey 5-Year Estimates, Table B01003. U.S. Census website . Retrieved October 21, 2013.
- ^ "2010 Census P.L. 94-171 Summary File Data". United States Census Bureau.
- ^ "Bay Area Census". www.bayareacensus.ca.gov.
- ^ "U.S. Census website". United States Census Bureau. Retrieved May 14, 2011.
- ^ "American FactFinder - Community Facts > Alameda County, California". Archived from the original on February 11, 2020.
- ^ a b "County Membership Reports". thearda.com. Archived from the original on July 10, 2011. Retrieved August 22, 2011.
- ^ a b c d e f g h i "B03002 HISPANIC OR LATINO ORIGIN BY RACE – Alameda County, California – 2019 American Community Survey 1-Year Estimates". U.S. Census Bureau. July 1, 2019. Retrieved January 30, 2021.
- ^ "B03002 HISPANIC OR LATINO ORIGIN BY RACE – United States – 2019 American Community Survey 1-Year Estimates". U.S. Census Bureau. July 1, 2019. Retrieved January 28, 2021.
- ^ "Alameda County Decennial Census data". Bay Area Census. Archived from the original on October 11, 2004. Retrieved January 28, 2020.
- ^ "B03002 HISPANIC OR LATINO ORIGIN BY RACE – Alameda County, California – 2018 American Community Survey 1-Year Estimates". U.S. Census Bureau. July 1, 2018. Retrieved January 28, 2020.
- ^ "B03001 HISPANIC OR LATINO ORIGIN BY SPECIFIC ORIGIN – Alameda County, California – 2018 American Community Survey 1-Year Estimates". U.S. Census Bureau. July 1, 2018. Retrieved January 28, 2020.
- ^ a b c d e f g h i j Office of the Attorney General, Department of Justice, State of California. Table 11: Crimes – 2009 Archived December 2, 2013, at the Wayback Machine. Retrieved November 14, 2013.
- ^ a b c United States Department of Justice, Federal Bureau of Investigation. Crime in the United States, 2012, Table 8 (California). Retrieved November 14, 2013.
- ^ "2020 CENSUS - SCHOOL DISTRICT REFERENCE MAP: Alameda County, CA" (PDF). U.S. Census Bureau. Retrieved July 19, 2022. - Text list
- ^ Alameda County California Parks. California.hometownlocator.com. Retrieved on July 15, 2013.
- ^ San Francisco Baytrail. Baytrail.abag.ca.gov. Retrieved on July 15, 2013.
- ^ Alameda – Taoyuan Sister County Association – Homepage. Acgov.org. Retrieved on July 15, 2013.
- ^ "U.S. Census Bureau QuickFacts: Alameda County, California". United States Census Bureau. Retrieved June 25, 2023.
- ^ "By Decade".
External links
[edit] Media from Commons
 Travel information from Wikivoyage
- Official website

- map of Alameda County with supervisorial district boundaries
- Alameda County Fairgrounds – Annual county fair June to July
- A short film about Alameda County from 1958
- Alameda County Fire Department Archived March 29, 2016, at the Wayback Machine
- Alameda County Fire Department Training Division
- Hiking trails in Alameda County, at the Berkeley Wiki website
Places adjacent to Alameda County, California | ||||||||||||||||
|---|---|---|---|---|---|---|---|---|---|---|---|---|---|---|---|---|
| ||||||||||||||||
Municipalities and communities of Alameda County, California, United States | ||
|---|---|---|
| Cities | 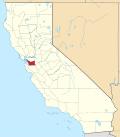 | |
| Census-designated places | ||
| Unincorporated communities | ||
| Annexed communities | ||
| Former townships | ||
| Former communities | ||
| Bodies of water |
|  | |||||||||||
|---|---|---|---|---|---|---|---|---|---|---|---|---|---|
| Counties | |||||||||||||
| Cities and towns |
| ||||||||||||
| CDPs over 10k | |||||||||||||
| Sub-regions | |||||||||||||
| Other | |||||||||||||
| International | |
|---|---|
| National | |
| Geographic | |
| Other | |
Alameda County, California
View on GrokipediaGeography
Physical Features and Climate
Alameda County lies in the East Bay portion of the San Francisco Bay Area, encompassing a varied terrain of coastal lowlands, alluvial plains, and inland hills. The western sector features flatlands along the San Francisco Bay shoreline, including reclaimed marshes and the elongated Alameda Island, while the central region rises into the Oakland Hills with elevations up to 2,500 feet at peaks like Mission Peak.[9] To the east, the landscape opens into the Livermore Valley, flanked by foothills of the Diablo Range that reach higher elevations around 3,000 feet, shaped by tectonic uplift and erosion.[10] This topography results from ongoing plate boundary interactions along the San Andreas Fault system, promoting seismic activity.[10] The county's primary water features include over 100 miles of San Francisco Bay waterfront, forming estuaries and tidal flats that influence sediment deposition and coastal morphology. The bay's proximity creates microclimatic variations, with evaporation cooling summer air along the shore and retaining heat to temper winter lows. Inland areas experience greater diurnal temperature swings due to less maritime moderation.[11] Alameda County exhibits a Mediterranean climate, with mild temperatures, low annual precipitation, and distinct seasonal patterns driven by Pacific storm tracks. Average annual rainfall measures approximately 22 inches, mostly falling between October and April, while summers remain arid with negligible precipitation. High temperatures average 58°F in January and 74°F in September, with lows rarely dropping below 37°F or exceeding 85°F annually.[12] [13] Seismically, the Hayward Fault bisects the county, generating right-lateral strike-slip motion and posing high risk for destructive quakes; models indicate a magnitude 6.9 event could rupture 50-70 miles, amplifying ground shaking in sedimentary basins of the flatlands and causing liquefaction in bay-adjacent zones. This fault's activity has historically limited dense development on unstable slopes, channeling urban growth to stable plains, though flood vulnerability persists in low-elevation areas prone to tidal surges and subsidence.[14] [15]Boundaries and Adjacent Areas
Alameda County encompasses approximately 739 square miles, including 656 square miles of land and 82 square miles of water, primarily from the San Francisco Bay. Its boundaries are legally defined in California Government Code Section 23006, commencing at the intersection of the southern boundary of Contra Costa County and extending along specified lines through natural features and survey points.[16] [17] The county shares land borders with three adjacent counties: Contra Costa County to the north, along the crest of the Berkeley Hills and segments near the Carquinez Strait; San Joaquin County to the east, primarily through the Livermore Valley and Altamont Pass region; and Santa Clara County to the south, delineated by ridgelines such as those of Mission Peak. To the west, the San Francisco Bay forms a water boundary, separating Alameda County from San Francisco and San Mateo counties without direct terrestrial contiguity to the latter, though proximity across the bay influences regional interactions via bridges like the San Mateo Bridge.[18] [19] Portions of the county's boundaries incorporate protected natural areas managed collaboratively with neighbors, notably through the East Bay Regional Park District, which administers 73 parks totaling 125,496 acres across Alameda and Contra Costa counties, including shoreline and hillside preserves along their shared northern frontier. This district facilitates cross-boundary conservation and recreation, with trails and habitats extending seamlessly into adjacent jurisdictions.[20] Geographic adjacency drives economic interdependencies, including substantial cross-county commuting; for instance, many residents travel daily to Contra Costa via State Route 24 or to Santa Clara via Interstate 680, contributing to integrated labor markets in the East Bay subregion. U.S. Census Bureau data reflect this, showing over 40% of Alameda County workers commuting outside the county, underscoring the blurred functional boundaries despite formal lines.[21][22]History
Indigenous and Early Settlement Periods
The territory comprising present-day Alameda County was long inhabited by Ohlone (also known as Costanoan) peoples, whose ancestors occupied the San Francisco Bay Area for at least 2,000 years, as demonstrated by ancient DNA analysis from burial sites linking modern Muwekma Ohlone descendants to pre-colonial remains near Mission San Jose and other East Bay locations.[23] Archaeological evidence, including shell middens and village sites along creeks like San Lorenzo and Alameda, indicates semi-sedentary communities that exploited diverse ecosystems through acorn gathering, fishing in the Bay, hunting deer and rabbits, and seasonal migrations for resources, with estimated pre-contact populations in the thousands across the peninsula and East Bay.[24] These groups, part of broader Ohlone linguistic and cultural clusters, maintained villages such as those near modern Fremont and Oakland, practicing controlled burns for habitat management and trade networks extending to Central Valley tribes.[25] European contact began with the Portolá expedition in 1769–1770, which traversed the East Bay but left initial impacts limited to transient exploration; sustained colonization followed with the establishment of Mission San José in 1797, drawing local Ohlone bands into coerced labor systems for agriculture and herding, resulting in catastrophic population declines from introduced diseases like smallpox and syphilis, as well as malnutrition and violence, reducing Bay Area Ohlone numbers from approximately 7,000–10,000 in 1770 to under 2,000 by the 1830s.[24] Mission records document neophyte resistance through flight and uprisings, yet systemic encomienda-style exploitation integrated survivors into ranchos post-secularization under Mexican rule after 1834, fragmenting traditional land use and dispersing communities into small rancherías.[26] Under Mexican governance from 1821, large ranchos were granted to Californio elites, including the 44,800-acre Rancho San Antonio awarded to Luís María Peralta in 1820 (confirmed in 1842), encompassing much of modern Oakland, Berkeley, and Alameda, used primarily for cattle ranching on former Ohlone territories.[27] Other grants, such as Arroyo de la Alameda (Bartolomé Pacheco, 1839) and Rancho San Lorenzo (Guillermo Castro, 1841), facilitated hacienda-style operations reliant on peon labor from mission remnants.[28] The U.S. conquest via the Bear Flag Revolt (1846) and Treaty of Guadalupe Hidalgo (1848) introduced American squatters challenging Mexican titles, accelerated by the Gold Rush discovery at Sutter's Mill in January 1848, which drew thousands of migrants seeking Bay Area ports and fertile valleys for provisioning mines, initiating subdivision of ranchos through legal claims under the Land Act of 1851.[29] Alameda County was formally established on May 10, 1853, carved from northern portions of Santa Clara County and eastern segments of Contra Costa County to accommodate growing Anglo-American settlements in the East Bay, with initial boundaries reflecting the need for local governance amid rapid influxes of farmers and speculators displacing remaining Ohlone and Californio landholders.[2] Early county organization centered on provisional seats like San Leandro, marking the transition from indigenous and Hispanic pastoralism to U.S. agrarian expansion.[30]Industrialization and Urban Growth (1850–1945)
Oakland, the county's largest city, was incorporated on May 4, 1852, amid the California Gold Rush's population influx, establishing it as a key East Bay hub for trade and settlement.[31] Berkeley followed with incorporation on April 4, 1878, driven by the University of California's relocation and suburban expansion needs.[32] These incorporations facilitated infrastructural growth, including the arrival of the first transcontinental railroad's western terminus in Oakland in 1869, which spurred port development along the waterfront and connected the region to national markets via rail lines extending eastward along the estuary.[31] By the late 19th century, the Port of Oakland emerged as a vital deepwater facility, handling Gold Rush-era cargo and later agricultural exports, with waterfront control shifting to municipal oversight by 1910 to enable systematic expansion.[33][34] Industrial diversification accelerated post-1900, with food processing dominating as Alameda County's primary peacetime industry; the region led California in canned fruit and vegetable output, supported by five major canneries, including the large Hunt Brothers facility in Hayward that processed local harvests of apricots, pears, and other produce.[35][36] Rail and port infrastructure enabled efficient transport of these goods, while early manufacturing clusters formed along the Oakland estuary, leveraging proximity to San Francisco Bay for shipping. Shipbuilding also took root along the estuary and Alameda Point, producing wooden hulls for lumber schooners and coastal vessels by the early 20th century.[37] The 1906 San Francisco earthquake inflicted significant damage across Alameda County, toppling brick structures and frame houses in Oakland, Alameda, and Berkeley, while causing liquefaction at waterfronts.[38][39] However, the disaster redirected growth eastward, drawing over 150,000 refugees to Oakland and fueling a construction boom that doubled its population by 1910 and enhanced port infrastructure.[40][41] World War I and II amplified naval and shipbuilding activities, particularly in Alameda, where facilities on the North Shore constructed troop transports and repaired vessels; by World War II, the commissioning of Naval Air Station Alameda in 1940 supported aircraft manufacturing and maintenance across 271 trades, contributing to the Bay Area's output of over 1,400 ships between 1940 and 1945.[42][43][44] These wartime efforts industrialized the waterfront further, employing thousands and solidifying the county's role in defense production through 1945.[45]Postwar Expansion and Suburbanization (1946–2000)
Following World War II, Alameda County experienced rapid population growth driven by the baby boom and migration to California for economic opportunities, with the population increasing from 740,315 in 1950 to 990,038 by 1960, a 34% rise attributed to influxes of veterans and families seeking suburban housing.[46] This expansion was facilitated by extensive freeway construction under the Interstate Highway System, initiated in 1956, including segments of I-80, I-580, and I-880 through the county in the late 1950s and 1960s, which enabled automobile-dependent suburban development in areas like Fremont and Livermore.[47] These infrastructure projects supported the shift from urban density in Oakland and Berkeley to sprawling residential tracts, converting agricultural lands into housing subdivisions amid postwar housing demand.[48] The inception of Bay Area Rapid Transit (BART) in the 1960s responded to this suburban surge, with planning dating to 1946 but construction commencing in 1964, including Oakland subway segments by 1966, aimed at connecting East Bay suburbs to San Francisco employment centers.[49] Economic diversification emerged through spillover from Silicon Valley's nascent tech sector in adjacent counties and the influence of the University of California, Berkeley, which expanded enrollment and research post-1945, drawing skilled workers and fostering ancillary industries in the East Bay. However, unchecked development prompted environmental activism, notably the 1961 founding of Save the Bay by East Bay residents opposing bay fill projects that threatened estuarine habitats, leading to the 1965 McAteer-Petris Act establishing the San Francisco Bay Conservation and Development Commission to regulate land-use changes.[50][51] The period culminated in the October 17, 1989, Loma Prieta earthquake, magnitude 6.9, which caused significant infrastructure damage in Alameda County, including the collapse of the Cypress Street Viaduct on I-880 in Oakland, killing 42 people and disrupting suburban commuting patterns. The event, centered 70 miles south in Santa Cruz County, resulted in over $6 billion in regional damage, with Alameda County facing liquefaction in areas like Harbor Bay and prompting seismic retrofits that influenced subsequent land-use planning and suburban resilience measures.[52][53] Despite these shocks, the county's population stabilized around 1.3 million by 1990, reflecting a maturing suburban landscape shaped by transportation, economic drivers, and regulatory responses to growth pressures.[46]Modern Developments and Challenges (2001–Present)
Following the dot-com bust of 2000–2002, which slowed office market recovery in Alameda County due to reduced demand from tech firms, the local economy rebounded through diversification into professional services and adjacent sectors. By the 2010s, the Oakland-Hayward-Berkeley metropolitan area, encompassing much of the county, experienced steady job growth in professional, scientific, and technical services, adding positions even during national recessions, as this sector expanded by over 20% from 2000 to 2018. Biotech emerged as a key driver, with the industry generating approximately $850 million in economic impact and 4,700 jobs in Alameda County by 2013, clustered in areas like Emeryville and fostering ecosystems for life sciences and cleantech innovation.[54][55][56][57] Housing affordability emerged as a persistent challenge amid population pressures and regulatory constraints, prompting the county to adopt a 10-Year Housing Plan in July 2025 to address the crisis through targeted investments and streamlined permitting. This framework builds on the 6th Cycle Housing Element for 2023–2031, which mandates accommodating 4,711 new units in unincorporated areas via zoning reforms and incentives for affordable development, though implementation faces hurdles from community resistance and infrastructure limits. The COVID-19 pandemic exacerbated shortages, with remote work shifts contributing to Bay Area office vacancy rates reaching 24% by 2025, reducing downtown Oakland foot traffic and straining commercial real estate tied to housing demand.[58][59][60] The Port of Oakland, a vital economic engine handling over 99% of Northern California's containerized imports, navigated COVID-19 disruptions with initial volume dips in early 2020 followed by surges, including record cargo levels in 2021 driven by e-commerce demand and supply chain shifts, though persistent congestion highlighted vulnerabilities in labor and logistics. Meanwhile, Oakland grappled with accelerating urban challenges, including a 70% rise in homelessness by 2025, with encampments proliferating despite policies like the 2021 Encampment Management approach that closed over 500 sites by 2023 but left 1,500 unresolved, correlating with progressive governance emphases on non-enforcement and shelter-first strategies that empirical outcomes suggest have yielded limited containment amid fiscal strains.[61][4][62][63][64][65][66]Government and Politics
County Governance Structure
Alameda County operates as a charter county under the California Constitution, with its charter adopted by voters on November 4, 1980, granting it home rule authority beyond general law counties.[67] The county's legislative and executive powers are vested in a five-member Board of Supervisors, elected to staggered four-year terms from single-member districts on a non-partisan basis.[68] The Board enacts ordinances, adopts the annual budget, appoints department heads and advisory boards, and oversees county operations including public health, social services, and infrastructure in unincorporated areas.[69] It also exercises quasi-judicial functions, such as hearing appeals on land use and zoning matters.[70] Key elected officials independent of the Board include the Assessor, who determines property values for taxation purposes to ensure fair assessment ratios under Proposition 13; the Sheriff-Coroner, responsible for law enforcement in unincorporated areas, operating county jails, serving civil processes, and conducting death investigations; and the District Attorney, who prosecutes violations of state law and county ordinances, advises law enforcement, and represents the county in civil actions.[71][72][70] These row offices maintain autonomy to prevent consolidation of power, differing from city governance where councils often directly appoint department heads without separate constitutional elections for such roles.[73] The county budget process begins with departmental submissions in early calendar year, followed by review by the County Administrator's office, public hearings, and final adoption by the Board no later than June 30 for the fiscal year starting July 1.[74] For fiscal year 2025-2026, the proposed $5.1 billion budget addressed a $105.7 million structural deficit through expenditure controls, revenue enhancements, and one-time reserves, amid declining state supplemental funding and regional tech sector layoffs impacting sales and property tax revenues.[75][76] Unlike cities, which focus on municipal services like local policing and zoning within boundaries, county budgets encompass mandatory statewide programs such as welfare and probation, exposing them to broader fiscal volatilities from state policy shifts.[70]Electoral Representation
Alameda County is apportioned across three United States congressional districts as established by the California Citizens Redistricting Commission's maps adopted in December 2021, following the 2020 United States Census and effective for elections starting in 2022.[77] These boundaries reflect population shifts, with denser urban areas in the western county (such as Oakland and Berkeley) consolidated in the 12th District, central suburban zones (including Fremont and Hayward) in the 14th, and southeastern suburban-rural expanses (such as Pleasanton and parts of Fremont) in the 17th, thereby delineating urban cores from peripheral growth areas without crossing major geographic divides like the Diablo Range foothills.[77] The current representatives, serving terms beginning January 3, 2025, after the November 2024 elections, are:| District | Representative | Party |
|---|---|---|
| 12th | Lateefah Simon | Democrat[78] |
| 14th | Eric Swalwell | Democrat[79] |
| 17th | Ro Khanna | Democrat |
| District | Senator | Party |
|---|---|---|
| 7th | Jesse Arreguín | Democrat[80] |
| 9th | Tim Grayson | Democrat[80] |
| 10th | Aisha Wahab | Democrat[81] |
| District | Assemblymember | Party |
|---|---|---|
| 14th | Buffy Wicks | Democrat |
| 16th | Rebecca Bauer-Kahan | Democrat[82] |
| 18th | Mia Bonta | Democrat[83] |
| 20th | Liz Ortega | Democrat[84] |
| 24th | Alex Lee | Democrat |
Voter Demographics and Political Trends
Alameda County maintains a pronounced Democratic Party advantage in voter registration, with 57.9% of registered voters (558,980 individuals) affiliated with the Democrats as of the latest county data.[85] No Party Preference registrants comprise 24.7% (238,627), while Republican affiliation remains minimal at under 10%, alongside smaller shares for parties such as American Independent (2.8%), Green (0.7%), and Libertarian (0.7%).[85] This partisan imbalance reflects broader Bay Area patterns, where Democratic registration has hovered above 50% since at least the 1990s, driven by urban and suburban demographics favoring progressive policies on issues like housing, environment, and social services. Presidential election results underscore this dominance, with Democratic candidates consistently securing margins exceeding 60% since 1992. In 2000, Al Gore received 69.4% of the vote against George W. Bush's 24.2%; by 2020, Joe Biden captured 79.8% to Donald Trump's 17.6%.[86][87] Voter turnout in countywide elections typically aligns with state averages, reaching around 80% in high-stakes presidential cycles, though lower in off-year contests. Empirical data indicate that while registration tilts heavily Democratic, actual voting behavior shows some cross-over from independents, yet the county's one-party electoral lock has correlated with stagnant economic mobility and elevated urban crime rates in areas like Oakland, where property crimes rose 20% annually from 2020 to 2023 under aligned local leadership.[88] Recent trends reveal fissures in this hegemony, particularly backlash against far-left prosecutorial and administrative approaches. In November 2024, voters recalled Alameda County District Attorney Pamela Price by a 62.9% to 37.1% margin, citing leniency policies linked to recidivism spikes.) Concurrently, Oakland Mayor Sheng Thao faced successful recall with over 50% support, reflecting discontent with governance amid rising homicides and retail thefts that exceeded state averages by 40% during her tenure.[89] These outcomes, amid 58% Democratic registration, signal a pragmatic revolt within the electorate against ideological extremes, as moderate and independent voters prioritized public safety and fiscal accountability over partisan loyalty—evident in similar 2022-2024 municipal upsets across California urban counties.[90]Governance Controversies and Reforms
In November 2024, Alameda County voters recalled District Attorney Pamela Price by a margin exceeding 60% in favor of removal, citing her prosecutorial decisions—such as declining to charge suspects in high-profile cases and seeking reduced sentences for violent offenders—as contributing to elevated crime levels, including a 20% homicide increase from 2022 to 2023.[91][92] Price, elected in 2022 on a reform platform emphasizing alternatives to incarceration, conceded the recall on November 18, 2024, after initially delaying public acknowledgment of the results; the Board of Supervisors subsequently appointed an interim DA pending a special election.[93] Critics, including law enforcement groups and victims' advocates, argued her policies prioritized offender rehabilitation over public safety, leading to over 100 homicides annually in Oakland alone during her tenure.[94] Alameda County's election administration has drawn scrutiny for chronic delays in ballot processing and certification, with the 2024 general election leaving approximately 187,000 ballots uncounted as of November 14—more than any other California county—prolonging uncertainty in the Price recall and other races.[95] Registrar Tim Dupuis attributed slowdowns to high mail-in volumes and signature verification requirements, but officials and voters expressed frustration over the pace, echoing 2020 complaints where processing errors allegedly disenfranchised thousands through rejected or lost ballots.[96][97] These issues have fueled demands for operational reforms, including upgraded technology and staffing, amid perceptions of inefficiency under entrenched local control. Voters approved Measure B on March 5, 2024, with over 70% support, amending the county charter to adopt California state law for recall elections and replacing antiquated local provisions that had prompted lawsuits over inconsistent application, such as varying signature thresholds and election timing.[98][99] Proponents, including county counsel, contended the prior rules were unconstitutional and costly, potentially saving millions by avoiding separate special elections; opponents viewed the change as diminishing voter power in a county lacking competitive partisan balance.[100] The measure's passage facilitated smoother handling of subsequent recalls, though it did not resolve broader disputes over when to schedule them. The Alameda County Civil Grand Jury's 2024-2025 final report warned of Oakland's acute fiscal vulnerabilities, projecting potential insolvency within years due to $3.5 billion in unfunded retiree healthcare liabilities, persistent budget deficits exceeding $100 million annually, and credit rating downgrades that barred infrastructure borrowing.[101] Despite city officials' claims of asset buffers mitigating risks, the jury highlighted ignored fiscal controls and overreliance on one-time revenues, echoing prior reports on county health system insolvency threats from 2019-2020 and school district shortfalls.[102] These findings underscore governance lapses in a county dominated by Democratic officials since the 1990s, where limited opposition has correlated with unchecked progressive priorities—evident in parallel 2024 recalls of Oakland Mayor Sheng Thao over crime and homelessness mismanagement—prompting calls for structural reforms like enhanced oversight and fiscal audits to enforce accountability.[103][104]Demographics
Population Trends and Projections
The population of Alameda County stood at 1,682,353 according to the 2020 United States Census. By July 1, 2024, U.S. Census Bureau estimates placed it at 1,649,060, reflecting a net decline of 33,293 residents or approximately 2.0% over four years. This marks a reversal from earlier growth patterns, with annual decreases averaging around 0.5% since 2020, driven primarily by negative net domestic migration and diminishing natural increase from births exceeding deaths by smaller margins. Key drivers include substantial domestic outmigration, where more residents relocated to other U.S. states than arrived from them, partially offset by international inflows but insufficient to stem the overall loss; for instance, the county experienced a net domestic outflow contributing to a 50,000-person drop between 2020 and 2022 before partial recovery. Concurrently, natural population change has weakened due to declining birth rates—Alameda County births fell 11% from 2019 to 2023 amid California's statewide fertility rate hitting a historic low of 10.2 live births per 1,000 population in 2023—and an aging demographic structure, with the proportion of residents aged 65 and older rising faster than younger groups. The senior population grew nearly 14% from July 2020 to July 2024, while cohorts under 18 and working-age adults saw stagnation or contraction, exacerbating low fertility as older residents contribute fewer births. Projections indicate limited rebound, with the California Department of Finance and related state analyses forecasting modest growth of about 2.1% for Alameda County over 2025–2030, potentially stabilizing near 1.68 million by decade's end if migration balances and birth trends hold. However, persistent domestic outmigration pressures and sustained low fertility—coupled with rising deaths in an aging populace—could extend flat or negative trajectories, as evidenced by broader Bay Area patterns where population aging outpaces national averages. These dynamics underscore a shift from postwar expansion to contemporary stagnation, influenced by regional factors like housing constraints indirectly fueling outflows.Ethnic and Racial Composition
As of the 2022 American Community Survey estimates, Alameda County's population of approximately 1.64 million is characterized by high diversity, with no single racial or ethnic group comprising a majority. Non-Hispanic Asians form the largest group at 32%, followed closely by non-Hispanic Whites at 28%, Hispanics or Latinos (of any race) at 22%, and non-Hispanic Blacks or African Americans at 9.4%. Smaller shares include non-Hispanic individuals identifying as two or more races (5.6%), other races (2.1%), American Indian and Alaska Native (0.9%), and Native Hawaiian and Other Pacific Islander (0.7%).[105] These proportions reflect ongoing demographic shifts driven primarily by immigration and internal migration. The Asian population has grown significantly since 2010, increasing from about 25% to 32% of the total by 2022, attributable to high levels of skilled immigration from countries like China, India, and the Philippines concentrated in tech and professional sectors. In contrast, the non-Hispanic White share declined from 34% in 2010 to 28% in 2022, while the Hispanic share rose modestly from 20% amid broader Latino migration patterns. The Black population has remained relatively stable at around 10%, though with some outflow to suburbs and out-of-state areas.[106] Racial and ethnic segregation persists within the county, with distinct patterns between urban Oakland and its eastern and southern suburbs. Oakland exhibits higher neighborhood-level segregation, particularly for Black residents who are disproportionately concentrated in the city's flatlands (e.g., East and West Oakland tracts with over 40% Black populations), while Asian and White residents predominate in hilly or waterfront areas. Suburbs like Fremont (over 60% Asian) and Pleasanton (majority White) show greater homogeneity, contributing to county-wide dissimilarity indices where Black-White segregation ranks in the 70th percentile nationally. These patterns stem from historical housing policies but endure due to zoning, school quality, and economic factors, with only 20% of census tracts having racial compositions mirroring the county average.[107][108] Census data for Alameda County has faced challenges with undercounts, particularly among hard-to-reach groups. The 2020 Census likely undercounted young children and homeless populations, with local estimates suggesting Oakland's unhoused count was incomplete due to operational disruptions like the COVID-19 pandemic and delayed fieldwork. California's overall 2020 undercount rate was approximately 4.6% for children under 5, a pattern amplified in diverse, mobile urban counties like Alameda, potentially skewing future ethnic breakdowns downward for Latino and Black groups. No significant overcounts have been verified, though post-enumeration surveys confirmed national variances but emphasized the need for localized adjustments in immigrant-heavy areas.[109][110]Socioeconomic Indicators
Alameda County's median household income stood at $126,240 in 2019–2023, according to American Community Survey (ACS) 5-year estimates, surpassing the California statewide median of approximately $100,000 during the same period.[111] Per capita income reached $63,442 over this timeframe, reflecting concentrations of high-earning professionals in technology and related sectors concentrated in urban cores like Oakland and San Leandro.[111] The county's poverty rate remained relatively low at 9.2%, below the national average of 12.4% and California's 12.0%, though this figure masks variations across sub-regions, with higher concentrations in eastern and central areas.[111][112] Income inequality in Alameda County is pronounced, with a Gini coefficient of 0.4621 based on recent household data, exceeding the U.S. average of around 0.41 and indicating a skewed distribution where top earners capture a disproportionate share.[113] This metric, derived from ACS distributions, highlights disparities driven by bimodal income clusters: affluent coastal and tech-adjacent zones versus lower-income inland communities, contributing to social stratification despite overall prosperity.[113] Housing metrics underscore affordability pressures amid the county's 1.65 million residents. Homeownership rates hovered at 54.1% in recent estimates, lower than the national 65% benchmark, with median property values exceeding $1 million, which limits access for middle-income households.[105] A severe housing shortage persists, with county planning documents from 2023–2025 identifying shortfalls in affordable units relative to Regional Housing Needs Allocation (RHNA) targets, exacerbating waitlists for subsidized housing and contributing to elevated rents averaging over $2,500 monthly in urban centers.[58][114]| Indicator | Value (2019–2023 ACS) |
|---|---|
| Median Household Income | $126,240[111] |
| Poverty Rate | 9.2%[111] |
| Gini Coefficient | 0.4621[113] |
| Homeownership Rate | 54.1%[105] |
| Mean Commute Time | 31.8 minutes[111] |
Economy
Key Industries and Employment Sectors
Alameda County's gross domestic product totaled $178.8 billion in 2023, reflecting its role as a major economic hub in the San Francisco Bay Area.[117] The county's economy features a diverse mix of advanced industries, with manufacturing leading as one of the top employment sectors, encompassing automotive production, semiconductors, and biomedical manufacturing.[8][118] Southern Alameda County, including cities like Fremont, Newark, and Union City, hosts high concentrations of these activities, with firms specializing in electric vehicles (such as Tesla's Fremont factory) and innovative technologies driving sector expansion.[119] Professional, scientific, and technical services rank as another dominant sector, supporting technology, biotechnology, and cleantech development across the county.[8][119] Health care and social assistance also contribute substantially to employment, bolstered by major medical facilities and research institutions in urban centers like Oakland and Berkeley.[8] Transportation, warehousing, and maritime activities form a critical pillar, anchored by the Port of Oakland, which processed approximately 2.06 million twenty-foot equivalent units (TEUs) of containerized cargo in 2023, facilitating trade primarily with Asia (74% of volume).[120][4] Food and beverage processing clusters, particularly in areas like Livermore Valley, add to the manufacturing base with wine production and related agribusiness, though these remain smaller relative to high-tech sectors.[118] Overall, these industries underscore Alameda County's integration into California's innovation-driven economy, with over 69,000 businesses operating as of 2024.[8]Labor Market Dynamics
In 2023, Alameda County's annual average unemployment rate stood at 3.8%, reflecting a stable labor market amid broader regional recovery, with monthly figures fluctuating between 3.5% in April and 4.2% in July.[121] By mid-2025, the rate had risen to 5.1% in August, influenced by seasonal and national economic pressures, yet remaining below the county's long-term average of 5.65%.[122] Employment in the county totaled approximately 800,000 nonfarm jobs as of late 2023, with significant concentration in service-oriented roles; fast food and counter workers numbered 60,230, earning a median hourly wage of $18.49 ($38,455 annually), while cashiers totaled 51,280 at $17.73 per hour ($36,869 annually), and laborers in freight and stock roles were prominent in logistics support.[123] Wage dynamics show variation by occupation, with the San Francisco-Oakland-Hayward metropolitan area, encompassing Alameda County, reporting a median hourly wage of $34.64 across 2.42 million jobs in May 2023, driven by higher-paying administrative and professional roles but tempered by lower entry-level service positions.[124] Sector-specific medians highlight disparities, such as $79,927 for men in high-earning industries like professional services versus lower figures in retail and hospitality, though direct county-level wage data by ethnicity remains limited in public reports; household income proxies indicate variations, with Asian households averaging higher medians than Black or Hispanic counterparts, reflecting occupational sorting rather than isolated wage gaps.[105] Post-COVID recovery bolstered employment, with Bay Area jobs largely rebounding by late 2022 through gains in services and logistics, though Alameda workers faced persistent affordability challenges despite nominal wage increases of 5-10% in lower-wage sectors from 2021-2023.[125] The county's labor market is characterized by heavy commuting, with substantial outflows to San Francisco and Santa Clara counties (Silicon Valley); over 40% of Alameda workers commute externally, utilizing BART and highways like I-80 and I-580, contributing to a regional "commuter economy" where local jobs support but do not fully absorb the resident labor force.[126] This pattern sustains employment dynamics but exacerbates traffic and housing pressures, with inbound and outbound flows peaking during traditional work hours.[21]Economic Disparities and Policy Impacts
Alameda County exhibits significant economic disparities, with a median household income of $126,240 in 2023, yet a Gini coefficient of 0.495 indicating substantial income inequality.[105] The official poverty rate stands at 9.22% for the same year, but adjusting for high living costs reveals deeper challenges, including 36% of households cost-burdened and 16% severely so, paying over half their income on housing.[105] [58] Median property values reached $1.06 million in 2023, amplifying affordability gaps particularly for low-income and minority groups, where Black households face homelessness rates four times higher than average.[105] [58] Housing policies, including zoning restrictions, have contributed to persistent supply shortages that drive these disparities. Empirical analyses of California land-use regulations demonstrate that restrictive zoning elevates housing costs by limiting developable land and density, with effects compounded in high-demand areas like the Bay Area.[127] [128] In Alameda County, despite initiatives like the $2.5 billion Home Together Plan (2021-2026) and Measure A1, which delivered 4,507 affordable units exceeding its 3,800-unit target, unmet needs remain acute as of 2025, requiring 107,000 new affordable units and 2,200 shelter beds to address homelessness and severe burdens.[58] [58] Regulatory hurdles, such as layered funding approvals adding $20,000 per unit and four months to timelines, further constrain production, while pandemic-era efforts housed 13,982 individuals but saw 14,959 newly homeless, underscoring ongoing supply-demand imbalances.[58] [58] Tax and regulatory policies yield mixed outcomes across sectors, highlighting causal effects on growth disparities. Advanced manufacturing, concentrated in areas like Fremont, has sustained expansion amid high costs, supported by access to skilled labor and innovation hubs.[129] In contrast, retail and small businesses face pressures from elevated business license taxes and proposed gross receipts tax hikes, which analyses project could reduce employment by shifting burdens unevenly.[130] [131] Progressive tax structures, while aiming to fund services, empirically correlate with job losses in low-margin sectors, as higher operational costs deter investment without proportionally boosting affordability or equity.[132] [131] Homelessness, at 9,450 individuals in the 2024 point-in-time count (a 3% decline from 9,747 in 2022), persists despite $1.8 billion in allocated spending, with 35.4% of cases tied to housing loss from rent increases or evictions—outcomes traceable to constrained supply rather than isolated demand factors.[133] [134] [133]Public Safety and Crime
Crime Rate Statistics
Alameda County's violent crime rate reached 795 incidents per 100,000 residents in 2022, exceeding the statewide average of 480 per 100,000 and ranking among the highest in California counties.[135] This figure encompasses homicide, rape, robbery, and aggravated assault, with the county's rate driven largely by concentrations in urban areas like Oakland, where violent crime rates have historically spiked above 1,600 per 100,000.[136] Statewide, violent crime rose 1.7% to 503 per 100,000 in 2023, but Alameda County's levels remained elevated relative to this benchmark.[136] Property crime rates in the county surged 28% from 2022 to 2023, reaching approximately twice the California average of 2,294 per 100,000, with burglary, larceny-theft, and motor vehicle theft comprising the bulk of incidents.[136][137] Preliminary 2024 data from the Legislative Analyst's Office confirm Alameda's property crime as the highest among counties with complete reporting, though local variations emerged: the City of Alameda reported a 12% overall reduction in crime, including a 9% drop in total reports and declines in vehicle thefts.[137][138] Homicide rates in Alameda County escalated post-2020, with firearm-related homicides increasing 68% from 2019 to 2021 amid broader pandemic-era rises; the county averaged three gun homicides weekly from 2019 to 2023.[139] Oakland, accounting for a disproportionate share, recorded a 34% decline in homicides and non-fatal shootings in 2024 compared to 2023, contributing to county-wide softening.[140] Theft categories, including larceny and burglary, mirrored property trends, with 2023 increases in Alameda outpacing state declines of 1.8%.[136] Despite 2024 downturns in select locales like Oakland (19% violent crime drop) and Alameda city, county rates stayed above state averages across violent and property metrics.[141][142]Law Enforcement Operations
The Alameda County Sheriff's Office (ACSO) operates as the primary law enforcement agency for unincorporated areas of the county, provides security for county courts and facilities, and manages the Santa Rita Jail, which houses over 3,000 inmates daily. Accredited through the Commission on TRI-ARC for full-service operations, the ACSO employs sworn deputies focused on patrol, investigations, and corrections, with recent budget allocations supporting staffing augmentations for jail care coordination and behavioral health services.[72][143] The agency implements community-oriented policing through its Community Capital Policing Program, originally piloted in the late 1990s, which includes youth and family services bureau initiatives aimed at at-risk populations via counseling and engagement efforts.[144][145] The Oakland Police Department (OPD), responsible for policing the city of Oakland—Alameda County's most populous jurisdiction—maintains sworn staffing budgeted at 678 officers as of fiscal year 2025, a reduction from peaks exceeding 800 in prior years amid recruitment challenges and post-reform hiring mandates under the long-standing federal Negotiated Settlement Agreement initiated in 2003 for addressing patterns of misconduct. OPD's operations emphasize a mix of traditional patrol responses and community policing strategies, with an ad hoc committee developing dedicated policies to enhance neighborhood engagement and trust-building since 2023. Budget constraints have driven overtime reliance, contributing to operational strains, while a 2024 staffing study commissioned by the city recommended 805 sworn positions to align with service demands, though the full report remains unreleased citing exemptions.[146][147][148] In response to operational gaps in Oakland, Governor Gavin Newsom deployed California Highway Patrol (CHP) officers starting February 2024, quadrupling the surge in July 2024 to support vehicle theft recoveries and patrols, with extensions through November and December 2024, and further expansions announced in August 2025 to multiple Bay Area sites including Oakland for sustained enforcement assistance. These state surges integrate CHP task forces with local procedures, focusing on high-visibility patrols and rapid response coordination without supplanting municipal authority.[149][150][151]Policy Effects and Public Responses
The implementation of California's Proposition 47 in 2014, which reclassified certain theft and drug offenses as misdemeanors, correlated with subsequent increases in property crimes in Alameda County, including a 3.9% rise in auto thefts and 3.7% in vehicle break-ins attributable to reduced incarceration rates.[152] Empirical analyses indicate that these policy shifts diminished deterrence for low-level offenses, contributing to sustained elevations in larceny and burglary rates through the late 2010s, though causal attribution remains debated amid confounding factors like economic conditions.[153] Proponents, including reform advocacy groups, assert that redirected savings—exceeding $800 million statewide—funded recidivism-reduction programs with reported rates as low as 12% in Alameda initiatives, prioritizing rehabilitation over incarceration.[154] Critics, drawing on pre- and post-enactment data, counter that the reforms empirically heightened victimization, particularly in urban areas like Oakland, where property crime trends diverged upward from national averages.[155] Post-2020 "defund the police" advocacy in Alameda County, particularly in Oakland, coincided with police staffing shortages and delayed response times, exacerbating crime surges from 2020 to 2023 amid reduced proactive enforcement.[156] Local NAACP leaders attributed the "heyday for criminals" to these movements, which strained department resources despite formal budget increases, leading to perceptions of diminished public safety.[157] Progressive defenders maintained that underlying issues like poverty and inequality drove the upticks, not funding reallocations to violence prevention, though data on unsolved crimes underscored enforcement gaps.[158] District Attorney Pamela Price's 2022 election on a reform platform, emphasizing alternatives to prosecution for nonviolent offenses and resentencing reviews, faced scrutiny for contributing to lenient outcomes amid rising incidents.[159] Her office's push for death penalty resentencings in tainted cases was halted in May 2025 by successor Ursula Jones-Dickson, who withdrew nearly all pending petitions, citing procedural and evidentiary concerns.[160] Policies linking homelessness—prevalent in encampments tied to open drug markets—with elevated theft and disorder were highlighted in critiques, as decriminalization approaches under Price correlated with persistent street-level victimization.[161] Public backlash culminated in Price's recall on November 5, 2024, with 62.9% of voters approving her removal after less than two years in office, reflecting widespread dissatisfaction with reform-driven leniency amid empirical crime pressures.[162] Supporters framed the ouster as racially motivated resistance to equity-focused changes, while opponents emphasized data on disproportionate impacts to working-class and minority residents from unchecked recidivism.[163] This electoral response, echoed in broader California reversals of progressive prosecutorial experiments, underscored tensions between ideological commitments to decarceration and observable causal links to public safety declines.[91]Education
Primary and Secondary Schools
Alameda County's primary and secondary education is provided through 16 unified school districts overseen by the Alameda County Office of Education, with Oakland Unified School District (OUSD) as the largest operator, serving 34,149 students across 82 schools.[164] Fremont Unified School District enrolls 33,107 students, while other key districts include Alameda Unified, Berkeley Unified, Castro Valley Unified, Dublin Unified, and Emery Unified.[165] Total enrollment across county public schools was 189,898 students in the 2023-24 school year, reflecting a 0.5% decline from the prior year amid broader demographic trends.[166] Charter schools supplement traditional districts, with the Alameda County Office of Education authorizing over a dozen, such as the Academy of Alameda (TK-8), Alameda Community Learning Center (6-12), and Connecting Waters Charter School East Bay (TK-12), emphasizing personalized or project-based learning models.[167] These independent public schools enroll thousands of students countywide, often focusing on underserved populations or specialized curricula.[168] Districts receive primary funding via California's Local Control Funding Formula (LCFF), which allocates base grants adjusted for enrollment, supplemented by federal aid and local measures like parcel taxes. Infrastructure improvements rely heavily on voter-approved general obligation bonds; for example, OUSD's Measure Y, passed in November 2020, authorized $735 million for facility repairs, seismic retrofits, and modernizations across aging campuses.[169] Similarly, Alameda Unified's Measure B (2006) and Measure I (2016) funded upgrades including HVAC systems and safety enhancements.[170] [171] Efforts to integrate schools historically centered on OUSD, where 1950s attendance boundaries exacerbated racial segregation amid restrictive housing policies and demographic shifts.[172] In response to civil rights advocacy and judicial pressures post-Brown v. Board of Education, OUSD implemented busing programs in the 1960s and 1970s to balance racial enrollments, converting junior highs into clustered campuses and transporting students across neighborhoods.[173] These measures faced resistance and were phased out by the 1980s, leaving ongoing challenges from neighborhood-based assignments.[174]Higher Education
Alameda County is home to major public higher education institutions that emphasize research, undergraduate teaching, and community access, collectively enrolling over 90,000 students and fostering regional innovation through technology and scientific advancements. The University of California, Berkeley (UC Berkeley), located in Berkeley, stands as the county's flagship research university, offering more than 300 degree programs across 15 schools and colleges with a focus on groundbreaking scholarship in fields like engineering, computer science, and social sciences.[6] In fall 2024, UC Berkeley reported total enrollment of 45,882 students, including 33,070 undergraduates and 12,812 graduates, supporting a student-faculty ratio of 19.4:1.[175] Its research initiatives, led by faculty among the world's top scholars, generate substantial intellectual property and economic spillover, including proximity-driven contributions to Bay Area tech ecosystems via alumni-founded startups and patents.[6] California State University, East Bay (CSU East Bay), situated in Hayward, serves as a comprehensive regional university within the California State University system, prioritizing accessible bachelor's, master's, and credential programs for a diverse Bay Area population.[176] As of recent data, CSU East Bay enrolls approximately 13,124 students, offering 48 bachelor's degrees, 34 master's degrees, and 23 credentials while competing in NCAA Division II athletics.[177] The institution emphasizes practical education in business, education, and health sciences, with multiple campuses facilitating commuter access and lifelong learning for non-traditional students.[176] Community colleges in the county provide foundational two-year programs, transfer pathways to four-year institutions, and vocational training, significantly expanding educational opportunity in urban and suburban areas. The Peralta Community College District, encompassing Berkeley City College, College of Alameda, Laney College, and Merritt College, operates across northern Alameda County cities like Oakland, Berkeley, and Alameda, enrolling roughly 32,000 students district-wide in associate degrees, certificates, and workforce development courses.[178] These colleges support equity-focused initiatives, including dual enrollment for high schoolers and career technical education, while contributing to local economies through affordable training in allied health, IT, and trades.[178] Chabot College in Hayward, part of the Chabot-Las Positas Community College District, further bolsters these efforts with programs yielding measurable returns in alumni earnings and regional income growth.[179]Performance Metrics and Issues
In the 2023–24 school year, Alameda County students demonstrated proficiency rates on the California Assessment of Student Performance and Progress (CAASPP) above state averages, with 56% meeting or exceeding standards in English language arts (ELA) and 48% in mathematics, compared to 47% and 37% statewide, respectively.[180][181] These figures reflect aggregate performance across districts, though National Assessment of Educational Progress (NAEP) data for California indicate broader challenges, with the state trailing national averages in math (35% proficient in grade 4, 25% in grade 8) and showing widening gaps between high- and low-performing students post-pandemic.[182][183] Significant disparities persist within the county, particularly in urban districts like Oakland Unified School District (OUSD), where only 27% of students met math standards and approximately 30% achieved ELA proficiency in recent CAASPP results, far below county and state benchmarks.[184] Achievement gaps by socioeconomic status and race/ethnicity are pronounced, with low-income and Black or Latino students scoring 20–30 percentage points lower in proficiency than their higher-income or Asian peers, mirroring statewide patterns where income correlates strongly with outcomes but does not fully explain persistent underperformance despite elevated per-pupil spending exceeding $20,000 in some districts.[185][186] High school graduation rates average 88.7% countywide, outperforming the state (87%), but drop to 75–79% in OUSD, with subgroup rates for low-income and minority students lagging further due to factors including chronic absenteeism and limited school choice.[187][188] Teacher shortages exacerbate these issues, with over 300 vacancies reported across the county, prompting initiatives like subsidized credentialing programs to recruit from paraprofessionals, though retention challenges persist amid fiscal mismanagement in districts like OUSD, which faces county oversight for reserve depletion and enrollment declines.[189][190] Equity-focused policies, including extended remote learning during COVID-19, have been criticized for widening gaps among low-income students, as evidenced by lawsuits alleging denial of in-person education in Alameda County districts, underscoring causal links to instructional disruptions over socioeconomic factors alone.[191][192] Despite debates over funding allocation, empirical data indicate that policy emphases on restorative practices and reduced discipline have coincided with stagnant proficiency in underperforming areas, independent of family income variations.[193]Transportation
Road and Highway Networks
Alameda County's road network encompasses approximately 3,978 miles of roadways, including major interstate highways that facilitate regional connectivity. Key interstates include I-80, which runs through the northern county as the Eastshore Freeway, linking Oakland and Berkeley; I-580, extending eastward from Oakland through Livermore; and I-880, paralleling the eastern shore of San Francisco Bay from Oakland southward.[194][195] Additional routes such as I-238 and portions of I-680 provide auxiliary access, while state routes like SR-24 and SR-13 support local traffic flow.[196] Traffic congestion remains a persistent challenge on these highways, with Alameda County accounting for five of the Bay Area's ten most congested corridors and 31 percent of region-wide congestion-related vehicle delay.[197] I-580, I-880, and I-80 feature among the worst bottlenecks, where time spent in congestion has risen 1.5 times faster than population growth since 2000, contributing to 51 percent of congested delay shared with neighboring Contra Costa County.[198][199] Recent infrastructure projects address maintenance, safety, and resilience. The Oakland Alameda Access Project, advancing on I-880 and SR-260, aims to enhance motorist, pedestrian, and bicycle access while reducing local traffic through new ramps, with construction slated to commence in summer 2025 and span three years.[200][201] I-880 maintenance efforts resumed in April 2025, focusing on pavement rehabilitation.[202] Seismic retrofitting efforts mitigate earthquake risks inherent to the region's fault lines. The Leimert Boulevard Bridge in Oakland underwent retrofit and reopened in May 2025 following reinforcement to prevent collapse.[203] Caltrans is replacing the Arroyo de la Laguna Bridge on SR-84 to address seismic vulnerabilities and scour, aligning with current design standards.[204] Earlier, the San Francisco-Oakland Bay Bridge on I-80 completed extensive seismic upgrades by 2014.[205] Highway safety data indicate elevated collision risks, with Alameda County recording 6,750 total traffic accidents in 2022, many involving state highways amid congested conditions.[206] Caltrans reports on 2023 state highway crashes highlight ongoing concerns for Alameda routes, underscoring the need for continued improvements.[207]Public Transit and Rail
The primary public transit and rail services in Alameda County are operated by the Bay Area Rapid Transit (BART) district for heavy rail, the Alameda-Contra Costa Transit District (AC Transit) for bus services, and supplementary commuter rail lines including the Capitol Corridor and Altamont Corridor Express (ACE).[208][209][210] These systems integrate with regional networks, such as connections to Amtrak stations in Oakland and ferry terminals, facilitating travel across the San Francisco Bay Area.[209][211] BART provides electric multiple-unit rail service across much of Alameda County, with key stations including those in Oakland (e.g., 12th Street, West Oakland), Berkeley, Fremont, and Hayward, serving as a core artery for intra-county and transbay commuting.[208] In fiscal year 2023-2024, BART accounted for over half of all transit trips in Alameda County despite ridership remaining below pre-pandemic levels.[212] Systemwide weekday ridership averaged 180,200 passengers in the second quarter of 2025, reflecting a recovery to approximately 48% of 2019 levels, with June 2025 boardings up 13.4% year-over-year but still constrained by remote work trends and safety perceptions.[213][214] AC Transit operates an extensive bus network covering 364 square miles primarily in western Alameda County, including routes connecting to 21 BART stations, Amtrak services, and ferry terminals in cities like Oakland, Berkeley, and Alameda.[215][216] In 2024, AC Transit recorded 40,609,500 annual riders, or about 160,600 per weekday, achieving roughly 74% recovery from pre-COVID peaks as of mid-2025, outperforming rail due to shorter trips and essential service demand.[215][217] Recent adjustments include potential line consolidations and new routes under a draft realignment plan to address declining inner East Bay usage from 70 million annual trips in 2000 to 54 million in 2019.[218][219] Commuter rail options include the Capitol Corridor, which stops at Oakland's Jack London Square and provides intercity links to Sacramento, integrating with BART and AC Transit for regional access.[220] ACE service extends into southern Alameda County via Fremont, with ongoing studies like the Southern Alameda County Integrated Rail Analysis (SoCo Rail) proposing an East Bay hub to enhance connectivity among ACE, Capitol Corridor, and BART without requiring new tracks, aiming for expanded service within a decade.[221][222] Ferry services supplement rail and bus options, with the San Francisco Bay Ferry operating from Alameda terminals such as the Seaplane Lagoon, which reached 1 million cumulative riders by February 2025.[223] Systemwide, the ferry carried 2.6 million passengers in 2024, a 16% increase from 2023 and 90% recovery to pre-pandemic levels, driven by weekend rebounds and avoidance of road congestion.[224] A free Oakland-Alameda water shuttle, launched in 2024, has served over 100,000 riders in its first year, accommodating up to 31 passengers per trip including bikes.[225] Overall, Alameda County's seven transit operators delivered 100 million trips in fiscal year 2023-2024, with buses and ferries showing stronger post-COVID recovery than rail due to operational flexibility.[212]Ports, Airports, and Ferries
The Port of Oakland, located on San Francisco Bay in the city of Oakland, serves as a major maritime logistics hub handling containerized cargo, automobiles, and other goods. In 2023, it processed 2,065,709 twenty-foot equivalent units (TEUs) of container cargo, positioning it as the ninth-busiest container port in the United States by volume. Loaded imports and exports constituted the bulk of this traffic, though overall volume declined 11.6% from 2022 amid global supply chain fluctuations. The port supports approximately 98,000 regional jobs through direct operations, logistics, and related industries, contributing over $174 billion in annual economic output via trade facilitation and infrastructure investments. However, its operations generate significant air pollution from diesel-powered ships, trucks, and equipment, disproportionately impacting nearby low-income and minority communities in West Oakland, where particulate matter and diesel exhaust elevate respiratory health risks. Port authorities have pursued electrification of yard equipment and shore power for vessels to mitigate emissions, though critics argue these measures lag behind the scale of pollution generated. Oakland International Airport (OAK), also managed by the Port of Oakland and situated southeast of downtown Oakland, functions primarily as a domestic hub with growing international routes, handling passenger, cargo, and general aviation traffic. It accommodated 11.2 million passengers in 2023, a 0.8% increase from 2022, driven by low-cost carriers like Southwest Airlines serving major U.S. destinations. Airport cargo throughput reached substantial levels, supporting e-commerce and perishables, though exact 2023 figures emphasize its role in regional freight alongside maritime volumes. Expansion plans, including terminal modernizations, aim to boost capacity while addressing noise and emissions concerns from jet operations over densely populated areas. Ferry services in Alameda County primarily consist of passenger routes across San Francisco Bay operated by the San Francisco Bay Ferry, connecting terminals in Oakland's Jack London Square and Alameda's Main Street to downtown San Francisco and other East Bay points. These routes provide daily weekday and weekend service, accommodating commuters and tourists with vessels carrying up to 300 passengers each, emphasizing reliability amid bridge traffic congestion. An additional Oakland-Alameda Water Shuttle links the two cities seasonally, operating extended hours on weekends to support local travel and events. While ferries offer a low-emission alternative to roadways for short-haul trips, their scale remains modest compared to air and sea cargo volumes, with environmental benefits offset by fuel consumption in older fleets.Culture and Landmarks
Arts, Events, and Sports
Alameda County has historically hosted several major professional sports franchises in Oakland, contributing to regional identity and economic activity through events at the Oakland-Alameda County Coliseum and Arena, though all three primary teams have relocated in recent years amid disputes over stadium financing and public subsidies. The Oakland Athletics baseball team played home games at the Coliseum from 1968 to 2024, securing four World Series titles during that period (1972, 1973, 1974, and 1989), but announced relocation to Sacramento for 2025-2027 before a planned permanent move to Las Vegas, citing inadequate local investment in infrastructure upgrades.[226] The Oakland Raiders NFL franchise, based in Oakland from 1960 to 2020 (with a brief Los Angeles stint 1982-1994), won three Super Bowls while there (1976, 1980, 1983 seasons), but departed for Las Vegas after failing to secure a new stadium deal, leaving the Coliseum underutilized and highlighting tensions between team ownership demands and taxpayer reluctance to fund private ventures.[226] Similarly, the Golden State Warriors NBA team utilized the Oakland Arena from 1971 to 2019, capturing four championships in Oakland (1947, 1956, 1975, 2015), prior to shifting to the Chase Center in San Francisco for enhanced revenue from luxury amenities and corporate partnerships. These departures have reduced direct sports-related economic contributions, such as ticket sales and concessions, which previously generated millions annually but often subsidized team profits at public expense.[227] Annual events draw significant crowds, bolstering local commerce through vendor sales and tourism. The Alameda County Fair in Pleasanton, held over 18-20 days each June-July, attracted 445,032 attendees in 2023—a 6% increase from prior years—featuring horse racing, exhibits, and carnival rides that supported over 132,000 vehicle parkings and diverse food offerings.[228] Smaller festivals include Dublin's Saint Patrick's Festival with 60,000 participants in mid-March and Oakland's Earth Day event, alongside the Lunar New Year Bazaar estimating over 10,000 visitors, collectively stimulating short-term boosts in hospitality and retail but reliant on volunteer and municipal coordination amid variable weather impacts.[229] The arts scene emphasizes community-driven programming in Oakland and Berkeley, funded partly through grants that sustain galleries, theaters, and cultural centers despite fiscal pressures. Oakland allocates approximately $1 million yearly via its Cultural Funding Program to nonprofit arts groups, fostering over 50 galleries and mural projects that enhance neighborhood vitality and attract visitors, with economic analyses indicating nonprofit arts expenditures ripple into broader local spending.[230][231] In Berkeley, Civic Arts grants up to $10,000 annually per organization support operations and equitable access, though institutions like Berkeley Repertory Theatre faced a $40,000 National Endowment for the Arts grant cancellation in 2025, prompting fundraising to avert season suspensions and underscoring vulnerabilities to federal policy shifts.[232][233] Recent private infusions, such as the East Bay Community Foundation's $600,000 to 24 Oakland arts entities in summer 2025, aim to mitigate pandemic-era losses and promote intergenerational dialogue, yet attendance metrics remain modest compared to sports, prioritizing cultural preservation over mass spectacle.[234]Notable Sites and Recreation
The USS Hornet Sea, Air & Space Museum in Alameda houses the preserved USS Hornet (CV-12), an Essex-class aircraft carrier commissioned in 1943 that participated in World War II Pacific campaigns and later recovered Apollo 11 and 12 spacecraft in 1969 and 1970.[235] Open to the public since 1998 at the former Naval Air Station Alameda, the museum offers self-guided tours of the ship's decks, hangars, and exhibits on naval aviation and space exploration, drawing history enthusiasts year-round.[235] Jack London Square in Oakland serves as a major waterfront destination, developed in the mid-20th century around the author's legacy and featuring a marina, dining, shopping, and cultural events along the estuary.[236] The district includes Heinold's First and Last Chance Saloon, a historic bar dating to 1883 that survived the 1906 earthquake, and hosts seasonal festivals, yacht charters, and waterfront walks.[236] It contributes to Oakland's tourism, where visitor spending totaled $617 million in 2023 from 3.4 million visitors, reflecting recovery toward pre-pandemic levels.[237] The Alameda County Fair, held annually at the Fairgrounds in Pleasanton, spans three weeks from mid-June to early July, attracting over 500,000 attendees with amusement rides, livestock exhibits, concerts, and agricultural displays since its inception in 1912.[238] The 2024 edition ran from June 14 to July 7, emphasizing family recreation through midway games, food vendors, and nightly entertainment.[238] Alameda County's preservation of notable sites faces ongoing tensions with urban development, as seen in unincorporated areas where historic resources are protected under proposed ordinances providing incentives like tax credits for rehabilitation while navigating growth pressures from population increases.[239] The county maintains a register of historic sites and advises on zoning to balance conservation with economic needs, supporting over 160 National Register listings amid Bay Area expansion.[240]Parks and Natural Areas
The East Bay Regional Park District oversees protected natural areas in Alameda County as part of its 73-park system covering 126,809 acres across Alameda and Contra Costa counties, with over 1,330 miles of trails and 55 miles of shoreline.[20] In Alameda County, prominent sites include the 3,304-acre Anthony Chabot Regional Park near Castro Valley, which provides camping, equestrian facilities, and trails around Lake Chabot reservoir, and the 1,833-acre Dr. Aurelia Reinhardt Redwood Regional Park in the Oakland hills, home to the East Bay's largest remaining natural coast redwood forest alongside chaparral, grasslands, and evergreens.[241] [242] These areas support wildlife including rare species and facilitate activities such as hiking and birdwatching.[242] Conservation in Alameda County traces to early 20th-century efforts, with the East Bay Regional Park District established in 1934 to acquire and preserve open spaces amid urban expansion, complemented by the Alameda County Resource Conservation District's formation in the 1930s for soil and water protection.[243] [244] Strategies like the 2010 East Alameda County Conservation Strategy have focused on safeguarding biological resources in canyons, creeks, and hillsides, including ridgeline protections to maintain scenic and ecological integrity.[245] [246] The district's trails connect these habitats, enabling over 25 million annual visitors district-wide to engage with native ecosystems.[247] Access to these natural areas varies by urban density and socioeconomic factors; while 92% of Alameda County residents live within a half-mile of some parkland, lower-income Oakland neighborhoods possess 78% less proximate park acreage than higher-income ones, highlighting equity challenges in urban proximity to larger protected lands.[248] [249]Communities
Incorporated Cities
Alameda County includes 14 incorporated cities, each operating under its own municipal government with elected mayors and city councils responsible for local services such as zoning, public safety, and infrastructure maintenance.[250] These cities collectively house about 91% of the county's population.[251] Oakland, the county seat and largest city with an estimated 433,544 residents as of recent projections, serves as the administrative center for Alameda County and hosts key regional government offices.[252] It functions as a central transportation and trade hub, anchored by the Port of Oakland, which manages substantial West Coast cargo volumes including containers and bulk goods.[253] Oakland's governance emphasizes urban development and port-related economic policies, with its charter city status granting broad local authority.[254] Berkeley, estimated at 115,466 residents, is defined by its role as a university town centered around the University of California, Berkeley, a public research institution founded in 1868 that drives education, innovation, and local policy debates.[252][6] The city's council-manager government often addresses issues intersecting with campus activities, such as housing affordability influenced by student populations and academic research hubs.[255] Fremont, with around 223,393 inhabitants, features a tech-oriented economy bolstered by manufacturing, including Tesla's Fremont Factory, which produced nearly 560,000 vehicles in 2023 and employs over 20,000 workers focused on electric vehicle assembly and battery production.[252][256] Its governance prioritizes industrial zoning and economic incentives to attract high-tech firms like Lam Research and Western Digital, fostering cooperation with neighboring cities on regional transit links.[257] Hayward, home to approximately 151,014 people, maintains a diverse municipal profile with governance centered on community colleges and state university extensions, including California State University, East Bay, supporting education-driven growth amid a history of agriculture and canning industries.[252][258] The city council addresses seismic risks along the Hayward Fault and promotes mixed-use development to balance residential and commercial needs.[259] Other notable cities include Livermore, known for the Lawrence Livermore National Laboratory contributing to national security research; Pleasanton, a business corridor hub; and Alameda, featuring island-based naval history and waterfront governance. These municipalities collaborate on shared infrastructure like Bay Area Rapid Transit while managing distinct local economies from wine production in Livermore to retail in Union City.[250]Census-Designated Places and Unincorporated Areas
Alameda County's unincorporated areas encompass several census-designated places (CDPs), including Ashland, Castro Valley, Cherryland, Fairview, San Lorenzo, Sunol, and Hayward Acres, which collectively house about 150,000 residents, representing roughly 10% of the county's population as of 2025.[260][261] These communities lack independent municipal governments, resulting in direct reliance on county agencies for core services such as law enforcement via the Alameda County Sheriff's Office, fire protection through contracted districts, road maintenance and flood control by the Alameda County Public Works Agency, and planning oversight by the Community Development Agency.[262][263] Libraries, code enforcement, and social services like housing inspections are also county-provided, often leading to resource strains compared to incorporated cities with dedicated budgets.[264] Residents in these areas face distinct challenges, including weaker tenant protections and higher rates of housing instability, poverty, and substandard living conditions relative to urban cores, as unincorporated status limits local ordinances on rent control or habitability standards.[265][266] Growth pressures from Bay Area-wide demand have intensified these issues, with the county's Regional Housing Needs Allocation mandating 4,711 new housing units in unincorporated zones for 2023-2031—over 2.6 times the prior cycle's target—to accommodate projected increases amid limited infrastructure capacity.[267] In Ashland, for instance, the Madrone Terrace development broke ground in 2023 to deliver 79 affordable apartments targeted at low-income families and formerly homeless households, incorporating ground-floor community spaces to mitigate density-related strains, though such projects highlight ongoing tensions between development needs and resident concerns over service adequacy.[268][269] These dynamics underscore causal links between unincorporated governance—lacking city-level revenue tools—and amplified vulnerabilities to regional economic forces driving up land costs and displacement risks.[270]Population Distribution and Rankings
Alameda County's population of approximately 1,649,060 as of 2024 is predominantly urban and suburban, with over 90% residing in incorporated cities that form a dense core in the west near San Francisco Bay and more sprawling developments in the eastern valleys.[271] The county's urban areas, centered around Oakland and Berkeley, exhibit higher densities driven by historical port and industrial development, while eastern suburbs like Fremont and Pleasanton reflect post-World War II expansion with lower-density residential and commercial zones.[272] This distribution underscores a shift from compact urban cores to peripheral growth, influenced by transportation infrastructure and land availability. The largest incorporated cities by estimated 2024 population dominate the county's demographics, accounting for the majority of residents:| Rank | City | Population |
|---|---|---|
| 1 | Oakland | 436,504 |
| 2 | Fremont | 226,208 |
| 3 | Hayward | 155,675 |
| 4 | Berkeley | 118,962 |
| 5 | San Leandro | 91,008 |