

Community hub
Recent from talks
Contribute something
Nothing was collected or created yet.
Light rail
View on WikipediaThis article may need to be cleaned up. It has been merged from Semi-metro. |


_(14119561798).jpg)


Light rail (or light rail transit, abbreviated to LRT) is a form of passenger urban rail transit that uses rolling stock derived from tram technology[1][2] while also having some features from heavy rapid transit.
The term was coined in 1972 in the United States as an English equivalent for the German word Stadtbahn, meaning "city railroad".[3][4] Different definitions exist in some countries, but in the United States, light rail operates primarily along exclusive rights-of-way and uses either individual tramcars or multiple units coupled together, with a lower capacity and speed than a long heavy rail passenger train or rapid transit system.[5][6][7][8][9]
Narrowly defined, light rail transit uses rolling stock that is similar to that of a traditional tram, while operating at a higher capacity and speed, often on an exclusive right-of-way. In broader usage, light rail transit can include tram-like operations mostly on streets.[10] Some light rail networks have characteristics closer to rapid transit. Only when these systems are fully grade-separated, they are referred to as light metros or light rail rapid transit (LRRT).[11]
| Part of a series on |
| Rail transport |
|---|
|
|
| Infrastructure |
|
|
| Rolling stock |
|
|
| Urban rail transit |
|
|
| Other topics |
|
|
Terminology
[edit]The term light rail was introduced in 1972 by the U.S. Urban Mass Transportation Administration (UMTA, predecessor to the Federal Transit Administration) to describe modernized streetcar systems in Europe and the United States.
In Germany, the concept was known as Stadtbahn ("city rail"), but UMTA adopted the term light rail instead. The word light refers to lighter infrastructure and capacity requirements compared with heavy rail, rather than to physical weight. Mode classification is usually based on the type of right-of-way.[12][13]
The American Public Transportation Association (APTA) defines light rail as:
...a mode of transit service (also called streetcar, tramway, or trolley) operating single cars or short trains on fixed rails, often partly separated from traffic. Vehicles are typically electric, powered from overhead lines via trolley pole or pantograph, operated by an onboard driver, and may feature either high-platform or low-floor boarding.[5]
In international usage, light rail generally denotes newer tram or streetcar systems, ranging from street-running lines to partly grade-separated networks.[14] People movers are typically lower in capacity, while monorail and automated guideway transit are separate technologies with more specialized applications.[15] Light rail is distinct from the British English term light railway, which refers to lightly regulated, low-speed mainline railways.[16]
Varieties of English
[edit]

The term light rail helps avoid regional differences in terminology. In the UK, Australia,[17] Ireland[18] and New Zealand[19] tram refers to a street-running rail vehicle, while in North America it can also mean an aerial tramway or, in amusement parks, a land train.[20][21] Similarly, trolley means streetcar in North America.[22]
In North America, streetcar commonly refers to older vehicles operating in mixed traffic, while light rail is used for newer systems that operate mostly on reserved track.[23] The American term street railway (with vehicles called streetcars) emerged in the 19th century, influenced by the German word Straßenbahn ("street railway").[24] While Britain abandoned most tramways after World War II, several North American cities—including Toronto, Boston, Philadelphia, San Francisco, Pittsburgh, Newark, Cleveland, and New Orleans—retained theirs.[25] These cities later adopted the term light rail when introducing modern systems alongside older streetcars. Since the 1980s, Portland, Oregon has developed all three types: light rail, streetcar, and aerial tram.
Heavy rail refers to higher-capacity, higher-speed systems such as the London Underground or New York City Subway. Conventional passenger and freight railways are also classified as heavy rail. The main distinction is that light rail vehicles can, where necessary, operate in mixed street traffic.[26]
History
[edit]Precursors
[edit]By the late 19th century, some cities began placing tramways underground to reduce congestion. Early examples include the Murray Hill Tunnel in New York, adapted for streetcars in 1870,[27] Marseille's Noailles station in 1893,[28] and Boston's Tremont Street subway in 1897, the first purpose-built tram subway in North America and a precursor to today's MBTA Green Line.[29][30] London's Kingsway tramway subway opened in 1906 to connect tram networks and operated until 1952.[31]
.jpg)
Early systems
[edit]The "Shaker Heights Rapid Transit" in Cleveland (1920s) provided an early model of a suburban rail line upgraded for tram-like operation and is now part of the RTA Rapid Transit.[32] In Europe, a suburban railway in The Hague was converted to tram operation in 1927, while in Boston the Highland branch was converted in 1959 to create what became the Green Line D branch, boosting ridership with modern PCC cars.[33][34][35]: 8 In 1964 Chicago's experimental Skokie Swift demonstrated features later adopted by many U.S. light rail systems.[36] Many traditional tram and streetcar systems in the United Kingdom, United States, and elsewhere were closed after the 1950s as investment shifted to cars and buses. Leeds and Glasgow briefly built modernized tram lines during the 1940s,[37] but by 1962 Britain had abandoned all tramways except for Blackpool.[38]
Post-war emergence
[edit]Many traditional tram and streetcar systems in the United Kingdom, United States, and elsewhere were closed after the 1950s as investment shifted to cars and buses. Leeds and Glasgow briefly built modernized tram lines during the 1940s,[37] but by 1962 Britain had abandoned all tramways except for Blackpool.[38] Modern light rail developed largely in postwar West Germany, where many tram networks were upgraded rather than abandoned. These Stadtbahn systems introduced features such as high-capacity vehicles, dedicated alignments, and underground city-center tunnels. With the exception of Hamburg, nearly all large and most medium-sized German cities retained trams and modernized them into light rail.[39] Similar modernization took place in Zurich, Rotterdam, The Hague, Gothenburg, Brussels, and in Central and Eastern Europe, notably Ostrava.[40][41]
In the United States, American planner H. Dean Quinby defined the concept of a "limited tramway" in 1962, distinguishing it from traditional streetcars by features such as articulated vehicles, multiple doors, and higher capacity.[42]

The term light rail transit was introduced in North America in 1972 to describe these upgraded systems.[3] The first of the new generation opened in 1978 in Edmonton, Alberta, using German Siemens-Duewag U2 vehicles, followed by Calgary and San Diego. These proved successful and inspired many more U.S., Canadian, and Mexican light rail systems.
Global expansion
[edit].jpg)
From the 1980s onward, light rail and modern tramways experienced a renewed expansion worldwide. In Europe, new networks were built in cities that had abandoned trams, including the reopening of the Nantes tramway in 1985, and systems in Grenoble, Paris, Strasbourg, Bordeaux, Dublin, Barcelona, Bergen[43][44][45] In Britain, modern light rail returned in the 1980s with the Tyne and Wear Metro (1980), Manchester Metrolink (1992), and South Yorkshire Supertram (1994) and Edinburgh (2014).[46]
In North America, the San Diego Trolley (1981)[47] became a model for later projects, and the number of U.S. systems roughly doubled between the 1990s and 2010s with expansions in Portland, Los Angeles, Denver, Dallas, Minneapolis and Seattle.[48] Canada added the Ion in Waterloo and the Confederation Line in Ottawa (both 2019), while Australia introduced the Sydney Light Rail in 1997.[49]
In Asia, the Toyama Light Rail opened in 2006 as Japan's first new tramway in decades,[50] along with a series of Chinese systems such as Shenyang, Nanjing, Guangzhou, Beijing and Shanghai Songjiang.[51]
In Africa and the Middle East, new light rail was introduced in Tunis (1985),[52] Rabat (2011),[53] Algiers (2011), Casablanca (2012), Jerusalem (2011), Dubai (2014), Addis Ababa (2015) and Lusail (2022).[54]
In South America, projects included the Ayacucho Tram in Medellín (2016) and the VLT Carioca in Rio de Janeiro (2016).[55][56]
Types
[edit]It can be hard to distinguish what is called light rail, and other forms of urban and commuter rail. A system termed as a light rail in one city may be considered to be a streetcar or tram system in another. Conversely, some lines that are called "light rail" are very close to rapid transit. In recent years, new terms such as light metro have been used to describe medium-capacity rail systems. Some "diesel light rail" systems, such as Sprinter, bear little similarity to urban rail, and could alternatively be classified as commuter rail with lightweight trains.
There is a history of what would now be considered light rail vehicles operating on heavy rail rapid transit tracks in the US, especially in the case of interurban streetcars. Notable examples are Lehigh Valley Transit trains running on the Philadelphia and Western Railroad high-speed third rail line (now the Norristown High-Speed Line).

Flexibility
[edit]Light rail corridors may constitute a fully segregated corridor, a dedicated right-of-way on a street, an on-street corridor shared with other traffic, a corridor shared with other public transport, or a corridor shared with pedestrians,[57] resulting in a much higher flexibility than heavy rail.[58]
Many systems have mixed characteristics. Indeed, with proper engineering, a rail line could run along a street, then go underground, and then run along an elevated viaduct. For example, the Los Angeles Metro Rail's A Line "light rail" has sections that could alternatively be described as a tramway, a light metro, and, in a narrow sense, rapid transit. This is especially common in the United States, where there is not a popularly perceived distinction between these different types of urban rail systems.
Lower capacity
[edit]The most difficult distinction to draw is that between low-floor light rail and streetcar or tram systems. There is a significant amount of overlap between the technologies; similar rolling stock may be used for either, and it is common to classify streetcars or trams as a subcategory of light rail rather than as a distinct type of transportation. However, some distinctions can be made, though systems may combine elements of both.[59] Low-floor light rail lines tend to follow a reserved right-of-way and with trains receiving priority at intersections, and tend not to operate in mixed traffic, enabling higher operating speeds.[59][60] Light rail lines tend to have less frequent stops than tramways, and operate over a longer distance.[61] Light rail cars are often coupled into multiple units of two to four cars.[60]

Higher capacity
[edit]Light rail systems may also exhibit attributes of rapid transit systems, including having downtown subways, as in San Francisco and Seattle. These partially grade separated light rail lines are sometimes called "semi-metro". This type of light rail emerged when the first subway in Boston opened in 1897 and became popular again in Europe from the 1950s onwards.[62] The development of technology for low-floor and catenary-free trams facilitates the construction of such mixed systems with only short and shallow underground sections below critical intersections as the required clearance height can be reduced significantly compared to conventional light rail vehicles.[63]
Light rail operating on mainline railroads
[edit]

Light rail can be designed to address a gap in interurban transportation between mainline rail and bus services, carrying high passenger numbers more quickly than local buses and more cheaply than mainline trains. Around Karlsruhe, Kassel, and Saarbrücken in Germany, dual-voltage light rail trains partly use mainline railroad tracks, sharing these tracks with mainline rail trains. This allows commuters to ride directly into the city center, rather than taking a mainline train only as far as a central station and then having to change to a tram. In France, similar tram-trains are in use in Paris, Mulhouse, and Strasbourg; further plans exist. In 2022, Spain opened the Cádiz TramBahia, where trams share track with commuter and long-distance trains from the main terminus in the city and curve off to serve cities without a rail connection. Some of the issues involved in such schemes are:[64]
- compatibility of the safety systems
- power supply of the track to the power used by the vehicles (frequently different voltages, rarely third rail vs overhead wires)
- width of the vehicles to the position of the platforms
- height of the platforms
In some cases, tram-trains use previously abandoned or lightly used heavy rail lines in addition to or instead of still in use mainline tracks, like the Manchester Metrolink. In the San Diego region, the "SD&AE" freight line was used to create the initial stage of the light rail network of the San Diego Trolley.[65] In the Netherlands, this concept was first applied on the RijnGouweLijn, and was followed by the RandstadRail project.
System-wide considerations
[edit]Many light rail systems—even fairly old ones—have a combination of both on- and off-road sections. In some countries (especially in Europe), only the latter is described as light rail. In those places, trams running on mixed rights-of-way are not regarded as a light rail but considered distinctly as streetcars or trams. However, the requirement for saying that a rail line is "separated" can be quite low—sometimes just with concrete "buttons" to discourage automobile drivers from getting onto the tracks. Some systems such as Seattle's Link had on-road mixed sections but were closed to regular road traffic, with light rail vehicles and buses both operating along a common right-of-way (however, Link converted to full separation in 2019).
.jpg)
Floor height
[edit]Low-floor LRVs have the advantage of a low-floor design, allowing them to load passengers directly from low-rise platforms that can be little more than raised curbs. High-floor light rail systems also exist, featuring larger stations.[59]
Speed and stop frequency
[edit]Reference speed from major light rail systems, including station stop time, is shown below.[66]
| System | Average speed (mph) | Average speed (km/h) |
|---|---|---|
| Baltimore | 24 | 39 |
| Dallas (Red Line) | 21 | 34 |
| Dallas (Blue Line) | 19 | 31 |
| Denver (Alameda-Littleton) | 38 | 61 |
| Denver (Downtown-Littleton) | 26 | 42 |
| Los Angeles (Blue Line) | 24 | 39 |
| Los Angeles (Green Line) | 38 | 61 |
| Salt Lake City | 24 | 39 |
However, low top speed is not always a differentiating characteristic between light rail and other systems. For example, the Siemens S70 LRVs used in the Houston METRORail and other North American LRT systems have a top speed of 55–71.5 miles per hour (88.51–115.1 km/h) depending on the system, while the trains on the all-underground Montreal Metro can only reach a top speed of 72 kilometres per hour (44.74 mph). LACMTA light rail vehicles have higher top and average speeds than Montreal Metro or New York City Subway trains.[67]
Infrastructure
[edit]Light rail systems operate between heavy rapid transit and conventional street-level trams.[68] Construction costs are typically lower than for metro systems, but building infrastructure can still be significant, sometimes leading to phased development or partial completion of lines.[69][70] Light rail vehicles can often be compatible with existing tram networks, avoiding the need for entirely separate infrastructure or rolling stock.[71][72] In some cases, multiple at-grade branches are used to maximize the capacity of tunneled sections.[73][74]
Tracks
[edit]Right-of-way
[edit],_September_2022.JPG)
,_August_2018.JPG)


Light rail systems can be defined by their right-of-way type and operational features such as power supply and speed.[75][13][76] Three main categories of right-of-way can be categorized as:[13]
- A: Fully independent tracks without road or pedestrian crossings.
- B: Reserved tracks with some level crossings.
- C: Street-running lines in mixed traffic.
Conventional tram lines typically operate on category C, light rail commonly uses category B with some sections of category A, while rapid transit generally operates entirely on category A.[13][76]
Grade-separated tracks correspond to fully independent right-of-way, while reserved tracks can be exclusive or semi-exclusive.[77] Light rail operating entirely on independent tracks is sometimes also referred to as light rail rapid transit.[11] Dedicated stretches of track may designed to function similarly to regular metro or rapid transit lines.[78][79] One key difference from rapid transit is that light rail lines may only have one or a few sections in tunnels and on viaducts.[80][81]


Track gauge
[edit]Light rail systems historically used various gauges, with narrow gauge common early on. Most modern systems use standard gauge, which allows standard maintenance equipment, easier transfer of rolling stock, tighter turns with articulated cars, and better low-floor accessibility. For example, the Tren de la Costa in Greater Buenos Aires was converted from broad to standard gauge to accommodate light rail vehicles.[39]
Power sources
[edit]Most light rail systems use overhead lines for electricity, avoiding hazards from an electrified third rail. Some systems use battery power for sections of track without overhead catenary,[82] while a few light rail systems use diesel power.[5][83]
Ground-level power supply
[edit]Conduit power was an early alternative to overhead wires in cities prohibiting them, used in London, Paris, Berlin, Marseille, Budapest, Prague, New York City, and Washington, D.C.[84]
In Bordeaux, the tram network uses a ground-level third rail in the city center, segmented and powered only under trams to ensure safety. Outside the center, trams use overhead wires. The system is three times more expensive than conventional overhead wiring and has high maintenance costs but has proven popular, carrying up to 190,000 passengers per day.[85]
Signalling
[edit]Automatic train operation
[edit]Automatic train operation (ATO) monitors train position and speed, adjusting movements for safety and efficient operations, and is used in some light rail networks.[86]
Rolling stock
[edit]Light rail routes are operated either with regular trams (with or without low floor) or with specially developed tramcars (light rail vehicles), such as the Stadtbahn-car 'type B'.[87]: 55 Many light rail systems (including in the United States),[88] are operated with larger and heavier vehicles than those on streetcar systems.[80]
Comparisons of rolling stock types
[edit]| Type | Rapid transit (heavy rail)* | Light rail | Tram, or streetcar | Heritage streetcar |
|---|---|---|---|---|
| Manufacturer | Rohr | Siemens | Skoda | Gomaco Trolley Co. |
| Model | BART A-Car | S70 | 10T | Replica Birney |
| Width | 3.2 metres (10 ft 6 in) | 2.7 metres (8 ft 10+1⁄4 in) | 2.6 metres (8 ft 6+3⁄8 in) | 2.62 metres (8 ft 7+1⁄8 in) |
| Length | 22.9 metres (75 ft 1+5⁄8 in) | 27.7 metres (90 ft 10+1⁄2 in) articulated | 20.13 metres (66 ft 1⁄2 in) articulated | 15.16 metres (49 ft 8+7⁄8 in) |
| Weight (empty) | 63.1 t | 48.6 t[89] | 28.8 t | 23.5 t[90] |
| Capacity | 150 max. | 72 seats, 220 max.[89] | 30 seats, 157 max. | 40 seats, 50 max.[90] |
| Top speed | 125 km/h (77.7 mph) | 106 km/h (65.9 mph) | 70 km/h (43.5 mph) | 48 km/h (29.8 mph) |
| Typical consist | 4–10 vehicles | 2–5 vehicles | 1 vehicle | 1 vehicle |
The BART railcar in the chart is not generally considered to be a "light rail" vehicle (it is a heavy rail vehicle), and is only included for comparison purposes.
Related types of rail transit
[edit]
Premetro
[edit]Premetro is largely equal to light rail: a type of public transport in which trams run partly grade separated, by using tunnels and/or viaducts. However, there is one clear distinguishing factor: premetro uses infrastructure that has been explicitly constructed with the ambition to transfer to use metro trains in the future.[74]: 521 [87]: 9 [91][92] It is usually also developed from an existing classic tram network. One prominent example is the premetro in Brussels, where several premetro lines have been or will be converted into full heavy rail metro lines.
U-Stadtbahn
[edit]The U-Stadtbahn is also an intermediate transportation form between metro and tram. It has originated in Germany, adapting the existing tram networks. Here specially developed trams run underground through tunnels in central urban areas.[87]: 10 [93][94] Stadtbahn lines can be subdivided by looking at the types of rolling stock.
- There are lines where full-sized (i.e. 2.65 m (8 ft 8 in) wide) express trams run, with long wagon bodies: Cologne, Frankfurt and Stuttgart, among others.
- In some networks, narrower Stadtbahn trams with shorter wagon bodies were used at the start of the operation: Hannover (TW6000) and Bielefeld (Düwag M/N).
- From the end of the 20th century Stadtbahn lines with low-floor trams also appeared: Dortmund (U43 & U44), Düsseldorf (Wehrhahnlinie) and Cologne (1, 7, 9, 12 and 15).
Light metro
[edit]Some systems, such as the AirTrain JFK in New York City, the DLR in London, and Kelana Jaya Line in Kuala Lumpur, have dispensed with the need for an operator. The Vancouver SkyTrain was an early adopter of driverless vehicles, while the Toronto Scarborough rapid transit operated the same trains as Vancouver, but used drivers. In most discussions and comparisons, these specialized systems are generally not considered light rail but as light metro systems. Light metro systems are essentially hybrids of light rail and rapid transit.[15][95]
Hybrid rail
[edit]
In the United States, interurban-style services are now rare, largely because the Federal Railroad Administration (FRA) does not permit non-compliant railcars (such as rapid transit or light rail vehicles) to operate simultaneously with standard freight or passenger equipment on the same tracks for safety reasons.
Exceptions, known as hybrid rail in the United States, include NJ Transit's River Line from Camden and Trenton and the North County Transit District's (NCTD) Sprinter service in northern San Diego County, California. These services operate under FRA waivers that allow passenger trains to run during daytime hours and freight trains at night, with several hours of temporal separation between the two. These diesel-powered systems use lightweight diesel multiple units (DMUs) originally designed for mainline railroads.
Very light rail
[edit]
While the word light in "light rail" refers to the lighter capacity compared to heavy rail/rapid transit, however the same word refers to lightweight in "very light rail'. One example in passengers service is British Rail Class 139 on the Stourbridge Town branch line.
Very Light Rail developments with prefabricated track and onboard power (no Over Head Line) in the UK are aiming for £10 m per km[96] as opposed to convention tram rail and OHL at £20–£30 m per km.[97] First tests in Coventry have started in 2025, a full line should be operation able by 2027.
Comparison to other rail transit modes
[edit]With its mix of right-of-way types and train control technologies, LRT offers the widest range of latitude of any rail system in the design, engineering, and operating practices. The challenge in designing light rail systems is to realize the potential of LRT to provide fast, comfortable service while avoiding the tendency to overdesign that results in excessive capital costs beyond what is necessary to meet the public's needs.[98]
| Alternative | Differences |
|---|---|
| Rapid transit | Rapid rail transit (RRT) trains are larger and faster than light rail trains, with stops being further apart.[83] Light rail vehicles (LRVs) are distinguished from RRT vehicles by their capability for operation in mixed traffic, generally resulting in a narrower car body and articulation to operate in a street traffic environment. With their large size, large turning radius, and often an electrified third rail, RRT vehicles cannot operate in the street. Since LRT systems can operate in existing streets, they can often avoid the cost of expensive grade-separated subway and elevated segments that would be required with RRT. |
| Streetcars or trams | Conversely, LRVs generally outperform traditional streetcars in terms of capacity and top-end speed, and almost all modern LRVs are capable of multiple-unit operation. The latest generation of LRVs is considerably larger and faster, typically 29 metres (95 ft 1+3⁄4 in) long with a maximum speed of around 105 kilometres per hour (65.2 mph).[99] |
| Heritage streetcars | A variation considered by many cities is to use historic or replica cars on their streetcar systems instead of modern LRVs. A heritage streetcar may not have the capacity and speed of an LRV, but it will add to the ambiance and historic character of its location. |
| Light metro | A derivative of LRT is light rail rapid transit (LRRT), also referred to as light metro. Such railroads are characterized by exclusive rights of way, advanced train control systems, short headway capability, and floor-level boarding. These systems approach the passenger capacity of full metro systems but can be cheaper to construct due to LRVs generally being smaller in size, turning tighter curves and climbing steeper grades than standard RRT vehicles, and having a smaller station size. |
| Interurbans | The term interurban mainly refers to rail cars that run through streets like ordinary streetcars (trams), but also between cities or towns, often through rural environments. In the period 1900–1930, interurbans were very common in the US, especially in the Midwest. Some of them, like the Red Devils, the J. G. Brill Bullets, and the Electroliners, were the high-speed railcars of their time, with an in-service speed of up to about 145 km/h (90 mph). In Europe, interurbans are making a comeback as "tram-trains" (locally known under different names) that operate on both the railroad and light rail tracks, often with different voltages. The Karlsruhe Stadtbahn is one well-known example. |
Capacity
[edit]
Comparison with high-capacity roads
[edit]A single light rail line (requiring a 7.6 m [25 ft] right-of-way) can carry up to eight times more passengers than a 3.7 m (12 ft) freeway lane during peak periods. Freeway lanes typically reach capacity at about 2,000 vehicles per hour, beyond which traffic flow breaks down and speeds collapse.[100] With average commuter car occupancy of only 1.5 persons,[101] freeways carry a maximum of about 3,000 passengers per lane per hour. HOV lanes and ride-sharing can improve this, but most jurisdictions expand roadway capacity instead, sometimes worsening congestion (Downs–Thomson paradox, Braess's paradox).[102][103][104]
By contrast, light rail trains operating in two-track rights-of-way as narrow as two car lanes can exceed 20,000 passengers per hour per direction, and over 25,000 with moving block signaling.[105][106]
Roadway person-throughput varies by permitted vehicle types. A typical car-only lane carries about 1,900 passenger cars per lane per hour (pcplph).[107] Adding buses or light rail raises capacity, as shown below:
| Car | Car + bus | Car + light rail | |
|---|---|---|---|
| Low volume | 900 | 1,650 | 2,250 |
| Medium volume | 900 | 2,350 | 3,250 |
| High volume | 900 | 3,400 | 4,600 |
| Source: Edson & Tennyson, 2003[full citation needed] | |||
Comparison with bus rapid transit
[edit]Bus rapid transit (BRT) is often compared with LRT in corridor planning. BRT in dedicated lanes can exceed 30,000 passengers per hour per direction, as in Guangzhou Bus Rapid Transit, which operates up to 350 buses per hour. Achieving this requires large stations, bus priority at intersections, and overtaking lanes for express services. BRT labor and fuel costs are typically higher, since each bus requires a driver and most use non-electrified vehicles. Ride quality is also lower, with more abrupt braking and acceleration compared to rail.[108]
Practical considerations
[edit]Most U.S. light rail systems are demand-limited, carrying under 4,000 passengers per hour per direction, though Boston and San Francisco reach 9,600 and 13,100 respectively.[109] Calgary's C-Train and Mexico's Monterrey Metro have higher ridership, while Manila's Light Rail Transit System exceeds 40,000 per hour per direction, operating four-car trains of up to 1,350 passengers at 30 trains per hour. Manila's system, however, is fully grade-separated and more comparable to a metro.[110]
Costs and efficiency
[edit]
Light rail construction costs vary widely depending on tunneling and elevated structures. A survey of North American projects found most systems cost between $15 million and $100 million per mile, averaging $35 million (excluding Seattle).[111] Seattle's Link Light Rail reached $179 million per mile due to tunneling, elevated sections, and deep stations,[112] while Baltimore, Camden, Sacramento, and Salt Lake City each built systems for under $20 million per mile.
By comparison, freeway lane expansion averages $2.3 million per lane-mile, but is usually built in less costly suburban or rural areas. The most expensive U.S. road project, Boston's Big Dig, reached $200 million per lane-mile.[113] A light rail track can carry up to 20,000 passengers per hour, compared with 2,000–2,200 vehicles per freeway lane,[114] with Boston and San Francisco lines carrying 9,600 and 13,100 peak-hour passengers respectively.[109]
.jpg)
Joint highway–LRT projects can lower costs, as shown by Denver's Transportation Expansion Project, which rebuilt 17 mi of highway and added 19 mi of light rail for $1.67 billion, or $19.3 million per highway lane-mile and $27.6 million per rail mile. The project finished under budget and nearly two years early.[115][116]
The Calgary CTrain minimized costs by avoiding tunnels and elevated sections, using existing rail corridors, and combining construction with freeway projects. Its capital cost was $24 million per mile,[117] about one-third that of the San Diego Trolley. By 2009, Calgary carried three times San Diego's ridership with lower capital and operating cost per passenger. Operating costs average C$163 per train-hour, or about 27 cents per ride, compared with $1.50 for buses.[118][117]
Light rail often has lower labor costs per passenger mile, attracts more riders than buses,[119] and achieves faster speeds with fewer vehicles required. Vehicles cost more upfront but last longer, reducing life-cycle costs. Compared with heavy rail, LRT has lower capital but higher operating costs.[120]
Light rail energy efficiency is estimated at 120 passenger-miles per gallon of fuel equivalent, though performance varies with context.[121]
Effects
[edit]
Safety
[edit]An analysis of data from the 505-page National Transportation Statistics report[122] published by the US Department of Transportation shows that light rail fatalities are higher than all other forms of transportation except motorcycle travel (31.5 fatalities per 100 million miles).[123]
However, the National Transportation Statistics report published by the US Department of Transportation states that:[122]
Caution must be exercised in comparing fatalities across modes because significantly different definitions are used. In particular, Rail and Transit fatalities include incident-related (as distinct from accident-related) fatalities, such as fatalities from falls in transit stations or railroad employee fatalities from a fire in a workshed. Equivalent fatalities for the Air and Highway modes (fatalities at airports not caused by moving aircraft or fatalities from accidents in automobile repair shops) are not counted toward the totals for these modes. Thus, fatalities not necessarily directly related to in-service transportation are counted for the transit and rail modes, potentially overstating the risk for these modes.
Health impact
[edit]Studies have attributed light rail with a number of health impacts. Research has associated light rail positively with increased walking and decreased obesity.[124][125] Additionally, one electric light rail train produces nearly 99 percent less carbon monoxide and hydrocarbon emissions per mile than one automobile does.[126]
Examples
[edit]Worldwide around 400 cities have one or more tram/light rail systems. Some date back to the 19th century, and by the 1930s almost 900 tram/light rail system existed. Many of the original tram and streetcar systems were closed down in the mid-20th century, except in most Central and Eastern European countries. Other cities that once closed down their streetcar networks are now restoring, or have already rebuilt, at least some of their former streetcar/tram systems.[127]
-
 A light-rail vehicle on the Hämeenkatu street in Tampere
 -
 Metrotram in Kryvyi Rih (Ukraine) was separated from the streets, but later connected to the existing tram network.
 -

-
 Porto metro light rail station in 2022
 -
 The light rail in Tunis, Tunisia, was the first light rail system in Africa
 -
 Underground light rail stop in Zurich, 2022
 -
 Tram in Dubai, UAE
 -
 Frankfurt U-Bahn light rail station in 1970
 -
 Rouen tramway subway portal in 2015
 -
 Poznań underground station in 2019
 -
 Istanbul underground station in 2020
 -
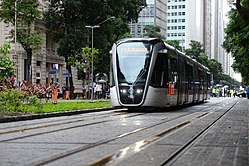 A light-rail vehicle of the VLT Carioca in Rio de Janeiro, Brazil
 -
 Danhai elevated station in 2018
 -


.jpg)
.jpg)


.jpg)

.jpg)


See also
[edit]- General Motors streetcar conspiracy
- Health impact of light rail systems
- History of tram and light rail transit systems by country
- Light rail in North America
- List of modern tramway and light rail systems in the United Kingdom
- List of rail transit systems in the United States
- List of town tramway systems (all-time lists)
- List of tram and light rail transit systems
(operational systems only) - Medium-capacity rail system
- Passenger rail terminology
- Premetro
- Railway electrification
- Rubber-tyred tram
References
[edit]- ^ Vuchic, V.R. (1975). "Place of light rail transit in the family of transit modes". TRB Special Report (161). Transportation Research Board. Retrieved 1 July 2024. National Conference of the Transportation Research Board
- ^ Transportation Glossary. AASHTO. 2009. p. 65. ISBN 978-1-56051-408-4.
- ^ a b Thompson, Gregory L. (2003). "Defining an Alternative Future: The Birth of the Light Rail Movement in North America". Transportation Research Circular (E-C058). Transportation Research Board. Retrieved 26 December 2009. From: 9th National Light Rail Transit Conference
- ^ "New railway bridge over the Neckar river". Retrieved 24 June 2024.
- ^ a b c "Fact Book Glossary – Mode of Service Definitions". American Public Transportation Association. 2015. Archived from the original on 25 February 2018. Retrieved 6 January 2015.
- ^ "National Transit Database Glossary". U.S. Department of Transportation Federal Transit Administration. 18 October 2013. Archived from the original on 13 November 2013. Retrieved 6 January 2015.
- ^ "What is light rail?". Public transport A-Z. International Association of Public Transport. 2008. Archived from the original on 13 October 2008. Retrieved 29 July 2015.
- ^ "This Is Light Rail Transit" (PDF). Transportation Research Board. pp. 7–9. Archived from the original (PDF) on 17 April 2018. Retrieved 6 January 2015.
- ^ "What is Light Rail?". Light Rail Transit Association (LRTA). Archived from the original on 5 June 2016. Retrieved 6 January 2015.
- ^ Glossary of Transit Terms. 1992. p. 9. Retrieved 24 June 2024.
- ^ a b Vuchic, Vukan R. (14 February 2007). Urban Transit Systems and Technology. Wiley. p. 579. doi:10.1002/9780470168066. ISBN 978-0-471-75823-5. Retrieved 15 August 2024.
- ^ Gregory L. Thompson (2003), Defining an Alternative Future: Birth of the Light Rail Movement in North America (PDF), Transportation Research Board.
- ^ a b c d Vuchic, Vukan R. (1986). Trends in the Development of Urban Passenger Transport Systems and Vehicles. Fisita. p. 31.
- ^ Armstrong-Wright, Alan (1986). Urban Transit Systems: Guidelines for Examining Options. World Bank. p. 1. ISBN 978-0-8213-0765-6.
- ^ a b Johnson, Matt (4 April 2019). "Light rail? Heavy rail? Subway? Rail transit modes fall on a continuum". Greater Greater Washington. Retrieved 24 July 2024.
- ^ "Definition of LIGHT RAILWAY". www.merriam-webster.com. Retrieved 24 November 2024.
- ^ "VICSIG". vicsig.net. Retrieved 23 August 2025.
- ^ "Dublin Trams (Luas) - Maps, Timetables and Travel Information". Dublin Public Transport - Maps, Timetables and Information. Retrieved 23 August 2025.
- ^ "Trams Still Around New Zealand". The National Railway Museum of New Zealand. Retrieved 23 August 2025.
- ^ "Tram (definition)". Merriam-Webster Online Dictionary. Retrieved 18 July 2007.
- ^ "The Yesterland Hotel Tram". Yesterland.com. Retrieved 7 February 2013.
- ^ "Trolley (definition)". Merriam-Webster Online Dictionary. Retrieved 18 July 2007.
- ^ "Light Rail Transit". Encyclopædia Britannica. Retrieved 18 July 2007.
- ^ Smiler, Simon P. "Trams, Streetcars, and Light Rail Vehicles". citytransport.info. Retrieved 18 July 2007.
- ^ Plous, F.K. Jr. (June 1984). "A Desire Named Streetcar". Planning. American Planning Association. Archived from the original on 3 March 2006. Retrieved 14 August 2007.
- ^ p.c., Metro Tech Consulting Services Engineering Architecture; Consultants, Track Guy (2012). Track Design Handbook for Light Rail Transit, Second Edition. Bibcode:2012nap..book22800N. doi:10.17226/22800. ISBN 978-0-309-25824-1. Retrieved 15 February 2020.
{{cite book}}:|website=ignored (help) - ^ "Park Avenue Tunnel". 6 December 2012. Retrieved 15 October 2024.
- ^ "38th Street". Retrieved 15 October 2024.
- ^ "First Car off the Earth: Allston Electric Goes into the subway on schedule time". The Boston Daily Globe. 1 September 1897. Archived from the original on 29 August 2005.
- ^ Most, Doug (26 January 2014). "The bigger dig". Boston Globe. Retrieved 8 February 2023.
- ^ Historic England. "Kingsway Tram Subway (northern section only) (Grade II) (1378792)". National Heritage List for England. Retrieved 15 February 2025.
- ^ Middleton, William D. (2003). Metropolitan Railways: Rapid Transit in America. Indiana University Press. pp. 146–147. ISBN 978-0-253-34179-2.
- ^ Historische trams van HTM (in Dutch). Haagse Tramweg Maatschappij/Bureau Monumentenzorg Den Haag. July 1985. p. 3.
- ^ "Sneltram (light rail)". NVBS (in Dutch). Retrieved 18 August 2025.
- ^ Dana, Edward (October 1960 – July 1961). "Riverside Line Extension, 1959". Transportation Bulletin. No. 65. Connecticut Valley Chapter of the National Railway Historical Society.
- ^ Sisson, Patrick (18 September 2017). "When Chicago's Yellow Line was the future of urban transportation". Curbed Chicago.
- ^ a b Skelsey, Geoffrey (2018). Brussels Metro to Grow As Pre-metro Shrinks. London Underground Railway Society.
- ^ a b Courtenay, Peter (2006). "Trams in the UK". thetrams.co.uk. Retrieved 26 December 2009.
- ^ a b Bottoms, Glen (2000). Continuing Developments in Light Rail Transit in Western Europe (PDF). 9th National Light Rail Transit Conference. Portland, Oregon: Light Rail Transit Association. Retrieved 26 December 2009.
- ^ Vuchic, Vukan R. (1 November 1985). "Light Rail Transit: Ugly Duckling Becomes a Swan". Railway Gazette International. 141 (808): 829. Retrieved 20 June 2025.
- ^ Khairullina, Elvira (2021). "Trams in the European Socialist countries in the 1960s and 1970s: From crisis to impetus". Arquitectura Ciudad y Entorno. 16 (46). Retrieved 25 March 2025.
- ^ Quinby, Henry D. (January 1962). "Major Urban Corridor Facilities: A New Concept". Traffic Quarterly. 16 (1). Eno Foundation for Highway Traffic Control: 242–259.
- ^ "Nantes (France)". UrbanRail.net. Retrieved 23 August 2025.
- ^ "First line opens in Bordeaux". Railway Gazette International. 21 December 2003.
- ^ "UrbanRail.Net > Europe - Metros, Light Rail & Trams". www.urbanrail.net. Retrieved 23 August 2025.
- ^ Butcher, Louise (25 January 2012). "Railways: light rail schemes" (PDF). House of Commons Library. p. 2. Retrieved 24 July 2024.
- ^ "MTS Historical Timeline". www.sdmts.com. Archived from the original on 20 August 2013. Retrieved 23 August 2025.
- ^ "2015 Public Transportation Fact Book" (PDF). APTA. 2015.
- ^ "Inner West Light Rail | The Dictionary of Sydney". dictionaryofsydney.org. Retrieved 23 August 2025.
- ^ "富山市・富山地方鉄道・富山ライトレール,2020年3月21日から路面電車の南北接続を開始 〜運行形態や運賃などの概要を発表〜|鉄道ニュース|2019年11月6日掲載|鉄道ファン・railf.jp". 鉄道ファン・railf.jp (in Japanese). Retrieved 23 August 2025.
- ^ "China embraces light rail". International Railway Journal. Retrieved 23 August 2025.
- ^ "Tunis Light Rail Development". Railway Technology. Retrieved 23 August 2025.
- ^ "Straßenbahn Rabat - Salé tram". public-transport.net (in German). Retrieved 23 August 2025.
- ^ "Ethiopia opens $475 mln Addis Ababa light rail". Reuters. 20 September 2015.
- ^ "Rio de Janeiro opens first light rail line". International Railway Journal. 7 June 2016.[dead link]
- ^ Carr, Collin (27 October 2015). "Colombia's president opens Ayacucho tramway". Rail UK. Retrieved 23 August 2025.
- ^ "Light rail station infrastructure" (PDF). Department of Transport and Main Roads. p. 19.
- ^ "This is Light Rail Transit". TRB Circular: 3. 2003. Retrieved 18 March 2025.
- ^ a b c "Streetcars vs LRT". Edmonton Radial Railway Society. Retrieved 22 July 2024.
- ^ a b "Light Rail". Seashore Trolley Museum. Archived from the original on 22 July 2024. Retrieved 22 July 2024.
- ^ Walker, Jarrett (26 March 2010). "Streetcars vs Light Rail ... Is There a Difference?". Human Transit. Retrieved 22 July 2024.
- ^ Zupan, Jeffrey; Pushkarev, Boris (1 November 1980). Urban Rail in America: An Exploration of Criteria for Fixed-Guideway Transit. U.S. Department of Transportation. doi:10.21949/1527455. Retrieved 20 June 2025.
- ^ "Low-clearance Rapid Transit: Cheaper than subways, faster than trolleys". TreeHugger. Retrieved 15 November 2019.
- ^ Davidson, Robert (February 2010). "Tram-trains: are they worth it?". Tramways & Urban Transit: 47, 48.
- ^ Hoffman, M. Allen (1989). The Decision Process for Implementing Fixed-guideway Systems. pp. 32–44.
- ^ "Light Rail Schedule Speed – Faster Than Bus, Competitive With Car". www.lightrailnow.org.
- ^ "Link Light Rail in the North American Context". 30 December 2009.
- ^ "Another Alternative: The Case for Light Rail, Part 2". Transit Journal. 1 (3). American Public Transit Association.: 56 August 1975.
- ^ Duin, Leen (2009). The Urban Project: Architectural Intervention in Urban Areas. IOS Press. p. 80. ISBN 978-1-58603-999-8. Retrieved 31 March 2025.
- ^ A Report on the ... Conference on Mass Transportation. United Transportation Union. 1966. p. 53. Retrieved 18 March 2025.
- ^ White, Peter (2016). "Light rapid transit (LRT) (also known as light rail)". Public transport: its planning, management and operation (Edition 6 ed.). New York. ISBN 9781317383178.
In other cases, a tramway may be upgraded by extensive construction of city-centre tunnels, and some stations at which all tickets are sold prior to boarding the vehicle ('semi-metro'), for example in Stuttgart. An advantage of such systems is that trams can be diverted into relatively short sections of tunnel as they are built, rather than waiting for a major portion of the system to be completed before operations can commence.
{{cite book}}: CS1 maint: location missing publisher (link) - ^ van Lith, Joske (10 December 2010). "Geluidloos zoeven door Rennes". Verkeerskunde (in Dutch). Retrieved 2 February 2023.
- ^ ECMT Round Tables (1975). Economic Problems of Traffic Peaks. Organisation for Economic Co-operation and Development. p. 39. Retrieved 31 March 2025.
- ^ a b "The Rapid Tramway: A Feasible Solution to the Urban Transportation Problem". Traffic Quarterly. 24 (4). 1970. ISSN 0041-0713. Retrieved 7 April 2024.
- ^ De Leuw, Cather & Company (1976). Light Rail Transit: A State of the Art Review. Retrieved 8 February 2023.
- ^ a b Vuchic, Vukan R. (14 January 2002). Urban Public Transportation Systems. University of Pennsylvania. pp. 4, 5.
- ^ "2 Mode and service concepts". Transit Capacity and Quality of Service Manual. Transportation Research Board. 2013. p. 31/35. ISBN 978-0-309-28344-1.
- ^ Organisation for Economic Co-operation and Development. (1973). The Automobile and the Environment. Retrieved 9 February 2023.
descending into tunnels in the style of conventional underground mass transit
- ^ Norley, Kym (2010). Light rail: The semi-metro concept. p. 4.
Semi-metro: Light rail on reserved right of way over congested parts of line typically in tunnel or viaduct for grade separation designed to Metro standards, with priority surface light rail in other sections
- ^ a b Cappelli, Agostino; Nocera, Silvio; Libardo, Alessandra (2013). Environment, land use and transportation systems: selected papers. p. 42. Retrieved 22 March 2024.
Rather soon attention was given to Light Rapid Transit modes such as pre-metro and semi-metro (Hannover) employing heavy trams instead of light trains to run on open-air independent or semi-independent tracks, and just and just seldom using short bypass tunnels or fly-evers to skip congestion in central areas.
- ^ Orski, C.K. (1973). "New Transportation Service Concepts". Proceedings of the International Conference on Transportation Research: 407. Retrieved 9 February 2023.
- ^ "Bi-modes, batteries and fuel cells". www.modernrailways.com. 26 April 2018. Retrieved 23 August 2025.
- ^ a b "Light Rail Transit (LRT) FAQs". Toronto Environmental Alliance. Retrieved 24 July 2024.
- ^ Post, Robert C. (2007). Urban Mass Transit: The Life Story of a Technology. Greenwood Press. pp. 45–47. ISBN 978-0-313-33916-5.
- ^ "99% AVAILABILITY AND EXCEPTIONALLY HIGH PASSENGER LEVELS : THE BORDEAUX URBAN TRAMWAY IS A RESOUNDING SUCCESS". Railway-Technology.com. Net Resources International. Archived from the original on 13 June 2008. Retrieved 26 December 2009.
- ^ "ATO: The Key to the Future of Rail?" (PDF). Critical Software. Retrieved 24 July 2024.
- ^ a b c De Leuw, Cather & Company (1976). Light Rail Transit: A State of the Art Review. Retrieved 8 February 2023.
- ^ Sharing of Rail Transit Infrastructure by Streetcars and Larger Light Rail Vehicles: Design and Operational Issues. Washington, DC: American Public Transportation Association. 2006. ISBN 978-1-931594-23-3. Retrieved 20 November 2024.
- ^ a b "Siemens S70 Low-floor Light Rail Vehicle" (PDF). Siemens.
- ^ a b "Gomaco Trolley Company". Gomaco Trolley Company.
- ^ "PREMETRO [1 record]". TERMIUM Plus®. 8 October 2009. Retrieved 9 February 2023.
- ^ Transportation Research Board National Research Council (1989). Urban Public Transportation Glossary. Retrieved 16 February 2023.
pre-metro: a light rail transit system designed with provisions for easy conversion to rail rapid transit
- ^ Harman, Reg (2006). High speed trains and the development and regeneration of cities. London: Greengauge 21. p. 19.
Köln, like other major German cities served by ICE services over high-speed lines, has a regional rail system (Schnellbahn) and a substantial tramway system, part operated as Stadtbahn (semi metro).
- ^ Pedestrian Observations (29 October 2020). "Stadtbahn Systems". Retrieved 16 February 2023.
- ^ "Light-Rail Transit (LRT)". Transportation Policy Research. 19 January 2016. Retrieved 24 July 2024.
- ^ "Target cost and timescale revealed for Coventry very light rail scheme". 25 September 2019.
- ^ "1 tram light rail track installation costs £20-£30 m per km is a good ball-park figure". 30 July 2019.
- ^ Fazio, A. E.; Hickey, T. R. (2003). "Designing New Light Rail – Taking Engineering Beyond Vanilla". Circular E-C058: 9th National Light Rail Transit Conference. Transportation Research Board. Retrieved 10 November 2006.
- ^ "Technical Data". Light Rail Vehicle System Houston/Texas, USA. Siemens. 2008. Archived from the original on 27 April 2008. Retrieved 18 March 2008.
- ^ Matt Lorenz and Lily Elefteriadou (2000) A Probabilistic Approach to Defining Freeway Capacity and Breakdown (PDF), Transportation Research Board.
- ^ "Highlights of the 2001 National Household Travel Survey: A-15 Vehicle Occupancy Per Vehicle Mile by Time of Day and Weekend Status". US Department of Transportation. Archived from the original on 28 June 2017. Retrieved 24 February 2016.
- ^ https://homepage.rub.de/Dietrich.Braess/Paradox-BNW.pdf (1968) end of chapter 4 retrieved 2023/02/27
- ^ "Ontario Expanding Highway 401 in Cambridge". news.ontario.ca. Retrieved 2 December 2021.
- ^ "Ontario is finally widening Highway 401 through the GTA". www.blogto.com. Retrieved 2 December 2021.
- ^ Tom Parkinson and Ian Fisher (1996) Rail Transit Capacity Archived 11 January 2009 at the Wayback Machine, Transportation Research Board.
- ^ Transit Capacity and Quality of Service Manual, Transportation Research Board.
- ^ NCHRP Report 599: Default Values for Highway Capacity and Level of Service Analyses (PDF). NATIONAL COOPERATIVE HIGHWAY RESEARCH PROGRAM. 2008. doi:10.17226/22061. ISBN 978-0-309-43229-0.
- ^ The Urban Rail Development Handbook. PPIAF. p. 73. Retrieved 9 April 2025.
- ^ a b Hanson, Susan; Giuliano, Genevieve (2004). The geography of urban transportation. Guilford Press. ISBN 1-59385-055-7.
- ^ "LRT-1 sets 25-year high record ridership". Manila Light Rail Transit Authority. 12 January 2009. Archived from the original on 26 March 2009. Retrieved 14 March 2009.
- ^ "Status of North American Light Rail Projects". Light Rail Now. 2002. Archived from the original on 28 October 2006. Retrieved 23 November 2006.
- ^ "Link Light Rail Projects". Sound Transit. 2006. Archived from the original on 17 November 2006. Retrieved 23 November 2006.
- ^ "Highway Construction Cost Comparison Survey Final Report" (PDF). Washington State Department of Transportation. April 2002. p. 3. Archived from the original (PDF) on 5 September 2009.
- ^ Traffic and Highway Engineering By Nicholas J. Garber, Lester A. Hoel, p. 37
- ^ Shaw, Mark (May–June 2006). "Reinventing a Corridor: Denver's T-REX project nears completion after five years". Constructor. McGraw-Hill Construction. Archived from the original on 19 October 2006. Retrieved 20 November 2006.
- ^ Flynn, Kevin (17 November 2006). "T-REX trains ready to roll". Rocky Mountain News (Denver, CO). Archived from the original on 22 March 2007. Retrieved 20 November 2006.
- ^ a b McKendrick; et al. (2006). "Calgary's C-Train – Effective Capital Utilization" (PDF). Joint International Light Rail Conference, St. Louis, Missouri. Calgary Transit. Archived from the original (PDF) on 18 December 2011. Retrieved 11 February 2008.
{{cite journal}}: Cite journal requires|journal=(help) - ^ "LRT technical data". Calgary Transit. 2006. Archived from the original on 23 October 2006. Retrieved 14 October 2006.
- ^ Scherer, Milena (January 2010). "Is Light Rail More Attractive to Users than Bus Transit?: Arguments Based on Cognition and Rational Choice". Transportation Research Record. 2144: 11–19. doi:10.3141/2144-02. S2CID 109351210 – via SAGE Journals.
- ^ Vuchic, Vukan R. (1 October 1972). "Light Rail Transit Systems: A Definition and Evaluation". United States Department of Transportation Urban Mass Transportation Administration (730). Retrieved 21 February 2024.
- ^ Comparison of Energy Use & CO2 Emissions From Different Transportation Modes Archived 29 May 2015 at the Wayback Machine page 7, M.J. Bradley & Associates, May 2007
- ^ a b "National Transportation Statistics 2013" (PDF). U.S. Department of Transportation. Archived from the original (PDF) on 25 May 2017. Retrieved 24 February 2016.
- ^ Sabatini, Jeff (25 April 2014). "Dissected: Charting transportation mayhem in its many gory varieties". Car and Driver.
- ^ Edwards, R. D. (2008). "Public transit, obesity, and medical costs: Assessing the magnitudes". Preventative Medicine, 46, 14–21.
- ^ MacDonald, J. M., Stokes, R. J., Cohen, D. A., Kofner, A., and Ridgeway, G. K. (2010). "The effect of light rail transit on body mass index and physical activity". American Journal of Preventive Medicine, 39(2), 105–112.
- ^ American Public Transit Association. (1993) Transit Fact Book, Washington, D.C. 104.
- ^ The global tram and light rail landscape 2019-21. p. 2. Retrieved 18 August 2025.
External links
[edit]- Light Rail Transit Committee of the Transportation Research Board (US)
- Light Rail Transit Association (UK-based, international organization)
- "This Is Light Rail Transit" (PDF) brochure by the American Public Transportation Association (APTA) (2000; updated 2003)
| Bus service | |
|---|---|
| Rail | |
| Vehicles for hire | |
| Carpooling | |
| Ship | |
| Cable | |
| Other transport | |
| Locations | |
| Ticketing and fares |
|
| Routing | |
| Facilities | |
| Scheduling | |
| Politics | |
| Technology and signage | |
| Models | |
| Other topics | |
| Power | .JPG) | ||||
|---|---|---|---|---|---|
| Articulation | |||||
| Consist and use | |||||
| Systems |
| ||||
| Infrastructure | |||||
| Overview | |||||
Light rail
View on GrokipediaLight rail transit (LRT) is a metropolitan electric railway system that operates single cars or short trains of lightweight vehicles on fixed rails, typically in a mix of street-level alignments sharing space with road traffic, dedicated surface rights-of-way, or occasional elevated and subway sections, enabling medium-capacity urban passenger transport with level boarding at low platforms or street level.[1] This design provides higher speeds and capacities than buses through priority signaling and partial grade separation in some segments, distinguishing it from slower, fully street-running streetcars, while employing lighter infrastructure and vehicles than fully grade-separated heavy rail subways, which handle higher volumes with multi-car trains and complex signaling.[2][3] Modern LRT emerged in the United States during the 1970s as a revival of earlier streetcar technologies, with the first contemporary systems opening in cities like San Diego in 1981, followed by rapid expansion to over two dozen U.S. networks by 2000 and ongoing global adoption for urban mobility.[1] Proponents highlight its potential to carry greater passenger loads—averaging over three times the weekday boardings per vehicle compared to buses—and foster transit-oriented development, as evidenced by ridership growth in select implementations like Sacramento's system, which exceeded 8 million annual passengers by 1998.[1] However, empirical analyses of U.S. projects reveal systemic challenges, including average cost overruns of 32% against initial agency estimates and persistent ridership shortfalls relative to projections, underscoring debates over economic viability amid high capital expenses often exceeding $80 million per mile in recent decades.[4][5]
Definition and Terminology
Core Characteristics and Distinctions
Light rail transit (LRT) operates electrically powered vehicles, typically single cars or short trains of two to three cars, on fixed rails within urban or suburban settings, serving as a medium-capacity public transport mode between buses and heavy rail metros. Vehicles draw power from overhead catenary wires via pantographs or trolley poles, with axle loads generally under 12 tons per axle, enabling lighter infrastructure than heavy rail systems that require robust tracks for higher weights. Average speeds range from 12 to 20 miles per hour (19 to 32 km/h) in mixed-traffic segments but can reach 50 to 65 mph (80 to 105 km/h) on dedicated rights-of-way, with stop spacings of 0.5 to 1 mile (0.8 to 1.6 km).[3] Core to LRT is a hybrid right-of-way configuration: partially grade-separated or semi-exclusive tracks for much of the route to prioritize transit over automobiles, interspersed with street-level running and at-grade crossings that demand traffic signal priority for efficiency. This contrasts with heavy rail metros, which feature fully grade-separated, enclosed infrastructure supporting peak-hour capacities of 30,000 to 50,000 passengers per hour per direction (pphpd) via longer trains and high-frequency operations without road interactions. LRT capacities typically fall between 8,000 and 20,000 pphpd, reflecting shorter consists and occasional street sharing that limits throughput compared to heavy rail's signal-block systems optimized for dense, rapid movements.[1][6][7] Distinctions from streetcars (or trams) lie in operational scope and performance: while streetcars emphasize short-haul circulation in dense urban cores with near-continuous street running and speeds averaging 5 to 10 mph (8 to 16 km/h), light rail extends to regional connectors with greater dedicated alignment—often 70% or more exclusive—to achieve higher reliability and patronage. Streetcars prioritize accessibility and low-speed integration with pedestrians and cyclists, whereas LRT vehicles, though derived from tram designs, incorporate advanced suspension for smoother rides on varied alignments and support multi-door boarding for dwell times under 30 seconds. This positions LRT as a scalable upgrade over buses or bus rapid transit, offering rail's permanence and passenger appeal without heavy rail's prohibitive costs, estimated at $100 to $200 million per mile versus $300 million or more for subways.[8][9]Regional Variations in Definition
In North America, particularly the United States and Canada, light rail transit (LRT) is defined by the American Public Transportation Association (APTA) as an electric railway system operating lightweight passenger vehicles singly or in short trains (typically 1-3 cars) on fixed rails, with rights-of-way that are partially or fully grade-separated from street traffic for much of the route to enable higher speeds (up to 80 km/h or 50 mph in urban sections and higher on dedicated alignments). This distinguishes it from traditional streetcars, which prioritize street-level operation without significant separation, and from heavy rail subways, which feature full grade separation, higher capacity (often 4+ cars), and platform screen doors. The term "light rail" emerged in the early 1970s to describe revived rail systems offering intermediate capacity—between buses and subways—for urban and suburban corridors, as seen in early implementations like San Diego's Trolley (opened 1981) and Calgary's C-Train (opened 1978), which emphasized cost efficiency over full rapid transit infrastructure.[1] In Europe, definitions of light rail vary more fluidly and often overlap with "tramway" or "Stadtbahn" (city rail) systems, lacking the strict North American emphasis on partial grade separation for speed; instead, the International Union of Public Transport (UITP) classifies light rail transit broadly as electrically powered vehicles on rail-guided tracks that operate partly in shared street space (line-of-sight driving) and partly on semi-dedicated rights-of-way, prioritizing urban flexibility, frequent stops, and integration with pedestrian areas over high throughput. For instance, systems like Germany's Stadtbahn networks (e.g., in Karlsruhe, operational since 1957) incorporate subway-like tunnels and exclusive tracks alongside street running, achieving metro-level capacities (up to 20,000 passengers per hour per direction) while retaining lighter infrastructure than full heavy rail. Traditional trams in cities like Vienna or Amsterdam, with fully street-integrated operations and low-floor vehicles, are frequently subsumed under light rail terminology by UITP, though some national regulators distinguish based on signaling and priority measures rather than separation. This broader application reflects Europe's denser urban fabrics and historical tram legacies, where upgrades like transit signal priority enable reliable service without full segregation.[10][11] In Australia and the United Kingdom, light rail typically denotes modernized systems with enhanced infrastructure—such as segregated alignments, off-board ticketing, and higher-capacity vehicles (e.g., 200-300 passengers per car)—to differentiate from heritage or tourist-oriented trams that remain predominantly street-bound. The UK's Light Rail Transit Association aligns with UITP's flexible urban rail framing but highlights regulatory criteria like dedicated corridors for speeds exceeding 40 km/h, as in Manchester Metrolink (opened 1992), which converted heavy rail tracks for light vehicles. Australian examples, including Sydney's L1 Dulwich Hill Line (opened 2014), emphasize partial grade separation and integration with bus rapid transit, reflecting a hybrid model influenced by North American designs but adapted to sprawling suburbs. In contrast, New Zealand's systems, such as Auckland's current proposals, lean toward European-style trams due to compact city centers.[12][13] Asia and other regions exhibit further divergence, often adopting UITP-inspired definitions tailored to local contexts; for example, Japan's "light rail" equivalents like Kobe's Port Liner (opened 1966) feature fully grade-separated guideway transit with rubber-tired vehicles, blurring into automated people movers, while China's systems (e.g., Changchun's Line 3, opened 2006) prioritize high-frequency street-running trams upgraded for urban density. In Africa, Tunis's light rail (opened 1985) pioneered the mode as a semi-separated network serving 50,000 daily passengers, aligning with European models but constrained by infrastructure costs. These variations stem from pragmatic adaptations to topography, funding, and existing rail heritage, with global bodies like UITP advocating LRT as a scalable urban solution rather than a rigidly defined technology.[14][15]Historical Development
Origins in Streetcar Systems
The earliest streetcar systems, serving as the foundational precursor to modern light rail, emerged in the early 19th century as horse-drawn vehicles operating on embedded iron rails to provide efficient urban passenger transport superior to horse omnibuses. In the United States, the inaugural line was the New York and Harlem Railroad's Fourth Avenue Line, which commenced service on August 27, 1832, running along the Bowery and Fourth Avenue from Prince Street to 23rd Street in New York City using cars pulled by two horses each.[16] These systems quickly proliferated, with over 200 U.S. cities adopting horsecars by 1880, typically featuring cars seating 10-20 passengers and achieving speeds of 5-10 mph amid street traffic.[17] The pivotal shift toward electrification, enabling the scalability and performance characteristics echoed in light rail, occurred in the 1880s. The world's first experimental electric streetcar line opened on May 12, 1881, in Lichterfelde (now part of Berlin), Germany, utilizing overhead conductors to power converted horse carriages carrying 16 passengers each at speeds up to 9 mph.[18] In the U.S., the first commercial electric operation launched on August 10, 1885, in Baltimore, where engineer Leo Daft's system employed track-based motors to haul cars without overhead wires, though limited to short routes due to battery constraints.[19] Frank J. Sprague's breakthrough in Richmond, Virginia, on February 2, 1888, introduced practical overhead trolley wire and multiple-unit control, allowing 40 cars to operate simultaneously over 12 miles of track at 15 mph, demonstrating electric streetcars' capacity for high-volume urban service and spurring over 200 U.S. systems by 1890.[20] By the early 20th century, electric streetcars had evolved into dense networks integral to urban mobility, with U.S. systems encompassing 34,000 miles of track and peak ridership exceeding 15 billion annual passengers in 1917, often sharing streets with mixed traffic while employing lightweight vehicles and simple at-grade infrastructure.[21] This operational model—street-level running, electric overhead catenary, and bi-directional cars—directly informed light rail's core design, distinguishing it from heavier rail by prioritizing flexibility and lower construction costs over full grade separation, though early streetcars lacked the segregated alignments and higher-capacity articulated vehicles seen in later upgrades.[22] Innovations like cable propulsion, first implemented in San Francisco on August 2, 1873, offered interim solutions in hilly terrains but were largely supplanted by electric trolleys due to superior efficiency and adaptability.[20] The streetcar era's legacy persisted through mid-century vehicles like the Presidents' Conference Committee (PCC) car, introduced in 1936 with streamlined bodies, improved acceleration to 40 mph, and air-conditioning precursors, influencing postwar light rail vehicle designs by balancing street-running durability with metro-like comfort.[23] These systems' embedded tracks, signal prioritization, and demand-responsive operations established the causal framework for light rail as an intermediate-capacity transit mode, evolving via incremental enhancements rather than wholesale reinvention.[24]Mid-20th Century Decline and Initial Revival
In the United States and Canada, streetcar networks, which formed the basis of early light rail operations, underwent rapid decline from the 1940s through the 1960s, with most systems dismantled or converted to bus service. By 1940, over 1,000 electric streetcar systems operated across North America, serving urban populations efficiently but facing obsolescence as automobile ownership surged—U.S. passenger car registrations rose from 23 million in 1940 to 44 million by 1950, driven by postwar economic growth and inexpensive gasoline. Operators increasingly favored buses for their flexibility in avoiding fixed rail maintenance costs and regulatory constraints on fares and routes, which had rendered many streetcar lines unprofitable amid rising labor and infrastructure expenses.[25] Contributing factors included massive public investments in road infrastructure, such as the U.S. Interstate Highway Act of 1956, which allocated $25 billion (equivalent to over $200 billion today) for highways, accelerating suburbanization and reducing urban transit ridership by enabling car-dependent sprawl. Urban renewal programs often demolished streetcar tracks to prioritize vehicular traffic flow, exacerbating gridlock on remaining shared-street operations where streetcars competed directly with autos. By 1970, only a handful of U.S. cities retained streetcar service, such as San Francisco's cable cars and Philadelphia's Route 15, while conversions peaked in the late 1940s and 1950s. In Europe, many tram systems persisted longer due to denser urban forms and less aggressive automobilization, though some faced similar pressures and partial abandonments.[24] The initial revival of light rail emerged in the early 1970s amid the 1973 oil crisis, which spiked fuel prices and highlighted the vulnerabilities of car-centric transport, alongside growing urban congestion and environmental concerns over emissions. The U.S. Urban Mass Transportation Administration (UMTA) coined the term "light rail" in 1972 to denote modernized systems blending street-running trams with dedicated rights-of-way for higher speeds and capacity, drawing from surviving European models like Germany's Stadtbahn.[24] Federal funding through UMTA grants spurred planning, with Edmonton's light rail transit (LRT) line opening on April 22, 1978, as the first purpose-built modern LRT in North America, featuring 7.4 km of track and articulated cars capable of 80 km/h on reserved sections.[26] This was followed by the San Diego Trolley in 1981, the first U.S. new-build system, utilizing surplus streetcars initially before dedicated vehicles.[27] Early adopters emphasized cost-effectiveness over heavy rail, with per-mile construction costs around $10-20 million (in 1970s dollars), appealing to cities seeking alternatives to highways without subway expenses.[28]Modern Expansion from 1970s Onward
The modern revival of light rail systems began in the late 1970s, driven by the 1973 and 1979 oil crises, rising urban congestion, and a push for cost-effective alternatives to automobiles and heavy rail amid social movements favoring efficient public transit.[24] In North America, Edmonton, Alberta, opened the continent's first new light rail line on April 22, 1978, spanning 7.2 kilometers from downtown to Belvedere with initial ridership exceeding expectations and influencing subsequent designs.[26] [29] The San Diego Trolley followed on July 26, 1981, as the first modern light rail system in the United States, initially covering 17 kilometers and boosting local transit ridership by over 20% in its service area within the first three years.[30] [31] Expansion accelerated through the 1980s, with systems opening in Calgary (1981), Sacramento (1987), and Portland (1986), reaching nine operational networks across North America by 1990, including six in the U.S., two in Canada, and one in Mexico.[32] In Europe, influenced by German Stadtbahn concepts, new or revived tram networks emerged, such as the Tyne and Wear Metro in the UK (1980–1984) and Nantes tramway reopening in France (1985), followed by builds in Grenoble and Strasbourg.[33] [34] These developments emphasized at-grade tracks with priority signaling to balance speed and urban integration, contrasting with post-war abandonments. By the 1990s, light rail proliferated further, with over 20 new systems in North America alone since the 1980s, while Europe saw dozens more, outpacing metro construction in Western Europe.[35] Globally, light rail networks grew to handle billions of annual trips, reaching approximately 14.8 billion in 2019 before pandemic disruptions, supported by investments in vehicle technology and infrastructure upgrades.[11] This era marked light rail's shift from niche revival to a viable urban mobility option, though growth varied by region due to funding availability and policy priorities.[36]Contemporary Challenges and Extensions (1980s–2025)
The revival of light rail systems accelerated in the 1980s, particularly in North America, with pioneering projects such as San Diego's Trolley opening in 1981 and Portland's MAX line in 1986, marking a shift from streetcar-era infrastructure toward dedicated rights-of-way and higher-capacity vehicles aimed at suburban commuters and urban corridors.[26] By the 1990s and 2000s, expansions proliferated in the United States, adding systems in cities like Denver (1994), Salt Lake City (1999), and Minneapolis (2004), while Europe saw modernizations in cities such as Strasbourg (1994) and Lyon, emphasizing low-floor trams for accessibility and integration with pedestrian zones.[37] Globally, light rail extended to developing regions, including Africa's first system in Tunis (1985) and Asia's networks in cities like Kaohsiung, Taiwan (2017), often blending street-running with segregated tracks to address rapid urbanization.[38] These extensions totaled over 27 systems in the US alone by 2025, with recent additions like Seattle's Sound Transit extensions reaching Federal Way and Tacoma Dome alignments approved in 2025.[39][40] Despite these developments, light rail projects have frequently encountered substantial challenges, including chronic cost overruns that have escalated per-mile construction expenses threefold since 2000, from under $100 million to over $300 million in many urban settings.[41] For instance, Seattle's West Seattle light rail extension, a four-mile segment, ballooned to an estimated $6 billion by 2024, while Sound Transit's broader expansions faced a $20-30 billion shortfall against 2046 projections, attributed to labor costs, supply chain disruptions, and scope creep rather than mere inflation.[42][43] Ridership forecasts have similarly proven overly optimistic; US rail projects often achieve 50-70% of projected volumes, with no system fully covering operating costs through fares, necessitating ongoing subsidies that strain public budgets.[5][44] Critics, including analyses from policy institutes, argue that light rail's fixed infrastructure limits adaptability to shifting demand patterns, exacerbating issues like traffic disruptions during construction and underutilization in low-density areas, as evidenced by declines in total transit commuting in cities like Buffalo (-25%) and Portland (-20%) post-1980s implementations.[45][46] Efforts to extend light rail capabilities have included technological innovations, such as very light rail prototypes tested in Coventry, UK, in 2025 for cost-effective rural-urban links, and hybrid propulsion systems reducing emissions in European networks.[47] However, empirical reviews indicate mixed outcomes: while seven of ten US cities adding light rail since 1980 reported total transit ridership gains, these were often modest and accompanied by bus service reallocations, raising questions about net system efficiency.[37][32] By 2024, US expansions slowed to just 29 kilometers of new track, reflecting fiscal caution amid these persistent challenges, with future viability hinging on better demand forecasting and integration with buses or autonomous vehicles.[39][5]Technical Specifications
Vehicle Designs and Capacity Variants
Light rail vehicles (LRVs) primarily feature modular, articulated designs optimized for urban operations, including street-running and dedicated alignments, with bi-directional capabilities and widths typically ranging from 2.3 to 3 meters. Single-unit vehicles consist of one rigid body on two bogies, while articulated variants incorporate flexible joints over shared bogies to extend length and capacity without proportional increases in axles, enabling configurations from double to quadruple articulations. These designs balance maneuverability—often with minimum curve radii of 20-30 meters—with passenger throughput, as articulated sections allow wider interiors and more standing room.[48][49] Floor height variants significantly influence accessibility and infrastructure compatibility. High-floor LRVs maintain deck heights of 560 to 910 mm above the top of rail, facilitating higher speeds and simpler bogie mechanics on elevated or legacy systems, but necessitating stairs or high platforms for boarding, which can slow dwell times. Low-floor designs, predominant in modern systems since the 1990s, position the floor at 270 to 480 mm—or ideally 300 to 350 mm—above rail for near-level street boarding, enhancing wheelchair access and reducing step-related injuries, though they require complex wheelset arrangements that may marginally reduce axle load capacity and increase maintenance complexity. Hybrid 70% low-floor vehicles offer partial level access while retaining high-floor ends for interoperability.[50][48][51] Capacity variants scale with vehicle length and configuration, with nominal passenger loads (seated plus standing) ranging from 100 to 250 per single articulated unit, assuming one-third seated. Single cars, often 20-25 meters long, accommodate 150-200 passengers in crush load, as exemplified by Dallas Area Rapid Transit's double-ended articulated LRVs rated at 160 passengers. Multi-car trains, formed by coupling two to four units, achieve 400-700 passengers, with articulated trains providing efficient space utilization via open interiors and longitudinal seating. Low-floor models may exhibit 5-10% lower capacity than equivalent high-floor due to floor structure encroaching on underbody space, but overall system throughput benefits from faster boarding.[52][53][54]| Variant Type | Typical Length (m) | Passenger Capacity (Nominal) | Floor Height | Key Features |
|---|---|---|---|---|
| Single Unit | 15-20 | 100-150 | High or Low | Basic maneuverability, used in low-demand corridors |
| Double Articulated | 25-35 | 200-300 | Mostly Low | Shared bogies for flexibility, common in North America |
| Coupled Train (2-3 cars) | 50-75 | 400-600 | Variable | Scalable for peak hours, requires signaling for operation |
Track and Infrastructure Standards
Light rail systems predominantly employ a standard track gauge of 1,435 mm (4 ft 8½ in), aligning with mainline railroads to facilitate potential interoperability and vehicle procurement efficiencies, though some legacy or regional systems use meter gauge (1,000 mm) or narrower variants.[56] Wheel gauges are typically set at 1,421 mm to 1,428 mm (56 to 56.25 in), measured 15 mm below the rail top, ensuring compatibility with transit-specific wheel profiles that differ from freight standards by accommodating tighter curves and lighter axle loads.[56] Rail sections in light rail are commonly the 115 RE profile, weighing approximately 57 kg/m, with continuous welded rail (CWR) as the preferred configuration to minimize joints and vibrations in urban environments.[57] Track construction varies by right-of-way: ballasted tracks, used in dedicated alignments, feature timber or concrete crossties spaced at 559–610 mm (22–24 in) with ballast moduli of 13.8–55.3 N/mm² (2,000–8,000 psi) for flexibility under moderate speeds up to 80 km/h; direct fixation tracks mount rails to concrete slabs via elastomeric pads, achieving higher moduli of 23.1–69.2 N/mm² (3,333–10,000 psi) for stability in semi-exclusive corridors; embedded tracks, prevalent in street-running segments, encase rails in concrete slabs at least 300 mm thick with insulating materials (resistivity ≥10¹² ohm-cm) to mitigate stray currents from DC electrification.[56][57] These designs contrast with heavy rail's predominantly ballasted, higher-modulus structures optimized for freight loads exceeding 20 tonnes per axle, as light rail axle loads rarely surpass 10 tonnes, enabling lighter subgrades with pressures limited to 0.14 MPa (20 psi).[56] Special trackwork, including switches and crossings, adheres to AREMA standards with No. 6 to No. 10 turnout numbers for urban radii down to 30 m, featuring flangeways of 35–50 mm (1.375–2 in) and precurved CWR for curves under 120 m.[57] Geometry tolerances include ±3 mm for gauge and alignment, with automated inspections (e.g., ultrasonic for flaws) conducted annually per APTA guidelines, supplemented by monthly manual checks on turnouts.[56][58] CWR installation requires documented procedures for neutral temperature adjustment and buckling prevention, influenced by FRA rules but adapted for light rail's lower speeds (typically 45–80 km/h).[58] Electrification infrastructure standards emphasize overhead contact systems (OCS) for DC supplies at 600–750 V, with IEEE P3535 guiding catenary construction for pantograph compatibility, including contact wire heights of 4.7 m nominally and minimums of 4.1 m under obstructions.[59] APTA protocols mandate inspection and maintenance of OCS components to ensure reliability in mixed-traffic settings.[60] Signaling and control systems follow APTA RT-OP-S-006 for fixed-block operations with automatic train stop (ATS), increasingly incorporating communications-based train control (CBTC) for headways under 90 seconds, while grade crossings integrate MUTCD-compliant active warnings like gates and signals synchronized with highway traffic controls.[61][62] These elements prioritize fail-safe interlocking over heavy rail's centralized dispatching, reflecting light rail's emphasis on at-grade integration and lower collision risks from reduced mass and speeds.[63]Propulsion and Power Delivery Methods
Light rail systems primarily utilize electric propulsion, where vehicles are equipped with AC or DC traction motors—often asynchronous induction or permanent magnet synchronous types—coupled to the axles via gearboxes, enabling efficient acceleration and regenerative braking that returns energy to the power supply. These motors are controlled by variable-frequency drives and inverters employing insulated-gate bipolar transistors (IGBTs) to convert incoming power into suitable forms for propulsion, achieving typical power outputs of 200-600 kW per bogie depending on vehicle class.[64] The dominant power delivery method involves overhead catenary wires supplying direct current at 600-750 V, collected via pantographs on higher-speed, segregated alignments or spring-loaded trolley poles in street-level operations to maintain contact amid curves and obstructions. This configuration supports operational speeds up to 80 km/h while minimizing infrastructure height in urban settings, with catenary systems requiring periodic maintenance for wire wear and tension adjustments.[65][66] Third-rail electrification, typically at 750 V DC, is employed in select grade-separated light rail segments to avoid visual clutter from overhead wires, as seen in enclosed tunnels or viaducts where safety risks from exposed conductors are mitigated by barriers and low platforms; however, its use remains limited in street-running light rail due to hazards from pedestrian and vehicular interaction.[66] Catenary-free alternatives, such as ground-level power supply via segmented third rails or conductive strips activated only under the vehicle, have been implemented in systems like Alstom's Alimentation Par le Sol (APS) since 2003 in Rouen, France, reducing visual impact and maintenance while achieving 99% uptime through inductive fault detection.[67][68] Emerging hybrid approaches integrate onboard batteries or supercapacitors—charged via overhead lines or inductive pads—for short off-wire runs, such as crossings or heritage zones, extending operational flexibility without full diesel reliance; prototypes have demonstrated ranges of 5-10 km on stored energy alone, though widespread adoption awaits cost reductions in lithium-ion densities exceeding 200 Wh/kg.[69]Operational Comparisons
To Heavy Rail and Full Metro Systems
Heavy rail systems, also known as rapid transit or full metro systems, differ fundamentally from light rail in infrastructure, operational capacity, and intended use cases, primarily serving high-density urban corridors with dedicated rights-of-way. Heavy rail features fully grade-separated tracks—typically underground or elevated—to eliminate conflicts with vehicular and pedestrian traffic, enabling consistent high speeds and frequencies. In contrast, light rail often incorporates at-grade street-running segments, priority signals at intersections, or semi-separated alignments, which integrate more seamlessly with urban fabric but introduce delays from traffic interactions and level crossings. This distinction stems from heavy rail's design for maximum throughput in core cities, where demand exceeds light rail's capabilities, as evidenced by systems like New York City's subway handling peak loads far beyond typical light rail lines.[70][71] Capacity metrics highlight heavy rail's superiority for mass movement: a single heavy rail train can accommodate 600 to 2,400 passengers during rush hours, with line capacities reaching 30,000 to 72,000 passengers per hour per direction (pphpd) through longer consists (6-10 cars) and headways as low as 90 seconds. Light rail trains, limited to 1-4 articulated cars with 100-200 seats plus standees, achieve peak capacities of 12,000-27,000 pphpd under optimal conditions, but real-world street operations often reduce this due to longer dwell times and infrequent service. For instance, the Transit Capacity and Quality of Service Manual notes that light rail's platform length constraints and slower acceleration cap effective throughput, making it unsuitable for corridors exceeding 20,000 pphpd without upgrades akin to heavy rail. Heavy rail's electric multiple-unit vehicles also support higher acceleration (up to 3 mphps) compared to light rail's 2-2.5 mphps, further boosting efficiency in dense networks.[71][72][73] Operational speeds reinforce these divides: heavy rail averages 24-35 mph with top speeds of 55-65 mph between stations, benefiting from signal prioritization and no street interference, as seen in Los Angeles Metro's Red Line. Light rail averages 10-30 mph, frequently dipping below 20 mph in mixed-traffic zones due to stops every 0.5-1 mile and signal delays, limiting its role to shorter, feeder routes rather than spine lines. Infrastructure demands amplify this: heavy rail requires robust third-rail power (600-750V DC), concrete ties, and extensive tunneling or viaducts, contrasting light rail's overhead catenary (750V AC), lighter rails (60-115 lb/yd), and simpler at-grade construction.[74][3] Capital costs reflect the scale: light rail construction averages $20-150 million per mile, leveraging existing streets and minimal earthworks, while heavy rail or subway extensions range from $100 million to over $2 billion per mile due to excavation, ventilation, and station complexity—New York's Second Avenue Subway Phase 1 cost $2.6 billion per mile in 2017 dollars. Operating costs per passenger-mile favor heavy rail at scale, with light rail's lower upfront investment offset by higher subsidies per rider (e.g., 27% fare recovery vs. 60% for heavy rail) from reduced economies in sparse service. However, heavy rail's disruption during construction and inflexibility for retrofits make light rail preferable for medium-demand suburbs or revitalizing low-density areas.[75][76][71] Safety profiles diverge causally from grade separation: heavy rail's enclosed environment yields fatality rates under 0.1 per billion passenger-miles, primarily from platform incidents, per National Transit Database aggregates. Light rail's street exposure elevates collision risks—vehicle incursions account for most incidents—with U.S. systems reporting 5-10 times higher trespasser and auto-related fatalities than metros, as analyzed in comparative studies. Empirical data from the American Public Transportation Association underscores that while light rail's lighter vehicles reduce injury severity in crashes, its at-grade operations inherently amplify external hazards, necessitating costly mitigations like barriers absent in heavy rail.[77][76]To Bus Rapid Transit and Conventional Buses
Light rail transit (LRT) systems generally exhibit higher passenger capacities than bus rapid transit (BRT), with typical LRT vehicles carrying 100–200 passengers per unit and the ability to operate in multi-car consists, whereas BRT buses average 50–100 passengers and rely on high-frequency operations for scale.[78] This structural advantage enables LRT to handle peak loads more efficiently in dense urban corridors, where empirical data from 101 routes across Australia, Europe, and North America indicate average ridership on LRT routes exceeds that of BRT by factors tied to service density and land-use integration.[79] However, BRT achieves comparable operational speeds—often 20–30 km/h in dedicated alignments—through off-board fare collection, priority signaling, and overtaking lanes, sometimes outperforming street-level LRT delayed by mixed traffic.[80] Capital costs for LRT infrastructure, including tracks and stations, range from $20–100 million per kilometer depending on urban density and grade separation, substantially exceeding BRT's $5–30 million per kilometer due to rail-specific requirements like embedded tracks and overhead catenary.[81] Operating costs per passenger-kilometer favor LRT in high-ridership scenarios, as rail's energy efficiency and lower maintenance per passenger (driven by electric propulsion versus diesel/hybrid buses) yield long-term savings, though BRT's flexibility allows rapid deployment and route adjustments without fixed infrastructure constraints.[82] Studies controlling for right-of-way dedication show LRT attracting 34–43% higher ridership than equivalent bus services, attributable to perceived permanence, smoother rides, and capacity signaling that influences mode choice, though BRT implementations like Bogotá's TransMilenio demonstrate scalability in sprawling contexts with lower upfront investment.[82][83] Compared to conventional buses operating in mixed traffic, LRT provides superior reliability through dedicated or semi-dedicated rights-of-way, minimizing delays from congestion and yielding consistent travel times; for instance, LRT headways can sustain 2–5 minutes in peaks without bunching common to bus fleets affected by stochastic traffic signals and driver variability.[84] Conventional buses incur higher per-vehicle wear on shared roadways and emit more localized pollutants from frequent stops and idling, whereas LRT's electric systems reduce operational emissions by 50–70% per passenger-mile in electrified networks.[81] Despite these edges, buses offer greater route flexibility for serving low-density suburbs or temporary disruptions, with deployment costs under $1 million per kilometer for basic enhancements like queue jumpers, enabling incremental upgrades absent in rail's fixed geometry.[85] Empirical reviews of 86 global systems confirm LRT's effectiveness in inducing transit ridership growth—up to 20–50% post-implementation—outpacing conventional bus upgrades, which often yield marginal gains without dedicated infrastructure.[86]To Automobile and Road-Based Traffic
Light rail systems typically achieve higher passenger throughput than equivalent road space dedicated to automobiles in urban corridors. A single light rail track can accommodate trains carrying 100 to 200 passengers each at headways of 3 to 10 minutes, yielding 600 to 2,400 passengers per hour per direction (pphpd), surpassing the effective capacity of a mixed-traffic lane, which handles about 1,500 to 1,800 vehicles per hour at 1.2 to 1.5 occupants per vehicle, or roughly 1,800 to 2,700 people pphpd under uncongested conditions.[3][87] In congested urban settings, automobile lane capacity drops further due to stop-and-go traffic, while light rail on dedicated or priority tracks maintains consistent speeds of 20 to 50 mph.[87] Empirical evidence on light rail's effect on road congestion is mixed, with some substitution of auto trips but limited net reduction due to induced demand and trip diversion. A study of the Los Angeles Expo Line found increased transit ridership but negligible impact on parallel road volumes or speeds post-opening in 2012.[88] Conversely, cross-city analyses indicate that expanding rail mileage correlates with lower congestion costs and travel times for remaining auto users, as rail absorbs 10 to 30 percent of parallel corridor demand in mid-sized European cities.[89][90] However, induced demand—where reduced congestion encourages more driving—and land-use changes near stations can offset gains, with overall vehicle miles traveled (VMT) often unchanged or slightly increased.[91] Light rail generally offers greater travel time reliability than automobiles in dense areas, immune to road traffic variability on dedicated rights-of-way. Urban light rail achieves average speeds of 15 to 25 mph including stops, comparable to or exceeding peak-hour car speeds in congested cities, with variance under 10 percent versus 20 to 50 percent for autos.[87] Automobiles provide superior point-to-point flexibility and last-mile convenience, but light rail avoids delays from incidents affecting single lanes, making it more predictable for corridor-based commutes.[92] Safety metrics favor light rail over automobiles on a per-passenger-mile basis. Rail transit fatality rates are approximately 18 times lower than for passenger cars, with light rail systems recording 0.1 to 0.5 fatalities per billion passenger-miles compared to 7.3 for autos in the U.S. from 2000 to 2020.[93][94] Street-running segments elevate collision risks with vehicles and pedestrians, contributing to 117 deaths in 2,316 U.S. incidents from 2015 to 2023, though these represent a small fraction of total system travel.[95] Automobiles dominate transportation fatalities, accounting for over 90 percent of U.S. road deaths annually.[96] Land-use efficiency strongly advantages light rail, requiring less space per passenger than roads and parking. A light rail corridor occupies a fraction of the width needed for equivalent auto throughput, while urban parking demands 5 to 10 square meters per vehicle daily, totaling billions of square meters wasted nationwide versus compact rail stations.[97] Transit-oriented development around light rail reduces household vehicle ownership by 20 to 60 percent and driving by 20 to 40 percent, freeing land for productive uses compared to sprawling auto-dependent infrastructure.[97]Economic Analysis
Capital and Lifecycle Costs
Capital costs for light rail systems include expenses for right-of-way acquisition, track infrastructure, electrification, stations, vehicles, signaling, and integration with existing urban environments. In the United States, these costs typically range from $100 million to $400 million per mile for contemporary projects, influenced by factors such as at-grade versus elevated or tunneled alignments, land costs, and regulatory compliance. For example, an analysis of 14 ongoing U.S. light rail projects indicates an average of $202 million per mile, with outliers like Seattle's light rail extensions exceeding $420 million per mile due to subsurface construction and environmental mitigation requirements.[98][82] Globally, costs are often lower; a comparative database of urban rail projects shows weighted averages around $238 million per kilometer (approximately $383 million per mile), though light rail-specific at-grade systems in Europe and Asia frequently fall below $100 million per kilometer through streamlined permitting and modular construction.[99] Lifecycle costs extend beyond initial capital outlays to encompass operations, maintenance, rehabilitation, and eventual replacement over a typical 30- to 50-year horizon, often totaling 1.5 to 2.5 times the capital investment. Maintenance expenses for light rail, including track resurfacing, vehicle overhauls, and power system upgrades, average $0.50 to $1.50 per vehicle-mile annually, driven by wear from frequent stops and urban debris. Federal analyses highlight that U.S. projects frequently experience 20-50% cost escalations during construction due to scope changes and delays, inflating lifecycle burdens; for instance, GAO reviews of rail projects over $300 million in capital found consistent overruns from underestimated utility relocations and labor-intensive installation.[100][101] Operating costs per passenger-mile for light rail range from $0.50 to $2.00, higher than bus systems but lower than heavy rail, though total lifecycle efficiency depends on ridership volumes that often fall short of projections.[102]| Cost Component | Typical U.S. Range (per mile, undiscounted) | Key Drivers |
|---|---|---|
| Capital (Construction) | $100M–$400M | Urban density, tunneling, stations |
| Annual Maintenance | $1M–$5M | Track/vehicle wear, electrification |
| Lifecycle Total (30 years) | $300M–$1B+ | Overruns, rehab cycles, inflation |
Revenue, Ridership, and Subsidy Dependencies
Light rail systems derive the majority of their operational revenue from passenger fares, though these typically cover only 25% to 30% of operating expenses in the United States, with the remainder funded by local, state, and federal subsidies including sales taxes, property levies, and federal grants.[105] [105] No U.S. light rail system achieves full cost recovery through fares alone, as operating costs—encompassing labor, maintenance, and energy—exceed fare revenues due to factors such as low density in many served corridors and competition from automobiles.[105] [106] U.S. light rail ridership reached approximately 200 million unlinked passenger trips in 2019 prior to the COVID-19 pandemic, recovering to about 51% above 2020 lows by 2023 but remaining below pre-pandemic peaks amid persistent remote work trends and urban dispersal.[107] [108] Average daily ridership per system varies widely, with high performers like Portland's MAX exceeding 100,000 trips on peak days, yet many newer extensions in mid-sized cities report 20-50% below initial projections, amplifying per-passenger subsidy needs.[107] [82] Operating subsidies per unlinked trip for light rail averaged around $2-3 in recent years, higher than for buses due to elevated capital amortization and staffing ratios, with total costs per passenger-mile reaching $1.34 compared to $0.83 for heavy rail.[77] [109][110] In Europe, farebox recovery ratios for light rail-integrated networks can reach 60% or higher in dense urban areas like Hannover, Germany, where system upgrades boosted overall transit recovery from 45% to 63% by 1995 through efficiency gains and modal shifts.[111] [111] However, broader continental averages remain subsidized, often at 30-50%, reliant on national or regional funding amid varying densities; for instance, Paris region's tram and metro combined recovery stood at 30% in 2014, underscoring ongoing fiscal dependencies despite higher ridership densities than in North America.[112] [113] Globally, light rail's subsidy dependence stems from its intermediate capacity—insufficient for heavy rail economies of scale in low-demand settings—resulting in operating cost recovery rarely exceeding fares without public support, as evidenced by consistent deficits across modes in national transit databases.[114] [115]Broader Economic Impacts and Value Capture
Light rail investments generate direct economic effects through construction employment and materials procurement, indirect effects via supplier chains and induced effects from increased regional spending by workers and riders. These impacts are typically analyzed using input-output models or econometric methods, which estimate multipliers such as 1.5-2.0 for every dollar spent on transit construction translating to broader economic output, though such figures often conflate short-term construction booms with long-term operations.[116] Permanent operational jobs number in the hundreds per system but require ongoing subsidies averaging $1-2 per passenger trip in U.S. light rail networks, limiting net fiscal contributions.[117] Empirical studies document localized benefits, including property value increases of 15-25% within 0.5 miles of stations, as seen in Dallas where values near light rail rose 25% more than in comparable non-served areas, spurring $4.26 billion in development since 1999.[118] Neighborhood employment rates near stations can rise by up to 12.3 percentage points, with median incomes increasing 17.7%, driven by improved accessibility and agglomeration effects.[119] However, these gains often reflect redistribution rather than net creation, with metro-wide employment declining 0.56% per 10 stations due to rent hikes displacing low-skilled workers to peripheral areas, reducing overall labor participation for lower-income groups by 1.01 percentage points.[119] Critics highlight that broader economic claims, such as congestion relief or job growth, frequently fail cost-benefit tests, with U.S. light rail capital costs of $25-115 million per mile yielding ridership under 1,500 passengers per mile daily in most systems—far below thresholds for positive returns compared to bus alternatives.[117] Analyses of systems like Portland's reveal development concentrations but no evidence of sustained regional GDP uplift beyond what targeted zoning reforms could achieve at lower cost, with benefits tapering rapidly beyond station vicinities and vulnerable to omitted variables like concurrent urban policies.[116] Value capture refers to strategies harnessing land value uplifts from light rail to recoup project costs, primarily through tax increment financing (TIF), special assessment districts, or joint development agreements where developers pay for air rights or contributions in exchange for density bonuses.[118] These mechanisms operate by designating districts where incremental property tax revenues above a baseline fund bonds or improvements, theoretically aligning public investment with private gains from enhanced transit access. Effectiveness varies, capturing 10-30% of uplifts in successful cases but often insufficient for full capital recovery due to political resistance to levies and uneven value realization.[118] In Portland, Oregon, light rail prompted $1.9 billion in station-area development since 1986, enabling a local improvement district to raise $1.5 million via assessments for extensions.[118] Similarly, Hudson-Bergen Light Rail in New Jersey generated $5.3 billion in nearby investment by 2005 through TIF and developer exactions, though such outcomes depend on pre-existing density and zoning flexibility, with lower-yield systems in sprawling U.S. cities recovering under 20% of costs this way.[118] Limitations include anticipation effects inflating pre-construction values and challenges in attributing uplifts solely to rail amid confounding factors like market cycles.[116]Societal Impacts
Safety Records and Risk Factors
Light rail systems demonstrate fatality rates per passenger-mile that are substantially lower than those for personal automobiles, with estimates indicating light rail travel is approximately 30 times safer than driving.[120] Overall, rail modes, including light rail, exhibit death rates far below those of light-duty vehicles, which account for the majority of transportation fatalities, while bus and rail travel present comparatively lower risks per passenger exposure.[96] Passenger death rates for automobiles exceed those for trains by a factor of 17 and for buses by 50, underscoring transit's relative safety advantage despite light rail's urban-street integration.[121] However, light rail's safety profile is less favorable than heavy rail's due to frequent at-grade operations, resulting in elevated collision risks with vehicles and pedestrians compared to grade-separated metros.[122] Federal Transit Administration data from 2020 to 2022 document 214 collisions between light rail vehicles and passenger-occupied vehicles, alongside 64 rail-to-person incidents, predominantly at grade crossings in street-running segments.[123] Fatality and injury rates for light rail, when measured per 100 million vehicle revenue miles, reflect these exposures, though absolute fatalities remain infrequent relative to exposure volumes.[124] Primary risk factors stem from shared infrastructure: grade-level crossings amplify collision probabilities, with pedestrian and bicyclist strikes comprising up to 42% of light rail fatalities in analyzed urban systems, often involving at-grade paths or trespassing.[125] Nearly half of pedestrian-light rail vehicle collisions occur at crossings, exacerbated by underestimation of train speeds, signal non-compliance, and urban density, while vehicle incursions account for another 34% of deadly events.[126] Street-running configurations heighten these vulnerabilities, as light rail vehicles require longer stopping distances—up to 600 feet at operational speeds—versus automobiles' 200 feet, increasing impact severity in mixed traffic.[127] Compared to buses, light rail's fixed routes in roadways may elevate per-mile incident rates for external collisions, though passenger injury rates remain lower overall than in automobiles.[93] Mitigation relies on enhanced barriers, signals, and enforcement, as inconsistent application correlates with persistent pedestrian risks at crossings.[128]Urban Development and Accessibility Effects
Light rail systems have been associated with localized increases in urban density and property values near stations, though these effects are often confined to within 500 meters and depend on pre-existing land use policies and market conditions. In Portland, Oregon, analysis of the first ten years of the MAX light rail system showed positive impacts on single-family property values and transit ridership, alongside slower growth in vehicle miles traveled, but these outcomes were enhanced by complementary zoning reforms promoting transit-oriented development (TOD). Similarly, Houston's METRORail line demonstrated significant net positive effects on residential property values, with modeling indicating spillover benefits in non-zoned contexts where commercial development spiked along corridors from 2005 to 2014. However, light rail is not a primary driver of broader land use change; empirical reviews emphasize it functions as a tool to guide rather than initiate growth, requiring receptive local conditions such as upzoning or value capture mechanisms to materialize measurable impacts.[129][130][131][132] Critics argue that anticipated development benefits are frequently overestimated, with studies revealing limited spillover beyond station areas and potential exacerbation of inequities through gentrification in lower-income neighborhoods. For instance, while TOD near light rail can elevate apartment property values tied to nearby activity opportunities, this premium diminishes with distance and may not offset system-wide subsidies or opportunity costs for alternative infrastructure. In Denver, proximity to light rail generally boosts values, but variability arises from station-specific factors like noise or overdevelopment risks, underscoring that rezoning alone can sometimes reduce values without transit integration. Peer-reviewed assessments highlight that positive land-value effects are inconsistent across systems, often requiring public interventions like tax increment financing to amplify private investment, and fail to reverse urban sprawl patterns in auto-dependent regions.[133][134][135][105] On accessibility, light rail enhances connectivity for non-drivers along fixed corridors, particularly benefiting low-wage workers by expanding reachable job opportunities within 30-minute travel windows. In the Twin Cities, post-implementation data indicated a 14,000-job increase in accessible low-wage positions near light rail stations during peak hours, compared to 4,000 in broader areas, alongside statistically significant associations with direct bus-rail connections. Cities introducing rail systems experience modest reductions in average congestion (7%), travel time (1%), and pollution (3%), attributable to mode shifts in dense urban segments. Nonetheless, evidence for systemic improvements remains limited; rail rarely alleviates overall traffic congestion or substantially alters labor market access in sprawling metros, as gains are offset by induced demand and competition from automobiles. Network and station accessibility metrics show peak-hour ridership boosts from better integration, but off-peak benefits are negligible without demand management.[136][137][138][105][139]Environmental and Health Outcomes
Light rail systems can contribute to reduced greenhouse gas emissions by displacing personal vehicle trips, with households within 0.5 miles of stations in Los Angeles exhibiting 27% lower motor vehicle CO₂ emissions compared to those farther away following the Expo Line's opening in 2012.[140] [141] Lifecycle analyses indicate operational emissions are low due to electric propulsion, averaging 13.90 grams of CO₂ per passenger-kilometer across full system lifecycles, though non-operational phases like construction dominate totals.[142] Infrastructure accounts for approximately 50% of total CO₂-equivalent emissions in assessed systems, driven by concrete and steel production.[143] However, net environmental benefits hinge on ridership levels and grid decarbonization; low-occupancy operations may yield higher per-passenger emissions than efficient buses, and induced urban densification can increase overall regional energy use if not offset by mode shift.[144] Tramway construction disrupts local ecosystems, with studies documenting biodiversity loss from habitat fragmentation and barriers to wildlife movement along tracks.[145] Cities adopting light rail report 3% lower ambient pollution levels on average versus non-rail peers, but these gains are modest without substantial car trip diversion.[138] On health fronts, light rail correlates with improved air quality near high-traffic corridors by reducing vehicle exhaust, potentially lowering stroke mortality in adjacent populations through decreased particulate matter exposure.[146] Proximity to stations encourages walking, modestly boosting physical activity and associated cardiovascular benefits, though quantifiable reductions in obesity rates remain unproven in causal studies.[147] Conversely, rail noise—often exceeding 60 dBA at platforms—elevates risks for metabolic disorders and sleep disturbance, with railway exposure linked to higher cardiovascular strain independent of air pollution.[148] Freeway-adjacent light rail stations expose users to particle concentrations up to 35,100 per cm³ and noise levels of 83 dBA, compounding urban health burdens.[149] Overall, health outcomes favor pollution-sensitive groups only if ridership displaces dirtier transport modes effectively, a condition unmet in underutilized networks.Debates and Criticisms
Efficacy Versus Alternatives
Light rail's efficacy is frequently assessed against alternatives such as bus rapid transit (BRT), automobiles, and heavy rail, using metrics like capacity, operating costs per passenger-kilometer, congestion mitigation, and adaptability to urban density. Empirical route-level analyses of North American systems reveal that light rail achieves higher average ridership than BRT for similar service levels, attributed to factors like dedicated rights-of-way and passenger comfort preferences, though BRT demonstrates greater flexibility for route adjustments and lower land acquisition costs—averaging $3.018 million per mile versus $1.52 million for light rail.[79][72] Parametric cost models further indicate BRT's operating cost advantages in low-to-medium demand scenarios, with light rail becoming more economical only above ridership thresholds where its higher capacity (up to 10,000 passengers per hour per direction) justifies fixed infrastructure investments.[150] Comparisons with automobile-based traffic highlight light rail's limited net impact on overall congestion, as public transit typically captures a small mode share (often under 5% in U.S. cities), insufficient to offset induced demand from population growth or parallel road expansions. A National Bureau of Economic Research study of U.S. urban areas found public transit expansions, including light rail, yield negligible reductions in vehicle hours traveled or speeds, with benefits confined to corridor-specific modal shifts rather than system-wide relief.[151] In contrast, the Los Angeles Expo Line showed no measurable decrease in parallel roadway traffic volumes post-opening in 2012, despite projections of significant diversion, underscoring risks of overoptimistic forecasts that ignore behavioral responses like latent car demand.[88] Mid-sized European cities provide some evidence of localized externalities reduction, such as lower emissions along served routes, but these gains are modest and context-dependent on high pre-existing densities exceeding 5,000 residents per square kilometer.[138]| Metric | Light Rail | BRT | Automobiles (per capita) |
|---|---|---|---|
| Capital Cost per Mile (USD millions, approx.) | 50–200 | 10–50 | N/A (road maintenance ~1–5) |
| Capacity (passengers/hour/direction) | 5,000–15,000 | 3,000–10,000 | Flexible, but induces sprawl |
| Congestion Impact | Corridor-specific mode shift; minimal system-wide | Similar to light rail; easier scaling | High in dense areas without pricing |
| Flexibility | Low (fixed tracks) | High (reroutable) | Highest (point-to-point) |
Planning Errors and Overestimations
Numerous empirical analyses of urban rail projects, including light rail systems, reveal systematic overestimation of ridership forecasts, with actual passenger volumes often falling short of projections by wide margins. A comprehensive review of international rail demand forecasts found that for 9 out of 10 rail projects, including light rail, passenger estimates were overstated by an average of 106%, attributing this bias partly to political incentives favoring project approval over accurate prediction.[155] Similarly, a study of urban rail transit projects compared pre-construction forecasts to post-opening performance across multiple systems, concluding that ridership predictions remained inflated without improvement over decades, as forecasters failed to account for behavioral responses like induced demand on competing modes or stagnant mode shifts from automobiles.[153] These inaccuracies persist despite methodological refinements, with light rail examples such as St. Louis's MetroLink showing actual ridership below 50% of initial estimates in early years of operation.[156] Cost projections for light rail developments frequently underestimate total expenditures, leading to overruns that exacerbate fiscal burdens on taxpayers. An analysis of 83 U.S. rail transit projects, encompassing light rail, documented average cost escalations of 40-60% against initial full funding grant agreement estimates, driven by scope creep, unforeseen geotechnical issues, and inadequate contingency planning.[157] Light rail lines specifically have exhibited per-mile construction costs rising from approximately $80 million in 2000 to $229 million by 2021, reflecting planning failures in site acquisition, utility relocations, and labor-intensive urban integrations overlooked in preliminary budgets.[158] For instance, Minneapolis's Southwest Light Rail project incurred over $1.45 billion in overruns and a 10-year delay from its 2013 baseline, partly due to deficient contract enforcement and design errors such as misplaced tracks requiring costly remediation at $141,000 per incident.[159][160] Planning errors often stem from optimistic assumptions about land use integration and external benefits, ignoring causal factors like dispersed suburban travel patterns that limit rail's capture of trips. Forecasts typically assume higher densities and transit-oriented development than materialize, as evidenced by post-implementation audits showing minimal ridership ramp-up beyond initial novelty effects.[161] In the case of Maryland's Purple Line, projections overestimated daily boardings by factors leading to persistent operating subsidies, compounded by underestimated maintenance demands on at-grade infrastructure vulnerable to weather and vandalism.[162] Such discrepancies highlight a reliance on reference class forecasting deficiencies, where planners disregard historical data on similar projects' underperformance, perpetuating cycles of fiscal strain without corresponding mobility gains.[163]Political Influences and Opportunity Costs
Political decisions favoring light rail often prioritize visible infrastructure for electoral gain over evidence-based transport efficiency, as rail projects enable ribbon-cutting ceremonies and promises of urban revitalization that appeal to voters in growing cities. Elected officials, such as former Charlotte mayor Pat McCrory, have championed light rail expansions since the late 1990s to symbolize progress and attract development, even when bus alternatives could achieve similar mobility at lower cost.[164] This preference stems from the tangible prestige of fixed-rail systems, which outperform incremental bus upgrades in political optics, despite studies showing light rail's marginal ridership gains rarely justify the expense.[165] Partisan dynamics further shape light rail outcomes, with urban Democrats typically advocating expansions for density-promoting ideology, while rural-leaning Republicans oppose them amid broader resistance to transit subsidies that divert funds from highways serving wider populations. In Austin, Texas, a $7 billion light rail initiative advanced in 2025 despite state-level Republican skepticism and potential federal funding risks under shifting administrations, illustrating how local coalitions push projects forward amid partisan gridlock.[166] Such influences extend to route selections and technology choices, where partisan bargaining can override cost-benefit analyses, as seen in international cases like Brazil's urban rail modifications tied to electoral cycles.[167][168] Critics from libertarian think tanks argue this fosters cronyism, with light rail's high construction costs—often exceeding $100 million per mile—serving to reward unions and contractors aligned with proponents, rather than addressing actual demand.[169] The opportunity costs of light rail investments manifest in foregone alternatives like highway maintenance or bus rapid transit (BRT), which empirical analyses indicate deliver higher returns per dollar in low-density U.S. contexts. For instance, federal transit subsidies since the 1970s have skewed local priorities toward rail, distorting investments away from roads that transport 80-90% of urban trips, leading to deferred repairs estimated at $420 billion nationwide by 2021.[170] Light rail's capital intensity—averaging $4-6 million per mile in older systems but ballooning to $200-400 million in modern urban builds—diverts funds from scalable bus options, where BRT can match capacities at 20-50% of the cost without grade separations or eminent domain battles.[171][105] In Seattle, the West Seattle and Ballard extensions escalated from $3.5 billion in 2016 voter approval to over $30 billion by 2025, exemplifying how political commitments lock in escalating expenses, potentially yielding negative net present value when benchmarked against unbuilt BRT or road widenings.[172] These costs compound through ongoing subsidies, with U.S. transit operating deficits covered by taxpayers at rates exceeding $1 per rider-mile for light rail, compared to near-breakeven for automobiles after fuel taxes.[115] Allocating equivalent funds to demand-responsive buses or congestion pricing could reduce travel times more effectively in sprawling metros, as rail's fixed routes underperform in adapting to shifting demographics and remote work trends post-2020.[154] While proponents cite agglomeration benefits, rigorous evaluations reveal light rail's wider economic impacts often fall short of 1:1 benefit-cost ratios, underscoring the trade-off against infrastructure yielding broader productivity gains.[173]Global Systems Overview
Systems by Continent and Scale
Light rail systems exhibit significant variation in scale and prevalence across continents, reflecting historical infrastructure, urban density, and recent investment trends. Europe maintains the most mature and extensive networks, primarily evolved from 19th-century tramways adapted for modern operations with dedicated tracks and higher-capacity vehicles. Asia shows rapid expansion in new-build systems, often integrated into broader metro frameworks, while North America features discrete modern implementations focused on suburban connectors. Other regions like Australia, Africa, and South America host smaller-scale or nascent networks, with total global light rail track exceeding 27,000 km dominated by European infrastructure.[174] In Europe, light rail constitutes 58% of worldwide track length at approximately 16,000 km, supporting high ridership in dense urban cores through mixed street-running and segregated alignments.[174] Large-scale systems, often exceeding 150 km, operate in cities like those in Germany and Austria, where networks integrate with regional rail for seamless transfers; Belgium's five principal systems average 76 km each.[11] Medium-scale networks (50-150 km) prevail in France and the Netherlands, emphasizing frequency and accessibility, while smaller systems under 50 km serve historic centers or secondary cities. European dominance stems from incremental expansions rather than greenfield megaprojects, yielding empirically robust modal shares in cities with integrated fare structures. Busiest operations, measured by passenger journeys, cluster in Central and Eastern Europe, underscoring causal links between network density and usage over promotional policies.[175] North American light rail, revived since the 1970s, totals fewer systems but emphasizes grade-separated segments for reliability in sprawling metros. The U.S. alone features dozens of installations, with average vehicle lengths of 21-29 meters accommodating articulated trains for peak loads.[1] Scales range from compact urban loops under 30 km in cities like Seattle to expanded regional lines over 100 km in Calgary and Salt Lake City, where dedicated rights-of-way enable speeds up to 80 km/h. Canadian examples, such as Edmonton's network tested commercially around 1978, integrate with bus rapid transit for feeder effects, though overall ridership remains below 5% of total transit due to auto-centric land use patterns.[77] Empirical data indicate average trip distances of 8.4 km, prioritizing circumferential routes over radial spines.[77] Asia's light rail development accelerates, outpacing Europe in new kilometers added since 2018, driven by urbanization in emerging economies.[176] Systems are typically medium-scale (20-100 km), as in Taiwan's Kaohsiung Circular Line or India's select urban extensions, often hybridized with metro standards for capacity. Southeast Asian pioneers like Manila's LRT-1, operational since 1984, span 20 km with extensions planned, serving high-density corridors but facing maintenance challenges from elevated alignments.[177] Larger ambitions in China classify many as light metro, blurring lines, yet pure light rail remains limited compared to heavy rail dominance. Expansion correlates with GDP growth and congestion relief needs, though data reveal variable ridership tied to fare affordability over infrastructure alone. In Australia and Oceania, light rail concentrates in select cities, with Melbourne's historic tram network representing the world's longest at over 250 km of mostly street-level track, facilitating 200 million annual boardings through grid-like coverage. Newer systems in Sydney (32 km since 2019) and Canberra (12 km from 2019) adopt light metro traits with off-street stations, scaling modestly to complement heavy rail. These contrast Europe's density by prioritizing tourism and inner-city links, with empirical outcomes showing higher per-km productivity in legacy networks. Africa and South America host pioneering but small-scale systems amid infrastructure gaps. Africa's first modern light rail, Addis Ababa's 34 km network opened in 2015, carries millions daily despite operational hurdles like power reliability, marking sub-Saharan entry into electric urban rail.[178] Tunisia's Tunis system, Africa's inaugural at 20 km since 1985, integrates legacy trams. In South America, Brazil's Rio de Janeiro VLT Carioca (28 km) exemplifies low-floor, bi-modal operations since 2016, enhancing pedestrian zones but limited by funding constraints. Scales remain under 50 km continent-wide, with causal factors including capital scarcity and prioritization of highways, yielding lower densities than Eurasian counterparts.[179]| Continent | Approx. Share of Global Track | Typical Scale Range | Key Characteristics |
|---|---|---|---|
| Europe | 58% (16,000 km) | Small to large (10-200+ km) | Historical trams, high integration, dense urban use[174] |
| North America | ~10-15% (est. 2,000-4,000 km) | Medium (20-100 km) | Modern revivals, suburban focus, articulated vehicles[1] |
| Asia | Growing (new km leading) | Medium (20-100 km) | Hybrid metro-LRT, rapid urbanization drivers[176] |
| Australia/Oceania | <5% | Large legacy + small new (250 km Melbourne; 10-30 km others) | Grid trams + recent light metro |
| Africa/South America | <2% | Small (<50 km) | Nascent, capacity-building pilots[178] |