_SMRT_Buses_SBS6390K_904_2025-03-17.jpg/250px-(SGP-Singapore)_SMRT_Buses_SBS6390K_904_2025-03-17.jpg "Public transport bus service")
_SMRT_Buses_SBS6390K_904_2025-03-17.jpg/2000px-(SGP-Singapore)_SMRT_Buses_SBS6390K_904_2025-03-17.jpg)
Community hub
Recent from talks
Contribute something
Nothing was collected or created yet.
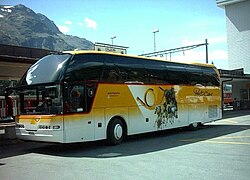
Public transport bus service
View on WikipediaThis article needs additional citations for verification. (January 2022) |
_SMRT_Buses_SBS6390K_904_2025-03-17.jpg)
_Vauxhall_Bridge_18.01.2024.jpg)
.jpg)
Public transport bus services are generally based on regular operation of transit buses along a route calling at agreed bus stops according to a published public transport timetable.
History of buses
[edit]Origins
[edit]

While there are indications of experiments with public transport in Paris as early as 1662,[1][2][3] there is evidence of a scheduled "bus route" from Market Street in Manchester to Pendleton in Salford UK, started by John Greenwood in 1824.[4]
Another claim for the first public transport system for general use originated in Nantes, France, in 1826. Stanislas Baudry, a retired army officer who had built public baths using the surplus heat from his flour mill on the city's edge, set up a short route between the center of town and his baths. The service started on the Place du Commerce, outside the hat shop of a M. Omnès, who displayed the motto Omnès Omnibus (Latin for "everything for everybody" or "all for all") on his shopfront. When Baudry discovered that passengers were just as interested in getting off at intermediate points as in patronizing his baths, he changed the route's focus. His new voiture omnibus ("carriage for all") combined the functions of the hired hackney carriage with a stagecoach that travelled a predetermined route from inn to inn, carrying passengers and mail. His omnibus had wooden benches that ran down the sides of the vehicle; passengers entered from the rear.
In 1828, Baudry went to Paris, where he founded a company under the name Entreprise générale des omnibus de Paris, while his son Edmond Baudry founded two similar companies in Bordeaux and in Lyon.[5]
A London newspaper reported on July 4, 1829, that "the new vehicle, called the omnibus, commenced running this morning from Paddington to the City", operated by George Shillibeer.
The first omnibus service in New York began in 1829, when Abraham Brower, an entrepreneur who had organized volunteer fire companies, established a route along Broadway starting at Bowling Green. Other American cities soon followed suit: Philadelphia in 1831, Boston in 1835 and Baltimore in 1844. In most cases, the city governments granted a private company—generally a small stableman already in the livery or freight-hauling business—an exclusive franchise to operate public coaches along a specified route. In return, the company agreed to maintain certain minimum levels of service.
In 1832, the New York omnibus had a rival when the first trams, or streetcars started operation along Bowery,[6] which offered the excellent improvement in amenity of riding on smooth iron rails rather than clattering over granite setts, called "Belgian blocks". The streetcars were financed by John Mason, a wealthy banker, and built by an Irish-American contractor, John Stephenson. The Fifth Avenue Coach Company introduced electric buses to Fifth Avenue in New York in 1898.
In 1831, New Yorker Washington Irving remarked of Britain's Reform Act (finally passed in 1832): "The great reform omnibus moves but slowly." Steam buses emerged in the 1830s as competition to the horse-drawn buses.
The omnibus extended the reach of the emerging cities. The walk from the former village of Paddington to the business heart of London in the City was a long one, even for a young man in good condition. The omnibus thus offered the suburbs more access to the inner city. The omnibus encouraged urbanization. Socially, the omnibus put city-dwellers, even if for only half an hour, into previously-unheard-of physical intimacy with strangers, squeezing them together knee-to-knee. Only the very poor remained excluded. A new division in urban society now came to the fore, dividing those who kept carriages from those who did not. The idea of the "carriage trade", the folk who never set foot in the streets, who had goods brought out from the shops for their appraisal, has its origins in the omnibus crush.
Motorbus
[edit]John D. Hertz founded the Yellow Coach Manufacturing Company in 1923 and then sold a majority of shares to General Motors in 1925.
From the 1920s, General Motors and others started buying up streetcar systems across the United States with a view to replacing them with buses in what became known as the Great American Streetcar Scandal.[7] This was accompanied by a continuing series of technical improvements: pneumatic "balloon" tires during the early 1920s, monocoque body construction in 1931, automatic transmission in 1936, diesel engines in 1936, 50+ passengers in 1948, and air suspension in 1953.[8]
The arrest of Rosa Parks in 1955 for not giving up her seat to a white man on a public bus is considered one of the catalysts of the Civil Rights Movement within the United States.
Types of services
[edit]The names of different types of bus services vary according to local tradition or marketing, although services can be classified into basic types based on route length, frequency, the purpose of use and type of bus used.
Urban transport or regional
[edit]
- Transit bus is the most common type of public transport bus service and is used to transport large numbers of people in urban areas, or to and from the suburbs to population centres. These buses normally run on fixed routes within an urban area.
- Park and ride bus services are designed to provide an onward passenger journey from a parking lot. These may be branded as shuttle or express services, or part of the standard bus network.
- Share taxi bus services are designed to run as flexible high capacity vehicles usually using minibuses to any point of a person's wish instead of a fixed route. Most common examples of share taxis include public light buses in Hong Kong where the red topped ones act as a share taxi as opposed to green topped ones which are on fixed routes.
- Feeder bus services are designed to pick up passengers in a certain locality and take them to a transfer point where they make an onward journey on a trunk service. This can be another bus, or a rail-based service such as a tram, rapid transit or train. Feeder buses may act as part of a wider local network, or a regional coach network.
- Bus rapid transit (BRT) is the application of a range of infrastructure and marketing measures to produce public transport bus services that approach the operating characteristics and capacity of rapid transit systems.
Express bus service
[edit]_on_H-1_Freeway_2011-01-04.jpg)
An express bus service (also known as express commuter service, commuter bus service, or suburban bus service)[citation needed] is a fixed-route bus service that is intended to run faster than normal bus services between the same two commuter or destination points, typically on longer-distance routes.[9]
Express buses operate on a faster schedule by not making as many stops as normal bus services and often taking quicker routes, such as along freeways, or by using dedicated lanes or roadways. Express buses may also operate out of park and rides, in some cases only during rush hour in the peak direction.[10]: 205
Fares on express bus services may be higher than normal parallel services. Many express buses act as precursors to bus rapid transit lines and employ a proof-of-payment scheme, requiring passengers to purchase tickets before boarding the bus, speeding up the service. These services may also use suburban coaches that feature amenities like comfortable seating and wireless Internet service, particularly on routes that travel long distances at higher speeds without stopping.
In many cases, an express bus service is identified by a letter before or after the regular route number. For example, in Sydney, the letters L (as in L90), E (as in E70) and X (as in 610X or X84). L indicates that the bus runs along the normal route, while E and X indicate that the bus runs along a more direct route. In New York City, express buses operate using coaches from Motor Coach Industries and Prevost Car, and all except the BxM4 operate along highways, sometimes for a large portion of the route. For example, the QM8, QM5 and QM2 Super Expresses, the SIM26, SIM22, SIM25, BxM11 and X38 all operate on highways for most of their route. Many transit systems may also use a specific number before or after the regular route number. For example, in Toronto, the number "9" (as in 995) goes before the regular route number to display an express bus service.
Long distance transport
[edit]Long-distance coach services (US: Intercity bus line) are bus services operated over long distances between cities. These services can form the mainstay of the travel network in countries with poor railway infrastructure. Different coach operators may band together on a franchise or connecting basis to offer a branded network that covers large distances, such as Trailways and National Express. These networks can even operate internationally, such as Eurolines of Europe. Interurban bus services are primarily aimed at linking together one or more urban centres, and as such are often run as express services while travelling in the intermediate rural areas, or even only call at two terminal points as a long distance shuttle service. Some interurban services may be operated as high specification luxury services, using coaches, in order to compete with railways, or link areas not rail connected. Interurban services may often terminate in central bus stations rather than on street stops. Other interurban services may specifically call at intermediate villages and may use slower transit buses or dual purpose buses.
Specialist services
[edit]- School buses transport children to and from school. While many countries and school districts organise their own services, as school buses or charter buses, in some areas school bus services are implemented as special journeys on the normal public timetable, specially timed and routed to arrive and depart in coordination with the school bell. Only the latter is commonly referred to as "public transport".
- Shuttle buses are any type of bus service intended primarily to shuttle passengers between two fixed points. These can be bus or coach operated, but are usually short or medium distance journeys taking less than an hour. Shuttle buses will usually link with other transport hubs, such as airport shuttle buses. A common use of a shuttle bus is in towns or cities with multiple terminal train stations or bus stations, for passenger interconnections. "Shuttle" as a brand name is applied variously across several types of service.
- Post bus services are services that also carry mail, often on rural routes.
- Rail replacement bus services are often chartered by railway companies as alternate means of transport for rail passengers. This can be pre-planned to cover for scheduled track maintenance or other planned closures, or to cover for unplanned closures such as derailments.
-
 A IC Bus CE school bus with an International 3300 chassis in America
 -
 A shuttle bus service in Sydney
 -
 A postbus in St. Moritz
 -
 VinBus electric bus at VOP

,_operated_by_Veoila_Transport,_Custom_Coaches_%27CB60_Evo_II%27_bodied_Volvo_B7RLE_on_Moore_Street_in_Liverpool.jpg)


Operation
[edit]Scheduling
[edit]Many public bus services are run to a specific timetable giving specific times of departure and arrival at waypoints along the route. These are often difficult to maintain in the event of traffic congestion, breakdowns, on/off bus incidents, road blockages or bad weather. Predictable effects such as morning and evening rush hour traffic are often accounted for in timetables using the past experience of the effects, although this then prevents the opportunity for drafting a 'clock face' timetable where the time of a bus is predictable at any time through the day. Predictable short term increases in passenger numbers may be dealt with by providing "duplicate" buses, where two or more buses operate the same slot in the timetable. Unpredictable problems resulting in delays and gaps in the timetabled service may be dealt with by 'turning' a bus early before it reaches it terminus, so that it can fill a gap in the opposite direction, meaning any passengers on the turned bus need to disembark and continue on a following bus. Also, depending on the location of the bus depot, replacement buses may be dispatched from the depot to fill in other gaps, starting the timetable part way along the route.
There is a common cliché that people "wait all day, and then three come along at once", in relation to a phenomenon where evenly timetabled bus services can develop a gap in service followed by buses turning up almost simultaneously. This occurs when the rush hour begins and numbers of passengers at a stop increases, increasing the loading time, and thus delay scheduled service. The following bus then catches up because it begins to be delayed less at stops due to fewer passengers waiting. This is called bus bunching. This is prevented in some cities such as Berlin by assigning every stop arrival times where scheduled buses should arrive no earlier than specified.
Some services may have no specific departure times, the timetable giving the frequency of service on a route at particular phases of the day. This may be specified with departure times, but the over-riding factor is ensuring the regularity of buses arriving at stops. These are often the more frequent services, up to the busiest bus rapid transit schemes. For headway-based schemes, problems can be managed by changing speed, delaying at stops and leap-frogging a bus boarding at a stop.
Services may be strictly regulated in terms of level of adherence to timetables, and how often timetables may be changed. Operators and authorities may employ on-street bus inspectors to monitor adherence in real time. Service operators often have a control room, or in the case of large operations, route controllers, who can monitor the level of service on routes and can take remedial action if problems occur. This was made easier with the technological advances of two way radio contact with drivers, and vehicle tracking systems.
Urban land-use planning policies are essential for the success of bus transit systems, particularly as mass transit is not feasible in low-density communities. Transportation planners estimate that to support local bus service every thirty minutes, there must be a residential housing density of seven dwelling units per acre.[11]
Fixed infrastructure
[edit]Bus services have led to the implementation of various types of infrastructure now common in many urban and suburban settings. The most prevalent example is the ubiquitous bus stop. Large interchanges have required the building of bus stations. In roads and streets, infrastructure for buses has resulted in modifications to the kerb line such as protrusions and indentations, and even special kerb stones. Entire lanes or roads have been reserved for buses in bus lanes or busways. Bus fleets require large storage premises often located in urban areas, and may also make use of central works facilities.
Management
[edit]
The level and reliability of bus services are often dependent on the quality of the local road network and levels of traffic congestion, and the population density. Services may be organised on tightly regulated networks with restrictions on when and where services operate, while other services are operated on an ad hoc basis in the model of share taxis.
Increasingly, technology is being used to improve the information provided to bus users, with vehicle tracking technologies to assist with scheduling, and to achieve real-time integration with passenger information systems that display service information at stops, inside buses, and to waiting passengers through personal mobile devices or text messaging.
Fare models
[edit]
Bus drivers may be required to conduct fare collection, inspect a travel pass or free travel pass, or oversee stored-value card debiting. This may require the fitting of equipment to the bus. Alternatively, this duty and equipment may be delegated to a conductor who rides on the bus. In other areas, public transport buses may operate on a zero-fare basis, or ticket validation may be through the use of on-board/off-board proof-of-payment systems, checked by roving ticket controllers who board and alight buses at random.
In some competitive systems, an incumbent operator may introduce a "low-cost unit" paying lower wages, in order to be able to offer lower fares, using older buses cascaded from a main fleet to also reduce costs. In some sectors, operators such as Megabus (both in the UK and in North America) have attempted to emulate the low-cost airlines model in order to attract passengers through low fares, by offering no-frills bus services.
Ownership
[edit]Public transport bus operation is differentiated from other bus operation by the fact the owner or driver of a bus is employed by or contracted to an organisation whose main public duty or commercial interest is to provide a public transport service for passengers to turn up and use, rather than fulfilling private contracts between the bus operator and user. Public transport buses are operated as a common carrier under a contract of carriage between the passenger and the operator.
The owners of public transport buses may be the municipal authority or transit authority that operates them, or they may be owned by individuals or private companies who operate them on behalf of the authorities on a franchise or contract basis. Other buses may be run entirely as private concerns, either on an owner-operator basis, or as multi-national transport groups. Some countries have specifically deregulated their bus services, allowing private operators to provide public bus services. In this case, an authority may make up the shortfall in levels of private service provision by funding or operating 'socially necessary' services, such as early or late services, on the weekends, or less busy routes. Ownership/operation of public transport buses can also take the form of a charitable operation or not for profit social enterprises.
Larger operations may have fleets of thousands of vehicles. At its peak in the 1950s, the London Transport Executive owned a bus fleet of 8,000 buses, the largest in the world. Many small operators have only a few vehicles or a single bus owned by an owner-driver. Andhra Pradesh State Road Transport Corporation holds the Guinness world record of having the largest fleet of buses with 22,555 buses.[12]
Regulation
[edit]In all cases in the developed world, public transport bus services are usually subject to some form of legal control in terms of vehicle safety standards and method of operation, and possibly the level of fares charged and routes operated.
Bus services are being made accessible, often in response to rules and regulations in disability discrimination laws. This has resulted in the introduction of paratransit services and low-floor buses to support passengers who are elderly, have a disability, or a medical condition.
Some transit agencies have also started to install bike racks in the front of buses that usually holds two bicycles. Passengers would be able to place their bicycle on the racks when riding to avoid taking up space during rush hour.
Safety
[edit]The research conducted in Montreal (Canada) showed that travelling by bus is safer than travelling by car, for vehicle occupants but also for pedestrians and cyclists.[13] There were 16 times more injured car occupants than bus occupants. Most pedestrians (95%) and cyclists (96%) were injured by a car. Looking at major injuries only (excluding minor injuries), there were 28 times more injured car occupants than bus occupants. Cars were associated with three cyclist deaths and 42 pedestrian deaths while buses were associated with no cyclist deaths and four pedestrian deaths.
See also
[edit]References
[edit]- ^ "Premiers omnibus à Nantes" (in French). 13 June 2008.
- ^ "Year 1662, The First Public Bus, The Omnibus". 3 December 2010.[permanent dead link]
- ^ "When was the horse-drawn urban omnibus introduced in Paris?". 3 December 2010. Archived from the original on 24 July 2011. Retrieved 3 December 2010.
- ^ "Greater Manchester's Museum of Transport: Public Transport in Greater Manchester". Archived from the original on 2011-04-26. Retrieved 2010-11-14.
- ^ "Les omnibus à traction hippomobile (archives of Musée départemental Dobrée)" (in French). Conseil général de la Loire-Atlantique, Nantes, France. Retrieved 5 January 2011.
- ^ "Streetcar Sunday - The Bowery". 10 October 2010.
- ^ "American Public Transportation Association".
- ^ General Motors and the Demise of Streetcars Archived 2007-07-02 at the Wayback Machine, Cliff Slater
- ^ "Express Bus Service" (PDF). Texas A&M University Mobility. Retrieved 22 August 2022.
- ^ Pratt, Richard H.; Copple, John N.; Barton-Aschman Associates, Inc., R.H. Pratt & Co. Division (July 1981). "Express Transit" (PDF). Traveler Response to Transportation System Changes (PDF) (Report) (Second ed.). U.S. Department of Transportation, Federal Highway Administration. pp. 205–236.
{{cite report}}: CS1 maint: multiple names: authors list (link) - ^ Booth, Geoffrey; Leonard, Bruce; Pawlukiewicz, Michael (2002). "Ten Principles for Reinventing America's Suburban Business Districts" (PDF). ULI Americas. Urban Land Institute. Retrieved 26 July 2021.
- ^ "APSRTC Profile". APSRTC.
- ^ Morency, P.; Strauss, J.; Pépin, F. (April 2018). "Traveling by Bus Instead of Car on Urban Major Roads: Safety Benefits for Vehicle Occupants, Pedestrians, and Cyclists". Journal of Urban Health. 95 (2): 196–207. doi:10.1007/s11524-017-0222-6. PMC 5906382. PMID 29500736.
External links
[edit]![]() Media related to Bus transport at Wikimedia Commons
Media related to Bus transport at Wikimedia Commons
| Chassis |  | |
|---|---|---|
| Roadway | ||
| Uses | ||
| Power | ||
| Manufacturing | ||
| Bus service | |
|---|---|
| Rail | |
| Vehicles for hire | |
| Carpooling | |
| Ship | |
| Cable | |
| Other transport | |
| Locations | |
| Ticketing and fares |
|
| Routing | |
| Facilities | |
| Scheduling | |
| Politics | |
| Technology and signage | |
| Models | |
| Other topics | |
| Authority control databases: National |
|---|
Public transport bus service
View on GrokipediaHistorical Development
Origins in Horse-Drawn Omnibuses
The earliest precursor to modern public bus services emerged in Paris in 1662, when mathematician Blaise Pascal organized the carrosses à cinq sols, a system of horse-drawn coaches operating on fixed routes for a uniform fare of five sols. These vehicles, each pulled by two horses, provided scheduled transport between key points in the city, marking the first organized public conveyance for the masses rather than private or elite use. The service initially proved popular but ceased operations shortly after Pascal's death in 1662, likely due to rising operational costs and competition from sedan chairs.[8][9] By the early 19th century, amid accelerating urbanization, horse-drawn omnibuses reemerged and proliferated across Europe, beginning with services in Nantes in 1826 and Bordeaux in 1827, followed by expanded commercial lines in Paris in 1828. In London, George Shillibeer introduced the city's first omnibus in 1829, a box-like vehicle drawn by three horses that ran from Paddington to the City, accommodating passengers on fixed schedules for set fares. These omnibuses typically seated 12 to 24 passengers inside, with standing options outside, and operated along predetermined routes to serve growing commuter needs in densely populated areas.[10][11] The concept quickly crossed the Atlantic, reaching New York City around 1827 when Abraham Brower deployed 12-passenger omnibuses manufactured by John Stephenson, facilitating uptown travel as the city expanded. Similar introductions occurred in Philadelphia in 1831 and Boston in 1835, positioning omnibuses as essential for urban mobility before rail alternatives. However, these services faced inherent constraints: horses fatigued after limited daily miles, typically pulling no more than three tons on good roads, rendering operations weather-dependent and prone to delays in mud or snow; capacity rarely exceeded 20-24 passengers per vehicle; and animal welfare concerns arose from overwork, with teams often requiring frequent rotation to sustain service.[12][13][14][15]Emergence of Motorized Buses
The first motorized bus, powered by an internal combustion engine, was developed by Karl Benz in Germany and delivered by Benz & Cie. on March 12, 1895, in Mannheim, initially operating a short route connecting Siegen to the surrounding area.[16] Early prototypes faced reliability issues, such as frequent breakdowns, limiting their immediate viability for regular public service.[17] In the United States, the first gasoline-powered buses entered service in New York in 1905, marking the beginning of experimental adoption amid ongoing improvements in engine durability and chassis design.[18] Adoption accelerated after World War I as engineering advancements, including stronger transmissions and pneumatic tires, enhanced reliability and reduced operational downtime, enabling motorized buses to compete with horse-drawn omnibuses on fixed routes.[19] In London, motorized double-decker buses emerged in the early 1900s, with models like the 1908 Leyland X2 providing greater passenger capacity for densely populated urban areas while adapting the traditional two-level design to mechanical propulsion.[20] By the 1930s, the introduction of diesel engines in buses halved fuel costs compared to gasoline equivalents and doubled mileage efficiency, yielding annual savings of approximately £466 per vehicle through lower consumption and maintenance needs.[21] This shift was driven by escalating urban challenges, including rapid population growth that strained horse-based systems—New York City alone supported 100,000 horses in 1900, generating 2.5 million pounds of manure daily, which accumulated in streets, attracted flies, and exacerbated disease transmission.[22] Horse maintenance costs, encompassing feed, stabling, and veterinary care, proved unsustainable at scale, while mechanized buses offered lower long-term expenses and scalability without the sanitary burdens of equine waste.[23] These factors, combined with internal combustion's superior power output for heavier loads, prompted municipalities and operators to mechanize fleets, averting projected crises like manure piles reaching nine feet deep in major cities by the mid-20th century.[24]Expansion and Shifts in the 20th Century
Following World War II, public bus services in the United States and parts of Europe underwent significant expansion to accommodate urban population growth and postwar economic recovery, often supported by government subsidies for fleet modernization and route extensions. In the US, transit ridership, including buses, peaked at approximately 23 billion unlinked passenger trips in 1945, reflecting pent-up demand after wartime restrictions on private vehicles and fuel.[25] European cities similarly rebuilt and expanded bus networks; for instance, Western European governments increased subsidies for public transport operations, funding nearly all infrastructure costs to integrate buses with emerging rail systems amid rapid urbanization.[26] This growth phase reversed sharply due to surging private automobile adoption, which offered greater convenience in expanding suburban areas. In the US, bus and overall transit ridership plummeted over 75% from 1945's 23 billion trips to about 5 billion by 1970, as car ownership rates doubled amid falling vehicle prices and widespread availability of consumer credit.[25] [27] The causal mechanism was evident in low-density suburbs, where fixed-route buses incurred high operating costs per passenger compared to automobiles' door-to-door flexibility, exacerbated by federal highway investments like the 1956 Interstate Highway Act that prioritized auto infrastructure over transit.[28] By the 1960s, many private US bus operators faced bankruptcy, prompting a shift to publicly subsidized agencies under the 1964 Urban Mass Transportation Act.[29] Policy responses diverged transatlantically, influencing service trajectories. In the United Kingdom, the 1947 Transport Act established the British Transport Commission, enabling coordinated subsidies and fleet investments that sustained bus expansion into the 1950s despite emerging car competition; however, patronage began eroding as motorization rates rose, leading to route contractions by the 1960s.[30] Continental Europe often retained stronger public funding models, with subsidies covering deficits to preserve networks in denser urban forms. In the US, intercity bus deregulation via the 1982 Bus Regulatory Reform Act fostered competition and lower fares but had limited impact on local urban services, which continued contracting in auto-dependent peripheries.[31] These shifts underscored how automobile affordability—enabled by postwar manufacturing efficiencies and cheap fuel—fundamentally altered travel patterns, rendering bus services unviable in sprawling landscapes without corresponding land-use reforms.[32]Classification of Services
Local Urban and Suburban Routes
Local urban and suburban bus routes provide short-haul, fixed-route services within cities and adjacent suburbs, targeting dense populations for daily commuting and local travel. These operations feature regular stops every 0.5 to 1 kilometer in urban cores, with headways typically ranging from 5 to 15 minutes during peak periods on high-demand lines to ensure accessibility without excessive waiting times.[33] In contrast, suburban extensions often exhibit longer headways of 20 to 30 minutes due to sparser demand and extended route lengths. Standard vehicles on these routes, such as 12-meter single-deck or articulated buses, offer seated capacities of 40 to 60 passengers, supplemented by standing room to handle peak loads up to 100 individuals.[35] In major metropolitan areas, these services form essential networks for non-rail connected neighborhoods. London's local bus system, for instance, recorded 1.8 billion passenger journeys in the year ending March 2024, underscoring its role in serving diverse urban and suburban commuters.[36] Similarly, New York City's bus network transports over 1.1 million riders daily, primarily on local routes that penetrate residential zones inaccessible by subway.[37] High-frequency operations on these corridors support multimodal integration, with buses achieving load factors exceeding 50% during rush hours in effective systems, thereby alleviating highway congestion by diverting trips from automobiles.[38] Variants enhance efficiency and coverage: feeder routes link suburban origins to urban rail interchanges, optimizing transfers under heterogeneous demand patterns.[39] Express or limited-stop services bypass minor halts to cut dwell times and speeds, particularly on arterial roads, though they remain confined to metropolitan bounds rather than intercity spans.[40] These adaptations prioritize reliability in congested environments, where bus capacity—factoring vehicle frequency and occupancy—can rival light rail for volumes up to 5,000 passengers per hour per direction on dedicated segments.Regional and Intercity Operations
Regional and intercity bus services provide longer-distance connectivity between urban centers and rural areas, typically spanning 100 to 500 kilometers per trip, using purpose-built coaches optimized for highway travel rather than frequent stops. These vehicles feature amenities like reclining seats, onboard restrooms, and luggage storage to accommodate journeys of several hours, with operational speeds reaching up to 100 km/h on open roadways where permitted by traffic laws and infrastructure. While dedicated bus lanes exist on some urban highways, intercity routes primarily rely on general highway access, occasionally utilizing high-occupancy vehicle (HOV) lanes reserved for buses to bypass congestion. Such services fill gaps left by rail networks, particularly in regions with sparse rail coverage, and compete with airlines on cost for mid-range trips.[41] In the United States, Greyhound Lines exemplifies early intercity operations, originating in 1914 as a modest service ferrying iron ore miners in Minnesota before evolving into a coast-to-coast network. In Europe, FlixBus emerged in 2013 amid Germany's liberalization of long-distance coach markets, rapidly expanding across the continent by partnering with local operators and leveraging digital booking platforms for dynamic pricing and scheduling. These models emphasize point-to-point routing with limited intermediate stops, enabling average trip durations of 2 to 6 hours on core corridors, and have grown to serve millions annually by targeting price-sensitive travelers avoiding airfare premiums or inflexible train timetables.[43][44] Post-1980s deregulation reshaped the sector, with the U.S. Bus Regulatory Reform Act of 1982 easing route and fare restrictions to foster competition and reduce prices by up to 30 percent on select routes. Similar reforms in Europe, including the UK's 1980 Transport Act and Germany's 2013 market opening, spurred entry of low-cost providers like FlixBus, boosting service frequency on high-demand links. Nonetheless, vulnerability to external shocks persists; the 1973 and 1979 oil crises elevated fuel costs dramatically, prompting temporary ridership surges as motorists shifted to buses amid gasoline rationing and shortages, though sustained high prices strained operator margins without proportional fare hikes. On viable routes, load factors commonly range from 60 to 70 percent, reflecting demand variability influenced by economic conditions and modal alternatives.[45][46][47]Specialized and Niche Applications
School buses in the United States adhere to standardized safety features established at the 1939 National Conference on School Transportation, including the adoption of "national school bus glossy yellow" for enhanced visibility.[48] This color, selected for its rapid detection by the human eye, has contributed to school buses being approximately 70 times safer per passenger mile than private automobiles.[49] Around 480,000 such buses operate daily across the country, primarily on fixed routes to and from schools, with compartmentalization and high-backed seats as key crash protection elements rather than seat belts in many models.[50] Paratransit services provide complementary demand-responsive transportation for individuals with disabilities unable to access fixed-route public buses independently, as required by Title II and III of the Americans with Disabilities Act of 1990.[51] These door-to-door or curb-to-curb operations, often using vans or small buses equipped with lifts or ramps, must operate within a 3/4-mile corridor of fixed routes and are subject to eligibility certification based on functional limitations.[52] Public transit agencies must ensure equivalent service levels, including response times not exceeding two hours for scheduled trips.[51] Airport shuttle buses connect terminals, parking facilities, rental car centers, and hotels, reducing reliance on private vehicles within expansive airport grounds.[53] These services typically feature frequent, short-haul loops with low-floor designs for luggage and passengers, operating under airport authority contracts or private concessions.[53] Capacity often ranges from 14 to 30 passengers per vehicle, prioritizing quick boarding and efficiency during peak flight times.[54] Charter bus services involve privately hired vehicles for group events such as weddings, conferences, or sports outings, with operators providing point-to-point transport outside regular public schedules.[55] Touristic applications include hop-on hop-off buses, which follow preset loops with multiple stops at attractions, allowing passengers to board and alight flexibly using single-day or multi-day tickets.[56] These open-top or narrated vehicles, common in cities like New York, emphasize sightseeing over commuting, often with multilingual audio guides.[57] Demand-responsive bus services, including microtransit, use app-based booking for on-demand pickups in defined zones, typically deploying vans seating 4 to 12 passengers to match real-time rider requests.[58] Pilots in the 2020s, such as those in Whittier, California, integrate software for dynamic routing to serve low-density areas or supplement fixed routes, aiming to lower operational costs compared to traditional paratransit.[59] These services dynamically pool trips to minimize empty miles, though challenges include higher per-trip expenses in sparse demand scenarios.[60]Core Operations
Infrastructure and Fleet Composition
Public transport bus infrastructure encompasses bus stops, depots, and specialized roadways such as dedicated bus lanes. Bus stops serve as designated points for passenger boarding and alighting, with designs varying by expected usage volume; high-frequency urban stops often include shelters, benches, and real-time information displays to enhance accessibility and wait times.[61] Depots function as central hubs for vehicle storage, maintenance, and dispatching, equipped with facilities for refueling, repairs, and crew allocation to ensure operational readiness.[61] In bus rapid transit (BRT) systems, dedicated lanes prioritize bus movement, as exemplified by Curitiba, Brazil, where the first 20 kilometers of such infrastructure were implemented in 1974 to facilitate high-capacity service segregated from general traffic.[62] Fleet composition typically includes a mix of single-decker, double-decker, and articulated buses tailored to route demands and urban constraints. Single-decker buses, the most common type, accommodate 60 to 120 passengers including standees, suitable for standard urban routes.[63] Double-decker buses, often deployed in dense cities like London, provide two levels for increased capacity without extending length, carrying around 60 to 90 passengers seated. Articulated buses, featuring a flexible joint connecting sections, offer capacities exceeding 100 passengers and are used on high-demand corridors to maximize throughput.[63] Buses are engineered for durability, with standard useful lifespans of 12 years or 500,000 kilometers under Federal Transit Administration guidelines for heavy-duty models, after which replacement funding becomes eligible to address wear from intensive urban operation.[64] Historically, diesel engines have dominated global public bus fleets, comprising approximately 50 percent as of recent assessments, though this reflects a mix including older vehicles resistant to rapid fleet turnover.[65] Maintenance challenges arise from infrastructure decay, particularly in underfunded U.S. systems facing a $176 billion backlog in capital needs, which correlates with increased breakdowns and reduced reliability due to deferred repairs on aging vehicles and facilities.[66][67]Scheduling, Routing, and Service Frequency
Routing in public transport bus services involves designing fixed or flexible paths that connect origins and destinations while optimizing for geographic coverage, passenger demand, and operational efficiency, often using geographic information systems (GIS) and operations research techniques to minimize route length and transfer times.[68] Routes are typically planned to balance high-density corridors with feeder services to suburbs, incorporating constraints such as road networks, one-way streets, and land-use patterns, with adjustments made periodically based on ridership data from automatic vehicle location (AVL) systems.[69] Scheduling establishes timetables that dictate departure times, incorporating peak-hour surges and off-peak reductions to match temporal demand variations, such as higher frequencies during morning and evening commutes in urban areas. Service frequency is expressed in headways—the time intervals between consecutive buses—ranging from 5-10 minutes on high-demand urban trunk routes during peaks to 15-60 minutes on suburban or low-demand lines, with services exceeding 10-minute headways classified as low-frequency and prone to bunching or gaps.[70] Timetables aim to synchronize with connecting modes like rail, using optimization models that consider vehicle capacity, driver shifts, and recovery times for delays. Optimization principles prioritize minimizing total system costs, including passenger wait times and empty running (deadhead) miles, against revenue from loads, though urban sprawl often leads to inefficiencies with longer routes serving dispersed low-density areas, resulting in underutilized capacity. Mathematical programming, such as bi-objective models weighing operator costs against user perceptions of reliability, has been applied since the early 2000s, evolving with software integrating real-time data for dynamic adjustments like rerouting around incidents.[71] Traffic congestion imposes real-world constraints, adding 12-15% to running times on affected routes and reducing on-time performance to around 69% for buses with headways over 10 minutes in dense cities like New York.[72][37] Dynamic routing tools, leveraging AVL and GPS since the 2000s, enable mid-day frequency tweaks or path deviations to mitigate such delays, though adoption varies by agency resources.[73]Staffing, Management, and Daily Execution
Public bus services rely on drivers as the primary operational staff, typically working shifts of 8 to 10 hours daily, with federal regulations limiting driving time to 10 hours and total on-duty time to 15 hours before an 8-hour rest period.[74] Mechanics support fleet reliability by inspecting, diagnosing, repairing engines, brakes, electrical systems, and other components to minimize downtime.[75] Union representation, prevalent in U.S. public transit, elevates labor costs through higher wages and restrictive work rules; for instance, unionized agencies maintain more drivers and mechanics than cost-minimizing models predict, with public operators often compensated 50% or more above comparable private-sector roles in specific markets like Seattle.[76][77] Daily execution involves dispatchers and supervisors coordinating real-time responses to disruptions such as vehicle breakdowns or traffic delays, including rerouting buses or holding connecting services to sustain overall network reliability.[78] Absenteeism and shortages, exacerbated post-2020 by pandemic-related labor market shifts, frequently force service cancellations or reduced frequencies, as agencies struggle with persistent operator vacancies.[79] High annual turnover rates—averaging 30% or more in many systems, per Federal Transit Administration data—compound these issues, eroding schedule adherence and increasing overtime reliance, which further inflates operational expenses.[80][80]Financial and Economic Frameworks
Pricing Structures and Fare Recovery Rates
Public bus services employ diverse pricing structures to balance accessibility, revenue generation, and operational equity. Flat fares, charging a uniform rate regardless of distance traveled, predominate in urban and suburban networks, typically ranging from $1 to $3 USD per ride in many North American and European systems.[81] Distance-based fares, which scale charges according to trip length or zones crossed, are more common in regional or intercity operations, promoting cost proportionality but increasing administrative complexity through technologies like smartcard swipes at entry and exit points.[82] Subscription models, including daily, weekly, or monthly passes, offer unlimited rides within defined periods or areas, appealing to frequent users and often yielding higher per-passenger revenue through bulk pricing. These structures have evolved with digital integration, as cash payments have declined since the 2010s in favor of contactless cards, mobile apps, and account-based systems, reducing collection costs by up to 20% in adopting agencies while enabling dynamic pricing like fare capping.[83] Farebox recovery ratios—the portion of operating costs covered by passenger fares—typically range from 20% to 40% globally for public bus services, reflecting heavy reliance on external funding due to social service mandates and inelastic demand. In the United States, bus operations averaged around 25% recovery pre-pandemic, lower than rail modes, as reported by the American Public Transportation Association, with variations by agency size and density; for instance, larger systems like those in the top 50 U.S. agencies achieved about 36% in 2019.[84] Internationally, ratios differ markedly: high-density Asian cities like Hong Kong exceed 80% on select routes due to premium pricing and ridership volumes, while European and Latin American urban buses often hover below 30%, underscoring systemic shortfalls from underpricing relative to costs like labor and fuel.[85] In contrast, unsubsidized private intercity bus operators, such as Greyhound in the U.S., target full or excess recovery (over 100%) by setting fares to cover variable and fixed costs without public mandates, achieving profitability through route optimization and demand-driven pricing.[86] Demand responsiveness to fare changes remains low, with short-term price elasticity estimated at -0.3 to -0.4 for bus services: a 10% fare hike typically reduces ridership by 3-4%, disproportionately affecting low-income and off-peak users without proportionally increasing revenue due to high fixed costs comprising 70-80% of expenses.[84] Empirical studies confirm that such increases fail to close deficits, as lost volume amplifies per-trip shortfalls, while reductions boost ridership but exacerbate recovery gaps, as seen in U.S. experiments where fare cuts yielded net revenue losses despite 10-20% volume gains.[87] This inelasticity stems from captive ridership—dependent on buses for lack of alternatives—limiting pricing as a deficit-closing tool and highlighting the structural under-recovery inherent to public operations versus market-driven private models.[88]Funding Mechanisms, Subsidies, and Ownership Models
Public bus services worldwide rely heavily on subsidies derived from general taxpayer revenues, often covering 70 to 80 percent of operating costs in urban systems where fare revenues recover only 20 to 30 percent.[89] In the United States, federal grants through the Federal Transit Administration (FTA) allocate approximately $20.5 billion annually for fiscal year 2025, supporting both capital investments and operating expenses across transit modes including buses.[90] These subsidies, supplemented by state and local taxes, enable service provision but can distort resource allocation by funding routes with low ridership that would not sustain themselves commercially, as operators lack incentives to prioritize high-demand corridors.[91] Ownership models predominantly feature municipal or public agencies, which control fleet, routes, and operations in most major cities globally, such as New York City's Metropolitan Transportation Authority or Paris's RATP.[92] Private models, however, operate in deregulated environments like England outside London following the 1985 Transport Act, where independent operators compete for routes, achieving operational cost reductions through efficiencies in labor and scheduling, though this has led to service withdrawals from unprofitable areas and real-terms fare increases averaging 2-3 percent annually post-deregulation.[93] Empirical comparisons indicate private operators often exhibit lower unit costs—up to 20-30 percent in some studies—due to competitive pressures reducing overheads, contrasting with public entities' tendencies toward bureaucratic expansions.[94][93] Subsidies in public models exacerbate inefficiencies by insulating operators from market signals, encouraging maintenance of underutilized routes that inflate system-wide costs without proportional ridership gains, as evidenced by stagnant or declining bus usage in subsidized U.S. systems despite rising funding.[95] Analyses from libertarian-leaning sources like the Cato Institute argue this fosters dependency on political allocations over performance metrics, with private alternatives demonstrating superior productivity in deregulated settings by focusing services on viable demand.[96] Conversely, public ownership ensures universal coverage but at the expense of fiscal sustainability, with studies showing private provision correlates with higher vehicle utilization and lower subsidy per passenger-mile in competitive frameworks.[97]Efficiency Analyses and Cost-Benefit Comparisons
Public bus services exhibit varying efficiency depending on load factors, route density, and comparison to private automobiles, with per-passenger-kilometer costs typically ranging from $0.60 to $1.60 when accounting for average occupancies of 20-40 passengers, far exceeding unsubsidized car costs of approximately 0.40 per passenger-kilometer.[98][99] Low load factors, prevalent in non-peak urban and suburban operations, inflate effective costs by spreading fixed expenses like driver wages and fuel over fewer riders, often resulting in bus energy consumption per passenger equivalent to or higher than solo driving outside high-demand corridors.[100] Analyses demonstrate that buses achieve cost and congestion benefits over cars primarily in dense urban environments with population densities exceeding 3.4 persons per acre, where high ridership enables load factors above 50% and reduces per-passenger operating expenses through scale.[101] In low-density or sprawling areas, however, fixed routes and schedules lead to underutilization, making buses less efficient than flexible private vehicles; for example, regular bus services struggle economically below thresholds where demand supports viability, prompting shifts to demand-responsive models that still yield higher costs per rider than autos.[102][103] In the United States, bus and broader transit systems capture only about 2-3% of total passenger trips as of 2023, despite federal, state, and local subsidies totaling $92.4 billion annually—equivalent to over $5 per trip—while ridership remains 21% below 2019 levels at 7.1 billion unlinked trips.[104][105][106] Proponents argue subsidies generate economic multipliers of 2:1 through induced activity, yet empirical reviews reveal net fiscal burdens, with fare revenues covering under 20% of costs and stagnant mode share indicating minimal substitution from driving.[7][91]| Metric | Bus Transit (Average) | Private Car (Unsubsidized) |
|---|---|---|
| Cost per Passenger-Mile | 1.00[99][98] | 0.38 |
| Typical Load/Occupancy Factor | 20-40% (urban routes)[100] | 1.5-2 passengers |
| Efficiency Threshold | High-density corridors (>50% load)[101] | Flexible in low-density areas |
Governance and Risk Management
Regulatory Environments and Compliance
In many jurisdictions, public transport bus services operate under frameworks that mandate licensing for operators, route authorization via franchising or permits, and compliance with vehicle standards to ensure operational reliability and environmental limits. Route franchising, prevalent in regions like England and Scotland, allows local transport authorities to specify service details, tender contracts to operators, and retain fare revenues while cross-subsidizing unprofitable routes from profitable ones, as enabled by the Bus Services Act 2017.[109] Emissions mandates form a core component, with the European Union's Euro VI standards, established under Regulation (EC) No 595/2009 and applying to new heavy-duty vehicles from September 2014, imposing strict limits on nitrogen oxides (NOx at 0.4 g/kWh) and particulate matter to curb urban air pollution from diesel buses.[110] In the United States, interstate operations fall under Federal Motor Carrier Safety Administration (FMCSA) oversight, requiring for-hire carriers to register USDOT numbers, maintain financial responsibility, and adhere to hours-of-service rules for passenger transport exceeding state lines.[111] Such regulatory structures frequently erect barriers to entry, including bidding processes, capital requirements for compliant fleets, and geographic exclusivity, which shield incumbents from competition and empirically correlate with elevated fares and subdued innovation. For instance, franchising thresholds demand operators demonstrate financial stability and operational capacity, often favoring large firms and discouraging smaller entrants, thereby sustaining oligopolistic market conditions that prioritize stability over responsiveness to demand shifts. Compliance burdens, encompassing vehicle retrofits, reporting, and audits, consume resources that could otherwise enhance service frequency or coverage, with general regulatory overhead in transportation sectors absorbing 1-3% of wage bills firm-wide, though sector-specific mandates like emissions upgrades amplify fleet-related expenditures.[112] Deregulation episodes underscore the efficiency costs of excessive regulation; the UK's Transport Act 1985 dismantled quantity controls on local bus services outside London, spurring privatization and competitive entry that yielded unit cost reductions of up to 30% in initial years through route rationalization and labor efficiencies, though it prompted withdrawals from low-density areas absent subsidies.[113] Analogously, the U.S. Bus Regulatory Reform Act of 1982 relaxed Interstate Commerce Commission approval for new routes and pricing, fostering carrier efficiency gains and service expansions in competitive corridors, with analyses confirming net economic benefits via lowered barriers despite subsequent rural service erosion from market forces.[114] These reforms reveal that while regulation mitigates market failures like under-servicing externalities, over-regulation entrenches inefficiencies by curtailing supply-side responses, often at the expense of consumer welfare in fare and availability terms.Safety Protocols and Accident Data
Public transport buses exhibit lower fatality rates per passenger-kilometer compared to private cars in developed nations. In the United States, from 2000 to 2009, the bus passenger fatality rate stood at 0.11 deaths per billion passenger miles, versus 7.28 for passenger vehicles.[115] Globally, bus occupant fatalities average around 0.4 per billion passenger-kilometers, significantly below the 3.82 rate for car occupants.[116] These figures reflect buses' structural advantages, such as greater mass and compartmentalization, which mitigate injury severity in collisions.[117] In developing countries, however, bus safety outcomes diverge markedly, with fatality rates often exceeding those of cars due to factors like overcrowded vehicles, poor road infrastructure, and lax enforcement. Researchers note that buses, while protective in controlled environments, become riskier in high-density, mixed-traffic settings prevalent in emerging economies, where accident death proportions per vehicle are elevated.[118][119] Safety protocols emphasize preventive technologies and human factors training. Anti-lock braking systems (ABS), widely adopted on buses since the late 1990s in regions like Europe and North America, reduce skidding and improve control in emergencies.[120] Driver training programs, mandated by agencies such as the U.S. Federal Transit Administration, include defensive driving techniques, fatigue management, and emergency response drills to minimize human error, which accounts for most incidents.[121] Speed limits tailored to urban routes and vehicle inspections further enforce compliance.[122] Post-2000 enhancements, including advanced stability controls and stricter licensing, contributed to a 29% decline in fatal U.S. bus crashes from 2000 to 2018.[123] Despite this, vulnerabilities persist in mixed traffic, where buses' size heightens collision risks with smaller vehicles or pedestrians. Post-2020 driver shortages, exacerbated by pandemic-related retirements and low wages, have increased operational pressures, correlating with elevated fatigue and minor incident reports in affected fleets.[124][125]Security Concerns and Crime Mitigation
Public bus services encounter security challenges primarily involving onboard assaults, robberies, and harassment, as well as incidents at stops, with victimization concentrated in urban routes serving low-income areas. High rates of vice and vagrancy crimes around bus stops correlate with reduced transit usage probabilities, as these environments attract disruptive individuals lacking the entry barriers present in private vehicles.[126] Empirical analyses indicate that public transit can facilitate criminal access to neighborhoods, potentially elevating local incident rates by enabling easier offender mobility without the spatial constraints of personal automobiles.[127] While absolute victimization numbers remain low relative to total urban crime—comprising roughly 1-2% of reported incidents—passenger exposure in shared, uncontrolled spaces contributes to elevated perceived and actual risks for violent personal crimes compared to isolated car travel.[128] Mitigation strategies include widespread deployment of closed-circuit television (CCTV) systems, which meta-analyses show reduce overall crime by 10-20% in monitored transit settings, with stronger effects (up to 34% for property crimes) on buses through deterrence and evidentiary support.[129] [130] By the 2020s, CCTV coverage extends to the majority of vehicles in major fleets, often integrated with real-time monitoring, though effectiveness varies by system quality and operator training.[131] Targeted patrols and intensified policing along high-risk corridors have demonstrated reductions in bus-related crimes, with one evaluation of a four-week operation showing significant declines in antisocial behavior and assaults via increased visibility and rapid response.[132] Critics argue that the open-access model of public buses inherently draws vagrancy and low-barrier offenders, exacerbating issues in demographics with higher offense propensities, in contrast to private options like rideshares that employ driver discretion and prepayment to screen riders.[126] Enforcement limitations, including delayed police response and prosecutorial resource shortages, undermine mitigation tools like CCTV, as footage frequently fails to yield convictions without complementary on-site interventions.[133] Systematic reviews emphasize that while technological and personnel measures curb incidents, systemic factors such as route alignment with high-crime zones necessitate broader environmental redesigns for sustained reductions.[128]Environmental Assessments
Lifecycle Emissions and Operational Realities
Diesel buses typically emit 800-1,200 grams of CO2 equivalent per vehicle-kilometer in tailpipe operational emissions, excluding upstream fuel production.[134] [135] When assessed per passenger-kilometer—a metric essential for comparing modes—figures rise substantially due to average occupancies of 9-20 passengers across urban and suburban routes, yielding 40-130 grams per passenger-kilometer.[136] [137] This range overlaps or exceeds average private car emissions of 120-170 grams per passenger-kilometer, which assume 1.5-1.6 occupants.[138] Lifecycle analyses, encompassing vehicle manufacturing, fuel extraction, refining, and end-of-life disposal, amplify buses' footprint relative to cars because of their greater mass (often 10-20 tons empty) and material intensity, adding 20-50% to total emissions over a 12-year service life assuming 500,000-800,000 kilometers traveled.[139] In low-density suburban contexts, where load factors drop below 15 passengers, buses frequently produce net higher per-passenger emissions than solo-driven cars, as documented in evaluations of underutilized routes.[140] Non-revenue "deadhead" miles—for depot returns, positioning, or layovers—comprise 15-30% of total bus operations in many agencies, incurring full vehicle emissions without passenger benefits and eroding aggregate efficiency.[141] Hybrid diesel-electric buses achieve 18-30% fuel reductions over conventional diesels via regenerative braking and optimized engine loading, translating to proportional CO2 savings under stop-start urban cycles.[142] [143] However, these gains presuppose consistent duty cycles and do not mitigate load-dependent inefficiencies; electric variants' net benefits hinge on grid carbon intensity, which averaged 400-500 grams CO2 per kWh in fossil-heavy regions as of 2023, potentially yielding lifecycle emissions comparable to hybrids when upstream electricity is factored.[144] Proponents' assertions of buses emitting 50-70% less than cars per passenger-kilometer often derive from modeled scenarios assuming 40-60% peak-period loads, disregarding off-peak realities where actual utilization averages half that.[145] Empirical U.S. data reveal public transit's outsized energy intensity: despite capturing under 5% of passenger-miles, it consumes disproportionate fuel relative to induced mode shifts, with EPA reporting transportation's 29% share of 2022 national GHG emissions underscoring transit's limited aggregate impact amid low overall mode share.[146] [147] Reasoned critiques highlight that suburban bus deployments, prioritized for equity over density, amplify per-capita emissions by operating below viability thresholds where private vehicles prove causally lower-emitting.[148]Transitions to Low-Emission Technologies
In the 2000s, public transport operators began transitioning bus fleets from diesel to alternative fuels like compressed natural gas (CNG) and hybrid-electric systems to mitigate local air pollution and particulate emissions. For instance, in 2000, New York City's Metropolitan Transportation Authority agreed to power 44% of new buses with CNG or hybrid technologies instead of diesel, driven by regulatory pressures and early demonstrations of reduced black carbon outputs.[149] CNG buses achieved notable reductions in particulate matter compared to contemporaneous diesel models, though total greenhouse gas savings were modest without broader lifecycle accounting.[150] Hybrid-diesel buses, introduced around the same period, improved fuel efficiency by 30-80% over pure diesel in urban cycles, per operational trials, but adoption stalled due to higher initial costs and maintenance complexities.[151] The 2010s onward saw a pivot toward battery-electric buses (BEBs), with global deployments accelerating amid subsidies and zero-tailpipe mandates, though empirical fleet shares remain modest outside leading markets. By 2023, China accounted for over 90% of the world's approximately 780,000 electric buses, with its national fleet reaching 473,900 units, fueled by state policies favoring domestic battery production.[152] [153] Globally, electric buses comprised less than 10% of active fleets by mid-2025, concentrated in China (30% stock share) versus under 2% in Europe, reflecting uneven infrastructure readiness and policy enforcement.[154] Sales momentum continued, with China's zero-emission bus sales hitting 230,000 units in 2024 alone, but slower uptake elsewhere highlights causal dependencies on grid decarbonization and manufacturing scale.[155] Lifecycle emissions analyses reveal BEBs eliminate tailpipe pollutants but shift burdens to electricity generation and battery production, yielding 20-87% greenhouse gas reductions versus diesel only under low-carbon grids. In coal-dependent regions like parts of China or Europe with mixed sources, savings narrow to 15-40%, and high-grid-intensity scenarios can exceed diesel impacts when factoring mining and end-of-life disposal.[156] [157] Upfront capital costs for BEBs averaged 500,000 per unit in 2025, 2-3 times diesel equivalents (200,000), though total ownership costs converge or undercut diesel over 12 years via 80% lower fuel expenses and reduced maintenance, assuming 200,000-300,000 km lifetimes.[158] [159] These economics hinge on subsidy stability, as unsubsidized deployments often exceed diesel total costs by 1-10% in high-utilization scenarios.[160] Deployment challenges persist, including limited range (typically 200-300 km per charge under ideal conditions) and protracted charging times (4-8 hours for depot slow-charging), constraining route viability without depot expansions that lag in many municipalities.[161] Cold climates exacerbate inefficiencies, with batteries consuming 48% more energy at -4°C to 0°C (25-32°F) for cabin heating and thermal management, slashing effective range by 25-50% and prompting supplemental diesel heaters in some fleets, which undermine zero-emission claims.[162] Empirical failures, such as curtailed operations in northern U.S. and European winters, underscore grid dependency and the need for predictive routing, yet successes in milder climates like Shenzhen demonstrate feasibility where infrastructure aligns with operational demands.[163]Advancements in Technology
Digital Integration and Operational Tools
Automatic vehicle location (AVL) systems, which employ GPS technology for precise bus positioning, began appearing in public transit fleets during the early 1990s, with examples including implementations by the Butler County Transportation Association (BCTA).[164] By the mid-1990s, these systems supported initial real-time traveler information applications, evolving from earlier signpost-based methods to GPS-enabled tracking as affordable receivers became available.[165] AVL integration facilitates operational oversight, such as monitoring vehicle speed, direction, and adherence to schedules, enabling dispatchers to address disruptions promptly.[166] Data derived from AVL supports analytics that optimize routing and reduce delays; for instance, real-time transit information from such systems has been shown to decrease passenger wait times by approximately three minutes on average.[167] This operational efficiency stems from causal links between location data and proactive adjustments, such as holding connecting services or rerouting around congestion, though benefits vary by system maturity and urban density. Reduced reliance on manual reporting minimizes errors in cash handling and boarding processes when paired with digital fare validation.[168] Contactless payment systems, including open-loop acceptance of bank cards and mobile wallets, gained traction in bus transit during the 2010s, with widespread adoption reaching major networks by the early 2020s.[169] These tools expedite boarding by eliminating ticket queues, contributing to fare collection accuracies exceeding 99% in implemented systems and cutting transaction times to under two seconds per rider.[170] Pre-COVID analyses indicate that such digital fare integration correlated with modest ridership increases, potentially up to 10% in adopting cities, driven by convenience rather than service expansions alone.[171] Overall, these tools enhance data-driven decision-making, though their effectiveness depends on backend infrastructure reliability and rider smartphone penetration.[172]Emerging Innovations and Future Prospects
AI-driven scheduling and routing optimizations, exemplified by Optibus' platform, enable public bus operators to achieve up to 20% reductions in operational costs through dynamic adjustments to demand and real-time disruptions as of 2025 implementations.[173] These tools leverage generative AI agents tailored for transit, facilitating faster driver shift planning and service reliability enhancements amid fluctuating ridership.[174] While such systems marginally boost overall efficiency—primarily on less frequent routes via integrated apps—their impact on total ridership remains limited without complementary infrastructure.[175] Autonomous bus deployments face persistent scaling barriers despite ongoing pilots, including U.S. Federal Transit Administration-tracked trials in bus rapid transit corridors through 2024, where safety metrics from controlled environments show promise but lack broad real-world validation.[176] Regulatory uncertainties, coupled with cybersecurity risks from AI-dependent decision-making and public trust deficits, hinder progression beyond low-speed, supervised operations into the 2030s.[177][178] Driver shortages, affecting over 90% of U.S. transit agencies per 2022 data, incentivize automation exploration, yet full workforce displacement via driverless systems is projected to lag due to liability frameworks and incident response gaps.[179][180] Battery electric buses are forecasted to dominate new procurements through the 2020s, comprising nearly all sales globally by 2025 owing to battery cost declines and charging infrastructure maturation.[154] However, widespread adoption strains electrical grids, with U.S. Department of Energy projections indicating potential 100-fold increases in blackout frequency by 2030 from uncoordinated charging peaks absent demand-response integration.[181] Strategies like off-peak depot charging mitigate but do not eliminate these causal pressures from fleet-scale electrification on aging infrastructure.[182]Broader Societal Effects
Contributions to Mobility and Accessibility
Public bus services significantly enhance mobility for carless households, which comprise a notable share of urban populations reliant on shared transport options. In dense urban settings, buses enable a disproportionate number of trips for low-income groups, where public transit usage rates exceed national averages; for instance, U.S. households earning under $15,000 annually account for 13% of all households but form a larger segment of transit riders, facilitating access to employment, education, and services otherwise unreachable without personal vehicles.[183] Empirical data from urban travel surveys indicate that low-income individuals depend on bus transit for essential daily commutes, with bus modes comprising higher trip shares among this demographic compared to higher earners, underscoring buses' role in mitigating transport poverty in high-density areas.[184] [185] Accessibility for individuals with disabilities is bolstered by regulatory mandates and complementary services, such as ADA-compliant paratransit that provides origin-to-destination rides for those unable to board fixed-route buses due to physical or cognitive limitations. In 2017, major U.S. systems delivered approximately 3.5 million such paratransit trips, expanding mobility options beyond standard bus routes and enabling participation in community activities.[186] Fixed-route buses increasingly feature low-floor designs, kneeling mechanisms, and wheelchair ramps, directly aiding boarding for users with mobility impairments and reducing reliance on specialized vehicles; about 83% of paratransit registrants qualify as unable to use accessible fixed routes, highlighting the integrated system's value for this population.[187] While bus services reduce household transportation expenditures for dependent users by distributing fixed costs across multiple passengers—potentially easing the 30% income share low-income families allocate to mobility— their effectiveness is context-specific and not a panacea for all regions.[188] [189] In sprawling suburbs or rural areas, low population densities result in infrequent routes and unmet travel needs for carless residents, with only about 4% of rural dwellers lacking vehicle access yet facing acute service gaps.[190] Barriers including long wait times, insufficient ramps, and extended walking distances further limit universal applicability, particularly for those with disabilities, rendering buses indispensable in transit-oriented urban cores but inadequate as standalone solutions elsewhere.[191][192]Criticisms of Inefficiency and Systemic Failures
Public bus services frequently suffer from chronic delays, with on-time performance rates in major U.S. cities often falling below 80 percent under standard definitions that allow minimal lateness. For instance, in New York City, buses fail to arrive at stops on schedule 30 percent of the time, while express buses experience this issue 37 percent of the time. Similarly, analyses of systems like Los Angeles Metro and King County Metro reveal on-time rates dropping to 60-64 percent when accounting for stricter thresholds excluding excessive early arrivals. These figures reflect systemic issues such as traffic congestion, inadequate dedicated infrastructure, and operational rigidities inherent to scheduled public monopolies, which prioritize fixed timetables over adaptive routing.[37][193] Subsidies for public bus operations exacerbate inefficiencies by insulating providers from market discipline, leading to higher costs per passenger without corresponding improvements in service quality. In fiscal year 2023, U.S. governments expended $92.4 billion on public transit, with fares covering only $16.5 billion, implying an average operating subsidy exceeding $1 per unlinked trip across systems when divided by typical annual ridership volumes of around 5-6 billion trips. Economists from organizations like the Cato Institute argue that such subsidies distort resource allocation, favoring bureaucratic expansion over user-centric innovations, as public operators face reduced incentives to minimize costs or optimize routes absent competitive pressures. This contrasts with unsubsidized private transport modes, where fares more closely reflect marginal costs, promoting efficiency.[105][105] Door-to-door travel times for buses significantly lag behind private automobiles, often requiring 1.4 to 2.6 times longer for equivalent trips due to fixed stops, waiting periods, and walking accesses. Studies analyzing multimodal surveys confirm this disparity, attributing it to the inflexible nature of mass transit, which cannot match the point-to-point flexibility of cars, thereby reducing overall utility for time-sensitive users. State-sponsored monopolies compound this by underinvesting in demand-responsive adjustments, perpetuating a cycle where subsidies prop up underutilized capacity rather than fostering competitive alternatives.[194] Experiences with deregulation illustrate potential remedies to public sector failures, as seen in the United Kingdom following the 1985 Transport Act, which privatized operators and reduced subsidies outside London. Private firms achieved operational efficiencies through route innovations and cost controls, with per-passenger costs declining in competitive markets compared to pre-reform public monopolies burdened by overstaffing and rigid licensing. However, incomplete deregulation allowed residual market distortions, underscoring that full exposure to competition—rather than partial subsidies—drives superior performance over entrenched state control.[195][196]Recent Trends and Post-Pandemic Adaptations
Public transit bus ridership in the United States recovered to 85% of pre-pandemic levels by early 2025, according to data from the American Public Transportation Association (APTA), reflecting a gradual rebound amid persistent demand shortfalls.[197] Bus-specific ridership reached 81% of 2019 levels by December 2023, with slower recovery in commuter-oriented services due to structural shifts in work patterns.[198] This partial recovery stems from empirical patterns where transit use declined more sharply than private vehicle travel during remote work surges, as higher-income commuters shifted to hybrid models, reducing peak-hour loads by an estimated 10-20% in urban corridors.[199] [200] Agencies responded by streamlining operations, such as the Dallas Area Rapid Transit (DART) system's 2025 adjustments, which eliminated seven bus routes and reduced frequencies on others to align service with lower demand while prioritizing higher-frequency core lines.[201] These changes, effective from January 2025, aimed to cut inefficiencies but raised fares and sparked concerns over accessibility in low-density areas.[202] Concurrently, electrification accelerated, with electric bus sales comprising over 60% of new procurements in leading markets by 2025, driven by falling battery costs and federal subsidies under programs like the Bipartisan Infrastructure Law, though total fleet transitions lagged due to infrastructure bottlenecks.[154] [203] Persistent challenges undermined these adaptations, including driver shortages affecting 85% of U.S. transit agencies in 2024, which forced service cancellations and overtime reliance without resolving underlying wage and retention issues.[204] Funding gaps widened post-2021 relief packages, with agencies facing operating deficits as ridership failed to restore fare revenues to pre-2019 levels, prompting calls for sustained federal support absent ridership normalization.[205] [79] Pilot integrations of digital tools for demand-responsive routing showed variable efficacy, often yielding cost savings only in dense pilots but highlighting the need for broader operational reforms to achieve viability.[206]References
- https://www.[researchgate](/page/ResearchGate).net/publication/272371109_Optimization_Model_for_Headway_of_a_Suburban_Bus_Route
- https://www.[quora](/page/Quora).com/How-fast-can-a-city-bus-travel-without-stopping-for-passengers