Hubbry Logo
Tram stopTram stopMain
Open search
Tram stop
Community hub
Tram stop
logo
8 pages, 0 posts
0 subscribers
Be the first to start a discussion here.
Tram stop
Tram stop
from Wikipedia
Tram stops can range from purpose-built, tram-exclusive infrastructure similar to conventional train stations (example in Lyon), ...
... over stops threaded into narrow urban environments (here in Hong Kong)...
... to simple stops within a public road (here in Frankfurt am Main).

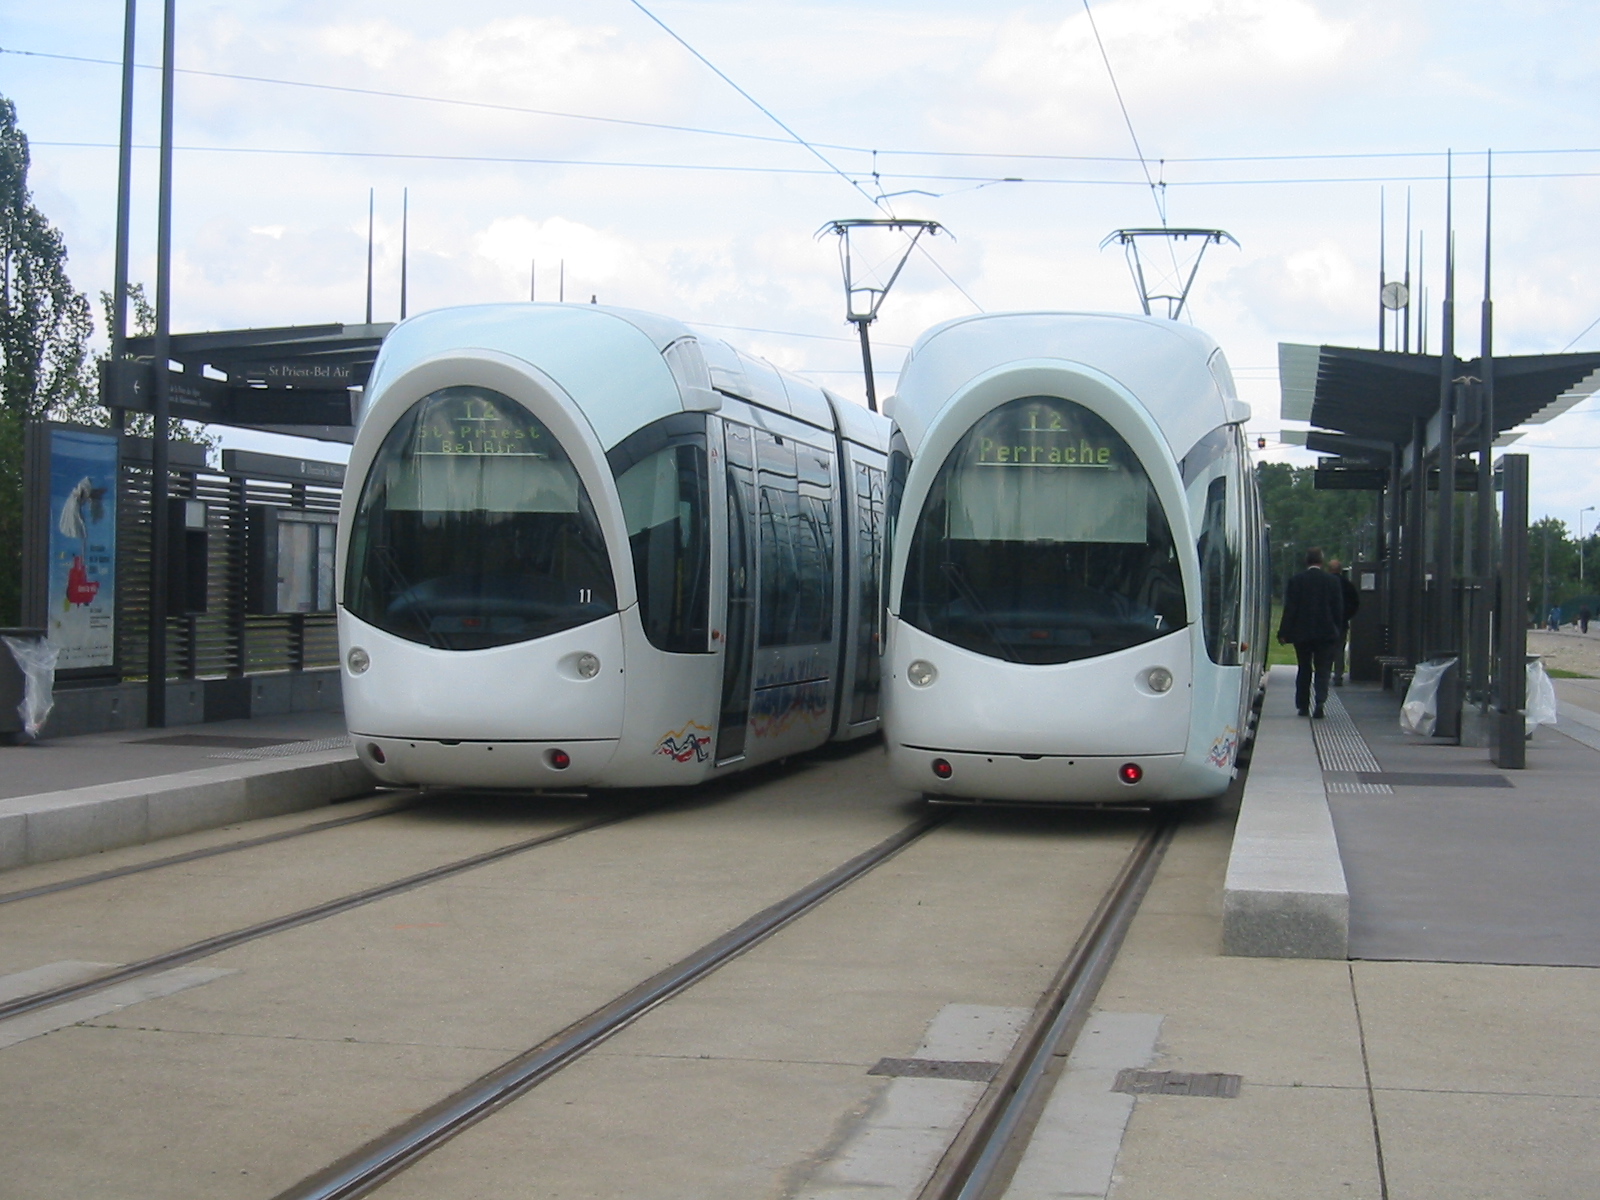
A tram stop, tram station, streetcar stop, or light rail station is a place designated for a tram, streetcar, or light rail vehicle to stop so passengers can board or alight it. Generally, tram stops share most characteristics of bus stops, but because trams operate on rails, they often include railway platforms, especially if stepless entries are provided for accessibility. However, trams may also be used with bus stop type flags and with mid-street pavements as platforms, in street running mode.

Types of tram stops

[edit]

Tram stops without platforms

[edit]

Many tram or streetcar stops, especially on older tram lines street-running on narrower streets, have no dedicated platforms. Instead, stops are located in the middle of the roadway. Passengers need to cross lanes for motor vehicles to board or alight from trams.

Examples of systems with this type of stops include:

North America

Europe

Oceania

Asia

In most jurisdictions, to protect passengers' safety, at stops without a safety zone or designated platform, traffic cannot legally pass a tram or streetcar whose doors are open.[1][2][3]

Tram stops with high-level platforms

[edit]

Several light rail systems have high-platform stops or stations with dedicated platforms at railway platform height. Reasons for this include systems being created from former heavy rail routes (as in the case of the Metrolink system in Greater Manchester, England), or to provide a more rapid transit-like commuting experience (such as the Metro Rail system in Los Angeles, California). Such trams also stop at dedicated platform stops on Stadtbahn systems in Germany, especially in underground stations in city centres.

Tram stops with mixed-level platforms

[edit]

Several tram stops have mixed platform heights for various reasons.

Photo taken from the high-level platform of Forepark Station, showing passengers boarding a tram from the low-level platform

In The Hague, Netherlands, on tram lines 3, 4, and 34, between Laan van NOI and Leidschenveen stops, platforms feature mixed heights to accommodate both the high-floor Rotterdam Metro line E and the low-floor standard tram vehicles.

Platforms of Boileau premetro station, showing the dual platform heights

Some stops in the pre-metro network in Brussels feature high platforms with cutouts along the edge. This allows passengers to board low-floor trams while maintaining the potential for future upgrade to full-scale metro operations. The cutouts act as access points for low-floor vehicles, ensuring the station can easily transition to a fully high-platform configuration when necessary.

The Muni Metro system in San Francisco utilizes high-floor light rail vehicles (LRVs). To ensure accessibility for wheelchair users, many street-level stations feature ramps for level boarding. Non-wheelchair users, however, access the LRV by climbing the interior steps from the street-level platform.

Tram stops with triangular platforms

[edit]

Triangular tram stops, where three tracks form a single triangular platform in the middle, are possible due to the shorter length of trams compared to heavy rail trains which does not require an excessively large area. Notable examples of triangular tram stops include platforms 1, 4, and 5 at Siu Hong stop on the Hong Kong Light Rail, and tracks A1, B1, and C1 at Königsplatz on the Augsburg Tram system.

Siu Hong Stop of Hong Kong Light Rail, showing the triangular platform in the middle

Such configuration allows cross-platform interchange across three lines as opposed to two on traditional island platforms, increasing the likelihood of convenient cross-platform transfers.

However, triangular tram stop layout necessitates three flat junctions immediately at each end of the platform, introducing additional operational complexities and the potential for delays, particularly during periods of heavy tram traffic, as a tram heading in one direction may have to wait for trains heading in another direction to clear the junction before it can cross. In addition, to reach the platforms, trams must make sharp turns, typically by about 30 degrees, which poses issues such as slow speeds and noise.

Sunday tram stops

[edit]

Not all tram stops are served full-time. In the 1920s, Toronto created Sunday stops in addition to regular stops along its streetcar routes. Sunday stops were only used on a Sunday and, with few exceptions, were always near a Christian church. There were also a few Sunday stops near subway stations that were usable only before 9 am, the Sunday opening time of the subway system. However, the Toronto Transit Commission decided to close all Sunday stops on June 7, 2015. The TTC found that Sunday stops slow down streetcars making it more difficult to maintain schedules. Also, Sunday stops were also unfair to non-Christian places of worship which never had the equivalent of a Sunday stop. By 2015, most Sunday stops were along current and former streetcar routes.[4]

Tram stops with platform screen doors

[edit]

The Dubai Tram, which opened on 12 November 2014,[5] became the world's first tram system to feature platform screen doors at its tram stops. Lussail LRT and Tel Aviv Light Rail both have platform screen doors at underground stops.

See also

[edit]

References

[edit]
Revisions and contributorsEdit on WikipediaRead on Wikipedia
from Grokipedia
A tram stop is a designated point along a tramway or route where trams pause to enable passengers to board and alight, typically marked by signage, shelters, or raised platforms integrated into the urban streetscape. These stops are engineered to balance passenger throughput, vehicle dwell time, and interaction with adjacent vehicular and , often featuring elements like for the visually impaired and real-time information displays. Tram stop configurations include curbside stops along the edge of travel lanes, far-side stops positioned after intersections to reduce conflicts with turning vehicles, and or stops in dedicated rights-of-way for enhanced separation from road . Far-side placements are generally preferred for their potential to improve signal progression and safety, though near-side stops may be used where right-turn lanes or geometric constraints demand it. Platform designs, such as low-floor alignments or speed humps, facilitate level or near-level boarding, which empirical studies link to shorter dwell times and higher system capacity. Safety considerations dominate tram stop engineering, with features like pedestrian refuges, crash barriers, and prohibition of adjacent parking to mitigate collision risks from vehicles or errant trams. In dense urban environments, stops must accommodate bicycles, emergency access, and lighting to prevent accidents, while standards mandate compatibility with surrounding infrastructure like crossings and bike paths. Effective tram stops contribute to the viability of as a high-capacity, low-emission transit mode, though suboptimal designs can exacerbate delays or hazards in mixed-traffic corridors.

Overview

Definition and Basic Function

A tram stop is a designated on a tramway where vehicles halt to permit s to board or alight. This distinguishes it from continuous track sections, with stops typically marked by , , and sometimes physical to signal halting points to operators and users. The primary function of a tram stop is to enable efficient exchange in urban settings, where trams operate on fixed rails embedded in streets, often sharing space with vehicular and . Stops facilitate this by providing raised platforms in many systems, aligning tram floor heights—typically 300-900 mm above rail level—with access for level boarding, which reduces dwell times to 20-40 seconds per stop and improves accessibility for those with mobility aids. Supplementary elements, such as shelters, real-time information displays, and , protect users from weather and aid navigation, enhancing system reliability and throughput in high-density routes where trams can carry 100-300 s per vehicle. In operation, tram stops integrate with broader transit networks by supporting frequent service intervals—often 3-10 minutes in peak urban demand—and closer spacing of 400-800 meters compared to heavier rail, optimizing short-haul connectivity while minimizing footprint. This design prioritizes causal efficiency in passenger flow, as fixed tracks enforce precise alignment, unlike bus stops, thereby lowering operational variability and supporting capacities up to 10,000 passengers per hour per direction in established networks.

Distinctions from Bus and Rail Stops

Tram stops differ from bus stops in their fixed infrastructure tied to embedded rail tracks, which necessitate precise alignment of platforms or boarding areas with the rails to minimize the step gap for passengers, whereas bus stops rely on flexible roadway markings and signage without dedicated tracks, allowing buses to position variably at curbside locations. This rail dependency enables tram stops to incorporate level or near-level boarding on low-floor vehicles, reducing dwell times compared to the variable heights and door alignments typical at bus stops, where buses often require steps or ramps. Bus stops, by contrast, prioritize minimal intervention in road surfaces, typically featuring shelters, benches, and real-time displays without the overhead catenary wires or track maintenance access required at tram stops. In comparison to stops or stations, tram stops are generally simpler and more integrated into urban streetscapes, lacking the extensive , signaling systems, and high platforms designed for higher-speed mainline or operations that demand greater safety buffers for and freight. stops often include ballasted tracks, extensive platform edging for high-floor trains traveling up to 160 km/h or more, and dedicated underpasses or overpasses to handle larger volumes at fewer, spaced-out locations—typically 1-2 km apart—while tram stops support frequent halts every 300-500 meters in mixed traffic environments with speeds under 50 km/h. This results in tram stops emphasizing quick urban access with sidewalk-adjacent platforms rather than the enclosed concourses and ticketing halls common in to manage or regional flows.

Historical Evolution

19th-Century Origins

The origins of tram stops emerged alongside the development of horse-drawn urban tramways in the early , as cities sought efficient mass transit beyond omnibuses and walking. The first regular horse-drawn streetcar service began operating in on November 14, 1832, under the New York and Harlem Railroad, running along Fourth Avenue from Prince Street to 14th Street with cars pulled by two or three horses each. These vehicles halted at fixed intervals or upon passenger signals, establishing rudimentary stopping points directly on street-level tracks without dedicated platforms, shelters, or markings, as boarding occurred curbside amid mixed road traffic. Preceding this urban innovation, the Swansea and Mumbles Railway in Wales initiated the world's first horse-drawn passenger tram service in 1807, transporting up to 180 passengers over 8.9 kilometers between Swansea and Mumbles, with stops at intermediate points such as Oystermouth Road stations for local access. However, its semi-rural alignment on reserved tracks distinguished it from the street-integrated systems that defined modern tram stops, where vehicles shared roadways with other traffic and halted frequently for short-haul urban trips. In the United States, rapid adoption followed, with Baltimore launching a line in 1835 and Philadelphia in 1857, each featuring similarly basic halts spaced every few blocks to serve dense populations, reflecting causal demands for frequent, on-demand access over long-distance rail precedents. By the 1860s and 1870s, European cities emulated this model, with , , opening a horse-tram line in 1860 and inaugurating its first in 1853 along the right bank of the , where stops evolved to include informal waiting areas at key intersections to manage increasing volumes—New York alone had over 100 miles of track by 1870, necessitating more predictable stopping protocols for operational efficiency. These early configurations prioritized simplicity and cost, using gravel or unpaved surfaces for alighting, but laid the groundwork for later by institutionalizing designated locations that separated passenger activity from general street flow, driven by empirical needs for safety and throughput in growing metropolises.

20th-Century Expansion and Standardization

The of tram systems in the late 19th and early 20th centuries drove extensive network expansions, with stops evolving from rudimentary horse-car halts to more structured facilities integrated into growing urban infrastructure. , electric streetcar track mileage surged to approximately 45,000 miles by 1917, serving suburban development and connecting city centers to outlying areas in over 500 communities. Similar growth occurred in , where cities like and extended lines during the to accommodate population booms, often standardizing stop intervals at 300-500 meters for efficient service. Standardization efforts intensified in the 1910s-1930s to enhance safety and amid rising automobile interference. The Birney "Safety Car," introduced in 1915, featured automatic door interlocks that required vehicles to halt fully at designated stops, influencing stop designs to include clear boarding zones and reducing accidents from premature departures. By the , many North American cities adopted concrete safety islands or painted zones adjacent to tracks, separating pedestrians from motor traffic; for instance, implemented such zones systematically after 1925 to mitigate collision risks at stops. The 1936 Presidents' Conference Committee (PCC) streetcar design further promoted uniformity, with standardized low-step entrances (14 inches above rail) necessitating compatible platform heights and curb alignments at stops, adopted across 33 U.S. systems totaling over 4,500 cars by 1945. In , regulatory bodies like Germany's DIN standards from specified shelter dimensions and for visibility, while prepayment enclosures at major stops—seen in Boston's 1927 Dorchester extensions—streamlined passenger flow and reduced dwell times. These developments prioritized causal factors like traffic density and vehicle reliability over aesthetic concerns, though maintenance challenges foreshadowed mid-century declines.

Post-1950s Decline and Contemporary Revival

Following , tram systems in numerous Western cities underwent rapid decline, resulting in the widespread removal of tracks and associated stops. This shift was primarily driven by the ascendancy of personal automobiles, which prioritized individual mobility and suburban expansion, alongside motorized buses that offered operational flexibility without fixed infrastructure. In the United States, escalating maintenance costs for aging streetcar networks, coupled with declining revenues amid competition from increasingly affordable cars, led to the abandonment of most systems by the early . Similarly, in the , municipal policies in the viewed trams as obstacles to traffic, prompting closures such as London's final tram service in 1952 and the subsequent ripping up of tracks to facilitate bus operations and road expansions. In , while some networks persisted—particularly in and parts of —many cities followed suit, replacing trams with buses to align with car-centric and subsidized highway development. The decline directly impacted tram stops, which were dismantled alongside the rails, eliminating dedicated passenger waiting areas in favor of curbside bus halts lacking specialized infrastructure. Economic factors, including the lower capital costs of buses and the political influence of automotive interests, accelerated this transition, though empirical assessments later revealed that tram removal often correlated with increased traffic congestion and reduced public transit efficiency in dense urban cores. From the 1980s onward, tram systems experienced a notable revival, particularly in , driven by recognition of their capacity to alleviate urban congestion, reduce emissions, and integrate with pedestrian-friendly city designs. pioneered this resurgence, with inaugurating a new tram line in 1985 and following in 1987, sparking a wave that saw approximately 25 cities restore or construct modern networks by the 2020s. These systems featured upgraded stops with raised platforms for level boarding, enclosed shelters, and real-time information displays, enhancing passenger safety and dwell times compared to earlier curb-based designs. In the United States, the adoption of —evolving from streetcar concepts—began with San Diego's Trolley in 1981, marking the start of over a dozen similar projects by the 1990s that incorporated dedicated stops with improved accessibility features. The also reintroduced trams in cities like (1992) and (1994), with stops designed for segregation from road traffic via priority signaling and median platforms. Globally, since 2000, nearly 200 cities have launched new tram networks, emphasizing stops that support high-capacity operations, for access, and multimodal integration with and walking paths. This contemporary phase reflects causal advantages of fixed-guideway systems in promoting reliable service frequencies and urban density, countering earlier automobile dominance through evidence-based planning.

Physical Design and Configurations

Platform Types and Levels

Tram stop platforms are classified by configuration and height to optimize passenger access, safety, and integration with urban infrastructure. Side platforms, positioned alongside a single track, provide boarding access from one face and are prevalent in street-running environments where space constraints limit wider setups; minimum widths range from 2785 mm to 3100 mm, with designs incorporating drainage away from tracks and accessibility ramps at gradients no steeper than 1:14. Island platforms, located between dual tracks, enable dual-sided loading and reduce pedestrian exposure to roadway traffic by centralizing waiting areas; these require minimum widths of 4200 mm for single-sided use or 6500 mm for dual-sided, often with central drainage strips and offset distances of 545-700 mm from the rail edge to accommodate door alignments. Platform heights are engineered to match vehicle floor levels, prioritizing low elevations for compatibility with modern low-floor trams that feature door sills at 300-350 mm above the rail. In Australian systems, such as those operated by Yarra Trams and Torrens Connect, standard heights are 285-290 mm above the top of the rail, ensuring horizontal gaps under 75 mm and vertical alignments within ±3-5 mm for wheelchair access per AS 1428 standards, while tactile ground surface indicators (TGSI) are placed 300 mm from the edge. European low-floor tram platforms similarly adopt 300-350 mm heights to minimize step-up distances, facilitating faster boarding in mixed-traffic settings without extensive track modifications. High platforms, exceeding 600 mm, are rarer in tram systems and typically reserved for fully grade-separated alignments or legacy high-floor vehicles, as they demand greater civil works but support precise level boarding with gaps under 25 mm, reducing slip risks in high-volume operations. Variations include kerb extensions or median platforms, which extend low-height curbs into roadways for bulb-style stops, maintaining 3100 mm widths and restricting adjacent traffic speeds to 10 km/h in shared zones to mitigate collision hazards; these configurations preserve capacity on narrow streets while enhancing pedestrian segregation. Platform lengths standardize at 33-45 m to accommodate 2-3 cars, with provisions for extension to 70 m in growing networks, ensuring clearance zones of at least 1200 mm for circulation and compliance with disability access codes like DSAPT 2002.

Supplementary Infrastructure

Shelters at tram stops offer protection from weather elements and often integrate seating, lighting, and information displays to improve passenger comfort. In Melbourne's network, shelters must be positioned within 10 meters of boarding points, cover at least 50% of the canopy area during a 95th rain event, and provide minimum clearances of 1800 mm from the platform edge and 1120 mm from the rail to accommodate trams. These structures typically include lockable power switches and vandal-resistant materials like , adhering to Disability Standards for Accessible (DSAPT) 2002. Lighting fixtures maintain visibility and security, with downward-oriented luminaires to reduce glare. Yarra Trams specifies minimum of 20 across platforms and 150 beneath shelters, compliant with Australian Standards AS 1158 for areas and AS 1428.2 for accessible facilities. In Edinburgh's tram system, lighting emphasizes ambient multi-height illumination coordinated with , minimizing spillage while ensuring color rendition and vandal resistance, integrated into access routes for all conditions. Seating arrangements prioritize , featuring benches at heights per DSAPT standards with 500 mm under-seat clearance and contrasting armrests for priority areas. At least two priority seats or 5% of total seating must be provided at qualifying stops longer than 60 meters. Expert evaluations from Polish tram systems confirm benches greatly enhance functionality with minimal safety trade-offs, while shelters moderately boost both. Signage and systems include totems or flag posts mounted 1400-1600 mm high, displaying stop names, routes, timetables, and real-time arrivals per operator style guides. guidelines mandate minimal, clutter-free designs using contrasting colors, pictograms, and per ISO standards, with illuminated stop names and no to preserve from seating or distant points. Passenger boards, including audio buttons at accessible heights, further support navigation, though they may slightly reduce perceived safety due to potential crowding. Additional amenities encompass card vending machines centrally placed under shelters for high-traffic access, waste bins as operator-specified, and cycle parking stands near platforms without encroaching on waiting areas. Barriers or around stop areas, along with detectable warning lanes, prioritize in mixed environments, as evidenced by strong consensus on their . Designs align with local standards like Edinburgh's Streets for Streets and DfT Inclusive Mobility, emphasizing vandal-proof, context-sensitive integration over standalone features.

Site-Specific Adaptations

Tram stops are engineered to integrate with local , , and infrastructural constraints, necessitating variations in platform , alignment, and protective features to ensure operational efficiency and safety. In constrained urban environments with narrow streets, designs often incorporate curb extensions or "bulb-outs" that protrude into the roadway to shorten distances and provide space for low-floor trams to achieve near-level boarding without extensive excavation. These adaptations, as implemented in Melbourne's "easy access stops," utilize raised speed humps or cushions integrated into the street surface, elevating the platform to match tram door heights while calming adjacent traffic speeds to under 10 km/h. In areas with high vehicular traffic volumes, or platforms are preferred, separating tracks from curbside lanes to reduce conflict points, as outlined in guidelines for on-street stations where platform widths are scaled to site-specific right-of-way availability, typically ranging from 2 to 4 meters. For instance, Sydney's projects tailor stop architectures to accommodate varying intersection geometries and building setbacks, incorporating modular canopies and adjusted for local soil conditions and future developments like adjacent high-rises. Such site-responsive elements mitigate risks from turning vehicles, with empirical testing showing a 20-30% reduction in near-miss incidents compared to traditional curbside configurations. Topographical challenges, such as slopes exceeding 3-5%, prompt adaptations like segmented platforms with anti-slip surfacing or hydraulic leveling mechanisms, particularly in undulating terrains where standard alignments would compromise stability. In Zurich's Limmatplatz station, the design harmonizes with riverine zones and multi-modal hubs by elevating structures on piled and integrating buffers to manage runoff, demonstrating how environmental site factors dictate material choices like corrosion-resistant over . Rural or peri-urban extensions, though less common for trams, adapt stops with extended zones for demand-responsive services, incorporating park-and-ride facilities sized to local vehicle ownership rates, which can exceed 80% in low-density areas. Heritage or ecologically sensitive sites further customize designs to minimize visual and structural impacts, such as embedding stops flush with pavements or using bi-directional to eliminate turnaround loops in space-limited historic districts, enhancing throughput without altering street grids. These adaptations prioritize causal factors like soil bearing capacity and , with geotechnical assessments ensuring long-term durability; for example, coastal installations employ elevated tracks to counter , as evidenced in systems exposed to saline environments where untreated corrodes at rates up to 0.1 mm/year. Overall, site-specific balances these variables through iterative modeling, yielding stops that align operations with immutable local realities rather than uniform templates.

Operational and Integration Aspects

Passenger Flow and Capacity Management

Passenger flow at tram stops encompasses the processes of alighting, boarding, and queuing, which critically determine dwell times—the duration a remains stationary—and thus constrain overall line capacity. Dwell times typically range from 15 seconds for low passenger volumes (up to 200 per hour or fewer than 20 per ) to longer durations with higher loads, as passenger exchange dominates over fixed operations. Empirical models derive dwell time as a base period (e.g., 5-10 seconds for ) plus 2-4 seconds per boarding or alighting , influenced by factors like count and vehicle floor height. Low-floor trams reduce these times by 20-30% compared to designs through faster, step-free access, enabling higher throughput in urban settings. Capacity management strategies prioritize minimizing bottlenecks via design and operational tweaks. systems and all-door boarding facilitate parallel flows, cutting dwell variability by allowing passengers to distribute across multiple entry points rather than funneling through front doors. Platform lengths matching sizes (often 30-40 meters for modern units) prevent overflow queues, while wider platforms (minimum 2-3 meters) accommodate circulation without impeding dwell. In high-demand corridors, double-stop configurations—where trams occupy adjacent berths—can boost stop capacity by 20-50% by enabling overtaking and reducing constraints, as validated in studies of European networks. However, stop capacities remain 3-10 times below adjacent potentials due to - interactions, underscoring the need for segregated waiting areas. Operational integration further enhances flow, including real-time passenger counting via automatic systems to predict and adjust dwells dynamically. Scheduling avoids peak-hour bunching, where cumulative delays amplify flows; for instance, headways under 5 minutes demand precise alighting priority to sustain 1,000-2,000 passengers per hour per direction. Vulnerabilities arise in mixed-traffic environments, where encroachments extend dwells by 10-20%, but dedicated tram bulbs mitigate this by aligning platforms flush with vehicle doors for streamlined exchange. These measures, grounded in microscopic simulations, ensure tram stops support reliable service without over-reliance on expansive infrastructure.

Signaling and Scheduling Integration

In tram systems, signaling and scheduling integration at stops primarily involves coordinating traffic signal priority mechanisms with timetable adherence to minimize delays during dwell times for passenger boarding and alighting. Transit signal priority (TSP) systems detect approaching trams via transponders or GPS and adjust intersection phases—near or at stops—to extend green phases or shorten opposing ones, thereby reducing stoppage times that could compound scheduling disruptions. This integration is achieved through active priority, which dynamically alters signal timings based on real-time tram arrival data, or passive priority, which pre-synchronizes signals into "green waves" aligned with scheduled tram headways, such as 5-10 minute intervals in urban corridors. Optimization models, often formulated as mixed-integer linear programs, jointly refine departure intervals and signal offsets to balance on-time performance against spillover delays to road . For instance, these models account for dwell times averaging 20-40 seconds at stops and prioritize strategies that limit green extensions to 5-10 seconds per actuation, preserving overall cycle lengths of 60-120 seconds at mixed-use intersections. Empirical implementations, such as in European networks, demonstrate 10-20% reductions in average travel times through such coupled adjustments, though benefits diminish in high-density where signal holdovers exceed 15% of cycles. Real-time vehicle location data from automatic vehicle location (AVL) systems feeds into these models, enabling adaptive rescheduling if priority grants fail due to conflicts, ensuring regularity within 1-2 minutes of nominal schedules. Challenges arise from causal trade-offs: excessive TSP activation can increase road vehicle queues by 5-15%, prompting hybrid controls that condition priority on tram lateness thresholds (e.g., >30 seconds behind ) or loads detected via onboard sensors. In street-running stops, integration extends to block signaling within tracks, where stop sections are treated as occupied blocks during dwells to prevent rear-end approaches, synchronized with external signals via logic compliant with standards like EN 50128 for safety integrity levels up to SIL 2. Recent studies emphasize , using historical delay data to preemptively offset against anticipated signal interactions, yielding up to 15% improvements in energy efficiency by avoiding unnecessary accelerations post-stop. Such systems, deployed in over 30 cities globally as of 2022, underscore the empirical priority of data-driven calibration over static rules to maintain causal reliability in mixed environments.

Interactions with Road Traffic

Tram stops in mixed-traffic corridors require coordinated operations to manage conflicts between stationary trams, alighting passengers, and vehicles, often leading to designs that permit cars to pass on adjacent lanes while enforcing yielding rules. In such setups, vehicles are typically prohibited from stopping on tracks but may stopped trams at speeds not exceeding 40 km/h in many jurisdictions, with priority granted to trams upon departure to prevent rear-end or sideswipe incidents. Near-side stops, positioned before intersections, allow trams to halt without blocking cross traffic but increase vulnerability to right-turning vehicles failing to yield, whereas far-side stops minimize this by positioning dwell after signals, though they can exacerbate road queuing if trams dwell longer than anticipated. Tram signal priority mechanisms, activated via track circuits or GPS, extend green phases or truncate red ones for intersecting roads by 5-10 seconds, reducing tram stop-to-start delays by up to 20% in tested systems while balancing vehicular flow through conditional activation based on schedule adherence. Bulb-out or platforms protruding into the create physical separation, shortening exposure to by 2-4 meters per crossing and visually cueing drivers to slow, with empirical observations showing a 15-30% reduction in vehicle encroachment near stops compared to inline configurations. In median-track operations, where trams run centrally, rear-door alighting demands passengers navigate multiple lanes, prompting supplementary measures like protected crossings or temporary barriers during dwell periods to mitigate multi-directional conflicts. Traffic management integrates tram dwell times into signal timing models, with dynamic adjustments via inductive loops detecting tram positions to prevent ; for instance, in corridors with 2-5 minute headways, priority can increase tram speeds by 10-15 km/h without proportionally delaying buses or cars if offsets maintain green waves for all modes. relies on mandating 3-meter clearances for and audible warnings from trams signaling imminent movement, addressing causal factors like driver inattention in 40-50% of observed near-misses at stops.

Safety and Risk Mitigation

Collision Reduction Measures

Platform tram stops, which elevate the boarding area to align with tram floor levels, have demonstrated effectiveness in reducing collisions in mixed-traffic environments. A before-after crash study in , , found that installing platform stops and easy-access configurations led to a 62% reduction in car- collisions and a 12% decrease in car-tram collisions at treated sites, attributed to the physical separation provided by raised curbs that deter vehicle encroachment and improve visibility. Similarly, overall pedestrian-involved injury crashes at these stops declined by 43%, as the design minimizes unsafe crossing behaviors near active tracks. Safety railings and bollards installed along tram stop perimeters serve as physical deterrents to prevent vehicles and s from entering track zones during boarding and alighting. In , , the introduction of such railings at high-risk stops addressed frequent pedestrian incursions, contributing to lower collision rates by channeling foot away from rails and reducing side-swipe incidents with overtaking vehicles. These fixed barriers, often combined with for the visually impaired, enforce spatial separation without relying on behavioral compliance alone, though their efficacy depends on consistent enforcement against illegal parking or maneuvering. Tram signal and lane priority systems integrate stops into broader traffic control, prioritizing tram movements to avert rear-end or crossing collisions. An empirical Bayes evaluation in revealed that signal priority measures reduced total crashes by 13.9%, while dedicated tram lanes achieved a 19.4% drop, particularly benefiting stop-adjacent intersections by minimizing dwell-time conflicts with turning vehicles. Pavement markings such as "Stop Here" lines and lighted stop bars further enhance these systems by alerting drivers to yield zones, with light rail studies showing decreased non-compliance at grade crossings near stops. Passive warning measures, including illuminated and audible alerts at stops, target and cyclist distractions in urban settings. Research on tram- interfaces emphasizes that combining visual cues with barriers yields synergistic effects, as standalone signs alone insufficiently curb risky behaviors like amid departing . Empirical data from mixed-traffic tram networks indicate that such integrated interventions can lower on-path crashes by up to 16.4% when paired with , though gains vary by compliance rates and ambient conditions like nighttime visibility.

Empirical Data on Incident Rates

A substantial proportion of tram-related pedestrian incidents occur at or near stops, where boarding, alighting, and crossing activities converge with maneuvers. In Melbourne's tram network, 82 percent of incidents in the vicinity of stops involved s, comprising 37 out of 45 analyzed cases. Similarly, analyses in , , identified tram stops as the primary location for serious injuries, accounting for the majority of events, with trams responsible for 48 percent of all traffic injuries and fatalities. In U.S. and streetcar systems, 42 percent of injuries stemmed from incidents involving passengers waiting for or leaving trains at stations. System-wide train-to-person collision rates averaged 68.14 per 100 million revenue miles (VRM) in 2013, with fatalities at 13.25 per 100 million VRM, though station-specific contributions elevate localized due to . In , tram-pedestrian accidents number approximately 100 annually, with a of 1.4 incidents per million kilometers traveled, predominantly resulting in minor injuries (0.9 per million km) but including severe cases (0.5 per million km); low-speed collisions near stops characterize many of these. Severity distributions underscore stop-related vulnerabilities: across European tram-pedestrian collisions, 3 percent are fatal, 23 percent severe, and 74 percent minor, often at low speeds proximal to stops. Platform stop implementations in mixed-traffic environments, such as , have demonstrated reductions in adjacent collision rates, including 62 percent fewer car-pedestrian crashes and 12 percent fewer car-tram crashes, indicating baseline elevations at traditional stops. Over 2012–2023 in , pedestrians featured in 196 of 639 total tram crashes (31 percent), with 46 percent of all crashes yielding injuries, highlighting persistent but quantifiable risks.

Vulnerabilities in Mixed-Traffic Environments

Tram stops in mixed-traffic environments, where trams operate on streets shared with automobiles, cyclists, and pedestrians without full segregation, expose users to heightened collision risks stemming from spatial conflicts and behavioral interactions. At stops, trams halt in the travel lane, requiring passengers to board or alight amid flowing traffic, which can lead to pedestrians stepping into vehicle paths or vehicles unsafely. Intersection designs exacerbate these issues, as turning motorists often fail to anticipate tram resumption, resulting in side-swipe or head-on collisions. Empirical analyses from systems like Melbourne's reveal that suboptimal platform arrangements and inadequate signaling contribute substantially to incident rates, with trams' fixed tracks limiting evasion options compared to agile vehicles. Pedestrian vulnerabilities predominate near stops, where alighting or crossing behaviors intersect with tram movements. In , 82% of tram incidents proximate to stops involved pedestrians between 2012 and 2023, often at low speeds but yielding severe outcomes due to trams' mass and momentum. Similarly, data indicate trams cause 48% of pedestrian traffic injuries and fatalities, underscoring causal factors like partial visibility obstruction by tram bodies and underestimation of tram approach speeds by walkers. Across analyzed datasets from , , and totaling 7,535 tram-pedestrian crashes, lower limb and head injuries rise with impact velocities above 10 km/h, with fatality risks at 50 km/h impacts 2.5 times higher for trams than cars owing to underride dynamics and lack of . Vehicle-tram collisions at stops arise primarily from motorists encroaching on tracks during overtakes or turns, amplified by mixed flows where trams block lanes. Studies in mixed-traffic light rail contexts report auto-tram conflict rates persisting post-infrastructure tweaks, with before-after evaluations showing only modest 12-25% reductions in such incidents despite platform extensions, as drivers misjudge tram dwell times or priority. In Dutch urban tram networks, vulnerable road user accidents per kilometer traveled are 12 times higher in shared streets than dedicated alignments, driven by alignment types and pedestrian crossing proximity. Cyclists face distinct hazards, such as wheel entrapment in tracks during maneuvers around stopped or by alighting passengers. Market surveys of cyclists highlight perceived risks from tram grooves and squeezes in constrained lanes, with crash data from indicating 40 cyclist-involved tram incidents amid 639 total over five years, often at stops where cyclists filter through queues. Road users broadly underestimate tram crash probabilities, perceiving them as low despite evidence of elevated severity in mixed settings.

Accessibility Standards and Challenges

Regulatory Requirements

In jurisdictions with established public transit regulations, tram stops must incorporate features enabling independent access for passengers with mobility, visual, sensory, or cognitive impairments, such as level or low-gradient platforms, tactile warnings, and clear . These requirements typically stem from anti-discrimination laws mandating equivalent access to fixed-route services, with non-compliance risking legal penalties or ineligibility. In the United States, the Americans with Disabilities Act (ADA) of 1990, implemented through (DOT) rules in 49 CFR Parts 37 and 38, requires tram and stops—classified under fixed-guideway systems—to meet minimum standards for new construction, alterations, and key existing stations. Platforms must facilitate level boarding where feasible, limiting horizontal gaps between vehicle doors and platform edges to no more than 3 inches (76 mm) and vertical differences to 3/4 inch (19 mm) at key stations; where full level access is impracticable, bridge plates or mini-high platforms are mandated. Detectable warning strips—contrasting, truncated dome surfaces at least 24 inches wide—must be installed along the platform edge facing the track to prevent falls by visually impaired users, per ADAAG Section 810.5. Tactile signage, audible platform announcements, and clear path widths of at least 36 inches for maneuvering are also required, with retrofits coordinated to minimize disruptions. European Union member states implement accessibility via national laws harmonized with directives like the 2019 (Directive (EU) 2019/882), which from June 28, 2025, mandates accessible public transport services including urban rail infrastructure, requiring features such as low-floor vehicle compatibility, haptic and audio-visual aids, and unobstructed pathways. For trams, Technical Specifications for Interoperability (TSIs) under Regulation (EU) No 321/2011 emphasize safe boarding, often specifying platform heights aligned to vehicle floors (typically 300-350 mm above rail) and edge protections like per EN 17210 standards. Compliance varies nationally—e.g., Germany's Barrier-Free Transport Ordinance requires 100% accessible stops in new systems—but all prioritize non-discriminatory access under the UN Convention on the Rights of Persons with Disabilities, ratified by the EU in 2010. Internationally, bodies like the International Union of Public Transport (UITP) advocate aligned standards, including ISO 21542 for building accessibility adapted to stops, such as contrasting markings for the visually impaired and reserved spaces for mobility aids, though enforcement relies on local codes. Empirical audits, such as those by the , reveal that gaps exceeding regulatory limits correlate with higher denial-of-service rates for users, underscoring the need for verifiable compliance documentation during planning and inspections.

Implementation Barriers

High costs represent a primary barrier to implementing upgrades at stops, with individual level-access stop constructions often ranging from $2 million to $4 million due to required infrastructure modifications such as platform extensions and integrations. In systems like Melbourne's, where approximately 1,200 curbside stops lack platforms, to accommodate low-floor trams demands embedding stops into roadways, exacerbating expenses through excavation, drainage alterations, and temporary disruptions. Lack of dedicated streams further impedes progress, as seen in Victoria, , where only one stop received annually in 2017–18 and 2018–19, despite legislative targets requiring upgrades to over 1,200 stops by December 2022. Urban design and topographical constraints compound these financial hurdles, particularly in dense or historic environments where narrow widths, heritage restrictions, and mixed-traffic configurations limit feasible platform installations. Retrofitting street-level stops often necessitates reducing lane widths or altering traffic flows, which can decrease and vehicle speeds by 8–12% and heighten collision risks during construction. In many legacy networks, such as those in , even modernized stops fail to fully meet needs due to incomplete application of standards, resulting in persistent issues like inadequate ramps or tactile guidance that render facilities uncomfortable or unusable despite investments. Regulatory and procedural delays further slow implementation, including protracted stakeholder consultations, statutory approvals, and franchise agreement limitations that prevent bundling accessibility works with routine maintenance. Delivery rates remain inadequate—for instance, Victoria's annual upgrade pace of 21 stops falls short of the 68 monthly needed for compliance—exacerbated by data deficiencies in prioritization frameworks and insufficient coordination between operators and authorities. These systemic barriers often lead to partial or ineffective outcomes, where upgraded stops prioritize certain disabilities over others or overlook maintenance burdens on features like lifts and ramps.

Empirical Outcomes and Gaps

Empirical studies indicate persistent barriers at tram stops that limit usage by disabled passengers, including uneven pavements, absent or inadequate ramps, and gaps between platforms and vehicles exceeding 2 cm in height or width, which pose significant challenges for users. In Melbourne's network, spatial inequality results in 70% of the disabled population accessing only 22% of low-floor (accessible) trams, yielding a of 0.66 for distribution. A before-and-after evaluation of measures in Norwegian , including systems, reported a 2.5% increase in overall passenger numbers post-implementation, with qualitative case studies showing improved mobility for and visually impaired users when combined with reliable maintenance and staff assistance. Platform-style tram stops have demonstrated safety benefits that indirectly enhance ; installations in mixed-traffic environments reduced pedestrian-involved crashes by 43% and car-pedestrian collisions by 62%, facilitating safer boarding for mobility-impaired individuals without requiring full low-floor . "Easy access" stop designs, incorporating speed humps as pseudo-platforms, have proven cost-effective for enabling level boarding in streetcar conditions, though quantitative usage data remains limited to localized trials. However, these outcomes vary by context, with signal priority enhancements in Warsaw's network boosting job for peripheral users by up to several percentage points annually from 2015 to 2022, primarily benefiting those with mobility limitations through reduced wait times. Research gaps persist in quantifying long-term usage rates among disabled passengers following accessibility retrofits, with few longitudinal studies tracking behavioral responses beyond initial surveys. Systematic reviews highlight underrepresentation of non-physical disabilities, such as cognitive or sensory impairments, in tram stop evaluations, where focus remains on ramps and vehicle gaps despite evidence that information inaccessibility and exacerbate exclusion. Equity analyses reveal insufficient data on distributional effects, including how stop spacing and disproportionately affect low-income disabled populations, while methodological limitations—like reliance on self-reported barriers over observed behaviors—undermine causal inferences about intervention efficacy. Peer-reviewed literature also lacks comparative metrics across global systems, hindering generalizable insights into maintenance decay and cost-benefit realizations over decades.

Economic and Planning Considerations

Cost-Benefit Analyses

Dedicated tram stops, featuring raised platforms and integrated signaling, entail ranging from €1-5 million per stop for basic surface-level designs in European systems, escalating with features like elevators or extensive shelters. These figures derive from standardized light costs in , adjusted downward for simpler tram implementations without subsurface elements. Maintenance adds €50,000-100,000 annually per stop, covering cleaning, repairs, and lighting, as observed in and Australian tram networks where wear from mixed traffic accelerates degradation. Operational benefits include reduced dwell times by 10-20 seconds per stop via level boarding, enabling 10-15% higher throughput on high-frequency lines compared to curbside halts, per analyses of Melbourne's platform upgrades. Safety gains are empirically documented: platform stops in mixed-traffic environments lowered pedestrian collision rates by up to 40% versus legacy safety zones, attributing causality to separated waiting areas minimizing vehicle encroachment. However, these efficiencies diminish in low-density corridors, where ridership fails to amortize costs, yielding benefit-cost ratios below 1 in expansions like DART's outer lines. Broader economic impacts hinge on location; stops near employment hubs correlate with 5-18% property value uplifts within 0.25 miles, as evidenced by longitudinal studies in U.S. systems, fostering development valued at $1-2 billion cumulatively around stations. Yet, government-sponsored CBAs, such as Italy's tram-train evaluation, often project positive net present values (NPV >0) by emphasizing and modal shifts, while independent critiques highlight overstated ridership forecasts and neglected opportunity costs against (BRT), which delivers similar capacity at 40-60% lower per-mile expense ($20-30 million vs. $50+ million for ). Critically, systemic biases in academic and agency analyses—favoring capital-intensive rail due to institutional incentives for large projects—underplay burdens and limitations; for instance, U.S. operating costs exceed buses by 108% median premium, eroding long-term viability absent dense corridors exceeding 3,000 daily boardings per route-mile. Comparative CBAs, like those contrasting dedicated platforms to curbside operations, affirm and speed advantages but question , with European catenary-free trams yielding marginal NPVs only in metropolitan cores via reduced overhead infrastructure costs.

Urban Impact Assessments

Urban impact assessments of tram stops typically evaluate effects on property values, land use patterns, and socioeconomic dynamics through hedonic pricing models, difference-in-differences analyses, and spatial econometric studies. Empirical evidence indicates that proximity to tram stops often correlates with property value uplifts, with a UK study finding house prices increasing by approximately £16,878 for every kilometer closer to a tram stop, based on hedonic modeling of transactions near the Nottingham Express Transit system. Similarly, analyses of light rail extensions, akin to tram systems, report residential property values rising by 1.9% per 250 meters of increased proximity to stations, reflecting capitalization of transit access into land prices. However, pre-operational phases can depress values due to construction disruptions, as observed in U.S. light rail corridors where anticipated noise and visual impacts reduced nearby home prices until service commencement. Tram stops facilitate (TOD), promoting denser, mixed-use urban forms that enhance accessibility and reduce automobile dependence, though causal evidence varies by context. Studies on stations show TOD concentrating growth around stops, with new apartment constructions and commercial emerging within , yet investment alone often fails to drive substantial shifts in residential densities without complementary reforms. In Barcelona's Trambesòs network, tram infrastructure improved urban cohesion and integration in peripheral areas, altering morphological dynamics through enhanced connectivity, as measured by metrics of accessibility. Retail viability near stops remains inconsistent, with some stations attracting businesses via traffic increases—up to higher walking rates in station areas—but others facing challenges from competition or insufficient ridership thresholds. Socioeconomic assessments highlight equity concerns, including risks where rising property values displace lower-income residents near tram stops. Research on transit links station proximity to neighborhood changes indicative of gentrification, such as income growth and demographic shifts, particularly in urban cores with pre-existing vulnerabilities. TOD implementations can exacerbate these effects without affordability mandates, as evidenced by studies noting in station areas despite overall urban revitalization benefits. These findings underscore the need for contextual interventions, as systemic biases in academic evaluations—often favoring progressive urban densification narratives—may underemphasize displacement costs relative to agglomeration gains.

Comparisons to Alternative Transit Infrastructure

Tram stops typically require embedded tracks, overhead wiring, and dedicated platforms aligned to floor heights for efficient boarding, contrasting with bus stops that rely on minimal such as marked bays, shelters, and real-time , which lowers initial setup costs for the latter. systems incorporating tram stops have capital costs averaging $37 million per kilometer, compared to $10 million per kilometer for (BRT) with dedicated lanes and stops, due to the permanence of rail versus flexible busway paving. Operating costs for trams stabilize or decrease per as ridership grows, owing to higher capacities—often 200-300 passengers per tram versus 50-100 for articulated buses—while bus systems incur rising labor and expenses with expanded service to match demand. In terms of passenger throughput at stops, trams enable faster dwell times through multiple doors and level boarding, achieving up to 60-80 passengers per minute per direction in optimized setups, surpassing standard bus stops' 20-40 passengers per minute due to buses' single-door inefficiencies in high-volume scenarios. BRT stops can approximate tram performance with off-vehicle fare collection and platform boarding, but empirical studies show light rail routes averaging higher daily ridership—often 20-50% more than comparable BRT—attributable to perceived permanence attracting development and mode shift. Safety at tram stops benefits from fixed alignments reducing rear-end collisions, though pedestrian conflicts arise in mixed-traffic zones; BRT stops, lacking tracks, avoid rail-specific hazards but face higher variability from driver-dependent operations. Compared to subway or stations, stops operate at surface level without tunneling, slashing costs by factors of 5-10, as subways demand excavation, ventilation, and for underground platforms. stations support peak capacities exceeding 100 passengers per minute via escalators and wide platforms, far outpacing stops' surface constraints, but require vastly higher investments—e.g., $200-500 million per kilometer for full lines versus under $50 million for —limiting deployment to dense cores. stops integrate seamlessly with urban streets for accessibility without vertical circulation barriers, yet expose users to weather and traffic externalities, whereas enclosed stations offer climate control and traffic isolation at the expense of longer walking distances from entrances.

Criticisms and Debates

Inflexibility and Maintenance Burdens

Tram stops, integral to fixed-rail systems, exhibit limited adaptability to evolving urban demands or unforeseen disruptions, as alterations necessitate extensive reconstruction of tracks and associated . Unlike bus stops, which can be repositioned with minimal intervention, modifying tram stop locations or alignments requires engineering interventions that can span months and incur costs in the millions per kilometer, committing cities to long-term route configurations that may become obsolete amid shifting land uses or patterns. This rigidity contrasts with bus networks' capacity for rapid rerouting, as evidenced in comparative analyses where trams' track-bound nature precludes deviations during or demand fluctuations, potentially suspending service entirely. Empirical assessments underscore this inflexibility; for example, in urban settings with variable traffic, trams cannot maneuver around obstacles or integrate with temporary bus substitutions as effectively as rubber-tired vehicles, leading to higher vulnerability to delays from incidents like track obstructions or utility works. Case studies of implementations highlight how initial route commitments hinder responses to post-installation changes, such as new developments bypassing fixed stops, thereby reducing system efficiency over time without proportional ridership gains. Maintenance of tram stops imposes substantial ongoing burdens due to the durability demands on specialized components like grooved rails, switch points, and overhead systems, which degrade under repeated loading and environmental exposure. Annual maintenance expenditures for infrastructure often exceed those of comparable bus facilities by factors of 2-5 times per route-kilometer, driven by needs for periodic rail grinding, ballast renewal, and mitigation, with empirical models linking axle loads directly to escalated costs through econometric analysis of patterns. Disruptions during upkeep—frequently requiring track possessions that halt operations—exacerbate service reliability issues, as stops cannot be temporarily relocated without system-wide impacts. These burdens are compounded by labor-intensive protocols for inspecting and repairing embedded at stops, including platform edging and signaling, which data-driven strategies in systems like Gothenburg's tram network reveal as prone to predictive failures if not addressed proactively. In resource-constrained municipalities, deferred accumulates into backlogs, as seen in broader rail transit where fixed assets demand sustained absent the flexibility of depreciable bus , ultimately straining operational budgets and diminishing long-term viability.

Opportunity Costs Versus Private Transport

Investing in tram stops and associated infrastructure entails substantial upfront capital expenditures, often ranging from $20 million to $80 million per mile for light rail systems, which include dedicated tracks, signaling, and station platforms. These fixed costs represent opportunity costs, as the allocated public funds could alternatively enhance roadways for private vehicles, such as through lane additions or pavement resurfacing, which typically cost $5 million to $10 million per mile depending on urban density and scope. In contexts where automobile usage predominates, such as suburban or sprawling metropolitan areas, reallocating resources to road capacity improvements can yield higher throughput of passengers via flexible private transport, avoiding the rigidity of fixed-route systems that underutilize capacity outside peak hours. Operational and subsidy comparisons further highlight disparities. U.S. systems incur operating costs averaging $1.00 to $1.50 per passenger-mile, at rates exceeding 50 cents per mile after fares, whereas private automobile travel averages 25 cents per passenger-mile in user-paid costs with minimal net of about 1 cent per mile from general taxes. Tram-dependent public transit often requires ongoing covering 70-80% of expenses, diverting taxpayer resources that could offset private vehicle efficiencies like service and variable scheduling, which reduce time costs in dispersed land-use patterns. Empirical assessments indicate limited displacement of private car usage by tram investments. In mid-sized European cities, has correlated with modest reductions in externalities, but modal shifts from automobiles average below 20% at peak times, with much ridership drawn from buses, walking, or rather than cars. U.S. case studies, such as Portland's expansions, show negligible overall declines in vehicle miles traveled post-implementation, as and route inflexibility limit broader adoption. Consequently, in car-centric environments, the manifests as foregone enhancements to networks that better align with user preferences for convenience and speed, potentially delivering superior economic returns through reduced congestion delays averaging 1-2 minutes per mile in untreated corridors.

Evidence of Overstated Environmental Gains

Lifecycle assessments of tram systems reveal that environmental benefits are frequently overstated by emphasizing operational emissions—such as zero tailpipe exhaust from —while neglecting high embodied (GHG) emissions from construction of tracks, overhead wiring, and stops, which involve substantial , , and excavation. For instance, a comparative life cycle analysis of introduction in demonstrated that including infrastructure-related emissions can elevate total GHG outputs by over 150% relative to operational emissions alone, as material production and construction phases dominate upfront carbon costs. Similarly, assessments of very light rail (a tram-like system) versus (BRT) found the rail option generates higher lifecycle emissions, primarily due to intensive material use in infrastructure, underscoring that fixed-rail claims of superiority often fail under full accounting. Empirical studies further highlight discrepancies in per-passenger , where low rates undermine purported CO2 reductions. An Australian analysis calculated trams emit approximately 0.74 kg CO2 equivalent per passenger-kilometer, exceeding typical automobile figures (around 0.2 kg assuming average ) and far surpassing buses at 0.04 kg per passenger-kilometer, attributed to trams' underutilized capacity and energy-intensive operations relative to flexible bus routing. This suggests that modal shift assumptions in environmental projections—positing widespread replacement of private vehicles—overstate net gains, as trams may merely displace lower-emission walking, , or efficient bus services without proportional ridership increases. Indirect effects amplify these overstatements, as tram infrastructure can inadvertently boost regional emissions through land-use changes. modeling of deployment linked it to up to 5% higher overall CO2 emissions compared to business-as-usual scenarios, driven by stimulated low-density development that elevates building demands and offsets savings via sprawl-induced travel. Payback periods for embodied carbon in rail infrastructure often extend 10–20 years or more under realistic urban ridership, delaying or negating short-term benefits amid grid electricity sourcing that includes fuels in many regions. Such findings, drawn from peer-reviewed lifecycle and modeling approaches, indicate that tram advocates' emphasis on operational cleanliness masks systemic inefficiencies, particularly when contrasted with adaptable alternatives like BRT, which exhibit lower total carbon footprints.

References

Add your contribution
Related Hubs
User Avatar
No comments yet.