Hubbry Logo
European windstormEuropean windstormMain
Open search
European windstorm
Community hub
European windstorm
logo
8 pages, 0 posts
0 subscribers
Be the first to start a discussion here.
European windstorm
European windstorm
from Wikipedia

24-hour animation of Cyclone Xynthia crossing France

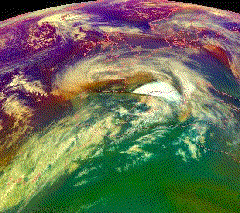
European windstorms are powerful extratropical cyclones which form as cyclonic windstorms associated with areas of low atmospheric pressure. They can occur throughout the year, but are most frequent between October and March, with peak intensity in the winter months.[1] Deep areas of low pressure are common over the North Atlantic, and occasionally start as nor'easters off the New England coast. They frequently track across the North Atlantic Ocean towards the north of Scotland and into the Norwegian Sea, which generally minimizes the impact to inland areas; however, if the track is further south, it may cause adverse weather conditions across Central Europe, Northern Europe and especially Western Europe. The countries most commonly affected include the United Kingdom, Ireland, the Netherlands, Norway, Germany, the Faroe Islands and Iceland.[2]

The strong wind phenomena intrinsic to European windstorms, that give rise to "damage footprints" at the surface, can be placed into three categories, namely the "warm jet", the "cold jet" and the "sting jet". These phenomena vary in terms of physical mechanisms, atmospheric structure, spatial extent, duration, severity level, predictability and location relative to cyclone and fronts.[3]

On average, these storms cause economic damage of around €1.9 billion per year and insurance losses of €1.4 billion per year (1990–1998). They cause the highest amount of natural catastrophe insurance loss in Europe.[4]

Cyclogenesis

[edit]

North Atlantic Oscillation

[edit]
Conceptual model for a European Windstorm and the associated strong wind "footprints". Storm track, footprint locations and footprint sizes vary by case, and that all footprints are not always present.[3]

The state of the North Atlantic Oscillation relates strongly to the frequency, intensity, and tracks of European windstorms.[5] An enhanced number of storms have been noted over the North Atlantic region during positive NAO phases (compared to negative NAO phases) and is due to larger areas of suitable growth conditions. The occurrence of extreme North Atlantic cyclones is aligned with the NAO state during the cyclones' development phase.[6] The strongest storms are embedded within, and form in large scale atmospheric flow.[7] It should be kept in mind that, on the other hand, the cyclones themselves play a major role in steering the NAO phase.[6] Aggregate European windstorm losses show a strong dependence on NAO,[8] with losses increasing/decreasing 10–15% at all return periods.[8]

Connection to North American cold spells

[edit]

A connection between wintertime cold air outbreaks in North America and European windstorms has been hypothesized in the last years.[when?][9][10][11][12] Cold spells over Central Canada and Eastern US appear to be associated with more frequent windstorms and flash floods over Iberia, whereas cold spells over Eastern Canada show a connection to windstorms over Northern Europe and the British Isles.[11] The reason behind those teleconnections is not fully clear yet, but changes in the behavior of the Polar jet stream are likely to be at least related to this effect.[9][11]

Clustering

[edit]

Temporal clustering of windstorm events has also been noted, with eight consecutive storms hitting Europe during the winter of 1989/90. Cyclones Lothar and Martin in 1999 were separated by only 36 hours. Cyclone Kyrill in 2007 followed only four days after Cyclone Per.[13][14] In November 2011, Cyclone Berit moved across Northern Europe, and just a day later another storm, named Yoda, hit the same area.

Nomenclature

[edit]

Naming of individual storms

[edit]

Up to the second half of the 19th century, European windstorms were usually named either by the year, the date, or the Saint's day of their occurrence.[15] Although standardised naming schemes now exist, a storm may still be named differently in different countries. For instance, the Norwegian weather service also names independently notable storms that affect Norway,[16] which can result in multiple names being used in different countries they affect, such as:

  • The 1999 storm called "Anatol" in Germany is known as the "December hurricane" or "Adam" in Denmark and as "Carola" in Sweden.
  • The 2011 storm called "Dagmar" in Norway and Sweden is known as "Patrick" in Germany and "Tapani" in Finland.
  • The 2013 event known as the St. Jude storm in the English media is known as Christian in German and French (following the Free University of Berlin's Adopt-a-Vortex program). It was named Simone by the Swedish Meteorological and Hydrological Institute, and referred to as the October storm in Danish and Dutch. It was later given the name Allan by the Danish Meteorological Institute following the political decision to name strong storms which affect Denmark.

In 2011, a social media campaign resulted in the storm officially called Cyclone Friedhelm being widely referred to as Hurricane Bawbag[17][18][19] and Hurricane Fannybaws. Such usage of the term Hurricane is not without precedent, as the 1968 Scotland storm was referred to as "Hurricane Low Q".[20]

UK and Ireland

[edit]
2015 list of storm names from UK Met Office and Met Éireann

The UK Met Office and Ireland's Met Éireann held discussions about developing a common naming system for Atlantic storms.[21][22] In 2015 a pilot project by the two forecasters was launched as "Name our storms" which sought public participation in naming large-scale cyclonic windstorms affecting the UK and/or Ireland over the winter of 2015/16.[23][24] The UK/Ireland storm naming system began its first operational season in 2015/2016, with Storm Abigail.[25][circular reference]

Germany

[edit]

During 1954, Karla Wege, a student at the Free University of Berlin's meteorological institute suggested that names should be assigned to all areas of low and high pressure that influenced the weather of Central Europe.[26] The university subsequently started to name every area of high or low pressure within its weather forecasts, from a list of 260 male and 260 female names submitted by its students.[26][27] The female names were assigned to areas of low pressure while male names were assigned to areas of high pressure.[26][27] The names were subsequently exclusively used by Berlin's media until February 1990, after which the German media started to commonly use the names, however, they were not officially approved by the German Meteorological Service Deutscher Wetterdienst.[26][28] The DWD subsequently banned the usage of the names by their offices during July 1991, after complaints had poured in about the naming system.[27] However, the order was leaked to the German press agency, Deutsche Presse-Agentur, who ran it as its lead weather story.[27] Germany's ZDF television channel subsequently ran a phone in poll on 17 July 1991 and claimed that 72% of the 40,000 responses favored keeping the names.[27] This made the DWD pause and think about the naming system and these days the DWD accept the naming system and request that it is maintained.[27][28]

During 1998 a debate started about whether it was discriminatory to name areas of high pressure with male names and the areas of low pressure with female names.[26] The issue was subsequently resolved by alternating male and female names each year.[26] In November 2002 the "Adopt-a-Vortex" scheme began, which allows members of the public or companies to buy naming rights for a letter chosen by the buyer that are then assigned alphabetically to high and low pressure areas in Europe during each year.[29] The naming comes with the slim chance that the system will be notable. The money raised by this is used by the meteorology department to maintain weather observations at the Free University.[30]

Names are listed alphabetically beginning in January.[31]

Name of phenomena

[edit]
Satellite picture of Cyclone Ulli on 3 January 2012

Several European languages use cognates of the word huracán (ouragan, uragano, orkan, huragan, orkaan, ураган, which may or may not be differentiated from tropical hurricanes in these languages) to indicate particularly strong cyclonic winds occurring in Europe. The term hurricane as applied to these storms is not in reference to the structurally different tropical cyclone of the same name, but to the hurricane strength of the wind on the Beaufort scale (winds ≥ 118 km/h or ≥ 73 mph).

In English, use of term hurricane to refer to European windstorms is mostly discouraged, as these storms do not display the structure of tropical storms. Likewise the use of the French term ouragan is similarly discouraged as hurricane is in English, as it is typically reserved for tropical storms only.[32][33] European windstorms in Latin Europe are generally referred to by derivatives of tempestas (tempest, tempête, tempestado, tempesta), meaning storm, weather, or season, from the Latin tempus, meaning time.[34]

Globally storms of this type forming between 30° and 60° latitude are known as extratropical cyclones. The name European windstorm reflects that these storms in Europe are primarily notable for their strong winds and associated damage, which can span several nations on the continent. The strongest cyclones are called windstorms within academia and the insurance industry.[2] The name European windstorm has not been adopted by the UK Met Office in broadcasts (though it is used in their academic research[35]), the media or by the general public, and appears to have gained currency in academic and insurance circles as a linguistic and terminologically neutral name for the phenomena.

In contrast to some other European languages there is a lack of a widely accepted name for these storms in English. The Met Office and UK media generally refer to these storms as severe gales.[36] The current definition of severe gales (which warrants the issue of a weather warning) are repeated gusts of 70 mph (110 km/h) or more over inland areas.[36] European windstorms are also described in forecasts variously as winter storms,[37] winter lows, autumnal lows, Atlantic lows and cyclonic systems.[citation needed] They are also sometimes referred to as bullseye isobars and dartboard lows in reference to their appearance on weather charts.[citation needed] A Royal Society exhibition has used the name European cyclones,[38] with North-Atlantic cyclone and North-Atlantic windstorms also being used.[2] Though with the advent of the "Name our Storms" project, they are generally known as storms.

Economic impact

[edit]
A fictitious synoptic chart of an extratropical cyclone affecting the UK & Ireland. The blue and red arrows between isobars indicate the direction of the wind and its relative temperature, while the "L" symbol denotes the center of the "low". Note the occluded cold and warm frontal boundaries.

Insurance losses

[edit]

Insurance losses from European windstorms are the second greatest source of loss for any natural peril globally. Only Atlantic hurricanes in the United States are larger.[39] Windstorm losses exceed those caused by flooding in Europe. For instance one windstorm, Kyrill in 2007, exceeded the losses of the 2007 United Kingdom floods.[40] On average, some 200,000 buildings are damaged by high winds in the UK every year.[41]

Damaged pylon in Germany after Windstorm Kyrill 2007

Energy supplies

[edit]

European windstorms wipe out electrical generation capacity across large areas, making supplementation from abroad difficult (windturbines shut down to avoid damage and nuclear capacity may shut if cooling water is contaminated or flooding of the power plant occurs). Transmission capabilities can also be severely limited if power lines are brought down by snow, ice or high winds. In the wake of Cyclone Gudrun in 2005 Denmark and Latvia had difficulty importing electricity,[42] and Sweden lost 25% of its total power capacity as the Ringhals Nuclear Power Plant and Barsebäck nuclear power plant nuclear plants were shut down.[43]

During the Boxing Day Storm of 1998 the reactors at Hunterston B nuclear power station were shut down when power was lost, possibly due to arcing at pylons caused by salt spray from the sea.[44] When the grid connection was restored, the generators that had powered the station during the blackout were shut down and left on "manual start", so when the power failed again the station was powered by batteries for a short time of around 30 minutes, until the diesel generators were started manually.[44] During this period the reactors were left without forced cooling, in a similar fashion to the Fukushima Daiichi nuclear disaster, but the event at Hunterston was rated as International Nuclear Event Scale 2.[44][45]

A year later in 1999 during the Lothar storm Flooding at the Blayais Nuclear Power Plant resulted in a "level 2" event on the International Nuclear Event Scale.[46] Cyclone Lothar and Martin in 1999 left 3.4 million customers in France without electricity, and forced Électricité de France to acquire all the available portable power generators in Europe, with some even being brought in from Canada.[43] These storms brought a fourth of France's high-tension transmission lines down and 300 high-voltage transmission pylons were toppled. It was one of the greatest energy disruptions ever experienced by a modern developed country.[47]

Following the Great Storm of 1987 the High Voltage Cross-Channel Link between the UK and France was interrupted, and the storm caused a domino-effect of power outages throughout the Southeast of England.[48] Conversely windstorms can produce too much wind power. Cyclone Xynthia hit Europe in 2010, generating 19000 megawatts of electricity from Germany's 21000 wind turbines. The electricity produced was too much for consumers to use, and prices on the European Energy Exchange in Leipzig plummeted, which resulted in the grid operators having to pay over 18 euros per megawatt-hour to offload it, costing around half a million euros in total.[49]

Disruption of the gas supply during Cyclone Dagmar in 2011 left Royal Dutch Shell's Ormen Lange gas processing plant in Norway inoperable after its electricity was cut off by the storm. This left gas supplies in the United Kingdom vulnerable as this facility can supply up to 20 per cent of the United Kingdom's needs via the Langeled pipeline. However, the disruption came at a time of low demand.[50] The same storm also saw the Leningrad Nuclear Power Plant also affected, as algae and mud stirred up by the storm were sucked into the cooling system, resulting in one of the generators being shut down.[51][52] A similar situation was reported in the wake of Storm Angus in 2016 (though not linked specifically to the storm) when reactor 1 at Torness Nuclear Power Station in Scotland was taken offline after a sea water intake tripped due to excess seaweed around the inlet.[53] Also following Storm Angus the UK's National Grid launched an investigation into whether a ship's anchor damaged four of the eight cables of the Cross Channel high voltage interconnector, which would leave it only able to operate at half of its capacity until February 2017.[54]

Notable windstorms

[edit]

Historic windstorms

[edit]
Contemporary picture of the flood that struck the North Sea coast of Germany and Denmark in October 1634.
  • Grote Mandrenke, 1362 – A southwesterly Atlantic gale swept across England, the Netherlands, northern Germany and southern Denmark, killing over 25,000 and changing the Dutch-German-Danish coastline.
  • Burchardi flood, 1634 – Also known as "second Grote Mandrenke", hit Nordfriesland, drowned about 8,000–15,000 people and destroyed the island of Strand.
  • Great Storm of 1703 – Severe gales affect south coast of England.
  • Night of the Big Wind, 1839 – The most severe windstorm to hit Ireland in recent centuries, with hurricane-force winds, killed between 250 and 300 people and rendered hundreds of thousands of homes uninhabitable.
  • Royal Charter Storm, 25–26 October 1859 – The Royal Charter Storm was considered to be the most severe storm to hit the British Isles in the 19th century, with a total death toll estimated at over 800. It takes its name from the ship Royal Charter, which was driven by the storm onto the east coast of Anglesey, Wales, with the loss of over 450 lives.
  • The Tay Bridge Disaster, 1879 – Severe gales (estimated to be Force 10–11) swept the east coast of Scotland, infamously resulting in the collapse of the Tay Rail Bridge and the loss of 75 people who were on board the ill-fated train.[55]
  • 1928 Thames flood, 6–7 January 1928 – Snow melt combined with heavy rainfall and a storm surge in the North Sea led to flooding in central London and the loss of 14 lives.

Before Official Naming (1950-2014)

[edit]

Historically, powerful and standout European windstorms were given names before the official naming convention was established.

  • North Sea flood of 1953 – Considered to be the worst natural disaster of the 20th century both in the Netherlands and the United Kingdom, claiming over 2,500 lives, including 133 lost when the car ferry MV Princess Victoria sank in the North Channel east of Belfast.
  • Great Sheffield Gale and the North Sea flood of 1962 – Powerful windstorm crossed the United Kingdom, killing nine people and devastating the city of Sheffield with powerful winds.[56] The storm then reached the German coast of the North Sea with wind speeds up to 200 km/h. The accompanying storm surge combined with the high tide pushed water up the Weser and Elbe, breaching dikes and caused extensive flooding, especially in Hamburg. 315 people were killed, around 60,000 were left homeless.
  • Gale of January 1976 2–5 January 1976 – Widespread wind damage was reported across Europe from Ireland to Central Europe. Coastal flooding occurred in the United Kingdom, Belgium and Germany with the highest storm surge of the 20th century recorded on the German North Sea coast.
  • 1979 Fastnet Race – Force 10 to 11 storm forced the retirement or, in several cases, sinking of numerous yachts. Less than a third of the contesting boats finished with 19 killed.
  • Great Storm of 1987 – This storm affected southeastern England and northern France. In England maximum mean wind speeds of 70 knots (an average over 10 minutes) were recorded. The highest gust of 117 knots (217 km/h) was recorded at Pointe du Raz in Brittany. In all, 19 people were killed in England and 4 in France. 15 million trees were uprooted in England.
  • 1990 storm series – Between 25 January and 1 March 1990, eight severe storms crossed Europe including the Burns' Day storm (Daria), Vivian & Wiebke. The total costs resulting from these storms was estimated at almost €13 billion.[57]
  • Braer Storm of January 1993 – the most intense storm of this kind on record.
  • Cyclones Lothar and Martin,[58] 1999 – France, Switzerland and Germany were hit by severe storms Lothar (250 km/h (160 mph)), and Martin (198 km/h (123 mph)). 140 people were killed during the storms. Lothar and Martin together left 3.4 million customers in France without electricity.[43] It was one of the greatest energy disruptions ever experienced by a modern developed country.[47] The total costs resulting from both storms was estimated at almost 19.2 billion $US.
  • Kyrill,[59] 2007 – Storm warnings were given for many countries in western, central and northern Europe with severe storm warnings for some areas. At least 53 people were killed in northern and central Europe, causing travel chaos across the region.

Official Naming Era (2015 – present)

[edit]

Powerful, standout European windstorms were named officially by their respective groups.

  • Storm Desmond - 2015 - A catastrophic windstorm which tied with an atmospheric river to produce extreme flooding to parts of the United Kingdom. Red rain warnings were issued for SW Scotland & NW England as well as parts of Ireland. Storm Desmond broke the United Kingdom's 24-hour rainfall record, with 341.4 mm (13.44 in) of rain falling in Honister Pass, Cumbria, on 5 December.[60]
  • Storm Doris - 2017 - A strong windstorm that brought power cuts costly damage prompting an amber wind warning for parts of north Wales, central and eastern England.
  • Storm David - 2018 - The storm caused an estimated €1.14 billion – €2.6 billion in damage. Wind gusts up to 203 km/h (126 mph) wreaked havoc in UK, The Netherlands, Belgium, and Germany. The death toll reached 15.
  • Storm Eunice - 2022 - The storm with wind gusts up to 196 km/h (122 mph) killed 17 people in Europe. The storm impacted the UK, the Netherlands, Belgium, France, Denmark, and Poland.
  • Storm Ciarán - 2023 - A severe windstorm that struck south-west England and north-western France in early November 2023. Gusts of 207 km/h (129 mph) was recorded in Pointe du Raz, Brittany, France. Many tornadoes were reported during the storm especially in southern England, the Channel Islands and northern France.
  • Storm Ingunn - 2024 - An extremely powerful windstorm that brought 155 mph to the Faroe Islands and prompted the issuance of a rare red warning for wind for Norway.
  • Storm Darragh - 2024 - A powerful extratropical cyclone which severely impacted Ireland and the United Kingdom in December 2024, prompted the issuance of a rare red wind warning for the Welsh coast from Anglesey to the Severn Estuary and the Somerset and north Devon coasts.
  • Storm Éowyn - 2025 - a powerful and record-breaking extratropical cyclone which hit Ireland, the Isle of Man and the United Kingdom. It was the most powerful and severe to hit Ireland since Night of the Big Wind in 1839, with wind records breaking an 80-year-old record for the country. On 23 January 2025, a 'red' emergency alert was sent to mobile devices across Northern Ireland at 17:25 UTC and in parts of Scotland at 17:53 UTC.[61] The alert was broadcast to around 4.5 million devices making it the largest scale use of the UK's emergency alert system since its introduction in April 2023.[62]
  • Storm Amy - 2025 - a powerful & destructive windstorm, known for the amount of power outages throughout western and northern Europe (559,665+) as well as a wind gust of 139 mph (224 km/h) at Folgefonna, Norway.

Other Severe Storms (FUB) (2015 – present)

[edit]

Extreme storms named by the Free University of Berlin were not given names by any of the official European storm naming groups.

  • Xynthia,[63] 2010 – A severe windstorm moved across the Canary Islands to Portugal and western and northern Spain, before moving on to hit south-western France. The highest gust speeds were recorded at Alto de Orduña, measured at 228 km/h (142 mph). 50 people were reported to have died.[64]

Most intense storms

[edit]
Most intense extratropical cyclones in the North Atlantic
Rank Date Name Minimum pressure[65] Reported location
1 January 1993 Braer Storm 914 hectopascals (27.0 inHg) Between Iceland and Great Britain
2 December 1986 Unnamed 916 hectopascals (27.0 inHg) South-east of Greenland
3 January 1839 Night of the Big Wind 918 hectopascals (27.1 inHg)[66] Off the coast of Great Britain
4 December 1989 Unnamed 920 hectopascals (27 inHg) South-west of Iceland
February 2020 Storm Dennis South of Iceland
6 February 1870 Unnamed 921.1 hectopascals (27.20 inHg) South-west of Iceland
7 February 1824 Unnamed 924 hectopascals (27.3 inHg) Reykjavik, Iceland
8 December 1929 Unnamed 925.5 hectopascals (27.33 inHg) Atlantic Ocean
9 January 1884 Unnamed 925.6 hectopascals (27.33 inHg) Ochtertyre, Great Britain
10 March 1992 Unnamed 926 hectopascals (27.3 inHg) Off Newfoundland

See also

[edit]

References

[edit]
[edit]
Revisions and contributorsEdit on WikipediaRead on Wikipedia
from Grokipedia
A European windstorm is a powerful that forms over the and impacts large areas of , characterized by intense low-pressure systems generating sustained high winds, heavy rainfall, and occasional storm surges. These storms typically span diameters exceeding 1,000 kilometers and develop outside the tropical regions, distinguishing them from hurricanes or typhoons. They are tracked using algorithms that identify minima in mean pressure or maxima in 850 hPa , with footprints defined as the maximum 10-meter wind gusts over a 72-hour period centered on the storm's peak intensity. European windstorms originate along the at altitudes of 10-15 kilometers, where sharp gradients in temperature and humidity trigger , leading to . The 's position and strength, particularly during winter when it shifts southward, enhance development, often incorporating mechanisms like "sting jets" that produce extreme inland gusts exceeding 100 km/h. These events are most frequent and severe from to , aligning with cooler sea surface temperatures and favorable atmospheric conditions that sustain low-pressure systems. The impacts of European windstorms are profound, causing widespread damage to infrastructure, power outages, flooding, and significant economic losses, making them the leading natural catastrophe for insurance claims in . For instance, they have historically felled millions of trees, disrupted transportation, and led to insured losses in the billions of euros per event, with average annual insured losses for European windstorms around €3 billion (1980-2023). Notable examples include the , which toppled 15 million trees in the , and Storm Lothar in 1999, responsible for approximately €7.2 billion in insured damages across . Unlike tropical cyclones, European windstorms lack a formal intensity scale but are named by meteorological services such as the , Met Éireann, or —often in coordination via EUMETNET—when expected to cause significant impacts in affected regions, aiding public awareness and preparedness. Recent storms like and in 2020 affected thousands of properties, highlighting ongoing risks amid projections of increasing severity due to . As of 2025, European windstorm seasons typically feature 5-10 named storms. Data from reanalysis datasets like ERA5 enable detailed historical tracking from 1940 onward, supporting improved forecasting and risk assessment.

Meteorology

Formation and cyclogenesis

European windstorms are powerful extratropical cyclones that form primarily over the , manifesting as low-pressure systems generating strong cyclonic winds that impact . These storms typically originate through in the midlatitudes, though a smaller fraction arises from the extratropical transition of tropical cyclones, particularly during the hurricane season. The primary formation process involves the interaction between warm subtropical air masses and cold polar air, which drives baroclinic —a key mechanism where disturbances in the westerly shear zone amplify into organized cyclones. This instability releases from horizontal temperature gradients, leading to the development of surface lows accompanied by upper-level divergence and vorticity advection. The plays a crucial role in accelerating this development by providing strong upper-level winds that enhance ahead of the , with typical storm paths originating from the or near before tracking eastward toward . These paths are guided by the polar 's position and intensity, which can intensify the 's deepening as it moves across the Atlantic. A specific mechanism often observed is , characterized by rapid pressure drops of at least 24 hPa within 24 hours, enabling storms to intensify dramatically and produce severe winds. Such events are frequently "seeded" by the remnants of decaying tropical hurricanes or other tropical systems undergoing extratropical transition, which inject additional moisture and energy into the developing low-pressure system. The (NAO) influences storm strength, with positive NAO phases promoting a stronger and more frequent explosive cyclogenesis over the North Atlantic, leading to intensified . Windstorms often cluster in sequences due to persistent large-scale atmospheric patterns, such as teleconnection indices, with statistical models indicating that intense exhibit a 2-3 times higher likelihood of successive events compared to weaker ones. This clustering is quantified through dispersion statistics in analyses, showing elevated variance in cyclone counts during periods of favorable conditions.

Physical characteristics

European windstorms are characterized by a central low-pressure core, typically ranging from 950 to 980 hPa in intense systems, which drives the cyclonic circulation and associated . This is often accompanied by asymmetric fields, with the strongest concentrated on the southern and western flanks due to sting-jet dynamics, where a mesoscale descending airstream from the mid-troposphere enhances near-surface gusts in the dry slot region behind the . Sting jets occur in approximately 32% of North Atlantic extratropical cyclones, contributing significantly to extreme events during winter months. Wind speeds in these storms generally feature sustained gales of 50–100 km/h (14–28 m/s), with gusts frequently exceeding 150 km/h (42 m/s) and reaching up to 200 km/h (56 m/s) or more in severe cases, particularly over the and . These velocities correspond to Beaufort Force 10 or higher, classifying them as storm-force winds capable of widespread disruption. The asymmetric structure amplifies gusts in exposed coastal and elevated areas, where sting jets can produce localized maxima exceeding 55 m/s at 850 hPa. Associated weather phenomena include heavy precipitation in the form of rain or snow ahead of the warm front, often totaling 50–100 mm within 24–48 hours, driven by the cyclone's warm conveyor belt. Along coastal regions, low pressure and strong onshore winds generate storm surges with heights of 1–3 m above normal tides, exacerbating flooding risks. Embedded cold fronts within the system can produce squalls, adding convective bursts of intense, short-lived winds and hail. The spatial extent of European windstorms typically spans a diameter of 1,000–2,000 km, encompassing large swaths of the North Atlantic and , with the most damaging wind fields covering 100–250 km from the center. Storm tracks generally measure 2,000–3,000 km, originating from near the eastern North Atlantic and progressing eastward across before dissipation. Intensity is quantified through metrics such as maximum gust speed, minimum central pressure, and the STORM index, which combines peak wind speeds with the affected area's exposure to estimate damage potential. The STORM index, developed by Klawa and Ulbrich, weights gust magnitudes against regional vulnerability, providing a standardized measure for comparing storm severity across events.

Atmospheric influences

The North Atlantic Oscillation (NAO) represents a primary atmospheric teleconnection modulating the frequency, intensity, and tracks of European windstorms. In its positive phase, defined by an enhanced pressure gradient between the subtropical and the subpolar , the NAO intensifies westerly airflow across the North Atlantic, shifting the storm track northward and increasing precipitation and storm activity over while reducing it in the south. Conversely, the negative NAO phase weakens this gradient, resulting in a more meridional storm track orientation, decreased overall storminess, and a southward displacement that favors impacts in southern and . This oscillation accounts for significant variability in windstorm return levels, with positive NAO phases modulating lower thresholds. Links to North American weather patterns further illustrate transatlantic influences on European windstorms through shared dynamics. Cold outbreaks in the U.S. Midwest and eastern often precede heightened wind extremes over Europe, as low-frequency trains originating in the North Pacific reconfigure the extratropical waveguide, altering genesis and propagation across the Atlantic. For instance, central U.S. cold spells during negative NAO conditions correlate with increased windstorm frequency on the , while eastern Canadian events under positive NAO align with impacts, highlighting how these waves mediate storm track states. Other teleconnections, such as the El Niño-Southern Oscillation (ENSO) and , also shape windstorm characteristics by influencing jet stream positioning and polar vortex stability. ENSO drives propagation from the Pacific, with El Niño phases typically inducing a southward shift of the North Atlantic storm track in late winter—mimicking a negative NAO pattern—and altering cyclone paths over , while La Niña promotes the opposite northward configuration. Similarly, the AO, which overlaps with the NAO, strengthens the stratospheric during positive phases, enhancing subpolar westerlies and northward storm track shifts; negative AO phases weaken the vortex, fostering blocking patterns that displace storms southward and reduce overall activity. Seasonal variability in European windstorms aligns with enhanced atmospheric dynamics from October to March, when stronger pole-equator temperature gradients amplify the and baroclinicity, promoting frequent over the North Atlantic. Interannual clustering of storms during this period often stems from persistent blocking highs, which steer multiple cyclones across in rapid succession, as seen in events like the 2022 Dudley-Eunice-Franklin sequence. Atlantic sea surface temperatures (SSTs), modulated by the Atlantic Multidecadal Oscillation (AMO), further enhance windstorm development by altering moisture and energy fluxes. Positive AMO phases feature warmer SSTs that boost baroclinicity and dynamical activity, leading to intensified storm tracks and increased precipitation in northwestern Europe through cyclonic anomalies resembling a negative summer NAO. This multidecadal variability influences weather regimes, with warm phases favoring broader cyclonic pressure patterns over the Atlantic and Europe across seasons.

Forecasting and monitoring

Prediction methods

Prediction of European windstorms relies primarily on numerical weather prediction (NWP) models, which simulate atmospheric dynamics to forecast storm development, track, and intensity. The European Centre for Medium-Range Weather Forecasts (ECMWF) operates the Integrated Forecasting System (IFS), providing global forecasts with lead times extending up to 15 days, though operational predictions for windstorms typically focus on 3-10 day horizons to capture evolving extratropical cyclones. In February 2025, ECMWF launched the Artificial Intelligence Forecasting System (AIFS) as an operational model alongside the IFS, providing machine learning-based forecasts at similar resolutions for enhanced efficiency in predicting windstorm events. Similarly, the UK Met Office employs the Unified Model in its operational NWP suite, delivering comparable medium-range forecasts tailored to European storm systems. These models achieve horizontal resolutions down to 9 km in high-resolution configurations, enabling detailed wind gust predictions critical for assessing storm impacts. Ensemble forecasting enhances NWP by incorporating probabilistic methods to quantify uncertainty in storm predictions. ECMWF's (ENS) consists of 51 members (one control and 50 perturbed forecasts), each initialized with slight variations in initial conditions and physics to sample possible outcomes, thereby estimating spreads in tracks and intensities. The Met Office's global ensemble system similarly generates multiple members to produce probability maps for windstorm events, aiding in the identification of high-risk scenarios. This approach allows forecasters to express confidence levels, such as the likelihood of gale-force winds exceeding 20 m/s in specific regions. Key data inputs for these models include diverse observational sources to initialize and refine simulations. Satellite imagery from the Meteosat series, operated by EUMETSAT, provides continuous monitoring of cloud patterns and rapid cyclogenesis signatures over the North Atlantic and Europe. Weather radar networks detect precipitation structures associated with storm fronts, while buoys in the Atlantic and aircraft-based observations from commercial flights supply upper-air data on temperature, humidity, and winds to improve model assimilation. These inputs, integrated via data assimilation techniques like 4D-Var, ensure accurate representation of initial storm conditions, including pressure drops that influence cyclogenesis. Specialized diagnostic tools complement NWP outputs by detecting , particularly in windstorms. One such index involves the Laplacian of (PV) at upper levels, which highlights anomalies signaling deepening rates exceeding 1 hPa/hour at the surface; positive PV gradients indicate potential for by revealing stratospheric intrusions or diabatic heating effects. This metric, applied post-simulation, helps prioritize storms like those forming over the . Verification of prediction methods uses metrics like the Brier skill score (BSS) to assess probabilistic wind forecasts against observations. BSS measures the accuracy of predicted probabilities for events such as wind speeds over 25 m/s, with values closer to 1 indicating superior performance relative to . Historical analyses show BSS for European wind probability forecasts improving from around 0.60 in the to over 0.80 in recent years, reflecting advances in model resolution, ensemble size, and . ECMWF's ongoing evaluations confirm this trend, with BSS for 10 m probabilities exceeding 0.85 at 3-day leads in the 2020s.

Warning systems

National meteorological services across operate dedicated warning systems for windstorms, tailored to local conditions and impacts. In the , the Met Office's issues color-coded alerts— for awareness (gusts typically exceeding 50 mph or 80 km/h inland), for preparation (gusts of 60-70 mph or 97-113 km/h, or sustained s of 40 mph), and for immediate action (gusts over 75 mph or 120 km/h, or life-threatening conditions)—up to seven days in advance, focusing on potential disruptions like travel delays or structural damage. Similarly, Germany's (DWD) employs a four-level system for and storm warnings, escalating from minor disturbances (level 1, gusts around 50 km/h) to extreme events (level 4, hurricane-force winds over 110 km/h with widespread danger), disseminated through the WarnWetter app and official bulletins. In , Météo-France's Vigilance system uses a four-tier (green, , orange, ) for violent winds, where yellow indicates localized risks, orange signals dangerous widespread gusts (often exceeding 100 km/h in exposed areas), and red denotes exceptional threats to life and infrastructure, updated twice daily across departments. At the European level, coordination is facilitated by EUMETNET's MeteoAlarm platform, which harmonizes warnings from 38 national services into a unified color-coded system (yellow for moderate risks, orange for severe, red for extreme) to support cross-border awareness, particularly for transboundary storms affecting multiple countries. The (WMO) provides guidelines for multi-hazard, impact-based forecasting and warning services, emphasizing the exchange of data and alerts across borders to enhance response coordination, such as integrating warnings with risks in shared river basins. Post-event verification relies on the European Severe Weather Database (ESWD), operated by the European Severe Storms Laboratory, which collects and quality-controls reports of severe events to assess warning accuracy and refine future thresholds. Warning criteria are primarily based on wind speed thresholds adjusted for regional , with MeteoAlarm recommending uniform periods: for events occurring approximately 10 times per year ( ~0.1 years; around 20-30 m/s or 72-108 km/h inland), orange for 2-year periods (25-40 m/s or 90-144 km/h), and red for 5-year periods (30-45 m/s or 108-162 km/h), escalating to red for imminent life-threatening impacts regardless of exact speeds. These systems often incorporate multi-hazard elements, combining wind alerts with or coastal surge risks to provide comprehensive guidance. Public communication leverages diverse channels to ensure accessibility, including mobile apps like the Weather app and DWD's WarnWetter for push notifications, television and radio broadcasts for real-time updates, and color-coded maps on platforms like MeteoAlarm for visual clarity. Examples include alerts in countries like and , which deliver location-specific messages during severe events, promoting actions such as securing property or avoiding travel. Historical improvements stem from the 1987 Great Storm, which prompted the UK Met Office to establish the , enhancing lead times from hours to up to 48 hours for named storms through better ensemble forecasting and public outreach. This event catalyzed Europe-wide advancements, including standardized impact-based criteria and digital dissemination, reducing response times and mitigating potential damages from subsequent windstorms.

Naming conventions

Naming individual storms

The practice of naming individual European windstorms began in September 2015 as a collaborative initiative between the United Kingdom's and Ireland's Met Éireann to enhance communication during events. This partnership was expanded in 2019 to include the ' KNMI, forming the Western Group, which assigns names from a shared alphabetical list excluding Q, U, X, Y, and Z to align with international conventions. Names are selected to include a mix of female, male, and neutral options, primarily in English, and are drawn from public suggestions submitted during periodic calls for input to foster engagement. Storms are named prospectively based on forecasts indicating medium or high impacts, typically when one of the partner agencies issues an (or orange) or warning for , , , or combined effects that could lead to significant disruption or damage. In the UK and , this often corresponds to expected gusts exceeding 90 km/h (56 mph) in affected areas, while criteria for other European agencies vary, generally tied to warning levels for significant regional impacts. The first agency to recognize the potential assigns the name from the current list, which proceeds alphabetically as storms develop. The 2025–26 season began with Storm Amy named on October 1, 2025, by the . Regional variations exist outside the Western Group, reflecting national meteorological priorities. In , the (FUB) has independently named major low-pressure systems since the early 1950s, but this practice gained prominence in European coordination efforts from 2019 onward, focusing on continental-scale depressions rather than a fixed list; for instance, the 2023 storm was designated "Zoltan" by FUB due to its widespread pressure impacts. In , as part of the Southwestern Group with and , names storms when orange or red warnings are forecast, often with gust thresholds starting at 91 km/h (57 mph), but names may be assigned post-impact if the system evolves significantly after affecting neighboring regions, such as the 2025 Storm Floriane (during the 2024–25 season) named a day after initial UK and Irish impacts. These differences highlight decentralized approaches, though cross-group adoption of names is encouraged to minimize confusion. The naming lists rotate on a six-year cycle, with new sets announced annually in late or early to cover the upcoming from early to late . Public input shapes future cycles through open calls, ensuring ; the 2024-25 Western Group list, for example, included Ashley, Bert, Conall, Darragh, , and Floris, progressing alphabetically as six storms were named that . Unlike , European windstorm names are not routinely retired for deadly events, though exceptionally severe cases may prompt review for future lists to avoid insensitivity. This system benefits public safety by raising awareness of impending threats, enabling faster dissemination of warnings through consistent media terminology, and encouraging proactive measures like securing property. Cross-national coordination, such as adopting a single name when storms traverse multiple groups, resolves potential disputes over designations, as seen in collaborative protocols that prioritize the originating agency's choice to maintain uniformity across borders.

Terminology for the phenomenon

European windstorms are scientifically classified as a subtype of extratropical cyclones, which are synoptic-scale low-pressure systems that derive their primary energy from baroclinic instability associated with temperature contrasts between air masses, rather than the release characteristic of tropical cyclones. Unlike tropical cyclones, which feature a warm core structure and organized around a central eye, extratropical cyclones lack this warm core and exhibit frontal boundaries with asymmetric cloud patterns, often tracked using central pressure minima and maximum sustained winds. Intensity assessment for these systems typically relies on meteorological observations and satellite-derived estimates, including adaptations of pattern-recognition techniques originally developed for tropical cyclones, such as the Dvorak method modified for mid-latitude cloud signatures to infer deepening rates and wind speeds. In English-language contexts, the primary terms include "European windstorm" for severe events impacting the continent and "gale" for strong wind episodes, with "depression" denoting the associated low-pressure area; these trace back to 19th-century nautical and meteorological usage, including the now-debunked notion of "equinoctial gales" believed to peak around seasonal transitions due to tidal influences on atmospheric pressure. Regional synonyms vary: in German-speaking areas, rapidly intensifying systems are termed "Wetterbomben" (weather bombs), referring to explosive cyclogenesis where central pressure drops by at least 24 hPa in 24 hours, a phenomenon also called "bomb cyclone" in English. In French, they are known as "tempêtes" (storms) or "dépressions," often specified as Atlantic-origin systems. Other localized historical terms include "orkan" in Scandinavian languages for intense wind events, derived etymologically from influences like the Spanish "huracán" but reserved for non-tropical systems to avoid confusion. Efforts to standardize terminology have been led by organizations like the World Meteorological Organization (WMO) through its glossaries and guidelines, which promote consistent definitions for global communication, while the European Organisation for the Exploitation of Meteorological Satellites (EUMETSAT) supports satellite-based monitoring that reinforces unified classification. This standardization explicitly discourages terms like "hurricane" for extratropical systems, as it is reserved for tropical cyclones under WMO conventions, preventing misperceptions about storm dynamics and aiding public awareness. Culturally, pre-modern naming drew from folklore and religious calendars, such as associating storms with saints' days (e.g., storms near October 28 referred to as St. Jude's events in British media), contrasting with contemporary scientific nomenclature focused on meteorological attributes rather than anthropomorphic or seasonal lore.

Impacts

Economic consequences

European windstorms impose substantial financial burdens on Europe, with average annual insured losses estimated at approximately €3 billion from 1980 to 2023, while total economic losses are typically higher due to uninsured damages. Peak events, such as the 1999 storms Lothar and Martin, generated combined economic losses exceeding €14 billion, marking one of the costliest natural disaster sequences in European history. These figures highlight the scale of impacts, where insured damages alone from major windstorms can reach several billion euros, driven by widespread property destruction and operational halts. The insurance sector plays a critical role in mitigating these costs through arrangements and catastrophe bonds, which transfer peak risks to capital markets. For instance, issuers like and have sponsored cat bonds specifically targeting European windstorm perils, providing hundreds of millions in coverage per issuance. Data from the PERILS database, which aggregates industry claims, indicates that insured losses are primarily concentrated in , , the , and countries, reflecting their high exposure to storm tracks and dense infrastructure. Infrastructure disruptions amplify economic tolls, with major windstorms frequently causing power outages affecting millions of households and businesses; for example, restoration efforts and lost productivity can incur significant costs per event. networks suffer similarly, as rail and closures during severe storms lead to delays and cancellations with substantial direct and indirect expenses, including interruptions. assessments reveal that coastal regions face higher loss ratios than inland areas due to intensified wind exposure and synergies, informing targeted resilience investments. Losses distribute across sectors, with approximately 50% stemming from to buildings and contents, 20% from business interruptions, and 15% from agricultural impacts like crop flattening and losses. In the 2024-25 season, Storm Éowyn exemplified impacts, generating insured losses of €696 million (as of April 2025).

Environmental and human effects

European windstorms pose significant risks to human health through both direct and indirect mechanisms. Direct impacts primarily involve fatalities and injuries from flying debris, falling trees, and structural collapses during the storm's peak, with additional risks from falls and lacerations during cleanup efforts. Indirect effects include from improper use of generators amid power outages. These storms result in dozens of fatalities across annually, alongside thousands of injuries, though precise figures vary by event severity. Vulnerable populations, such as the elderly and coastal residents, face heightened risks due to mobility limitations, isolation, and exposure to storm surges. Environmental damage from European windstorms extends to widespread forest blowdown, where high winds uproot or snap trees, leading to substantial timber losses. For instance, the 1999 storms and Martin felled approximately 193 million cubic meters of wood across affected regions, equivalent to two years of normal harvest in , , and . These events also accelerate through storm surges that amplify wave action and remove sediment from shorelines. Additionally, the heavy rainfall accompanying many windstorms contributes to riverine flooding, saturating soils and overwhelming drainage systems in low-lying areas. Ecologically, windstorms disrupt biodiversity by causing large-scale tree mortality, which alters habitat structures and reduces in affected forests. However, these disturbances can create opportunities for ecological regeneration, as fallen timber fosters microhabitats that support and promote natural succession in resilient ecosystems. In marine environments, storm-induced leads to sediment redistribution, potentially smothering benthic habitats and affecting coastal marine biodiversity. Societal disruptions from European windstorms include mass evacuations in high-risk areas, particularly along coastlines, to mitigate and surge threats. Post-event mental health strains are common, with survivors experiencing elevated rates of , anxiety, and depression due to trauma and displacement. Energy blackouts, a frequent consequence, affect millions of people during major storms, disrupting like heating, , and medical care. Secondary hazards arise when windstorms combine with flooding, amplifying overall impacts through compound events that increase flood severity and extend recovery times. For example, wind-driven rainfall can saturate catchments, leading to prolonged river overflows that exacerbate structural damage and isolate communities. In some cases, these conditions have triggered post-storm disease outbreaks, such as waterborne infections from contaminated floodwaters, though effective warning systems have helped reduce such risks in recent decades.

Observed changes

Historical analyses of European windstorm frequency, derived from reanalysis datasets and observational , indicate a slight overall decline in recent decades relative to mid-20th century peaks, with multidecadal patterns showing lower activity in the compared to the . This trend is modest relative to natural interannual variability, but notable increases in storm clustering have been observed, such as the 2013-14 season, which featured notable clustering of intense events over a single winter, exacerbating cumulative impacts. Data from the European Severe Weather Database (ESWD) and NOAA support these patterns, with pre-1950 gaps addressed through proxies like ship logs incorporated into the Reanalysis (20CR). Regarding intensity, ERA5 reanalysis data reveal no significant upward trend in peak wind speeds or central pressures for European from 1979 to the present, with extreme winds showing a flat trajectory over this period. However, shifts in storm tracks have led to more frequent southern trajectories impacting the Mediterranean region, as evidenced by increased paths extending into southeastern . These changes contribute to stable overall intensity metrics but alter regional exposure patterns. Regional variations highlight wind impacts in northern and modulated by (NAO) variability, with recent analyses indicating a general stability or slight decline in high-gust days in the UK since 1980. This aligns with broader observations of variable storminess in , though trends remain within the bounds of decadal fluctuations. In recent seasons, the 2024-25 period recorded 6 named storms, below the long-term average, yet some events were notably intense; for instance, the early 2025-26 season's Storm Amy in October 2025 produced gusts up to 224 km/h in . As of November 2025, the recent quiet period in European windstorms persists, with below-average activity continuing into the current season. Attribution studies indicate no clear anthropogenic signal in these observed changes to date, attributing variations primarily to internal variability.

Future projections

Climate model ensembles from the Phase 6 (CMIP6) indicate a consensus toward a modest decrease in the overall frequency of extratropical cyclones affecting under high-emissions scenarios like SSP5-8.5, with projections showing a 4-6% reduction by the end of the compared to the late . However, regional variations emerge, particularly in where storm frequency may increase slightly, up to 1.2 additional cyclones per month in areas like the and , driven by enhanced baroclinicity and stronger jet streams. For storm intensity, models project potential increases of around 5-10% in maximum wind speeds over and , attributed to thermodynamic enhancements and dynamical shifts, though inter-model spread leads to low-to-medium confidence in these estimates. In contrast, southern regions may experience decreases in both frequency and intensity, with damage potential reduced by up to 28% in the . Projections also suggest shifts in storm tracks, with a tendency toward more poleward and eastward migration in the North Atlantic, reducing risks in the Mediterranean while heightening exposure in the and northern high latitudes. This poleward displacement is linked to expanded Hadley cells and altered positions under global warming, though uncertainties arise from cloud feedbacks and internal variability, complicating precise regional forecasts. High-resolution efforts, such as those from EURO-CORDEX, highlight increased risks of compound events combining high winds and heavy rainfall, particularly with 2°C of warming; for instance, extratropical cyclones producing both extreme wind and rain severity over the and are projected to occur 3.6 times more frequently by mid-to-late century under RCP8.5. Economic implications of these changes include potential rises in annual insured losses, with CMIP6-based assessments estimating increases to €11.4 billion per year by 2100 under 3°C warming when accounting for socioeconomic growth, though relative losses remain stable at 0.03-0.04% of GDP. Clustering of storms, projected to intensify in central and due to persistent weather regimes, could amplify damages by shortening return periods for multi-storm seasons, necessitating adaptations like resilient power grids to mitigate €20-50 billion in potential cumulative losses by 2050 in high-risk scenarios. gaps persist, particularly in subtropical storm trends where CMIP6 models show low confidence due to biases in cyclone genesis and intensification; recent studies from 2024-2025 further suggest that stratospheric influences, such as strong events, may amplify winter extremes in by increasing cyclone frequency by up to 5% post-event, underscoring the need for improved stratosphere-troposphere coupling in projections.

Notable storms

Historical events (pre-1950)

One of the most devastating European windstorms prior to 1950 was the , which struck the , northern France, , the Netherlands, northern Germany, , southern , and the eastern Baltic coast in late November (Old Style calendar). This generated hurricane-force winds that sank numerous vessels anchored at the Downs off the coast, contributing to over 8,000 deaths, primarily among seamen during the . Historical accounts, including Daniel Defoe's contemporary description in The Storm (1704), portray the event as unprecedented in scale, with mercury barometers in recording a low pressure of approximately 964 hPa, indicating an intense low-pressure system that caused widespread structural damage resembling a battlefield. In the , severe gales continued to afflict coastal regions, as seen in the 1824 Great Gale that battered , particularly and Dorset, with near-hurricane-force winds leading to nearly 100 deaths from flooding, shipwrecks, and collapsing structures. This event destroyed over 80 homes in areas like Chiswell on Portland and inundated low-lying settlements such as , highlighting the vulnerability of early coastal infrastructure. Similarly, the Great Gale of 1871 ravaged the coasts of and , wrecking at least 28 vessels and causing over 50 fatalities, with 70 sailors lost in Bridlington Bay alone amid towering waves that overwhelmed heavily laden ships. These storms underscore the era's reliance on qualitative historical records, such as ship logs and local chronicles, which emphasize their winter occurrence and concentration along exposed coastal zones. Pre-1950 windstorms predominantly inflicted losses through maritime disasters and rudimentary infrastructure failures, with thousands affected across via ship sinkings, uprooted trees damaging early buildings, and disrupted trade routes that formed the backbone of coastal economies. For instance, the 1703 storm not only decimated naval fleets but also felled vast forests and unroofed structures like , while 19th-century events like those in and led to the loss of dozens of vessels and villages, amplifying economic strain on and shipping communities. Documenting these events poses significant challenges due to sparse instrumental data before widespread networks, relying instead on anecdotal proxies like eyewitness narratives, poems, and naval logbooks that provide qualitative insights into and surge heights. Efforts to reconstruct intensities using modern reanalysis techniques, such as integrating rescued shipboard observations, reveal that pre-1950 storms often matched or exceeded modern benchmarks in ferocity, though incomplete records limit precise quantification.

Pre-naming era (1950-2014)

The period from to marked a significant in the history of European windstorms, characterized by improved meteorological and documentation through advancing technologies like and , which allowed for more precise tracking of these events compared to earlier decades. Although storms remained unnamed during this time, several stand out for their devastating impacts, including loss of life, infrastructure damage, and economic costs, often exacerbated by rapid intensification and unusual tracks. These events highlighted the vulnerability of densely populated and coastal regions in Western and to extratropical cyclones. One of the most catastrophic storms occurred on , , when a deep low-pressure system generated a massive across the , affecting the , the , and . The surge reached peaks of 3.35 meters above mean in the , breaching dikes and flooding over 400,000 hectares of land, while in the , it inundated eastern coastal areas up to 3 meters above normal tides. This event resulted in over 2,400 deaths, with approximately 1,836 in the , 307 in the , and 22 in , making it one of the deadliest in post-war . The flooding destroyed homes, livestock, and farmland, prompting major engineering responses such as the Dutch and improved sea defenses. The Great Storm of October 15–16, 1987, also known as Vivian in some meteorological contexts, struck and northern with , producing gusts exceeding 100 mph (161 km/h) in the UK and up to 119 knots (220 km/h) in . It caused 18 deaths in the UK, primarily from falling trees and structural collapses, and felled around 15 million trees, disrupting power to over 1 million homes for days. Economic damages in the UK alone exceeded £1 billion at the time (equivalent to about £2.5 billion in 2023 values), with widespread impacts on transport, , and agriculture. In December 1999, the back-to-back storms Lothar (December 25–26) and Martin (December 27–28) ravaged central Europe, particularly France, Germany, and Switzerland, with Lothar generating winds up to 150 km/h and Martin following a similar path shortly after. Together, they claimed around 110 lives, mostly in France, and caused insured losses of approximately €6.8 billion, due to damage to buildings, power grids, and forests. The storms affected over 3.5 million households with power outages and led to significant timber losses, underscoring the risks of consecutive high-impact events. Other notable storms in this era included the January 2–5, 1976 gale, which battered the , , and with gusts up to 100 knots (185 km/h), causing 85 deaths across the region, severe in , and widespread structural damage. In , Storm Gudrun (also called Erwin) on January 7–9, 2005, brought hurricane-force winds averaging 33 m/s (119 km/h) with peaks over 40 m/s (144 km/h), killing at least 13 people and felling about 75 million cubic meters of timber in alone—roughly 10% of the country's annual harvest—while leaving millions without power. These events exemplified the diverse regional threats, from surges in the to forest devastation in the north. Over this 65-year span, documentation of major windstorms increased markedly due to enhanced observational networks, revealing an average of 10–12 significant events per decade, with peaks in the and driven by clusters like those in 1987 and 1999. This improved recording highlighted trends in loss escalation from socioeconomic factors, such as urban expansion, even as storm frequency showed variability without a clear upward trajectory in intensity.

Named era (2015-present)

The named era of European windstorms began in 2015 when the UK , in collaboration with Met Éireann and the Royal Netherlands Meteorological Institute, introduced a coordinated naming system for storms expected to cause medium or high impacts across northwest . This initiative aimed to improve public awareness and communication during events. Since then, over 70 storms have been named through the 2024/25 season, with the system facilitating timely warnings and response efforts. The 2015/16 season marked the debut of naming, featuring several impactful storms that highlighted the system's value. Storm Abigail, the inaugural named storm on 10 December 2015, brought gusts up to 100 km/h across and the , causing minor disruptions but serving as a test case for the process. Storm Desmond, from 4-6 December 2015, was particularly severe, delivering a UK record 341.4 mm of rain in 24 hours at , , leading to widespread flooding that affected over 5,000 homes and businesses while leaving 23,000 properties without power; it resulted in two fatalities in the . Storm Eva, active on 23-24 December 2015, compounded the flooding with gusts reaching 133 km/h and , exacerbating damage in , including river bursts in and that closed roads and schools. Subsequent seasons saw variable activity, with the 2018/19 period notable for storms causing significant economic losses estimated at over €500 million across and the , driven by wind damage and infrastructure disruptions. Storm Ali on 19 2018 produced violent gusts up to 115 km/h in , toppling trees and cutting power to 300,000 homes. Storms Bronagh and followed in late and October, bringing further heavy rain and winds up to 110 km/h, contributing to localized flooding and transport chaos in the . The 2023/24 season was the most active on record with 12 named storms, reflecting a clustering of intense events that strained emergency services. Storm Henk in early January 2024 caused gusts up to 135 km/h and flooding in . Storm Isha on 21 January 2024 delivered damaging gusts of up to 160 km/h across and the , resulting in two fatalities, widespread power outages affecting 600,000 customers, and travel disruptions including fallen trees and structural damage. Storm Jocelyn, following closely on 23 January, added to the impacts with winds up to 130 km/h, further blackouts, and road closures in and . The 2024/25 season produced six named storms, emphasizing escalating intensities in some cases. Storm Ashley in October 2024 brought gusts to 137 km/h, initiating power cuts and . Storms Bert and Conall in November followed with moderate winds up to 115 km/h, causing minor disruptions. Storm Darragh on 6 December 2024 prompted rare red warnings for wind in parts of and the , with gusts reaching 141 km/h and significant tree damage. Storm Éowyn in January 2025 set records with gusts up to 183 km/h at Mace Head, —the strongest ever there—with sustained winds up to 135 km/h, nearly 1 million properties without power, and heightened public preparedness with 95% of warned individuals taking action. Storm Floris in August 2025 closed the season with unseasonal gusts and rain, affecting . Entering the 2025/26 season, Storm Amy in October 2025 brought gusts up to 139 km/h, causing widespread disruptions including power outages for approximately 184,000 customers across western and , fallen lines, and transport delays, underscoring the ongoing threat of these events. In early November 2025, Storm Claudia brought heavy rain and strong winds to , , , and parts of the , prompting amber warnings for rain.

References

  1. https://www.[academia.edu](/page/Academia.edu)/3513417/The_meteorological_framework_and_the_cultural_memory_of_three_severe_winter_storms_in_early_eighteenth_century_Europe
Add your contribution
Related Hubs
User Avatar
No comments yet.