

Greater Toronto Area
View on Wikipedia
The Greater Toronto Area, commonly referred to as the GTA, includes the city of Toronto and the regional municipalities of Durham, Halton, Peel, and York. In total, the region contains 25 urban, suburban, and rural municipalities.[3][4] The Greater Toronto Area begins in Burlington in Halton Region to the west, and extends along Lake Ontario past downtown Toronto eastward to Clarington in Durham Region.
Key Information


.jpg)


According to the 2021 census, the Census Metropolitan Area (CMA) of Toronto has a total population of 6.202 million residents, making it the nation's largest, and the 7th-largest in North America.[5] However, the Greater Toronto Area, which is an economic area defined by the Government of Ontario,[citation needed] includes communities that are not included in the CMA, as defined by Statistics Canada. Extrapolating the data for all 25 communities in the Greater Toronto Area from the 2021 Census, the total population for the economic region included 6,711,985 people.[citation needed]
The Greater Toronto Area is a part of several larger areas in Southern Ontario. The area is also combined with the city of Hamilton to form a conurbation known as the Greater Toronto and Hamilton Area (GTHA).[6][7] The GTHA combined with Niagara Region form the core of the Golden Horseshoe.
Etymology
[edit]The term "Greater Toronto" was first used in writing as early as the 1900s although at the time, the term referred only to the old city of Toronto and to its immediate townships and villages, which became Metropolitan Toronto in 1954 and became the current city of Toronto in 1998.[8] The use of the term involving the four surrounding regional municipalities came into formal use in the mid-1980s, when it was used in a widely discussed report on municipal governance restructuring in the region and was later made official as a provincial planning area. However, it did not come into everyday usage until the mid-to-late 1990s.
In 2006, the term began to be supplanted in the field of spatial planning as provincial policy increasingly began to refer to either the "Greater Toronto and Hamilton Area" (GTHA)[a] or the still-broader "Greater Golden Horseshoe".[10] The latter includes the Greater Toronto Area's satellite municipalities, such as Peterborough, Barrie, Guelph, Kitchener, Waterloo, Cambridge and Niagara Region. The GTA continues, however, to be in official use elsewhere in the Government of Ontario, such as the Ministry of Finance.
Census metropolitan area
[edit]
.jpg)


Some municipalities considered part of the GTA are not within the Toronto Census Metropolitan Area (CMA), which is smaller than the land area and population of the GTA planning area. For example, Oshawa is the centre of its own CMA, yet deemed part of the Greater Toronto Area, while other municipalities, such as New Tecumseth in southern Simcoe County and Mono Township in Dufferin County are included in the Toronto CMA but not in the GTA.[11] These different border configurations result in the GTA's population being higher than the Toronto CMA by nearly one-half million people, often leading to confusion amongst people when trying to sort out Toronto's urban population.
Other nearby urban areas, such as Hamilton, Barrie, St. Catharines-Niagara or Kitchener-Waterloo, are not part of the GTA or the Toronto CMA, but form their own CMAs near the GTA.[12] Ultimately, all the aforementioned places are part of the Greater Golden Horseshoe metropolitan region, an urban agglomeration,[13] which is the fifth most populous in North America. It is part of the Great Lakes megalopolis, containing an estimated 59.1 million people in 2011.
| Census division | Census subdivision | In GTA | Toronto CMA | Oshawa CMA | Hamilton CMA |
|---|---|---|---|---|---|
| Toronto |  |
|
|||
| Durham Region | Ajax | |
|
||
| Clarington | |
|
|||
| Brock | |
||||
| Oshawa | |
|
|||
| Pickering | |
|
|||
| Scugog | |
||||
| Uxbridge | |
|
|||
| Whitby | |
|
|||
| Halton Region | Burlington | |
| ||
| Halton Hills | |
|
|||
| Milton | |
|
|||
| Oakville | |
|
|||
| Peel Region | Brampton | |
|
||
| Caledon | |
|
|||
| Mississauga | |
|
|||
| York Region | Aurora | |
|
||
| East Gwillimbury | |
|
|||
| Georgina | |
|
|||
| King | |
|
|||
| Markham | |
|
|||
| Newmarket | |
|
|||
| Richmond Hill | |
|
|||
| Vaughan | |
|
|||
| Whitchurch-Stouffville | |
|
|||
| Chippewas of Georgina Island First Nation | |
|
|||
| Dufferin County | Mono | |
|||
| Orangeville | |
||||
| Simcoe County | Bradford West Gwillimbury | |
|||
| New Tecumseth | |
||||
Extended area
[edit]The term "Greater Toronto and Hamilton Area" (GTHA) refers to the GTA, and the city of Hamilton, located along the western border of the Greater Toronto Area. The term has been adopted by several organizations, including Metrolinx and the Ministry of Energy)[9][6] because of the growing commuter population in the combined region. The GTHA and the Regional Municipality of Niagara form the inner ring of the larger Greater Golden Horseshoe, an urban agglomeration and secondary region of Ontario.
History
[edit]Early history
[edit]Historically, the Greater Toronto Area was home to a number of First Nations who lived on the shore of Lake Ontario long before the first Europeans arrived in the region. At various times, the Neutral,[14] the Seneca, the Mohawk and the Huron nations were living in the vicinity.[15] The Mississaugas arrived in the late 17th or early 18th century, driving out the occupying Iroquois.[16][17] While it is unclear as to who was the first European to reach the Toronto area, there is no question it occurred in the 17th century.[18]

The area would later become very crucial for its series of trails and water routes that led from northern and western Canada to the Gulf of Mexico. Known as the "Toronto Passage", it followed the Humber River, as an important overland shortcut between Lake Ontario, Lake Simcoe and the upper Great Lakes.[19] For this reason the area, under French fur traders, became a major part of the North American fur trade.[18] The French would later establish three trading forts, Magasin Royal in the 1720s, although abandoned within the decade, Fort Toronto in 1750 and Fort Rouillé in 1751. During the Seven Years' War both forts were abandoned but Fort Toronto was later renovated. Fort Rouillé was burnt down after the Battle of Fort Niagara in 1759 by the French garrison during the French and Indian War.[18][20]
The first large influx of European settlers to settle the region were the United Empire Loyalists arriving after the American Revolution, when various individuals petitioned the Crown for land in and around the Toronto area.[18] In 1787, the British negotiated the purchase of more than a quarter million acres (1,000 km2 [390 sq mi]) of land in the area of Toronto with the Mississaugas of New Credit.[21] York County, would later be created by Governor John Graves Simcoe in 1792, which would at its largest size, comprise all of what is now Halton Region, Toronto, Peel Region, York Region and parts of Durham Region.[22]
The GTA saw three American incursions during the War of 1812. The Town of York (present-day Toronto) was attacked by American forces at Battle of York, on April 27, 1813; and was subsequently occupied until May 8.[23] The second incursion occurred several months later, in July 1813, with two landings in the GTA. On July 29, American forces landed at Burlington Beach (present-day Burlington) in an attempt to dislodge British forces at the adjacent Burlington Heights.[24] However, finding the British forces too well-entrenched for any assault to be successful, the American naval force withdrew and proceeded east towards York. The American landings at York on July 31 went unopposed, with most of the soldiers garrisoned at York directed to defend Burlington Heights.[24] The third incursion occurred a year later, when an American naval squadron arrived outside of York's harbour on August 6, 1814. The squadron dispatched USS Lady of the Lake to enter the harbour in order to gauge the town's defences, where it briefly exchanged cannon fire with Fort York before withdrawing to rejoin the American squadron outside the harbour. American forces did not attempt a landing during this incursion, although remained outside York's harbour for three days before departing.[24]
In 1816, Wentworth County (which would later become the city of Hamilton) and Halton County were created from York County.[25] York County would later serve as the setting for the beginnings of the Upper Canada Rebellion with William Lyon Mackenzie's armed march from Holland Landing towards York Township on Yonge Street, eventually leading up to the battle at Montgomery's Tavern.[26] In 1851, Ontario County (present-day Durham Region) and Peel County were separated from York.[25][27]

Since 1901
[edit] | This article needs to be updated. (August 2018) |
The idea towards a streamlined local government to control local infrastructure was made as early as 1907 by, William Findlay Maclean, a member of parliament and founder of The Toronto World, who called for the expansion of the government of the former City of Toronto in order to create a Greater Toronto.[8] The idea for a single government municipality would not be seriously explored until the late 1940s when planners decided the city needed to incorporate its immediate suburbs. However, due to strong opposition from suburban politicians, a compromise was struck, which resulted in the creation of Metropolitan Toronto.[28] In 1953, the portion of York County south of Steeles Avenue, a concession road which formed a common boundary between several townships across the width of the county, was severed from it and incorporated as the Municipality of Metropolitan Toronto.[29] With the concession of Metro Toronto, the offices of York County were moved from Toronto to Newmarket.
Originally, the membership in Metropolitan Toronto included the City of Toronto and five townships: East York, Etobicoke, North York, Scarborough and York; as well as seven villages and towns, which became amalgamated into their surrounding townships in 1967.[30] The early Metro Toronto government debated over the annexation of surrounding townships of Markham, Pickering and Vaughan. Frederick Goldwin Gardiner, the first Metro Toronto Chairman, planned on the conversion of these townships into boroughs of the Metro Toronto government.[31] In 1971, the remaining areas of York County was replaced by the Ontario government with the Regional Municipality of York.[30] In 1974, Ontario and Durham Counties were reorganized to become the Regional Municipality of Durham; Pickering west of Rouge River was transferred to Scarborough at that time. Peel County became Peel Region in 1974 as well. In 1980, North York would be incorporated into a city, with York following suit in 1983 and Etobicoke and Scarborough in 1984, although still part of the Metropolitan Toronto municipal government.[30]

In 1992, the Ontario government passed legislation requiring Metropolitan Toronto to include the rest of the Greater Toronto Area into its planning.[32] However, there was fear different parts of the municipal system were working against one another. Therefore, Bob Rae, the Premier of Ontario, appointed Anne Golden to head a GTA task force to govern the region's quality of life, competitiveness and governance.[33] During this time, the Metro Toronto government advocated to the task force the creation of a new GTA authority, which would be made up of 21 of the 30 existing municipalities in the GTA at the time. The proposal from Metro Toronto would have resulted in 15 new municipalities. The City of Mississauga argued consolidation should take place only in such a way the new municipalities would have a population between 400,000 and 800,000.[34] The Town of Markham had similarly advocated municipal consolidation in York Region but opposed to complete consolidation into a single municipality. Municipal consolidation faced stiff opposition, however. from smaller communities such as Ajax, Milton, and the borough of East York.[35]
The task force's recommendation to eliminate the Metro Toronto government, and consolidate its remaining municipalities into an enlarged City of Toronto was completed in 1997 and became official in 1998, under the Common Sense Revolution of the then premier, Mike Harris.[36] However, the task force's recommendation to create a GTA-wide upper-tier municipality was not taken up by the Harris government for fear that a GTA-wide municipality would recreate the intermunicipal competitiveness that was believed to have impaired the former Metro Toronto government.[37]
Metrolinx, an agency of the Government of Ontario, was established to oversee public transit development across the Greater Toronto Area.
The Greater Toronto Area hosted the 2015 Pan American Games.
Geography
[edit]


The Greater Toronto Area covers an area of 7,125 km2 (2,751 sq mi).[38] The region itself is bordered by Lake Ontario to the south, Kawartha Lakes to the east, the Niagara Escarpment to the west, and Lake Simcoe to the north. The region creates a natural ecosystem known as the Greater Toronto Bioregion. The Greater Toronto Area forms part of the neck of the Ontario Peninsula.
Vast parts of the region remain farmland and forests, making it one of the distinctive features of the geography of the GTA. Most of the urban areas in the GTA hold large urban forest. For the most part designated as parkland, the ravines are largely undeveloped. Rouge Park is also one of the largest nature parks within the core of a metropolitan area.[39] Much of these areas also constitute the Toronto ravine system, which consists of deep and steep valleys, and a number of conservation areas in the region which are managed by Toronto and Region Conservation Authority.[40] The Cheltenham Badlands, in Caledon, is an example of environmental degradation from poor agricultural practice. The Scarborough Bluffs are part of the Glacial Lake Iroquois shoreline.
In 2005, the Government of Ontario also passed legislation to prevent urban development and sprawl on environmentally sensitiveland in the Greater Toronto Area, known as the Greenbelt; many of the areas include protected sections of the Oak Ridges Moraine, Rouge Park, and the Niagara Escarpment.[41] Nevertheless, low-density suburban developments continue to be built, some of which is on or near ecologically sensitive and protected areas. The provincial government attempted to address the issue through the "Places to Grow" legislation passed in 2005, which emphasizes higher-density growth in existing urban centres over the next 25 years (i.e., until 2030).[42]
Climate
[edit]The climate of the Greater Toronto Area is classified as humid continental, according to the Köppen climate classification. Much of the Greater Toronto Area is under Köppen Dfb (warm summer subtype) zone. Old Toronto (excluding the Toronto Islands) and some areas between there and Burlington to the southwest are under the Köppen Dfa climate zone, the hot summer subtype; this is the result of the urban heat island effect, especially in Old Toronto. Precipitation averages 832 mm (32.8 in) annually, which is fairly distributed through the year but is driest in later winter with higher average totals in the later summer.
In winter, typical high temperatures will range from −5 to 3 °C (23 to 37 °F) and low temperatures from −12 to −5 °C (10 to 23 °F). Cold arctic outbreaks keep daytime highs below −10 °C (14 °F) for several days but that does not occur in every winter, and low temperatures sometimes drop below −18 °C (0 °F), with the accompanying wind chill making that feel much colder. Annual snowfall averages between 80 and 150 cm (31 and 59 in) across the area. Mild and snow-free spells are also a feature of Toronto's winter, with temperatures surpassing 5 °C (41 °F) for several days to occasionally above 15 °C (59 °F). Spring is short and often cool to mild, and snow can sometimes fall well into April but rarely accumulates. The transition from spring into summer can be rapid. Summer is warm on average to hot and moderately humid with high temperatures typically between 24 and 31 °C (75 and 88 °F), while low temperatures average between 15 °C (59 °F) in the suburbs and 18 to 20 °C (64 to 68 °F) downtown and near the lake. Although fairly sunny, summers have long stretches of humid conditions that give rise to frequent thunderstorm activity, and very heavy rainfall sometimes results in flash flooding. Heat wave conditions with temperatures between 32 and 35 °C (90 and 95 °F) are common but typically do not last long, and rarely temperatures rarely reach 38 °C (100 °F). Humidex values can be high during heat episodes; at their highest, they have exceeded 50 °C (122 °F). Immediate lakeshore locations have generally lower average maximum temperatures but they can also experience hot conditions when offshore winds prevail. Normally, autumns alternate between wet and dry with lengthy periods of mild and calm weather. Temperatures fall and windspeeds increase sharply in November. By December, cold and snowy weather is more common, and the average temperature falls close to or just below 0 °C (32 °F).
Climate data
[edit]| Climate data for Toronto (The Annex) WMO ID: 71266; coordinates 43°40′N 79°24′W / 43.667°N 79.400°W; elevation: 112.5 m (369 ft); 1991–2020[b] normals, extremes 1840–present[c] | |||||||||||||
|---|---|---|---|---|---|---|---|---|---|---|---|---|---|
| Month | Jan | Feb | Mar | Apr | May | Jun | Jul | Aug | Sep | Oct | Nov | Dec | Year |
| Record high humidex | 15.7 | 12.2 | 21.7 | 31.6 | 39.8 | 44.5 | 43.0 | 42.6 | 43.8 | 31.2 | 26.1 | 17.7 | 44.5 |
| Record high °C (°F) | 16.1 (61.0) |
19.1 (66.4) |
26.7 (80.1) |
32.2 (90.0) |
34.4 (93.9) |
36.7 (98.1) |
40.6 (105.1) |
38.9 (102.0) |
37.8 (100.0) |
30.8 (87.4) |
23.9 (75.0) |
19.9 (67.8) |
40.6 (105.1) |
| Mean daily maximum °C (°F) | −0.3 (31.5) |
0.6 (33.1) |
5.1 (41.2) |
11.7 (53.1) |
18.8 (65.8) |
24.2 (75.6) |
27.0 (80.6) |
26.1 (79.0) |
22.0 (71.6) |
14.6 (58.3) |
8.1 (46.6) |
2.6 (36.7) |
13.4 (56.1) |
| Daily mean °C (°F) | −3.5 (25.7) |
−2.7 (27.1) |
1.7 (35.1) |
7.8 (46.0) |
14.5 (58.1) |
19.8 (67.6) |
22.5 (72.5) |
21.9 (71.4) |
17.9 (64.2) |
11.2 (52.2) |
5.2 (41.4) |
−0.1 (31.8) |
9.7 (49.5) |
| Mean daily minimum °C (°F) | −6.7 (19.9) |
−6.0 (21.2) |
−1.8 (28.8) |
3.9 (39.0) |
10.0 (50.0) |
15.3 (59.5) |
18.1 (64.6) |
17.7 (63.9) |
13.8 (56.8) |
7.7 (45.9) |
2.3 (36.1) |
−2.7 (27.1) |
6.0 (42.8) |
| Record low °C (°F) | −32.8 (−27.0) |
−31.7 (−25.1) |
−26.7 (−16.1) |
−15.0 (5.0) |
−3.9 (25.0) |
−2.2 (28.0) |
3.9 (39.0) |
4.4 (39.9) |
−2.2 (28.0) |
−8.9 (16.0) |
−20.6 (−5.1) |
−30.0 (−22.0) |
−32.8 (−27.0) |
| Record low wind chill | −37 | −34 | −26 | −17 | −8 | 0 | 0 | 0 | 0 | −8 | −17 | −34 | −37 |
| Average precipitation mm (inches) | 64.6 (2.54) |
53.9 (2.12) |
52.8 (2.08) |
78.0 (3.07) |
76.4 (3.01) |
81.6 (3.21) |
76.5 (3.01) |
71.9 (2.83) |
69.4 (2.73) |
69.1 (2.72) |
70.8 (2.79) |
57.8 (2.28) |
822.7 (32.39) |
| Average rainfall mm (inches) | 29.1 (1.15) |
29.7 (1.17) |
33.6 (1.32) |
61.1 (2.41) |
82.0 (3.23) |
70.9 (2.79) |
63.9 (2.52) |
81.1 (3.19) |
84.7 (3.33) |
64.3 (2.53) |
75.4 (2.97) |
38.2 (1.50) |
714.0 (28.11) |
| Average snowfall cm (inches) | 37.2 (14.6) |
27.0 (10.6) |
19.8 (7.8) |
5.0 (2.0) |
0.0 (0.0) |
0.0 (0.0) |
0.0 (0.0) |
0.0 (0.0) |
0.0 (0.0) |
0.1 (0.0) |
8.3 (3.3) |
24.1 (9.5) |
121.5 (47.8) |
| Average precipitation days (≥ 0.2 mm) | 16.3 | 12.8 | 13.0 | 13.1 | 13.4 | 12.1 | 11.7 | 9.5 | 10.2 | 11.4 | 13.0 | 13.7 | 150.2 |
| Average rainy days (≥ 0.2 mm) | 5.4 | 4.8 | 7.9 | 11.2 | 12.7 | 11.0 | 10.4 | 10.2 | 11.1 | 11.7 | 10.9 | 7.0 | 114.1 |
| Average snowy days (≥ 0.2 cm) | 12.0 | 8.7 | 6.5 | 2.2 | 0.0 | 0.0 | 0.0 | 0.0 | 0.0 | 0.08 | 3.1 | 8.4 | 40.9 |
| Average relative humidity (%) (at 15:00 LST) | 68.0 | 65.4 | 58.5 | 53.4 | 53.1 | 55.2 | 54.3 | 56.7 | 59.6 | 65.0 | 67.1 | 70.9 | 60.6 |
| Mean monthly sunshine hours | 85.9 | 111.3 | 161.0 | 180.0 | 227.7 | 259.6 | 279.6 | 245.6 | 194.4 | 154.3 | 88.9 | 78.1 | 2,066.3 |
| Percentage possible sunshine | 29.7 | 37.7 | 43.6 | 44.8 | 50.0 | 56.3 | 59.8 | 56.7 | 51.7 | 45.1 | 30.5 | 28.0 | 44.5 |
| Source: Environment and Climate Change Canada[43][44] | |||||||||||||
| Climate data for Bowmanville Mostert (Clarington) Climate ID: 6150830; coordinates 43°55′N 78°40′W / 43.917°N 78.667°W; elevation 99.1 m (325 ft), 1981–2010 normals | |||||||||||||
|---|---|---|---|---|---|---|---|---|---|---|---|---|---|
| Month | Jan | Feb | Mar | Apr | May | Jun | Jul | Aug | Sep | Oct | Nov | Dec | Year |
| Record high °C (°F) | 13.0 (55.4) |
12.5 (54.5) |
21.5 (70.7) |
29.0 (84.2) |
33.0 (91.4) |
33.5 (92.3) |
36.0 (96.8) |
35.0 (95.0) |
32.2 (90.0) |
26.0 (78.8) |
21.1 (70.0) |
17.5 (63.5) |
36.0 (96.8) |
| Mean daily maximum °C (°F) | −1.4 (29.5) |
0.0 (32.0) |
4.3 (39.7) |
11.3 (52.3) |
18.0 (64.4) |
23.1 (73.6) |
25.8 (78.4) |
24.8 (76.6) |
20.4 (68.7) |
13.7 (56.7) |
7.2 (45.0) |
1.6 (34.9) |
12.4 (54.3) |
| Daily mean °C (°F) | −5.6 (21.9) |
−4.4 (24.1) |
−0.2 (31.6) |
6.4 (43.5) |
12.4 (54.3) |
17.5 (63.5) |
20.0 (68.0) |
19.2 (66.6) |
15.0 (59.0) |
8.7 (47.7) |
3.4 (38.1) |
−2.2 (28.0) |
7.5 (45.5) |
| Mean daily minimum °C (°F) | −9.9 (14.2) |
−8.8 (16.2) |
−4.6 (23.7) |
1.5 (34.7) |
6.8 (44.2) |
11.8 (53.2) |
14.3 (57.7) |
13.5 (56.3) |
9.5 (49.1) |
3.6 (38.5) |
−0.4 (31.3) |
−6.0 (21.2) |
2.6 (36.7) |
| Record low °C (°F) | −34.0 (−29.2) |
−30.0 (−22.0) |
−26.0 (−14.8) |
−14.4 (6.1) |
−5.0 (23.0) |
−1.0 (30.2) |
2.8 (37.0) |
−0.5 (31.1) |
−3.3 (26.1) |
−8.3 (17.1) |
−17.8 (0.0) |
−34.5 (−30.1) |
−34.5 (−30.1) |
| Average precipitation mm (inches) | 63.1 (2.48) |
50.5 (1.99) |
55.0 (2.17) |
70.6 (2.78) |
75.9 (2.99) |
83.8 (3.30) |
63.2 (2.49) |
78.1 (3.07) |
98.7 (3.89) |
70.8 (2.79) |
88.6 (3.49) |
68.1 (2.68) |
866.5 (34.11) |
| Average rainfall mm (inches) | 32.2 (1.27) |
32.8 (1.29) |
41.0 (1.61) |
68.0 (2.68) |
75.9 (2.99) |
83.8 (3.30) |
63.2 (2.49) |
78.1 (3.07) |
98.7 (3.89) |
70.6 (2.78) |
83.1 (3.27) |
46.1 (1.81) |
773.3 (30.44) |
| Average snowfall cm (inches) | 31.0 (12.2) |
17.7 (7.0) |
14.1 (5.6) |
2.6 (1.0) |
0.0 (0.0) |
0.0 (0.0) |
0.0 (0.0) |
0.0 (0.0) |
0.0 (0.0) |
0.1 (0.0) |
5.6 (2.2) |
22.0 (8.7) |
93.1 (36.7) |
| Average precipitation days (≥ 0.2 mm) | 12.5 | 10.8 | 11.2 | 12.5 | 12.2 | 12.0 | 10.4 | 11.5 | 13.0 | 13.0 | 14.3 | 13.0 | 146.4 |
| Average rainy days (≥ 0.2 mm) | 5.5 | 5.3 | 8.0 | 11.8 | 12.2 | 12.0 | 10.4 | 11.5 | 13.0 | 13.0 | 12.7 | 7.4 | 122.7 |
| Average snowy days (≥ 0.2 cm) | 7.8 | 6.3 | 4.0 | 1.1 | 0.0 | 0.0 | 0.0 | 0.0 | 0.0 | 0.1 | 2.1 | 6.5 | 27.9 |
| Source: Environment Canada[45] | |||||||||||||
| Climate data for Oshawa WCPC Climate ID: 6155878; coordinates 43°52′N 78°50′W / 43.867°N 78.833°W, elevation: 83.8 m (275 ft); 1991−2020 normals, extremes 1882–present[46] | |||||||||||||
|---|---|---|---|---|---|---|---|---|---|---|---|---|---|
| Month | Jan | Feb | Mar | Apr | May | Jun | Jul | Aug | Sep | Oct | Nov | Dec | Year |
| Record high °C (°F) | 14.0 (57.2) |
18.3 (64.9) |
23.5 (74.3) |
29.5 (85.1) |
32.0 (89.6) |
34.5 (94.1) |
39.4 (102.9) |
36.0 (96.8) |
34.4 (93.9) |
28.2 (82.8) |
23.0 (73.4) |
16.5 (61.7) |
39.4 (102.9) |
| Mean daily maximum °C (°F) | −1.1 (30.0) |
−0.2 (31.6) |
4.5 (40.1) |
10.6 (51.1) |
17.5 (63.5) |
22.7 (72.9) |
25.7 (78.3) |
24.8 (76.6) |
20.9 (69.6) |
13.6 (56.5) |
7.5 (45.5) |
2.2 (36.0) |
12.4 (54.3) |
| Daily mean °C (°F) | −5 (23) |
−4.2 (24.4) |
0.3 (32.5) |
6.2 (43.2) |
12.6 (54.7) |
17.8 (64.0) |
20.9 (69.6) |
20.1 (68.2) |
16.2 (61.2) |
9.5 (49.1) |
3.9 (39.0) |
−1.2 (29.8) |
8.1 (46.6) |
| Mean daily minimum °C (°F) | −8.9 (16.0) |
−8.3 (17.1) |
−3.9 (25.0) |
1.7 (35.1) |
7.6 (45.7) |
12.9 (55.2) |
15.8 (60.4) |
15.4 (59.7) |
11.4 (52.5) |
5.3 (41.5) |
0.3 (32.5) |
−4.6 (23.7) |
3.7 (38.7) |
| Record low °C (°F) | −32.8 (−27.0) |
−34.4 (−29.9) |
−28.3 (−18.9) |
−17.2 (1.0) |
−6.1 (21.0) |
0.0 (32.0) |
2.8 (37.0) |
0.0 (32.0) |
−5 (23) |
−12.8 (9.0) |
−19.4 (−2.9) |
−32.2 (−26.0) |
−34.4 (−29.9) |
| Average precipitation mm (inches) | 74.7 (2.94) |
53.5 (2.11) |
53.9 (2.12) |
86.9 (3.42) |
85.1 (3.35) |
94.0 (3.70) |
85.8 (3.38) |
74.2 (2.92) |
86.2 (3.39) |
71.8 (2.83) |
72.5 (2.85) |
67.8 (2.67) |
906.3 (35.68) |
| Average rainfall mm (inches) | 41.2 (1.62) |
27.7 (1.09) |
42.9 (1.69) |
85.3 (3.36) |
85.1 (3.35) |
94.0 (3.70) |
85.8 (3.38) |
74.2 (2.92) |
86.2 (3.39) |
71.7 (2.82) |
67.4 (2.65) |
43.1 (1.70) |
804.6 (31.68) |
| Average snowfall cm (inches) | 33.5 (13.2) |
25.8 (10.2) |
10.9 (4.3) |
1.6 (0.6) |
0.0 (0.0) |
0.0 (0.0) |
0.0 (0.0) |
0.0 (0.0) |
0.0 (0.0) |
0.1 (0.0) |
5.1 (2.0) |
24.7 (9.7) |
101.7 (40.0) |
| Average precipitation days (≥ 0.2 mm) | 13.8 | 10.2 | 10.6 | 12.4 | 12.2 | 11.8 | 10.8 | 10.3 | 11.0 | 13.5 | 13.6 | 12.9 | 143.1 |
| Average rainy days (≥ 0.2 mm) | 6.0 | 4.3 | 7.9 | 12.1 | 12.2 | 11.8 | 10.8 | 10.3 | 11.0 | 13.5 | 12.4 | 7.8 | 120.1 |
| Average snowy days (≥ 0.2 cm) | 8.5 | 6.8 | 3.3 | 0.74 | 0.0 | 0.0 | 0.0 | 0.0 | 0.0 | 0.09 | 1.6 | 5.8 | 26.8 |
| Source: Environment and Climate Change Canada[47][48] | |||||||||||||
| Climate data for Burlington TS Climate ID: 6151064; coordinates 43°20′N 79°50′W / 43.333°N 79.833°W, elevation: 99.1 m (325 ft); 1981–2010 normals, extremes 1866–present[note 1] | |||||||||||||
|---|---|---|---|---|---|---|---|---|---|---|---|---|---|
| Month | Jan | Feb | Mar | Apr | May | Jun | Jul | Aug | Sep | Oct | Nov | Dec | Year |
| Record high °C (°F) | 18.4 (65.1) |
17.9 (64.2) |
27.2 (81.0) |
32.0 (89.6) |
36.1 (97.0) |
38.9 (102.0) |
41.1 (106.0) |
38.3 (100.9) |
37.8 (100.0) |
31.1 (88.0) |
26.7 (80.1) |
22.0 (71.6) |
41.1 (106.0) |
| Mean daily maximum °C (°F) | −0.6 (30.9) |
0.8 (33.4) |
5.2 (41.4) |
12.4 (54.3) |
19.4 (66.9) |
25.0 (77.0) |
28.0 (82.4) |
26.7 (80.1) |
21.8 (71.2) |
15.1 (59.2) |
8.0 (46.4) |
2.4 (36.3) |
13.7 (56.7) |
| Daily mean °C (°F) | −4.4 (24.1) |
−3.2 (26.2) |
1.0 (33.8) |
7.5 (45.5) |
13.9 (57.0) |
19.4 (66.9) |
22.5 (72.5) |
21.4 (70.5) |
16.9 (62.4) |
10.4 (50.7) |
4.4 (39.9) |
−1 (30) |
9.1 (48.4) |
| Mean daily minimum °C (°F) | −8.1 (17.4) |
−7.1 (19.2) |
−3.3 (26.1) |
2.6 (36.7) |
8.3 (46.9) |
13.8 (56.8) |
16.9 (62.4) |
16.1 (61.0) |
11.9 (53.4) |
5.7 (42.3) |
0.7 (33.3) |
−4.3 (24.3) |
4.4 (39.9) |
| Record low °C (°F) | −30.6 (−23.1) |
−29.4 (−20.9) |
−27.2 (−17.0) |
−14.4 (6.1) |
−7.2 (19.0) |
0.0 (32.0) |
1.1 (34.0) |
1.7 (35.1) |
−3.9 (25.0) |
−11.1 (12.0) |
−22.8 (−9.0) |
−27.8 (−18.0) |
−30.6 (−23.1) |
| Average precipitation mm (inches) | 66.0 (2.60) |
54.5 (2.15) |
61.6 (2.43) |
70.6 (2.78) |
81.0 (3.19) |
69.1 (2.72) |
75.3 (2.96) |
82.0 (3.23) |
83.1 (3.27) |
71.9 (2.83) |
84.9 (3.34) |
63.0 (2.48) |
863.1 (33.98) |
| Average rainfall mm (inches) | 31.8 (1.25) |
33.0 (1.30) |
44.7 (1.76) |
68.2 (2.69) |
81.0 (3.19) |
69.1 (2.72) |
75.3 (2.96) |
82.0 (3.23) |
83.1 (3.27) |
71.9 (2.83) |
79.7 (3.14) |
43.5 (1.71) |
763.3 (30.05) |
| Average snowfall cm (inches) | 34.2 (13.5) |
21.5 (8.5) |
16.9 (6.7) |
2.4 (0.9) |
0.0 (0.0) |
0.0 (0.0) |
0.0 (0.0) |
0.0 (0.0) |
0.0 (0.0) |
0.0 (0.0) |
5.3 (2.1) |
19.5 (7.7) |
99.9 (39.3) |
| Average precipitation days (≥ 0.2 mm) | 12.4 | 9.6 | 11.0 | 12.5 | 11.8 | 10.9 | 10.1 | 10.2 | 10.9 | 10.7 | 13.9 | 11.9 | 135.8 |
| Average rainy days (≥ 0.2 mm) | 4.9 | 4.5 | 8.0 | 11.7 | 11.8 | 10.9 | 10.1 | 10.2 | 10.9 | 10.7 | 12.7 | 7.7 | 113.9 |
| Average snowy days (≥ 0.2 cm) | 8.1 | 6.0 | 3.6 | 0.84 | 0.0 | 0.0 | 0.0 | 0.0 | 0.0 | 0.0 | 1.6 | 5.4 | 25.5 |
| Source: Environment and Climate Change Canada[49][50] | |||||||||||||
| Climate data for Georgetown WWTP (Halton Hills) Climate ID: 6152695; coordinates 43°28′34″N 79°52′45″W / 43.47611°N 79.87917°W; elevation: 221 m (725 ft); 1981–2010 normals | |||||||||||||
|---|---|---|---|---|---|---|---|---|---|---|---|---|---|
| Month | Jan | Feb | Mar | Apr | May | Jun | Jul | Aug | Sep | Oct | Nov | Dec | Year |
| Record high °C (°F) | 17.0 (62.6) |
15.5 (59.9) |
25.0 (77.0) |
31.5 (88.7) |
34.5 (94.1) |
36.0 (96.8) |
37.0 (98.6) |
36.5 (97.7) |
35.5 (95.9) |
29.5 (85.1) |
22.0 (71.6) |
20.5 (68.9) |
37.0 (98.6) |
| Mean daily maximum °C (°F) | −1.7 (28.9) |
−0.2 (31.6) |
4.6 (40.3) |
12.1 (53.8) |
19.1 (66.4) |
24.4 (75.9) |
26.9 (80.4) |
25.8 (78.4) |
21.4 (70.5) |
14.3 (57.7) |
7.3 (45.1) |
1.1 (34.0) |
12.9 (55.2) |
| Daily mean °C (°F) | −6.3 (20.7) |
−5.2 (22.6) |
−0.9 (30.4) |
6.0 (42.8) |
12.3 (54.1) |
17.4 (63.3) |
20.0 (68.0) |
19.0 (66.2) |
14.8 (58.6) |
8.4 (47.1) |
2.8 (37.0) |
−2.9 (26.8) |
7.1 (44.8) |
| Mean daily minimum °C (°F) | −10.9 (12.4) |
−10.2 (13.6) |
−6.4 (20.5) |
−0.2 (31.6) |
5.3 (41.5) |
10.4 (50.7) |
13.0 (55.4) |
12.1 (53.8) |
8.1 (46.6) |
2.4 (36.3) |
−1.7 (28.9) |
−6.9 (19.6) |
1.3 (34.3) |
| Record low °C (°F) | −33.0 (−27.4) |
−31.5 (−24.7) |
−28.0 (−18.4) |
−13.0 (8.6) |
−5.0 (23.0) |
−0.5 (31.1) |
3.0 (37.4) |
0.0 (32.0) |
−4.0 (24.8) |
−8.5 (16.7) |
−15.5 (4.1) |
−29.5 (−21.1) |
−33.0 (−27.4) |
| Average precipitation mm (inches) | 67.8 (2.67) |
60.0 (2.36) |
57.2 (2.25) |
76.5 (3.01) |
79.3 (3.12) |
74.8 (2.94) |
73.5 (2.89) |
79.3 (3.12) |
86.2 (3.39) |
68.3 (2.69) |
88.5 (3.48) |
65.9 (2.59) |
877.4 (34.54) |
| Average rainfall mm (inches) | 29.7 (1.17) |
28.4 (1.12) |
35.2 (1.39) |
71.3 (2.81) |
79.0 (3.11) |
74.8 (2.94) |
73.5 (2.89) |
79.3 (3.12) |
86.2 (3.39) |
67.8 (2.67) |
79.9 (3.15) |
36.4 (1.43) |
741.5 (29.19) |
| Average snowfall cm (inches) | 38.1 (15.0) |
31.7 (12.5) |
22.1 (8.7) |
5.2 (2.0) |
0.3 (0.1) |
0.0 (0.0) |
0.0 (0.0) |
0.0 (0.0) |
0.0 (0.0) |
0.5 (0.2) |
8.6 (3.4) |
29.5 (11.6) |
135.9 (53.5) |
| Average precipitation days (≥ 0.2 mm) | 12.6 | 9.4 | 10.6 | 12.4 | 11.9 | 11.2 | 10.6 | 10.6 | 11.7 | 12.3 | 13.3 | 12.3 | 138.9 |
| Average rainy days (≥ 0.2 mm) | 4.1 | 4.1 | 6.4 | 11.6 | 11.8 | 11.2 | 10.6 | 10.6 | 11.7 | 12.2 | 11.4 | 6.5 | 112.1 |
| Average snowy days (≥ 0.2 cm) | 9.4 | 6.2 | 4.8 | 1.4 | 0.04 | 0.0 | 0.0 | 0.0 | 0.0 | 0.27 | 2.5 | 6.9 | 31.5 |
| Source: Environment and Climate Change Canada[51] | |||||||||||||
| Climate data for Oakville Southeast WPCP Climate ID: 615N745; coordinates 43°29′N 79°38′W / 43.483°N 79.633°W; elevation: 86.9 m (285 ft); 1981–2010 normals | |||||||||||||
|---|---|---|---|---|---|---|---|---|---|---|---|---|---|
| Month | Jan | Feb | Mar | Apr | May | Jun | Jul | Aug | Sep | Oct | Nov | Dec | Year |
| Record high °C (°F) | 13.9 (57.0) |
15.6 (60.1) |
27.5 (81.5) |
32.0 (89.6) |
33.0 (91.4) |
38.0 (100.4) |
37.0 (98.6) |
37.5 (99.5) |
35.0 (95.0) |
28.9 (84.0) |
23.3 (73.9) |
22.0 (71.6) |
38.0 (100.4) |
| Mean daily maximum °C (°F) | −0.4 (31.3) |
0.6 (33.1) |
4.7 (40.5) |
11.3 (52.3) |
17.9 (64.2) |
23.2 (73.8) |
26.3 (79.3) |
25.2 (77.4) |
20.9 (69.6) |
14.3 (57.7) |
8.3 (46.9) |
2.8 (37.0) |
12.9 (55.2) |
| Daily mean °C (°F) | −4.7 (23.5) |
−3.9 (25.0) |
0.1 (32.2) |
6.4 (43.5) |
12.3 (54.1) |
17.7 (63.9) |
20.9 (69.6) |
20.1 (68.2) |
15.6 (60.1) |
9.3 (48.7) |
4.0 (39.2) |
−1.3 (29.7) |
8.1 (46.6) |
| Mean daily minimum °C (°F) | −8.9 (16.0) |
−8.3 (17.1) |
−4.5 (23.9) |
1.5 (34.7) |
6.8 (44.2) |
12.1 (53.8) |
15.4 (59.7) |
15.0 (59.0) |
10.2 (50.4) |
4.3 (39.7) |
−0.2 (31.6) |
−5.5 (22.1) |
3.2 (37.8) |
| Record low °C (°F) | −30.0 (−22.0) |
−25.0 (−13.0) |
−22.0 (−7.6) |
−14.4 (6.1) |
−3.3 (26.1) |
1.1 (34.0) |
7.0 (44.6) |
3.0 (37.4) |
−1.7 (28.9) |
−7.0 (19.4) |
−14.0 (6.8) |
−27.0 (−16.6) |
−30.0 (−22.0) |
| Average precipitation mm (inches) | 59.8 (2.35) |
46.7 (1.84) |
54.4 (2.14) |
65.2 (2.57) |
73.9 (2.91) |
71.0 (2.80) |
75.8 (2.98) |
78.3 (3.08) |
73.5 (2.89) |
70.0 (2.76) |
79.3 (3.12) |
58.8 (2.31) |
806.7 (31.76) |
| Average rainfall mm (inches) | 31.5 (1.24) |
30.7 (1.21) |
37.2 (1.46) |
63.1 (2.48) |
73.9 (2.91) |
71.0 (2.80) |
75.8 (2.98) |
78.3 (3.08) |
73.5 (2.89) |
70.0 (2.76) |
76.8 (3.02) |
43.9 (1.73) |
725.6 (28.57) |
| Average snowfall cm (inches) | 28.3 (11.1) |
16.1 (6.3) |
17.2 (6.8) |
2.1 (0.8) |
0.0 (0.0) |
0.0 (0.0) |
0.0 (0.0) |
0.0 (0.0) |
0.0 (0.0) |
0.0 (0.0) |
2.5 (1.0) |
14.9 (5.9) |
81.0 (31.9) |
| Average precipitation days (≥ 0.2 mm) | 9.6 | 7.2 | 9.0 | 11.1 | 10.4 | 10.3 | 8.8 | 9.8 | 10.2 | 10.4 | 11.1 | 9.7 | 117.6 |
| Average rainy days (≥ 0.2 mm) | 4.4 | 3.8 | 6.4 | 10.6 | 10.4 | 10.3 | 8.8 | 9.8 | 10.2 | 10.4 | 10.6 | 6.8 | 102.4 |
| Average snowy days (≥ 0.2 cm) | 5.6 | 3.7 | 3.2 | 0.7 | 0.0 | 0.0 | 0.0 | 0.0 | 0.0 | 0.0 | 1.0 | 3.4 | 17.6 |
| Source: Environment and Climate Change Canada[52] | |||||||||||||
| Climate data for Lester B. Pearson International Airport (Brampton and North Mississauga) WMO ID: 71624; coordinates 43°40′38″N 79°37′50″W / 43.67722°N 79.63056°W, elevation: 173.4 m (569 ft), 1991–2020 normals, extremes 1937–present | |||||||||||||
|---|---|---|---|---|---|---|---|---|---|---|---|---|---|
| Month | Jan | Feb | Mar | Apr | May | Jun | Jul | Aug | Sep | Oct | Nov | Dec | Year |
| Record high humidex | 19.0 | 18.3 | 29.6 | 37.9 | 42.6 | 45.6 | 50.3 | 46.6 | 48.0 | 39.1 | 28.6 | 23.9 | 50.3 |
| Record high °C (°F) | 17.6 (63.7) |
17.7 (63.9) |
26.0 (78.8) |
31.1 (88.0) |
34.4 (93.9) |
36.7 (98.1) |
37.9 (100.2) |
38.3 (100.9) |
36.7 (98.1) |
31.8 (89.2) |
25.1 (77.2) |
20.0 (68.0) |
38.3 (100.9) |
| Mean daily maximum °C (°F) | −1.2 (29.8) |
−0.3 (31.5) |
5.0 (41.0) |
12.0 (53.6) |
19.2 (66.6) |
24.5 (76.1) |
27.4 (81.3) |
26.3 (79.3) |
22.3 (72.1) |
14.6 (58.3) |
7.9 (46.2) |
1.9 (35.4) |
13.3 (55.9) |
| Daily mean °C (°F) | −5 (23) |
−4.4 (24.1) |
0.6 (33.1) |
7.0 (44.6) |
13.7 (56.7) |
19.2 (66.6) |
22.1 (71.8) |
21.1 (70.0) |
16.9 (62.4) |
10.0 (50.0) |
4.1 (39.4) |
−1.6 (29.1) |
8.6 (47.5) |
| Mean daily minimum °C (°F) | −8.9 (16.0) |
−8.5 (16.7) |
−3.8 (25.2) |
1.9 (35.4) |
8.2 (46.8) |
13.9 (57.0) |
16.6 (61.9) |
15.8 (60.4) |
11.6 (52.9) |
5.3 (41.5) |
0.2 (32.4) |
−5 (23) |
3.9 (39.0) |
| Record low °C (°F) | −31.3 (−24.3) |
−31.1 (−24.0) |
−28.9 (−20.0) |
−17.2 (1.0) |
−5.6 (21.9) |
0.6 (33.1) |
3.9 (39.0) |
1.1 (34.0) |
−3.9 (25.0) |
−8.3 (17.1) |
−18.3 (−0.9) |
−31.1 (−24.0) |
−31.3 (−24.3) |
| Record low wind chill | −44.7 | −38.9 | −36.2 | −25.4 | −9.5 | 0.0 | 0.0 | 0.0 | −8.0 | −13.5 | −25.4 | −38.5 | −44.7 |
| Average precipitation mm (inches) | 61.6 (2.43) |
50.2 (1.98) |
50.5 (1.99) |
76.7 (3.02) |
77.6 (3.06) |
80.7 (3.18) |
74.0 (2.91) |
68.5 (2.70) |
69.4 (2.73) |
67.2 (2.65) |
71.8 (2.83) |
58.6 (2.31) |
806.8 (31.76) |
| Average rainfall mm (inches) | 33.8 (1.33) |
23.9 (0.94) |
34.0 (1.34) |
70.7 (2.78) |
77.5 (3.05) |
80.7 (3.18) |
74.0 (2.91) |
68.5 (2.70) |
69.4 (2.73) |
67.0 (2.64) |
62.7 (2.47) |
35.3 (1.39) |
697.4 (27.46) |
| Average snowfall cm (inches) | 31.5 (12.4) |
27.7 (10.9) |
17.2 (6.8) |
4.5 (1.8) |
0.1 (0.0) |
0.0 (0.0) |
0.0 (0.0) |
0.0 (0.0) |
0.0 (0.0) |
0.2 (0.1) |
9.3 (3.7) |
24.1 (9.5) |
114.5 (45.1) |
| Average precipitation days (≥ 0.2 mm) | 16.2 | 12.0 | 12.3 | 12.5 | 12.7 | 10.8 | 10.3 | 9.8 | 10.2 | 12.8 | 12.6 | 14.9 | 147.3 |
| Average rainy days (≥ 0.2 mm) | 6.2 | 4.6 | 7.2 | 11.7 | 12.7 | 10.8 | 10.3 | 9.8 | 10.2 | 12.8 | 10.4 | 7.5 | 114.1 |
| Average snowy days (≥ 0.2 cm) | 12.7 | 9.7 | 6.8 | 2.2 | 0.12 | 0.0 | 0.0 | 0.0 | 0.0 | 0.24 | 3.6 | 9.2 | 44.7 |
| Average relative humidity (%) (at 15:00) | 69.7 | 65.7 | 58.5 | 53.4 | 53.6 | 54.4 | 52.9 | 55.2 | 57.3 | 61.6 | 66.7 | 70.5 | 60.0 |
| Mean monthly sunshine hours | 79.7 | 112.2 | 159.4 | 204.4 | 228.2 | 249.7 | 294.4 | 274.5 | 215.7 | 163.7 | 94.2 | 86.2 | 2,161.4 |
| Percentage possible sunshine | 27.6 | 38.0 | 43.2 | 50.8 | 50.1 | 54.1 | 63.0 | 63.4 | 57.4 | 47.8 | 32.0 | 30.9 | 46.5 |
| Source: Environment and Climate Change Canada[53][54][55] | |||||||||||||
| Climate data for Albion Field Centre (Albion Township and Caledon) Climate ID: 6150103; coordinates 43°55′N 79°50′W / 43.917°N 79.833°W; elevation: 281.9 m (925 ft); 1981–2010 normals | |||||||||||||
|---|---|---|---|---|---|---|---|---|---|---|---|---|---|
| Month | Jan | Feb | Mar | Apr | May | Jun | Jul | Aug | Sep | Oct | Nov | Dec | Year |
| Record high °C (°F) | 12.0 (53.6) |
14.5 (58.1) |
24.5 (76.1) |
30.0 (86.0) |
33.0 (91.4) |
34.5 (94.1) |
36.1 (97.0) |
35.0 (95.0) |
34.4 (93.9) |
30.6 (87.1) |
22.2 (72.0) |
19.5 (67.1) |
36.1 (97.0) |
| Mean daily maximum °C (°F) | −2.8 (27.0) |
−1.4 (29.5) |
3.7 (38.7) |
11.6 (52.9) |
18.8 (65.8) |
23.7 (74.7) |
26.3 (79.3) |
25.1 (77.2) |
19.9 (67.8) |
13.2 (55.8) |
5.8 (42.4) |
−0.3 (31.5) |
12.0 (53.6) |
| Daily mean °C (°F) | −7.0 (19.4) |
−5.9 (21.4) |
−1.4 (29.5) |
6.1 (43.0) |
12.4 (54.3) |
17.3 (63.1) |
19.9 (67.8) |
19.1 (66.4) |
14.3 (57.7) |
8.1 (46.6) |
2.1 (35.8) |
−3.9 (25.0) |
6.7 (44.1) |
| Mean daily minimum °C (°F) | −11.2 (11.8) |
−10.4 (13.3) |
−6.6 (20.1) |
0.5 (32.9) |
5.9 (42.6) |
10.9 (51.6) |
13.5 (56.3) |
13.0 (55.4) |
8.6 (47.5) |
2.9 (37.2) |
−1.7 (28.9) |
−7.4 (18.7) |
1.5 (34.7) |
| Record low °C (°F) | −36.5 (−33.7) |
−35.0 (−31.0) |
−31.5 (−24.7) |
−21.1 (−6.0) |
−6.1 (21.0) |
−1.5 (29.3) |
1.7 (35.1) |
−0.5 (31.1) |
−5.0 (23.0) |
−11.5 (11.3) |
−19.0 (−2.2) |
−32.0 (−25.6) |
−36.5 (−33.7) |
| Average precipitation mm (inches) | 60.4 (2.38) |
50.2 (1.98) |
50.3 (1.98) |
67.0 (2.64) |
76.1 (3.00) |
75.5 (2.97) |
81.8 (3.22) |
77.4 (3.05) |
75.0 (2.95) |
68.3 (2.69) |
81.7 (3.22) |
57.7 (2.27) |
821.5 (32.34) |
| Average rainfall mm (inches) | 24.0 (0.94) |
22.2 (0.87) |
27.3 (1.07) |
63.0 (2.48) |
76.1 (3.00) |
75.5 (2.97) |
81.8 (3.22) |
77.4 (3.05) |
75.0 (2.95) |
64.9 (2.56) |
67.8 (2.67) |
25.9 (1.02) |
681.0 (26.81) |
| Average snowfall cm (inches) | 36.4 (14.3) |
28.0 (11.0) |
23.0 (9.1) |
4.0 (1.6) |
0.0 (0.0) |
0.0 (0.0) |
0.0 (0.0) |
0.0 (0.0) |
0.0 (0.0) |
3.4 (1.3) |
13.8 (5.4) |
31.9 (12.6) |
140.5 (55.3) |
| Average precipitation days (≥ 0.2 mm) | 12.4 | 9.4 | 9.6 | 10.8 | 10.3 | 10.2 | 9.0 | 9.8 | 10.8 | 11.3 | 12.1 | 9.8 | 125.5 |
| Average rainy days (≥ 0.2 mm) | 3.3 | 3.6 | 5.2 | 9.9 | 10.3 | 10.2 | 9.0 | 9.8 | 10.8 | 11.2 | 9.3 | 3.7 | 96.2 |
| Average snowy days (≥ 0.2 cm) | 9.8 | 6.4 | 5.3 | 1.4 | 0.1 | 0.0 | 0.0 | 0.0 | 0.0 | 0.6 | 4.0 | 6.8 | 34.3 |
| Source: Environment and Climate Change Canada[56] | |||||||||||||
| Climate data for Markham (Buttonville at Toronto Buttonville Airport) WMO ID: 71639; coordinates 43°51′44″N 79°22′12″W / 43.86222°N 79.37000°W; elevation: 198.1 m (650 ft); 1991–2020 normals, extremes 1895–present[d][46] | |||||||||||||
|---|---|---|---|---|---|---|---|---|---|---|---|---|---|
| Month | Jan | Feb | Mar | Apr | May | Jun | Jul | Aug | Sep | Oct | Nov | Dec | Year |
| Record high humidex | 16.0 | 18.0 | 29.2 | 35.7 | 41.0 | 46.0 | 50.9 | 47.4 | 44.2 | 38.0 | 25.8 | 20.6 | 50.9 |
| Record high °C (°F) | 14.9 (58.8) |
17.3 (63.1) |
26.3 (79.3) |
31.7 (89.1) |
34.6 (94.3) |
36.6 (97.9) |
40.0 (104.0) |
37.8 (100.0) |
35.6 (96.1) |
31.0 (87.8) |
23.8 (74.8) |
20.0 (68.0) |
40.0 (104.0) |
| Mean daily maximum °C (°F) | −1.7 (28.9) |
−1.0 (30.2) |
4.6 (40.3) |
11.8 (53.2) |
19.3 (66.7) |
24.6 (76.3) |
27.3 (81.1) |
26.3 (79.3) |
21.9 (71.4) |
14.3 (57.7) |
7.4 (45.3) |
1.5 (34.7) |
13.0 (55.4) |
| Daily mean °C (°F) | −6.0 (21.2) |
−5.6 (21.9) |
−0.2 (31.6) |
6.5 (43.7) |
13.4 (56.1) |
18.8 (65.8) |
21.5 (70.7) |
20.6 (69.1) |
16.2 (61.2) |
9.4 (48.9) |
3.3 (37.9) |
−2.2 (28.0) |
8.0 (46.4) |
| Mean daily minimum °C (°F) | −10.1 (13.8) |
−10.1 (13.8) |
−5.0 (23.0) |
1.2 (34.2) |
7.4 (45.3) |
13.0 (55.4) |
15.6 (60.1) |
14.8 (58.6) |
10.4 (50.7) |
4.3 (39.7) |
−0.8 (30.6) |
−5.8 (21.6) |
2.9 (37.2) |
| Record low °C (°F) | −35.2 (−31.4) |
−34.4 (−29.9) |
−26.1 (−15.0) |
−15.6 (3.9) |
−5.6 (21.9) |
0.0 (32.0) |
2.2 (36.0) |
1.1 (34.0) |
−3.3 (26.1) |
−9.4 (15.1) |
−20.6 (−5.1) |
−33.9 (−29.0) |
−35.2 (−31.4) |
| Record low wind chill | −42.6 | −41.7 | −35.6 | −18.6 | −7.9 | 0.0 | 0.0 | 0.0 | −4.2 | −8.8 | −23.9 | −36.6 | −42.6 |
| Average precipitation mm (inches) | 63.5 (2.50) |
51.1 (2.01) |
52.3 (2.06) |
78.9 (3.11) |
80.0 (3.15) |
86.7 (3.41) |
85.2 (3.35) |
71.9 (2.83) |
83.1 (3.27) |
70.6 (2.78) |
76.7 (3.02) |
62.5 (2.46) |
862.4 (33.95) |
| Average rainfall mm (inches) | 27.6 (1.09) |
21.0 (0.83) |
32.8 (1.29) |
71.8 (2.83) |
79.9 (3.15) |
86.7 (3.41) |
85.2 (3.35) |
71.9 (2.83) |
83.1 (3.27) |
70.1 (2.76) |
65.5 (2.58) |
33.4 (1.31) |
728.9 (28.70) |
| Average snowfall cm (inches) | 40.3 (15.9) |
33.9 (13.3) |
19.7 (7.8) |
7.2 (2.8) |
0.1 (0.0) |
0.0 (0.0) |
0.0 (0.0) |
0.0 (0.0) |
0.0 (0.0) |
0.6 (0.2) |
11.7 (4.6) |
32.8 (12.9) |
146.4 (57.6) |
| Average precipitation days (≥ 0.2 mm) | 17.0 | 13.1 | 12.0 | 12.6 | 12.3 | 11.6 | 11.2 | 10.0 | 10.5 | 13.3 | 14.3 | 15.5 | 153.5 |
| Average rainy days (≥ 0.2 mm) | 5.5 | 3.7 | 6.5 | 11.2 | 12.3 | 11.6 | 11.2 | 10.0 | 10.5 | 13.2 | 10.9 | 6.8 | 113.4 |
| Average snowy days (≥ 0.2 cm) | 14.2 | 11.0 | 7.2 | 2.8 | 0.13 | 0.0 | 0.0 | 0.0 | 0.0 | 0.42 | 4.8 | 10.6 | 51.1 |
| Average relative humidity (%) (at 1500 LST) | 68.3 | 63.5 | 57.7 | 52.9 | 52.8 | 53.9 | 52.9 | 55.2 | 57.6 | 62.1 | 66.8 | 70.4 | 59.5 |
| Source: Environment and Climate Change Canada[57][58] | |||||||||||||
| Climate data for Richmond Hill Climate ID: 6157012; coordinates 43°52′38″N 79°26′52″W / 43.87722°N 79.44778°W; elevation: 240 m (790 ft); 1981–2010 normals | |||||||||||||
|---|---|---|---|---|---|---|---|---|---|---|---|---|---|
| Month | Jan | Feb | Mar | Apr | May | Jun | Jul | Aug | Sep | Oct | Nov | Dec | Year |
| Record high °C (°F) | 14.5 (58.1) |
14.5 (58.1) |
25.5 (77.9) |
31.0 (87.8) |
34.5 (94.1) |
35.0 (95.0) |
37.0 (98.6) |
37.0 (98.6) |
34.4 (93.9) |
29.4 (84.9) |
23.3 (73.9) |
20.0 (68.0) |
37.0 (98.6) |
| Mean daily maximum °C (°F) | −2.2 (28.0) |
−0.6 (30.9) |
4.4 (39.9) |
12.1 (53.8) |
19.0 (66.2) |
24.2 (75.6) |
26.8 (80.2) |
25.6 (78.1) |
20.9 (69.6) |
13.7 (56.7) |
6.7 (44.1) |
0.8 (33.4) |
12.6 (54.7) |
| Daily mean °C (°F) | −6.2 (20.8) |
−4.9 (23.2) |
−0.3 (31.5) |
6.9 (44.4) |
13.3 (55.9) |
18.7 (65.7) |
21.4 (70.5) |
20.3 (68.5) |
15.9 (60.6) |
9.1 (48.4) |
3.1 (37.6) |
−2.7 (27.1) |
7.9 (46.2) |
| Mean daily minimum °C (°F) | −10.2 (13.6) |
−9.1 (15.6) |
−5 (23) |
1.7 (35.1) |
7.7 (45.9) |
13.1 (55.6) |
15.9 (60.6) |
15.1 (59.2) |
10.8 (51.4) |
4.5 (40.1) |
−0.5 (31.1) |
−6.1 (21.0) |
3.2 (37.8) |
| Record low °C (°F) | −32.5 (−26.5) |
−29 (−20) |
−27 (−17) |
−15 (5) |
−5.6 (21.9) |
0.6 (33.1) |
4.4 (39.9) |
3.0 (37.4) |
−3.3 (26.1) |
−7.8 (18.0) |
−15.5 (4.1) |
−30 (−22) |
−32.5 (−26.5) |
| Average precipitation mm (inches) | 62.3 (2.45) |
58.0 (2.28) |
58.8 (2.31) |
70.1 (2.76) |
81.6 (3.21) |
80.2 (3.16) |
83.5 (3.29) |
89.2 (3.51) |
88.4 (3.48) |
69.1 (2.72) |
87.2 (3.43) |
66.8 (2.63) |
895.2 (35.24) |
| Average rainfall mm (inches) | 25.2 (0.99) |
26.3 (1.04) |
33.6 (1.32) |
62.5 (2.46) |
81.5 (3.21) |
80.2 (3.16) |
83.5 (3.29) |
89.2 (3.51) |
88.4 (3.48) |
67.6 (2.66) |
73.5 (2.89) |
33.1 (1.30) |
744.6 (29.31) |
| Average snowfall cm (inches) | 37.1 (14.6) |
31.7 (12.5) |
25.2 (9.9) |
7.6 (3.0) |
0.1 (0.0) |
0.0 (0.0) |
0.0 (0.0) |
0.0 (0.0) |
0.0 (0.0) |
1.5 (0.6) |
13.7 (5.4) |
33.7 (13.3) |
150.6 (59.3) |
| Average precipitation days (≥ 0.2 mm) | 18.3 | 13.9 | 14.4 | 13.6 | 13.6 | 11.9 | 11.3 | 11.2 | 12.4 | 13.4 | 15.2 | 16.2 | 165.2 |
| Average rainy days (≥ 0.2 mm) | 4.9 | 4.3 | 7.4 | 11.7 | 13.6 | 11.9 | 11.3 | 11.2 | 12.4 | 13.3 | 11.4 | 7.0 | 120.2 |
| Average snowy days (≥ 0.2 cm) | 15.3 | 11.3 | 9.0 | 3.2 | 0.12 | 0.0 | 0.0 | 0.0 | 0.0 | 0.62 | 5.3 | 11.6 | 56.5 |
| Source: Environment and Climate Change Canada[59] | |||||||||||||
| Climate data for Stouffville Climate ID: 6158084; coordinates 43°58′N 79°15′W / 43.967°N 79.250°W; elevation: 266.7 m (875 ft), 1981–2010 normals | |||||||||||||
|---|---|---|---|---|---|---|---|---|---|---|---|---|---|
| Month | Jan | Feb | Mar | Apr | May | Jun | Jul | Aug | Sep | Oct | Nov | Dec | Year |
| Record high °C (°F) | 11.0 (51.8) |
13.5 (56.3) |
23.0 (73.4) |
30.5 (86.9) |
32.0 (89.6) |
34.0 (93.2) |
35.5 (95.9) |
36.5 (97.7) |
32.8 (91.0) |
25.5 (77.9) |
22.8 (73.0) |
18.0 (64.4) |
36.5 (97.7) |
| Mean daily maximum °C (°F) | −3.2 (26.2) |
−2.4 (27.7) |
3.1 (37.6) |
11.1 (52.0) |
18.5 (65.3) |
23.1 (73.6) |
26.2 (79.2) |
24.7 (76.5) |
19.9 (67.8) |
12.8 (55.0) |
6.0 (42.8) |
−0.6 (30.9) |
11.6 (52.9) |
| Mean daily minimum °C (°F) | −11.6 (11.1) |
−10.9 (12.4) |
−5.7 (21.7) |
1.2 (34.2) |
7.4 (45.3) |
11.8 (53.2) |
14.8 (58.6) |
14 (57) |
9.6 (49.3) |
3.5 (38.3) |
−1.0 (30.2) |
−7.7 (18.1) |
2.1 (35.8) |
| Record low °C (°F) | −35.5 (−31.9) |
−28.3 (−18.9) |
−28.0 (−18.4) |
−17.0 (1.4) |
−3.3 (26.1) |
0.0 (32.0) |
7.0 (44.6) |
2.5 (36.5) |
−2.0 (28.4) |
−7.2 (19.0) |
−15.0 (5.0) |
−31.5 (−24.7) |
−35.5 (−31.9) |
| Average precipitation mm (inches) | 52.8 (2.08) |
53.5 (2.11) |
62.8 (2.47) |
65.5 (2.58) |
81.2 (3.20) |
73.3 (2.89) |
75.8 (2.98) |
99.3 (3.91) |
79.2 (3.12) |
81.2 (3.20) |
78.5 (3.09) |
65.6 (2.58) |
868.6 (34.20) |
| Average rainfall mm (inches) | 17.9 (0.70) |
23.3 (0.92) |
43.5 (1.71) |
60.5 (2.38) |
81.1 (3.19) |
73.3 (2.89) |
75.8 (2.98) |
99.3 (3.91) |
79.2 (3.12) |
80.6 (3.17) |
70.3 (2.77) |
33.0 (1.30) |
737.7 (29.04) |
| Average snowfall cm (inches) | 34.9 (13.7) |
30.2 (11.9) |
19.3 (7.6) |
5.0 (2.0) |
0.1 (0.0) |
0.0 (0.0) |
0.0 (0.0) |
0.0 (0.0) |
0.0 (0.0) |
0.6 (0.2) |
8.2 (3.2) |
32.7 (12.9) |
131.0 (51.6) |
| Average precipitation days (≥ 0.2 mm) | 11.0 | 10.3 | 10.1 | 10.8 | 11.0 | 10.7 | 9.2 | 10.8 | 10.4 | 13.0 | 12.6 | 12.3 | 131.9 |
| Average rainy days (≥ 0.2 mm) | 2.9 | 3.1 | 6.2 | 9.8 | 11.0 | 10.7 | 9.2 | 10.8 | 10.4 | 13.0 | 10.7 | 5.1 | 102.6 |
| Average snowy days (≥ 0.2 cm) | 8.4 | 7.7 | 4.7 | 1.2 | 0.1 | 0.0 | 0.0 | 0.0 | 0.0 | 0.2 | 2.6 | 8.3 | 33.1 |
| Source: Environment and Climate Change Canada[60] | |||||||||||||
| Climate data for Woodbridge (Vaughan) Climate ID: 6159575; coordinates 43°47′N 79°36′W / 43.783°N 79.600°W; elevation: 164 m (538 ft); 1981–2010 normals | |||||||||||||
|---|---|---|---|---|---|---|---|---|---|---|---|---|---|
| Month | Jan | Feb | Mar | Apr | May | Jun | Jul | Aug | Sep | Oct | Nov | Dec | Year |
| Record high °C (°F) | 17.0 (62.6) |
15.5 (59.9) |
26.5 (79.7) |
31.5 (88.7) |
33.0 (91.4) |
36.0 (96.8) |
39.0 (102.2) |
37.2 (99.0) |
36.1 (97.0) |
30.6 (87.1) |
25.0 (77.0) |
19.5 (67.1) |
39.0 (102.2) |
| Mean daily maximum °C (°F) | −2.5 (27.5) |
−0.5 (31.1) |
4.3 (39.7) |
12.0 (53.6) |
18.8 (65.8) |
24.1 (75.4) |
26.9 (80.4) |
25.4 (77.7) |
20.9 (69.6) |
13.9 (57.0) |
6.9 (44.4) |
0.8 (33.4) |
12.6 (54.7) |
| Daily mean °C (°F) | −6.6 (20.1) |
−4.8 (23.4) |
−0.4 (31.3) |
6.6 (43.9) |
12.9 (55.2) |
18.1 (64.6) |
20.8 (69.4) |
19.6 (67.3) |
15.4 (59.7) |
9.0 (48.2) |
3.1 (37.6) |
−2.8 (27.0) |
7.6 (45.7) |
| Mean daily minimum °C (°F) | −10.7 (12.7) |
−9.2 (15.4) |
−5.2 (22.6) |
1.2 (34.2) |
6.8 (44.2) |
12.0 (53.6) |
14.7 (58.5) |
13.8 (56.8) |
9.8 (49.6) |
4.0 (39.2) |
−0.8 (30.6) |
−6.4 (20.5) |
2.5 (36.5) |
| Record low °C (°F) | −34.5 (−30.1) |
−30.0 (−22.0) |
−29.4 (−20.9) |
−17.2 (1.0) |
−6.7 (19.9) |
−1.7 (28.9) |
2.8 (37.0) |
−0.6 (30.9) |
−5.0 (23.0) |
−11.7 (10.9) |
−18.3 (−0.9) |
−30.0 (−22.0) |
−34.5 (−30.1) |
| Average precipitation mm (inches) | 50.3 (1.98) |
44.2 (1.74) |
49.2 (1.94) |
63.3 (2.49) |
79.1 (3.11) |
76.3 (3.00) |
70.4 (2.77) |
80.4 (3.17) |
84.6 (3.33) |
66.5 (2.62) |
78.3 (3.08) |
57.4 (2.26) |
799.8 (31.49) |
| Average rainfall mm (inches) | 20.4 (0.80) |
23.2 (0.91) |
31.4 (1.24) |
59.6 (2.35) |
79.1 (3.11) |
76.3 (3.00) |
70.4 (2.77) |
80.4 (3.17) |
84.6 (3.33) |
66.0 (2.60) |
71.1 (2.80) |
34.6 (1.36) |
697.0 (27.44) |
| Average snowfall cm (inches) | 29.9 (11.8) |
21.1 (8.3) |
17.8 (7.0) |
3.7 (1.5) |
0.0 (0.0) |
0.0 (0.0) |
0.0 (0.0) |
0.0 (0.0) |
0.0 (0.0) |
0.45 (0.18) |
7.2 (2.8) |
22.8 (9.0) |
102.8 (40.5) |
| Average precipitation days (≥ 0.2 mm) | 13.5 | 10.3 | 10.7 | 11.8 | 12.0 | 10.8 | 9.5 | 9.6 | 10.6 | 12.7 | 13.1 | 12.8 | 137.4 |
| Average rainy days (≥ 0.2 mm) | 4.2 | 4.4 | 6.4 | 10.7 | 12.0 | 10.8 | 9.5 | 9.6 | 10.6 | 12.6 | 11.1 | 6.5 | 108.3 |
| Average snowy days (≥ 0.2 cm) | 10.2 | 6.8 | 5.1 | 1.5 | 0.0 | 0.0 | 0.0 | 0.0 | 0.0 | 0.23 | 3.0 | 7.5 | 34.3 |
| Source: Environment and Climate Change Canada[61] | |||||||||||||
Economy
[edit] | This section needs to be updated. (December 2015) |
The Greater Toronto Area is a commercial, distribution, financial and economic centre and is the second-largest financial centre in North America.[62] The region generates about a fifth of Canada's GDP and is home to 40 per cent of Canada's business headquarters.[63][64] The economies of the municipalities in Greater Toronto are largely intertwined.[65] The work force is made up of approximately 2.9 million people and more than 100,000 companies[66] The Greater Toronto Area produces nearly 20 per cent of the entire nation's GDP with $323 billion, and from 1992 to 2002, experienced an average GDP growth rate of 4.0 per cent and a job creation rate of 2.4 per cent (compared with the national average GDP growth rate of 3 per cent and job creation rate of 1.6 per cent).[63][67] The Greater Toronto Area has the largest regional economy in Canada, with its GDP surpassing the Province of Quebec in 2015.[citation needed]

In 2010, over 51 per cent of the labour force in the Greater Toronto Area is employed in the service sector, with 19% in the manufacturing, 17% of the labour force employed in wholesale & retail trade, 8% of the labour force involved in transportation, communication and utilities, and 5% of the workforce is involved in construction.[68] Although the service industry makes up only 51% of Greater Toronto's workforce, over 72% of the region's GDP is generated by service industries.[63]
The largest industry in the Greater Toronto Area is the financial services in the province, accounting for an estimated 25% of the region's GDP.[63] Notably, the five largest banks in Canada all have their operational headquarters in Toronto's Financial District.[69] Toronto is also home to the headquarters of the Toronto Stock Exchange and the Standard and Poor TSX Composite Index and offices of the TSX Venture Exchange.[69] The TMX Group, the owners and operators of TSX Exchanges as well as the Montreal Exchange, are also headquartered in Toronto. The TSX and the TSX Venture Exchange represent 3,369 companies, including more than half of the world's publicly traded mining companies.[69]
Markham also attracted the highest concentration of high tech companies in Canada, and because of it, has positioned itself as Canada's High-Tech Capital.[70] The Greater Toronto Area is the second-largest automotive centre in North America (after Detroit). Currently,[when?] General Motors, Ford and Chrysler run six assembly plants in the area, with Honda and Toyota having assembly plants just outside the GTA. General Motors, Ford, Honda, KIA, Mazda, Suzuki, Nissan, Volkswagen, Toyota, Hyundai, Aston Martin, Jaguar, Land Rover, Subaru, Volvo, BMW, and Mitsubishi have chosen the Greater Toronto Area for their Canadian headquarters.[71] Magna International, the world's most diversified car supplier,[72] also has its headquarters in Aurora.[73] The automobile industry accounts for roughly 10% of the region's GDP.[63]
Agriculture
[edit]
While it was once the most dominant industry for residents in the Greater Toronto Area, agriculture now occupies a small percentage of the population though it is still a large part of land in the surrounding four regional municipalities. Census data from 2006 has shown there are 3,707 census farms in the GTA, down 4.2 percent from 2001 and covering 274,363 ha (677,970 acres).[74] Almost every community in the GTA is currently experiencing a decrease in the acreage of farmland, with Mississauga seeing the most significant one. The only communities in the GTA that are experiencing a growth in the acreage of farmland are Aurora, Georgina, Newmarket, Oshawa, Richmond Hill, and Scugog, with Markham experiencing no growth or decline.[75] Most of the GTA's farmland is in Durham Region, with 55 per cent of their total land area being farmland. This is followed by York Region with 41 per cent of their lands being farmland, Peel Region with 34 percent, and Halton Region with 41 percent.[75] Toronto's remaining farmland is completely within Rouge Park in the Rouge Valley. The average size of the farm in the GTA (74 ha [183 acres]) is much lower than the farms in the rest of Ontario (averaging 94 ha [233 acres]). This has been attributed to the shift of farm types in the GTA from the traditional livestock and cash crop farms (requiring an extensive land base), towards more intensive enterprises including greenhouse, floriculture, nursery, vegetable, fruit, sheep and goats.[74]
The most numerous farm types in the GTA are miscellaneous specialty farms (including horse and pony, sheep and lamb, and other livestock specialty), followed by cattle, grain and oilseed, dairy and field crop farms.[75] Although the output of dairy production has dropped with farms from within the GTA, dairy has remained the most productive sector in the agricultural industry by annual gross farm receipts.[75] Despite the decreased amount of farmland around the region, farm capital value increased from $5.2 billion in 1996 to $6.1 billion in 2001, making the average farm capital value in the GTA continued to be the highest in the province.[75]
Infrastructure
[edit]Transportation
[edit]
There are several public transportation operators within the Greater Toronto Area that provide services within their jurisdictions. While those operators are largely independent, provisions are being made to integrate them under Metrolinx, which manages transportation planning including public transport in the Greater Toronto and Hamilton Area.[76] GO Transit, which merged with Metrolinx during the late 2000s, is Ontario's only intra-regional public transit service, linking the communities in the GTA and the city of Hamilton, as well as the rest of the Greater Golden Horseshoe.[77] The implementation of the Presto card by Metrolinx has created a common means for all fare payments and allows for seamless connection between these and other transit operators.[78]
Public transit operators in the GTA include[79] Brampton Transit, Burlington Transit, Durham Region Transit, GO Transit, Milton Transit, MiWay (serving Mississauga), Oakville Transit, Toronto Transit Commission (TTC), and York Region Transit. The TTC operates the Toronto subway system, which consists of three heavy rail lines and runs in Toronto and in Vaughan, the latter of which began to be served by the system in December 2017 with an extension of Line 1 Yonge–University to Vaughan Metropolitan Centre station on Highway 7 at Jane Street.

The GTA also consists of several King's Highways and is supplemented by municipal expressways. One of the principal highways in the GTA, Highway 401, is also the longest in Ontario and is also one of the widest and busiest highways in the world.[80] Notably, a segment of the highway passing through the GTA is North America's busiest highway.[81] The GTA is laced with a number of limited-access highways including the 400-series highways. These include:[82]
Note: "York", "Peel", "Durham" and "Halton" here refer to the regional municipalities.
 Highway 400 – York, Toronto
 Highway 401 – Durham, Toronto, Peel, Halton
 Highway 403 – Peel, Halton
 Highway 404 – York, Toronto
 /
/  407 ETR / Highway 407 – Durham, Peel, York, Halton (toll route)
 Highway 409 – Toronto, Peel
 Highway 410 – Peel
 Highway 412 – Durham
 Highway 418 – Durham
 Highway 427 – York, Toronto, Peel
 Queen Elizabeth Way – Peel, Halton, Toronto
 Gardiner Expressway – Toronto
 Don Valley Parkway – Toronto
 William R. Allen Road – Toronto


The main airport serving the GTA is Toronto Pearson International Airport in Mississauga, which is Canada's largest[83] and busiest airport. It processed over 47 million passengers in 2017 and nearly 50 million passengers in 2018.[84][85] Toronto Pearson International Airport is operated by the Greater Toronto Airports Authority (GTAA). John C. Munro Hamilton International Airport in nearby Hamilton also handles international flights, handles some discount flights and charters, and acts as an alternative to Pearson. The Billy Bishop Toronto City Airport, on the Toronto Islands near downtown, is used for civil aviation, air ambulance traffic and regional scheduled airlines (it handled nearly two million passengers in 2012).[86][87] There are also a number of smaller airports scattered throughout the GTA. The International Air Transport Association (IATA) uses YTO as a code for multiple airports in the area, including those without passenger service.[88]
The Greater Toronto Airport Authority has also placed a tentative proposal to develop a new airport in Pickering, which would also extend over into Markham and Uxbridge.[89] As the GTAA predicts Toronto Pearson would be unable to be the sole provider for the bulk of Toronto's commercial air traffic in the next 20 years from the report's publication in 2004 (i.e. in 2024), it believes that a new airport in Pickering would address the need for a regional/reliever airport east of Toronto Pearson and complement the airport in Hamilton, Ontario.[90] The GTAA also stated the new airport would create more opportunities for economic development in the eastern region of the Greater Toronto Area.[90] However, demand for the new airport lessened because of the COVID-19 pandemic and its aftermath, as well as the planned Alto high-speed rail network, which would eliminate many short-haul flights along the route between Toronto and Quebec City.
The region also has significant maritime infrastructure being on the Great Lakes-St. Lawrence Seaway system. The Port of Oshawa and Port of Toronto handle between 2 and 4 million tonnes of cargo annually. The Port of Toronto also has an International Marine Passenger Terminal, which had 12,000 cruise passengers in 2019.
Communication
[edit]The Greater Toronto Area is served by seven distinct telephone area codes. Before 1993, the GTA used the 416 area code. In a 1993 zone split, Metropolitan Toronto retained the 416 code, while the other municipalities of the Greater Toronto Area were assigned the new area code 905.[91] This division by area code has become part of the local culture to the point where local media refer to something inside Toronto as "the 416" and outside of Toronto as "the 905".[92] For example, the Raptors 905 basketball team in the NBA G League is named after the area code the team represents. Though for the most part, the use of the area 905 as shorthand for the suburban areas outside Toronto city limits was correct, it is not entirely true as some portions of Durham and York Regions use the 705 area code.[93] Furthermore, there are areas, such as Hamilton, the Regional Municipality of Niagara and Port Hope (in Northumberland County) that use the 905 area code, but are not part of the GTA.[93] The unincorporated community of Acton (in Halton Hills), is the only community in the GTA that uses the 519 area code, which covers most of Southwestern Ontario.[94][95]
To meet the increased demand for phone numbers, two overlay area codes were introduced in 2001. Area code 647 (supplementing the 416 area code)[96] was introduced in March 2001 and area code 289 (supplementing the 905 area code) was introduced in July 2001.[97] Some individuals within the 905 area code region may have to dial long distance to reach each other; although residents of Mississauga and Hamilton share the same area code (905), an individual from Toronto, for example, would have to dial "1" to reach Hamilton, but not to reach Mississauga. Ten-digit telephone dialling, including the area code for local calls, is required throughout the GTA.[97] In March 2013, two additional area codes were introduced to the GTA: area code 437 in Toronto and area code 365 in the area served by 905 and 289.[98]
Government
[edit]Since the 2015 election, the Greater Toronto Area has been represented by 58 Members of Parliament in the House of Commons of Canada. Forty-six Members of the Provincial Parliament also represent the GTA in the Ontario Legislature. Five Senators from Ontario have also designated themselves as representatives of certain areas in the GTA in the Canadian Senate.[99]
Federal politics
[edit]Federally, the Conservatives, Liberals, and the New Democrats (NDP) all hold several electoral districts in the GTA. The City of Toronto has often been supportive of the Liberal Party. Traditionally, Liberal support is strongest in Downtown Toronto, while Conservative support is stronger in the surrounding communities outside Toronto. The NDP also has a strong base within the GTA.[100] The Greater Toronto Area has the ability to influence election results and determine the governing party in Canada, due in part to its large population and riding count.[101]
From 1993 to 2011, a centre-right party failed to win a single seat in the former Metro Toronto.[citation needed] In the 2011 election, however, a surge in NDP support combined with a collapse in Liberal support allowed the Conservatives to win eight seats in Toronto itself, and another 24 in the suburbs.[citation needed] Toronto's political leanings now appeared to mirror those of surrounding communities that leaned toward the Conservatives.[citation needed]
The election of 2011 showed Liberal support, based on votes in the GTA, had collapsed from 43.7% to 30.6%, giving the Liberals only 14.9% of the local seats in the House of Commons. However, the support of the Conservatives and NDP increased accordingly, with the Conservatives increasing their vote share from 31.5% to 42.2% (and capturing 68.1% of the GTA seats) and the NDP increasing from 14.6% to 23.2% of the vote and 17% of the local Federal ridings.[citation needed]
In the 2015 federal election, the Liberals regained their dominance of the GTA after suffering devastating losses there four years earlier. They defeated a number of prominent incumbents from both the NDP and the Conservatives. The Liberals took all of Toronto itself. They also took back almost all of the suburban ridings they had lost in 2011. Both the NDP and the Conservatives suffered heavily as their support collapsed in the inner city and the suburbs respectively. Only a few Conservatives held onto their seats in the outer ring of the GTA, while the NDP failed to elect any MPs in this area.[102] The 2019, 2021 and 2025 federal elections have similar results.
Provincial politics
[edit]
Toronto is the capital of Ontario with the Ontario Legislative Building, often metonymically known as Queen's Park after the street and park surrounding it, being located in Downtown Toronto. Most of the provincial government offices are also located in downtown Toronto.
On the provincial level of government, the Ontario Progressive Conservatives (PCs), Ontario Liberals, and the Ontario New Democrats all hold electoral districts in the GTA.[103] While the GTA provided a strong base of support for the Progressive Conservative government between 1995 and 2003, the Ontario Liberal Party achieved a major victory in the GTA during the 2003 election and has enjoyed strong support from the region ever since.[104] In the 2011 election, the Liberals won 33 of the 44 available seats in the GTA, allowing Premier Dalton McGuinty to hold onto a minority government. The 2014 election under McGuinty's successor, Kathleen Wynne, was an even bigger electoral landslide for the Liberals, as they won 38 seats in the region. They even took several ridings in territory that had voted PC for decades, like Durham, Burlington, Newmarket-Aurora and Halton. The PCs hold no seats in Peel Region and only one seat in each of the Halton, York, and Durham regions. While the NDP has been weak in the GTA since the 1995 election, it has seen some successes in Brampton and Durham Region, where they hold one seat each.
The Progressive Conservative Party of Ontario did not win a riding in the City of Toronto during a general election from 1999 to 2018.[105] On the other end of the spectrum, the NDP saw major losses in Toronto during the 2014 election and held only two seats in the city. That is no longer the case since the 2018 provincial election, as the Progressive Conservatives and the NDP made significant gains at the expense of the Liberals; that continues to hold true in the 2022 and 2025 provincial elections.
Municipal politics
[edit]In 2011, 244 politicians govern the Greater Toronto Area below the provincial and federal levels, holding offices in cities, towns, and regional municipalities.[106] There are no political parties at the municipal level in the Greater Toronto Area. Unusual for a large North American urban agglomeration, the GTA has very few agencies with powers that can cross boundaries. Attempts to create an interregional organization have been made, such as the Province of Ontario's Office of the Greater Toronto Area (OGTA) in 1988[107] and the Greater Toronto Services Board (GTSB) in 1998,[108][109] but they have failed by the lack of real authority in those agencies.[109][110]
Consequently, there are few interregional public authorities: Metrolinx, an agency of the provincial government, manages the GTA-wide GO Transit system,[111] while the Toronto and Region Conservation Authority manages some of the GTA's watersheds and natural areas.[112] Notably, there is no organization with broad powers as in other Canadian cities, such as the Communauté métropolitaine de Montréal and Metro Vancouver Regional District.
Demographics
[edit]Population
[edit]| Year | Pop. | ±% |
|---|---|---|
| 2001 | 5,081,826 | — |
| 2006 | 5,555,912 | +9.3% |
| 2011 | 6,054,196 | +9.0% |
| 2016 | 6,417,516 | +6.0% |
| 2021 | 6,712,341 | +4.6% |
| Source: Statistics Canada | ||
According to the latest census data from 2021 from Statistics Canada, the population of this area is 6,712,341. Population growth studies have projected the City of Toronto's population in 2031 to be 3,000,000 and the Greater Toronto Area's population to be 7,450,000,[113] while the Ontario Ministry of Finance states it could reach 7.7 million by 2025.[114] Statistics Canada identified in 2001 that four major urban regions in Canada exhibited a cluster pattern of concentrated population growth among which included the Greater Golden Horseshoe Census Region, which includes all of the Greater Toronto Area (which includes Oshawa), as well as other Southern Ontario cities including Hamilton, Guelph, Barrie, and the cities in Niagara Region and Waterloo Region. Combined, the Greater Golden Horseshoe has a population of 9,765,188 in 2021, containing over 20 per cent of Canada's population.
Ethnicity
[edit]Statistics Canada found in 2006, there were 31,910 Indigenous people living in the Greater Toronto Area, which represented 2.7 per cent of all Indigenous peoples in Canada and 13.2 per cent of those in Ontario.[127] Most of them, however, are not registered with the Indian reserves within the Greater Toronto Area, the Chippewas of Georgina Island First Nation and the Mississaugas of Scugog Island First Nation.
.jpg)
| Panethnic group | 2021 | 2016 | 2011 | 2006 | 2001 | |||||
|---|---|---|---|---|---|---|---|---|---|---|
| Pop. | % | Pop. | % | Pop. | % | Pop. | % | Pop. | % | |
| European[f] | 2,961,545 | 44.55% | 3,195,695 | 50.36% | 3,288,345 | 54.93% | 3,258,770 | 59.14% | 3,277,970 | 65% |
| South Asian | 1,224,890 | 18.43% | 994,865 | 15.68% | 847,435 | 14.16% | 694,405 | 12.6% | 481,265 | 9.54% |
| East Asian[g] | 789,180 | 11.87% | 732,740 | 11.55% | 621,570 | 10.38% | 568,585 | 10.32% | 474,905 | 9.42% |
| Black | 521,610 | 7.85% | 465,295 | 7.33% | 413,155 | 6.9% | 366,290 | 6.65% | 319,125 | 6.33% |
| Southeast Asian[h] | 394,800 | 5.94% | 345,865 | 5.45% | 327,445 | 5.47% | 246,040 | 4.46% | 188,915 | 3.75% |
| Middle Eastern[i] | 299,910 | 4.51% | 236,170 | 3.72% | 176,310 | 2.95% | 132,610 | 2.41% | 97,790 | 1.94% |
| Latin American | 161,460 | 2.43% | 136,950 | 2.16% | 120,695 | 2.02% | 101,715 | 1.85% | 77,375 | 1.53% |
| Indigenous | 55,915 | 0.84% | 56,090 | 0.88% | 43,825 | 0.73% | 31,910 | 0.58% | 23,950 | 0.47% |
| Other/multiracial[j] | 237,800 | 3.58% | 182,075 | 2.87% | 147,565 | 2.47% | 110,345 | 2% | 102,055 | 2.02% |
| Total responses | 6,647,100 | 99.03% | 6,345,725 | 98.88% | 5,986,310 | 98.88% | 5,510,710 | 99.19% | 5,043,355 | 99.24% |
| Total population | 6,712,341 | 100% | 6,417,516 | 100% | 6,054,196 | 100% | 5,555,912 | 100% | 5,081,826 | 100% |
| Note: Totals greater than 100% due to multiple origin responses 2021 census sources:[128][129][130][131][132] 2016 census sources:[133][134][135][136][137] 2011 census sources:[138][139][140][141][142] 2006 census sources:[143][144][145][146][147] 2001 census sources:[148][149][150][151][152] | ||||||||||
-
 South Asians
 -
 Black
Black -
 Chinese
 -
 Filipinos
 -
 Arabs
Arabs -
 Latin Americans
 -
 Southeast Asians (excluding Filipinos)
 -
 West Asians (excluding Arabs)


Immigration
[edit]In 2009, the Toronto CMA also has one of the largest proportions of foreign-born residents (46 per cent) as a share of the total population out of all metropolitan areas in the Organization for Economic Co-operation and Development (OECD). The Toronto region is also unusually diverse in the composition of its ethnicities. The four largest foreign-born populations of Toronto constitute only 15 per cent of the total foreign-born population. That is opposed to the four largest foreign-born populations of other metropolitan areas such as New York City and London, where they make up 25 per cent of their respective foreign-born populations.[64]
Education
[edit]Education in the Greater Toronto Area is managed by the provincial Ministry of Education, who manages preschool, elementary and secondary education, while the provincial Ministry of Colleges and Universities administers laws relating to tertiary education, including colleges, universities, and vocational schools.[153][154]
Primary and secondary education
[edit]There are presently twelve public English first language school boards, and two French first language school boards operating within the GTA. Seven of these school boards operate secular schools, whereas the other seven operate separate schools; the seven separate school boards in the Greater Toronto Area all serve the Roman Catholic faith. In addition to public schools, there are also many private schools that operate within Greater Toronto.
Three of these GTA-based public school boards also manage institutions outside Greater Toronto, the two French first language school boards, based in Toronto, as well as the Dufferin-Peel Catholic District School Board (DPCDSB). Conversely, English first language public schools in Clarington, a municipality within Durham Region, are managed by school boards based outside the GTA.
| Region | Durham Region | Halton Region | Peel Region | City of Toronto | York Region | ||
| English secular | Durham District School Board Kawartha Pine Ridge District School Board[k] |
Halton District School Board | Peel District School Board | Toronto District School Board | York Region District School Board | ||
| English separate | Durham Catholic District School Board Peterborough Victoria Northumberland and Clarington Catholic District School Board[k] |
Halton Catholic District School Board | Dufferin-Peel Catholic District School Board[l] | Toronto Catholic District School Board | York Catholic District School Board | ||
| French secular | Conseil scolaire Viamonde | ||||||
| French separate | Conseil scolaire catholique MonAvenir | ||||||
Post-secondary education
[edit]Colleges
[edit]The Greater Toronto Area is also home to six publicly funded colleges[155] that have campuses spread in and around the metropolitan area. The six publicly funded colleges based in the Greater Toronto Area include:
- Centennial College (Toronto, Pickering)
- Durham College (Pickering, Brock, Scugog, Oshawa, Uxbridge)[m]
- George Brown College (Toronto)
- Humber Polytechnic (Toronto; formerly Humber College)[n]
- Seneca Polytechnic (King, Markham, Toronto; formerly Seneca College)[o]
- Sheridan College (Brampton, Mississauga, Oakville)
Another publicly funded college, Collège Boréal, also maintains a satellite campus in Toronto. However, Collège Boréal's main campus and administration is based outside the GTA, in Greater Sudbury. In addition to publicly funded colleges, there are also many private career colleges spread throughout the Greater Toronto Area.[156]
Universities
[edit]
The Greater Toronto Area is home to six publicly funded universities. Universities based within Greater Toronto include:[157]
- OCAD University (Toronto)
- Ontario Tech University (Oshawa)
- Toronto Metropolitan University (Toronto; formerly Ryerson University)
- Université de l'Ontario français (Toronto)[p]
- University of Toronto (Toronto, Mississauga)
- York University (Toronto, Markham)
Three publicly funded universities based outside of the GTA operate satellite campuses within the GTA, including the Hamilton-based McMaster University, Peterborough-based Trent University, and the Guelph-based University of Guelph. The McMaster's DeGroote School of Business operates the Ron Joyce Centre in Burlington;[158] Trent University operates a satellite campus in Oshawa, referred to as Trent in Oshawa;[159] The University of Guelph operates an affiliated institution alongside Humber College, the University of Guelph-Humber, in Toronto.[160] One American university, Boston-based Northeastern University, operates a satellite campus in Toronto.
There also are eleven private religious universities spread throughout the GTA.[161]
See also
[edit].svg)

Notes
[edit]- ^ Long term records have been recorded at various climate stations in or nearby Burlington since 1866
Footnotes
[edit]- ^ Adopters include the regional transportation planning body Metrolinx,[9] the Ministry of Energy and Infrastructure[6] and the Regional Municipality of Halton.[7]
- ^ Humidex, wind chill, average rain, average snow, rain days, snow days, and sunshine are from 1981–2010
- ^ Maximum and minimum temperature data at The Annex was recorded by human observers from March 1840 to June 2003 under the station name "TORONTO". From July 2003 to present, climate data has been recorded by an automatic weather station under the name "TORONTO CITY".[43]
- ^ Long term records have been recorded at various climate stations in or nearby Markham since 1895. From 1895 to 1908 at Toronto Agincourt, 1908 to 1918 at Aurora, 1918 to 1959 at Oak Ridges, 1959 to 1986 at Richmond Hill and 1986 to present at Toronto Buttonville Airport
- ^ a b Combined population of Toronto, Peel Region, York Region, Durham Region and Halton Region.
- ^ Statistic includes all persons that did not make up part of a visible minority or an indigenous identity.
- ^ Statistic includes total responses of "Chinese", "Korean", and "Japanese" under visible minority section on census.
- ^ Statistic includes total responses of "Filipino" and "Southeast Asian" under visible minority section on census.
- ^ Statistic includes total responses of "West Asian" and "Arab" under visible minority section on census.
- ^ Statistic includes total responses of "Visible minority, n.i.e." and "Multiple visible minorities" under visible minority section on census.
- ^ a b The school board is based outside the GTA, although it operates schools in Clarington, a municipality in Durham Region. In addition to Clarington, the school board also operates institutions in the City of Peterborough, Peterborough County, Northumberland County, and parts of Hastings County.
- ^ In addition to Peel Region, the school board oversees schools in Dufferin County.
- ^ In addition to the Greater Toronto Area, Durham College also operates a campus in Cobourg and Port Hope, two municipalities situated outside the Greater Toronto Area.
- ^ In addition to the Greater Toronto Area, Humber Polytechnic also operates a campus in Orangeville, a municipality situated outside the Greater Toronto Area.
- ^ In addition to the Greater Toronto Area, Seneca Polytechnic also operates a campus in Peterborough, a municipality situated outside Greater Toronto Area.
- ^ The Université de l'Ontario français was formally established in April 2018, although it is not expected to accept its first cohort of full-time students until 2021.
References
[edit]- ^ "Population estimates, July 1, by census metropolitan area and census agglomeration, 2021 boundaries". Statistics Canada. January 16, 2025. Retrieved January 17, 2025.
- ^ "Statistics Canada. Table 36-10-0468-01 Gross domestic product (GDP) at basic prices, by census metropolitan area (CMA) (x 1,000,000)". Statistics Canada.
- ^ OECD "OECD Territorial Reviews OECD Territorial Reviews: Toronto, Canada 2009" OECD Publishing, ISBN 92-64-07940-8 p37
- ^ "Greater Toronto Area" (PDF). Ontario Creates. Retrieved February 14, 2022.
- ^ 2021 Census - Toronto Metropolitan area (Report). Ottawa: Statistics Canada. February 9, 2022. Retrieved February 10, 2022.
- ^ a b c "Places to Grow: Growth Plan for the Greater Golden Horseshoe" (PDF). Ministry of Public Infrastructure Renewal. 2006. p. 9. Archived from the original (PDF) on July 6, 2011.
- ^ a b "Amendment No. 38 to the Regional Plan (2006)". Regional Municipality of Halton. December 16, 2009. Archived from the original on July 6, 2011. Retrieved March 25, 2010.
- ^ a b Solomon, Lawrence "Toronto sprawls: a history." University of Toronto Press; 1 edition, ISBN 0-7727-8618-6 p3
- ^ a b "About Us". Metrolinx Website. Metrolinx. Archived from the original on May 5, 2010. Retrieved February 26, 2010.
- ^ "Planning for Growth" (PDF). Understanding the Growth Plan for the Greater Golden Horseshoe. Ministry of Public Infrastructure Renewal. Archived from the original (PDF) on July 6, 2011.
- ^ "Greater Toronto Area and Toronto CMA Map". City of Toronto. Archived from the original on February 9, 2018. Retrieved February 7, 2018.
- ^ "Population of census metropolitan areas (2006 Census boundaries)". Statistics Canada. Archived from the original on February 13, 2010. Retrieved March 2, 2010.
- ^ "2006 Census: Portrait of the Canadian Population in 2006: Subprovincial population dynamics". Statistics Canada. Archived from the original on April 8, 2010. Retrieved March 2, 2010.
- ^ Chris J. Ellis; Neal Ferris, eds. (1990). The Archaeology Of Southern Ontario To A.D. 1650. London Chapter of the Ontario Archaeological Society. pp. 410–411. ISBN 0-919350-13-5.
- ^ "First Peoples, 9000 BCE to 1600 CE". Toronto Culture – Exploring Toronto's past. City of Toronto. Archived from the original on June 6, 2011. Retrieved February 7, 2010.
- ^ The Ojibwa-Iroquois War: The War the Five Nations Did Not Win. Leroy V. Eid. Ethnohistory, Vol. 26, No. 4 (Autumn, 1979), Duke University Press, pp. 297–324
- ^ Schmalz, Peter S., The Ojibwa of Southern Ontario. University of Toronto Press. ISBN 0-8020-2736-9. pp 21–22
- ^ a b c d "Natives and Newcomers, 1600–1793". Toronto Culture – Exploring Toronto's past. City of Toronto. 2009. Archived from the original on March 6, 2007. Retrieved February 7, 2010.
- ^ "The Toronto Carrying-place". Nature Conservancy of Canada. Archived from the original on June 19, 2010. Retrieved February 28, 2010.
- ^ Rayburn, Alan (September 18, 2007). "The real story of how Toronto got its name". Mapping Services. Natural Resources Canada. Archived from the original on December 9, 2011.
- ^ Missisaugas of the New Credit CURRENT LAND CLAIMS Archived July 14, 2011, at the Wayback Machine
- ^ Ontario's Districts – 1798 Archived February 12, 2011, at the Wayback Machine, Queen's Printer for Ontario. Retrieved on February 6, 2010.
- ^ "A Provincial Centre, 1793–1851". Toronto Culture – Exploring Toronto's past. City of Toronto. 2009. Archived from the original on June 7, 2011. Retrieved February 28, 2010.
- ^ a b c Benn, Carl (1993). History Fort York, 1794–1993. Dundurn. pp. 68–73. ISBN 1-4597-1376-1.
- ^ a b Archives of Ontario (February 28, 2010). "18th and 19th century Ontario Counties and Corresponding Districts". Queen's Printer for Ontario. Archived from the original on February 13, 2010.
- ^ Robert M. Stamp (1991). "The Road to Rebellion". Tories and Reformers. Town of Richmond Hill Public Library. Archived from the original on September 28, 2011. Retrieved February 7, 2010.
- ^ Archives of Ontario (February 28, 2010). "Ontario's Districts – 1851". The Evolution of the District and County System 1788–1899. Queen's Printer for Ontario. Archived from the original on June 11, 2011.
- ^ Solomon, Lawrence "Toronto sprawls: a history." University of Toronto Press; 1 edition, ISBN 0-7727-8618-6 p3-8
- ^ Municipality of Metropolitan Toronto Act Archived January 5, 2011, at the Wayback Machine, Queen's Printer for Ontario. Retrieved on February 6, 2010.
- ^ a b c Archives of Ontario (February 28, 2010). "Municipality of Metropolitan Toronto and the Regional Municipality of York". Queen's Printer for Ontario. Archived from the original on June 19, 2009.
- ^ Rose, Albert "Governing metropolitan Toronto: a social and political analysis, 1953–1971" Institute of Governmental Studies; University of California Press; 1st edition, ISBN 0-520-02041-3 p.107, 166
- ^ Fletcher, Thomas Hobbs "From Love Canal to environmental justice: the politics of hazardous waste on the Canada-U.S. border" University of Toronto Press, ISBN 1-55111-434-8 p28
- ^ Sanction, Andrew "Merger mania: the assault on local government" McGill-Queen's Press, ISBN 0-7735-2163-1 p.114
- ^ Sanction, Andrew "Merger mania: the assault on local government" McGill-Queen's Press, ISBN 0-7735-2163-1 p.115
- ^ Sanction, Andrew "Merger mania: the assault on local government" McGill-Queen's Press, ISBN 0-7735-2163-1 p.116
- ^ City of Toronto Act, 1997 Archived October 17, 2015, at the Wayback Machine, Queen's Printer for Ontario. Retrieved on February 6, 2010.
- ^ Sanction, Andrew "Merger mania: the assault on local government" McGill-Queen's Press, ISBN 0-7735-2163-1 p.121
- ^ Population and land area figures for Toronto and the regional municipalities come from the 2006 Canadian census: [1] Archived September 6, 2007, at the Wayback Machine.
- ^ About Us Archived October 15, 2010, at the Wayback Machine, Rouge National Urban Park. Retrieved on February 7, 2010.
- ^ Jurisdiction and Participating Municipalities Archived January 25, 2010, at the Wayback Machine, Toronto and Region Conservation Authority. Retrieved on February 7, 2010.
- ^ "Greenbelt Plan Area Archived August 5, 2010, at the Wayback Machine," Greenbelt Protection. (Retrieved February 7, 2010.)
- ^ "4 Million More People, But Without the Sprawl[permanent dead link]," Toronto Star. (Retrieved February 7, 2010.)
- ^ a b "Toronto (City)". 1991 to 2020 Canadian Climate Normals. Environment and Climate Change Canada. March 27, 2024. Climate ID: 6158350. Retrieved May 6, 2024.
- ^ "Toronto". 1981 to 2010 Canadian Climate Normals. Environment and Climate Change Canada. September 18, 2023. Climate ID: 6158350. Archived from the original on September 25, 2023. Retrieved September 27, 2023.
- ^ "Bowmanville Mostert". Canadian Climate Normals 1981-2010 Station Data. Environment and Climate Change Canada. Retrieved October 22, 2021.
- ^ a b "Technical Information and Metadata". Daily climate records (LTCE). Environment Canada. Retrieved October 15, 2024.
- ^ "Oshawa WPCP". Canadian Climate Normals 1991–2020. Environment and Climate Change Canada. Retrieved October 19, 2024.
- ^ "Long Term Climate Extremes for Oshawa Area (Virtual Station ID: VSON117)". Daily climate records (LTCE). Environment Canada. Retrieved April 6, 2025.
- ^ "Burlington TS". Canadian Climate Normals 1981–2010. Environment and Climate Change Canada. Retrieved October 22, 2021.
- ^ "Long Term Climate Extremes for Burlington Area (Virtual Station ID: VSON95V)". Daily climate records (LTCE). Environment and Climate Change Canada. Archived from the original on November 10, 2021. Retrieved November 10, 2021.
- ^ "Georgetown WWTP". Canadian Climate Normals 1981–2010. Environment and Climate Change Canada. Retrieved October 19, 2021.
- ^ "Oakville Southeast WPCP". Canadian Climate Normals 1981–2010. Environment and Climate Change Canada. Retrieved October 12, 2013.
- ^ "Toronto Lester B. Pearson International Airport". 1991-2020 Canadian Climate Normals. Environment and Climate Change Canada. Retrieved June 11, 2024.
- ^ "Toronto Lester B. Pearson INT'L A". Canadian Climate Normals 1981–2010. Environment Canada. Archived from the original on October 10, 2017. Retrieved June 3, 2014.
- ^ "Daily Data Report for November 2022". Environment and Climate Change Canada. Retrieved November 7, 2022.
- ^ "Albion Field Centre". 1981-2010 Canadian Climate Normals. Environment and Climate Change Canada. Retrieved May 12, 2016.
- ^ "Toronto Buttonville Airport". Canadian Climate Normals 1991−2020. Environment and Climate Change Canada. Retrieved October 10, 2024.
- ^ "Long Term Climate Extremes for Markham Area (Virtual Station ID: VSON85V)". Daily climate records (LTCE). Environment Canada. Retrieved October 15, 2024.
- ^ "Richmond Hill, Ontario". 1981–2010 Canadian Climate Normals. Environment and Climate Change Canada. Retrieved February 16, 2015.
- ^ "Stouffville WPCP". Canadian Climate Normals 1971–2000. Environment and Climate Change Canada. Retrieved May 12, 2016.
- ^ "Woodbridge, Ontario". Canadian Climate Normals 1981–2010. Environment and Climate Change Canada. Retrieved December 17, 2013.
- ^ "Toronto's key industry clusters: Financial services". City of Toronto. Archived from the original on June 6, 2011. Retrieved February 28, 2010.
- ^ a b c d e "The Greater Toronto Area (GTA): Canada's Primary Economic Locomotive in Need of Repairs Archived January 7, 2011, at the Wayback Machine," TD Financial. (Retrieved February 7, 2010.)
- ^ a b OECD "OECD Territorial Reviews OECD Territorial Reviews: Toronto, Canada 2009" OECD Publishing, ISBN 92-64-07940-8 p35
- ^ Lu, Vanessa (March 16, 2010). "Should Toronto go it alone?". Toronto Star. Archived from the original on March 22, 2010. Retrieved March 24, 2010.
- ^ [2] Archived October 27, 2005, at the Wayback Machine
- ^ Top 10 Reasons for Investing in the GTA Archived March 5, 2010, at the Wayback Machine, Greater Toronto Marketing Alliance. Retrieved on February 7, 2010.
- ^ Labour Force Archived April 19, 2010, at the Wayback Machine, Greater Toronto Marketing Alliance. Retrieved on February 7, 2010.
- ^ a b c Financial Services Archived February 14, 2011, at the Wayback Machine, Greater Toronto Marketing Services. Retrieved on February 7, 2010.
- ^ Markham's High-Tech Companies in The Branham Top 300 Canadian IT Companies Archived June 10, 2011, at the Wayback Machine, Town of Markham. Retrieved on February 7, 2010.
- ^ Automotive & Advanced Manufacturing Archived February 17, 2011, at the Wayback Machine, Greater Toronto Marketing Alliance. Retrieved on February 7, 2010.
- ^ About Magna Archived November 14, 2008, at the Wayback Machine, Magna International. Retrieved on February 7, 2010.
- ^ Contact Us Archived November 14, 2008, at the Wayback Machine, Magna International. Retrieved on February 7, 2010.
- ^ a b GTA Agricultural Profile Archived March 26, 2010, at the Wayback Machine, Greater Toronto Area Agricultural Action Committee. Retrieved on February 12, 2010.
- ^ a b c d e "GREATER TORONTO AREA AGRICULTURAL PROFILE UPDATE Archived February 20, 2009, at the Wayback Machine," Greater Toronto Area Agricultural Action Committee. (Retrieved February 12, 2010.)
- ^ The Big Move Archived April 7, 2010, at the Wayback Machine, Metrolinx. Retrieved on February 7, 2010.
- ^ What Is GO? Archived April 3, 2018, at the Wayback Machine, GO Transit. Retrieved on March 2, 2010.
- ^ About PRESTO Archived July 6, 2011, at the Wayback Machine, Queen's Printer for Ontario. Retrieved on February 7, 2010.
- ^ Public Transportation Archived March 5, 2010, at the Wayback Machine, Greater Toronto Marketing Alliance. Retrieved on March 2, 2010.
- ^ "Ontario government investing $401 million to upgrade Highway 401". Ministry of Transportation. August 6, 2002. Archived from the original on September 14, 2007. Retrieved March 18, 2007.
Highway 401 is the world's busiest highway in the world and a vital link in Ontario's transportation infrastructure that carries more than 400,000 vehicles per day through Toronto.
- ^ Highway 401 Archived March 25, 2010, at the Wayback Machine, Cameron Bevers. Retrieved on February 22, 2010.
- ^ "Southern Ontario Road Maps Map 3" (PDF). Ministry of Transportation. Archived (PDF) from the original on April 19, 2009. Retrieved March 2, 2010.
- ^ GTAA – Toronto Pearson today, Greater Toronto Airports Authority. Retrieved on March 4, 2010.
- ^ "Celebrating 40 Million Passengers". Toronto Pearson Airport. Archived from the original on December 27, 2015.
- ^ Passenger Statistics 2008[permanent dead link], Greater Toronto Airports Authority. Retrieved on March 4, 2010.
- ^ "Tenant List". PortsToronto. Archived from the original on November 27, 2010. Retrieved February 26, 2010.
- ^ "Toronto Island airport set new passenger record last year". Archived from the original on February 25, 2016. Retrieved February 19, 2016.
- ^ Toronto City Code
- ^ Byers, Jim (September 6, 2007). "Pickering airport idea revived". Toronto Star. Archived from the original on April 27, 2014. Retrieved February 26, 2010.
- ^ a b Pickering Airport Draft Plan Report Originally published 2004 Archived November 15, 2008, at the Wayback Machine, GTAA Pickering Project. (Retrieved January 29, 2010.)
- ^ "Area Why are some 905 numbers long distance while others aren't? And what's with this 647 business?". Toronto Life. Archived from the original on November 11, 2009. Retrieved February 28, 2010.
- ^ "Toronto Cultural Tips". National Geographic Society. Archived from the original on March 9, 2010. Retrieved February 28, 2010.
- ^ a b "Area Code Map for Toronto". WhitePages Inc. Archived from the original on March 4, 2010. Retrieved February 28, 2010.
- ^ "CO Code Status". Canadian Numbering Administration Consortium. Archived from the original on May 11, 2010. Retrieved April 7, 2010.
- ^ "CO Code Status". Canadian Numbering Administration Consortium. Archived from the original on April 2, 2010. Retrieved April 7, 2010.
- ^ Toronto to get extra area code, CBC News. Retrieved on February 7, 2010.
- ^ a b "Order CRTC 2001-840". Canadian Radio-television and Telecommunications Commission. Archived from the original on February 3, 2004. Retrieved February 28, 2010.
- ^ Telecommunications Alliance | New area codes for the Greater Toronto Area Archived September 25, 2011, at the Wayback Machine. Newswire.ca. Retrieved on July 26, 2013.
- ^ "Senators in Alphabetical Order". Senate of Canada. Archived from the original on February 17, 2010. Retrieved February 26, 2010.
- ^ "Tories struggle in Toronto's Liberal strongholds". CTV News. Archived from the original on October 21, 2010. Retrieved February 26, 2010.
- ^ Ditchburn, Jennifer; Jones, Allison (October 12, 2015). "Election 2015: Why the Greater Toronto Area boils down to a few distinct fights". CTV News. Archived from the original on January 28, 2018. Retrieved January 27, 2018.
- ^ Rider, David. "Red wave rolls over the GTA". Toronto Star. Archived from the original on February 10, 2018. Retrieved November 3, 2015.
- ^ "Ontario Votes 2007 – Regional results". Canada: CBC. Archived from the original on May 25, 2010. Retrieved March 24, 2010.
- ^ "Liberals surge in Toronto, 905 ridings". Canada: CBC. October 11, 2007. Archived from the original on September 14, 2010. Retrieved March 24, 2010.
- ^ "GTA Liberal ridings shut out vote-hungry Tories". Canada: CBC. October 7, 2011. Archived from the original on October 7, 2011. Retrieved October 7, 2011.
- ^ Lorinc, John. "How Toronto Lost Its Groove, and why the rest of Canada should resist the temptation to cheer" Archived November 21, 2011, at the Wayback Machine, The Walrus, Toronto, November 2011. Retrieved on November 20, 2011.
- ^ Sancton, Andrew "Merger Mania" McGill-Queen's Press, ISBN 0-7735-2163-1 p113
- ^ Lu, Vanessa (July 15, 2009). "GTA needs economic 'war cabinet'". The Toronto Star. Archived from the original on July 18, 2009. Retrieved February 26, 2010.
- ^ a b e/?search=browseRepealed&context= Greater Toronto Services Board Act, 1998, Queen's Printer for Ontario. Retrieved on February 22, 2010.
- ^ Rao, Nirmala (2007). Cities in transition: growth, change and governance in six metropolitan areas. Routledge. p. 65. ISBN 9780415329019. Archived from the original on June 10, 2016. Retrieved November 20, 2015.
- ^ "Metrolinx – About Us". Metrolinx. Archived from the original on May 5, 2010. Retrieved February 26, 2010.
- ^ "About: TRCA". Toronto and Region Conservation Authority. Archived from the original on November 26, 2011. Retrieved November 20, 2011.
- ^ "Toward 2025: Assessing Ontario's Long-Term Outlook" (PDF). Ministry of Finance (Ontario). Archived from the original (PDF) on March 27, 2009. Retrieved February 28, 2010.
- ^ "Toward 2025: Assessing Ontario's Long-Term Outlook". Ministry of Finance (Ontario). 2005. Archived from the original on May 14, 2007. Retrieved May 23, 2007.
- ^ Government of Canada, Statistics Canada (January 15, 2001). "Census of Population". www12.statcan.gc.ca. Retrieved February 10, 2022.
- ^ "Ontario". Geographical Names Data Base. Natural Resources Canada.
- ^ Government of Canada, Statistics Canada (February 9, 2022). "Data table, Census Profile, 2021 Census of Population - Toronto, Census division (CDR) [Census division], Ontario". www12.statcan.gc.ca. Retrieved February 10, 2022.
- ^ "City of Toronto". Geographical Names Data Base. Natural Resources Canada.
- ^ Government of Canada, Statistics Canada (February 9, 2022). "Data table, Census Profile, 2021 Census of Population - Durham, Regional municipality (RM) [Census division], Ontario". www12.statcan.gc.ca. Retrieved February 10, 2022.
- ^ "Regional Municipality of Durham". Geographical Names Data Base. Natural Resources Canada.
- ^ Government of Canada, Statistics Canada (February 9, 2022). "Data table, Census Profile, 2021 Census of Population - Peel, Regional municipality (RM) [Census division], Ontario". www12.statcan.gc.ca. Retrieved February 10, 2022.
- ^ "Regional Municipality of Peel". Geographical Names Data Base. Natural Resources Canada.
- ^ Government of Canada, Statistics Canada (February 9, 2022). "Data table, Census Profile, 2021 Census of Population - York, Regional municipality (RM) [Census division], Ontario". www12.statcan.gc.ca. Retrieved February 10, 2022.
- ^ "Regional Municipality of York". Geographical Names Data Base. Natural Resources Canada.
- ^ Government of Canada, Statistics Canada (February 9, 2022). "Data table, Census Profile, 2021 Census of Population - Halton, Regional municipality (RM) [Census division], Ontario". www12.statcan.gc.ca. Retrieved February 10, 2022.
- ^ "Regional Municipality of Halton". Geographical Names Data Base. Natural Resources Canada.
- ^ "Toronto's racial diversity". City of Toronto. February 22, 2010. Archived from the original on March 15, 2010.
- ^ Government of Canada, Statistics Canada (October 26, 2022). "Census Profile, 2021 Census of Population Toronto, City (C) Ontario [Census subdivision]". www12.statcan.gc.ca. Retrieved October 9, 2023.
- ^ Government of Canada, Statistics Canada (October 26, 2022). "Census Profile, 2021 Census of Population Peel, Regional municipality (RM) Ontario [Census division]". www12.statcan.gc.ca. Retrieved October 9, 2023.
- ^ Government of Canada, Statistics Canada (October 26, 2022). "Census Profile, 2021 Census of Population York, Regional municipality (RM) Ontario [Census division]". www12.statcan.gc.ca. Retrieved October 9, 2023.
- ^ Government of Canada, Statistics Canada (October 26, 2022). "Census Profile, 2021 Census of Population Durham, Regional municipality (RM) Ontario [Census division]". www12.statcan.gc.ca. Retrieved October 9, 2023.
- ^ Government of Canada, Statistics Canada (October 26, 2022). "Census Profile, 2021 Census of Population Halton, Regional municipality (RM) Ontario [Census division]". www12.statcan.gc.ca. Retrieved October 9, 2023.
- ^ Government of Canada, Statistics Canada (October 27, 2021). "Census Profile, 2016 Census Toronto, City [Census subdivision], Ontario and Toronto, Census division [Census division], Ontario [Province]". www12.statcan.gc.ca. Retrieved October 9, 2023.
- ^ Government of Canada, Statistics Canada (October 27, 2021). "Census Profile, 2016 Census Peel, Regional municipality [Census division], Ontario and Ontario [Province]". www12.statcan.gc.ca. Retrieved October 9, 2023.
- ^ Government of Canada, Statistics Canada (October 27, 2021). "Census Profile, 2016 Census York, Regional municipality [Census division], Ontario and Ontario [Province]". www12.statcan.gc.ca. Retrieved October 9, 2023.
- ^ Government of Canada, Statistics Canada (October 27, 2021). "Census Profile, 2016 Census Durham, Regional municipality [Census division], Ontario and Ontario [Province]". www12.statcan.gc.ca. Retrieved October 9, 2023.
- ^ Government of Canada, Statistics Canada (October 27, 2021). "Census Profile, 2016 Census Halton, Regional municipality [Census division], Ontario and Ontario [Province]". www12.statcan.gc.ca. Retrieved October 9, 2023.
- ^ Government of Canada, Statistics Canada (November 27, 2015). "NHS Profile, Toronto, C, Ontario, 2011". www12.statcan.gc.ca. Retrieved October 9, 2023.
- ^ Government of Canada, Statistics Canada (November 27, 2015). "NHS Profile, Peel, RM, Ontario, 2011". www12.statcan.gc.ca. Retrieved October 9, 2023.
- ^ Government of Canada, Statistics Canada (November 27, 2015). "NHS Profile, York, RM, Ontario, 2011". www12.statcan.gc.ca. Retrieved October 9, 2023.
- ^ Government of Canada, Statistics Canada (November 27, 2015). "NHS Profile, Durham, RM, Ontario, 2011". www12.statcan.gc.ca. Retrieved October 9, 2023.
- ^ Government of Canada, Statistics Canada (November 27, 2015). "NHS Profile, Halton, RM, Ontario, 2011". www12.statcan.gc.ca. Retrieved October 9, 2023.
- ^ Government of Canada, Statistics Canada (August 20, 2019). "2006 Community Profiles Toronto Ontario (City)". www12.statcan.gc.ca. Retrieved October 9, 2023.
- ^ Government of Canada, Statistics Canada (August 20, 2019). "2006 Community Profiles Peel Ontario (Regional municipality)". www12.statcan.gc.ca. Retrieved October 9, 2023.
- ^ Government of Canada, Statistics Canada (August 20, 2019). "2006 Community Profiles York Ontario (Regional municipality)". www12.statcan.gc.ca. Retrieved October 9, 2023.
- ^ Government of Canada, Statistics Canada (August 20, 2019). "2006 Community Profiles Durham Ontario (Regional municipality)". www12.statcan.gc.ca. Retrieved October 9, 2023.
- ^ Government of Canada, Statistics Canada (August 20, 2019). "2006 Community Profiles Halton Ontario (Regional municipality)". www12.statcan.gc.ca. Retrieved October 9, 2023.
- ^ Government of Canada, Statistics Canada (July 2, 2019). "2001 Community Profiles Toronto Ontario (City)". www12.statcan.gc.ca. Retrieved October 9, 2023.
- ^ Government of Canada, Statistics Canada (July 2, 2019). "2001 Community Profiles Peel Regional Municipality Ontario (Regional Municipality)". www12.statcan.gc.ca. Retrieved October 9, 2023.
- ^ Government of Canada, Statistics Canada (July 2, 2019). "2001 Community Profiles York Regional Municipality Ontario (Regional Municipality)". www12.statcan.gc.ca. Retrieved October 9, 2023.
- ^ Government of Canada, Statistics Canada (July 2, 2019). "2001 Community Profiles Durham Regional Municipality Ontario (Regional Municipality)". www12.statcan.gc.ca. Retrieved October 9, 2023.
- ^ Government of Canada, Statistics Canada (July 2, 2019). "2001 Community Profiles Halton Regional Municipality Ontario (Regional Municipality)". www12.statcan.gc.ca. Retrieved October 9, 2023.
- ^ Ministry of Education, Ontario (2010). "About the Ministry". Government of Ontario. Queen's Printer for Ontario, 2010. Archived from the original on December 20, 2010. Retrieved December 14, 2010.
- ^ Ministry of Training, Colleges; Universities, Ontario (2010). "Welcome to TCU". Government of Ontario. Queen's Printer for Ontario, 2010. Archived from the original on December 21, 2010. Retrieved December 14, 2010.
- ^ "Getting to Know Ontario's Colleges". Ministry of Training, Colleges, and Universities. Find a College. Queen's Printer, Ontario. January 1, 2010. Archived from the original on February 26, 2010. Retrieved February 23, 2010.
- ^ "Private Career Colleges (PCC)". Ministry of Training, Colleges, and Universities. Queen's Printer, Ontario. November 18, 2007. Archived from the original on February 24, 2010. Retrieved February 28, 2010.
- ^ "Getting to Know Ontario's Universities". Ministry of Training, Colleges, and Universities. Finding a University. Queen's Printer, Ontario. April 24, 2009. Archived from the original on February 18, 2010. Retrieved February 23, 2010.
- ^ Office of Public Relations, McMaster University (June 17, 2009). "Celebrating expansion into Burlington". McMaster Daily News. McMaster University. Archived from the original on July 6, 2011. Retrieved May 6, 2011.
- ^ Trent University (2010). "The Trent Difference in Oshawa". Trent University. Archived from the original on December 25, 2010.
- ^ University of Guelph and Humber Institute of Technology and Advanced Learning (2005). "bout the University of Guelph-Humber". University of Guelph-Humber. Archived from the original on July 24, 2010. Retrieved December 10, 2018.
- ^ "Privately Funded Ontario Institutions with Degree-Granting Authority". Ministry of Training, Colleges, and Universities. Queen's Printer, Ontario. March 16, 2007. Archived from the original on March 23, 2010. Retrieved February 23, 2010.
External links
[edit] Greater Toronto Area travel guide from Wikivoyage

Largest city: Toronto | ||
| Regions |  | |
| Cities | ||
| Towns | ||
| Townships | ||
| Municipalities | ||

Subdivisions of Ontario | |
|---|---|
| Counties | |
| Districts | |
| Regional municipalities | |
| Single-tier municipalities | |
| Separated municipalities | |
| Regions | |


Great Lakes megalopolis as defined by the RPA | ||
|---|---|---|
Includes all metropolitan areas that have a population of 150,000 or greater according to the most recent national census. | ||
| Great Lakes region cities |  | |
| Surrounding cities |
| |
| Cities of states south of region | ||
| Other metro-regions | ||
| International | |
|---|---|
| National | |

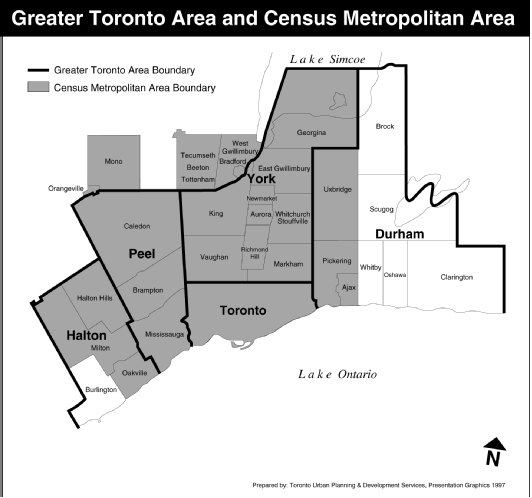

Greater Toronto Area
View on GrokipediaDefinition and Etymology
Boundaries and Administrative Composition
The Greater Toronto Area (GTA) constitutes a provincial planning and economic region in southern Ontario, encompassing the single-tier City of Toronto and the four upper-tier regional municipalities of Durham, Halton, Peel, and York.[4] [5] This delineation, established for purposes such as economic development and infrastructure coordination rather than forming a unified political entity, spans approximately 7,125 square kilometres of land.[6] The region's boundaries are defined by the outer limits of these municipalities, extending northward from Lake Ontario, eastward to the edges of Durham Region, westward into Halton and Peel Regions, and incorporating the urban core of Toronto.[7] Administratively, the GTA comprises 25 incorporated municipalities, including Toronto as a single-tier city and 24 lower-tier municipalities distributed across the four regions.[4] Upper-tier regional governments oversee broader services like transportation, water supply, and waste management, while lower-tier municipalities handle local affairs such as zoning and community services.[5] The structure reflects Ontario's two-tier municipal system outside of Toronto, promoting coordinated regional planning amid rapid urbanization.| Region | Lower-Tier Municipalities |
|---|---|
| Durham | Ajax, Brock, Clarington, Oshawa, Pickering, Scugog, Whitby (7)[5] |
| Halton | Burlington, Halton Hills, Milton, Oakville (4)[5] |
| Peel | Brampton, Caledon, Mississauga (3)[5] |
| York | Aurora, East Gwillimbury, Georgina, King, Markham, Newmarket, Richmond Hill, Vaughan, Whitchurch-Stouffville (9)[8] |
| Toronto | City of Toronto (single-tier)[4] |
Origin of the Term
The term "Greater Toronto" appeared in print as early as the 1920s to encompass the City of Toronto and its contiguous suburbs, amid early 20th-century annexation debates and streetcar-driven expansion that integrated areas like North Toronto and East York.[10] This usage preceded formal metropolitan governance, highlighting causal links between infrastructure growth—such as radial railways—and the recognition of Toronto's de facto urban footprint exceeding municipal limits. By contrast, the precise phrase "Greater Toronto Area" crystallized in regional planning discourse during the 1970s, as Ontario restructured peripheral townships into upper-tier regional municipalities (Peel and Durham in 1974, York in 1971, Halton reorganized in 1974) to address fragmented land-use authority, fiscal imbalances, and spillover effects from Metropolitan Toronto's 1954 formation.[11] These reforms responded to postwar population surges, with the GTA designation empirically capturing interdependent commuter patterns, shared watersheds, and economic corridors evidenced in provincial transportation studies and federal census delineations.[12] Official adoption accelerated in the 1980s, when the term delineated the zone for coordinated infrastructure investment, such as Highway 407's planning (initiated 1971 but expanded amid sprawl) and GO Transit's network, which by 1980 linked Toronto to outer suburbs via 55 miles of rail.[13] The Province of Ontario formalized the GTA's boundaries—encompassing approximately 7,100 square kilometers and aligning with Statistics Canada's broader Toronto Census Metropolitan Area while emphasizing administrative cohesion—in policy frameworks like the 1988 creation of the Office for the Greater Toronto Area, aimed at mitigating inter-municipal competition over development and services.[14] This evolution underscores causal realism in urban nomenclature: terms like GTA arose not from arbitrary fiat but from observable integration of labor markets (e.g., 40% of regional GDP from Toronto-centric finance and manufacturing by 1990) and environmental pressures, such as Lake Ontario watershed management, overriding narrower civic identities. Sources from planning archives and government reports consistently trace this without a singular "coining" event, reflecting incremental adaptation to empirical sprawl rather than ideological constructs.[11]History
Pre-Colonial and Early Settlement
The Greater Toronto Area (GTA) was inhabited by Indigenous peoples for millennia prior to European arrival, with archaeological evidence indicating human occupation dating back at least 7,000 BCE in regions such as High Park, where Iroquoian ancestors utilized the Humber River for trade and sustenance.[15] Artifacts from Early Woodland period sites along the north shores of Lake Ontario demonstrate seasonal use for hunting, fishing, and gathering in forested landscapes interspersed with savannas on sandier soils.[16][17] By the late pre-contact era, the Toronto region served as a strategic "meeting place" or portage route between Lake Ontario and Lake Simcoe, facilitating movement among Iroquoian groups like the Huron-Wendat, whose villages were established nearby for generations before the 17th century, though direct settlements in the immediate GTA were sparser due to reliance on hunting territories.[18] French explorer Étienne Brûlé became the first recorded European to traverse the Toronto area in 1615, traveling with Huron guides along the ancient portage route from the Humber River to the Holland River, thereby becoming the first non-Indigenous person to view much of Lake Ontario and penetrate the interior of what is now southern Ontario.[19] This expedition, dispatched by Samuel de Champlain, aimed to forge alliances and explore trade routes amid ongoing Indigenous conflicts, marking initial European-Indigenous interactions in the region without establishing permanent presence. Subsequent French efforts focused northward, leaving the GTA largely under Mississauga Anishinaabe control by the late 17th century following Iroquoian displacements from the Beaver Wars. British settlement commenced after the 1787 Toronto Purchase, through which the Mississaugas ceded approximately 250,880 acres around the Toronto Harbour to the Crown for £1,700 in goods and annual payments, enabling colonial expansion post-American Revolution.[20] In 1793, Lieutenant Governor John Graves Simcoe selected the site for York (later Toronto) as the temporary capital of Upper Canada, strategically distant from the U.S. border at Niagara to mitigate invasion risks, and ordered construction of a garrison—Fort York—to defend the harbor entrance.[21][22] Initial settlement involved Loyalist migrants and British military personnel, with the population reaching about 80 by 1796, centered on rudimentary log structures and agricultural clearings amid ongoing Indigenous land use.[23] By the early 1800s, York expanded modestly as a provisioning hub, though growth remained limited until after the War of 1812, when American forces briefly captured and burned the town in 1813.Industrialization and Urban Expansion (1800s–1940s)
In the mid-19th century, Toronto transitioned from an agrarian economy to an industrial hub, catalyzed by the arrival of railways in the 1850s, which facilitated resource extraction, trade, and manufacturing expansion. The Toronto and Guelph Railway, incorporated in 1851, marked an early step, with the city subscribing £100,000 in stock by referendum in June 1850 to connect to Lake Huron markets, overcoming initial merchant resistance tied to canal interests. By the 1870s, water-powered mills for grist, sawing, textiles, and foundries dominated, leveraging Ontario's waterways, while railways like the Grand Trunk integrated Toronto into broader networks, boosting exports of timber, flour, and iron products. This infrastructure spurred factory development along rail corridors, shifting economic activity from rural farms to urban workshops and laying the groundwork for sustained growth despite periodic depressions.[24][25][26] Population surged alongside industrialization, from 30,000 in 1851 to 181,000 by 1891, driven by European immigration and internal migration seeking factory jobs, with the metropolitan area reaching approximately 800,000 by 1931, of which 630,000 resided within the former city limits. Urban expansion involved annexations of adjacent townships, such as York Township in 1883 and 1912, enabling residential and industrial sprawl northward and eastward, supported by streetcar lines from the 1890s that extended settlement beyond the old grid. Factory towns emerged in neighborhoods like Riverdale and Leslieville, where employers built worker housing near sites for metalworking, printing, and food processing, fostering localized communities amid rapid densification. This phase reflected causal links between transport improvements and land value increases, concentrating development in a radial pattern around the harbor and rail hubs.[27][28][29] By the early 20th century, Toronto's manufacturing diversified into heavy sectors, including steel, vehicles, electrical goods, and shipbuilding, with garment production peaking as a labor-intensive staple employing thousands in sweatshops clustered downtown. World War I accelerated demand for armaments and textiles, employing women in factories and solidifying Toronto's role in Canada's industrial output, while the interwar period saw consolidation amid economic volatility. World War II further propelled growth, with aerospace assembly and munitions production drawing federal investment, as facilities near the airport produced components for Allied aircraft, elevating the region's GDP contribution. These developments entrenched manufacturing as 40% of employment by 1941, though reliant on imported coal and proximity to Great Lakes shipping, underscoring vulnerabilities to global disruptions.[30][31][32]Postwar Boom and Suburban Development (1950s–1980s)
The postwar era marked a period of unprecedented population expansion in the Greater Toronto Area, fueled by high birth rates from the baby boom and substantial immigration from Europe, with the Toronto metropolitan area's population growing from approximately 1.1 million in 1951 to over 3 million by 1981.[33][34] This surge created acute housing shortages in central Toronto, prompting a shift toward peripheral development where land was cheaper and more abundant.[35] To address coordination challenges, the Ontario government established Metropolitan Toronto in 1953, encompassing the City of Toronto and surrounding municipalities like North York, Scarborough, Etobicoke, York, and North Toronto, enabling unified planning for services such as roads and utilities amid rapid suburbanization.[36] Private developers, supported by federal initiatives like the 1944 Veterans' Land Act and 1950s mortgage guarantees, constructed large-scale subdivisions of modest single-family homes, often featuring identical designs in areas such as Rexdale and Kipling Heights by the 1970s.[35] These projects catered to middle-class families seeking affordable detached housing, with automobile ownership rising sharply to facilitate commutes from jobs in manufacturing and services concentrated in the urban core.[35] Infrastructure investments accelerated this outward growth, including the completion of the Toronto Bypass segment of Highway 401 between 1952 and 1956, which spanned from Etobicoke to Scarborough and handled increasing traffic volumes.[37] Complementary projects like the F.G. Gardiner Expressway (1956–1964) and Don Valley Parkway (construction starting 1964) further linked suburbs to downtown, while Metropolitan Toronto expanded water and sewage systems with new treatment plants and trunk lines from 1955 to 1970 at a cost of about $500 million, funded partly through bond issues.[36] Adjacent regions such as Peel County (later incorporating Mississauga in 1974) saw parallel development, with Toronto Township attracting 34 industries by 1953 and initiating mixed residential-industrial subdivisions tied to highway access like the Queen Elizabeth Way extensions.[38] By the 1980s, this model yielded extensive low-density sprawl across the GTA, accommodating demographic pressures but fostering car dependency and straining public transit, as suburban residents increasingly relied on personal vehicles over expanding but limited bus and subway networks.[36] The pattern provided accessible homeownership for many but highlighted emerging fiscal burdens on regional governments for maintaining dispersed infrastructure.[36]Modern Growth and Policy Shifts (1990s–Present)
The Greater Toronto Area (GTA) experienced sustained population growth from the 1990s onward, expanding from approximately 4.6 million residents in 1996 to over 7 million by 2023, primarily driven by international immigration which accounted for the majority of net gains after the late 1990s.[39] [40] This influx contributed to economic expansion, with real GDP growth averaging around 4% annually and employment rising by 2.4% per year since 1992, fueled by sectors like finance, technology, and film production.[41] However, rapid demographic pressures exacerbated infrastructure strains, including housing shortages and traffic congestion, as natural increase played a diminishing role in population dynamics.[42] A pivotal policy shift occurred in 1998 with the amalgamation of Metropolitan Toronto's seven municipalities into a single City of Toronto, tripling its land area to 630 square kilometers and expanding its population base to about 2.5 million, ostensibly to achieve administrative efficiencies and coordinate regional growth. Proponents anticipated cost savings through consolidated services, with reports citing a 60% reduction in executive positions, but empirical outcomes were mixed: no substantial fiscal efficiencies materialized, civic engagement diminished due to diluted local representation, and suburban-rural divides intensified without resolving sprawl.[43] [44] [45] Critics attribute persistent service silos and higher per-capita costs to the structure's failure to align incentives across diverse communities.[46] Provincial policies under successive governments emphasized intensification over unchecked sprawl, exemplified by the 2006 Places to Grow Act, which designated urban growth centers and prioritized transit-oriented development to accommodate projected population increases.[47] Yet, housing supply lagged demand, with rents rising 10% faster than wages since 2000 amid zoning restrictions and reduced public investment in affordable units post-1990s federal cuts.[48] [49] Federal immigration targets escalated dramatically, from 250,000 annually in the early 2000s to 500,000 by 2025, concentrating newcomers in the GTA and amplifying affordability pressures without commensurate infrastructure scaling.[50] [51] This mismatch prompted outflows of young families from the region, as evidenced by interprovincial migration data showing net losses to lower-cost areas.[52] Under Premier Doug Ford's administration from 2018, policies shifted toward deregulation to boost supply, including Bill 23 (2022) which streamlined approvals and reduced development charges, alongside ambitious targets for 1.5 million new homes province-wide by 2031.[53] A controversial 2022 proposal to rezone 7,400 hectares of Greenbelt land for housing—later reversed in 2023 amid integrity commissioner findings of developer favoritism—highlighted tensions between environmental protection and urgent supply needs, yielding negligible affordable units even if implemented.[54] [55] Transit investments accelerated via Metrolinx, with GO Transit's Expansion program adding over 300 weekly trips by 2024 on key corridors like Lakeshore and Kitchener, introducing all-day two-way service to mitigate auto dependency.[56] [47] These measures, while advancing connectivity, faced delays and cost overruns, underscoring causal links between policy ambition and execution gaps in a high-immigration context.[13]Geography
Topography and Land Use
The Greater Toronto Area occupies a portion of the Great Lakes Lowlands physiographic province in southern Ontario, featuring low-relief terrain predominantly shaped by Pleistocene glaciations from the Laurentide Ice Sheet, which deposited thick sequences of glacial till, sand, gravel, and clay up to 200 meters thick overlying Paleozoic bedrock.[57] The landscape includes subtle glacial landforms such as drumlins, eskers, and kame moraines, contributing to gently rolling plains interspersed with deep ravines incised by rivers like the Don and Humber.[58] Elevations generally range from 74 meters above sea level along the Lake Ontario waterfront to approximately 209 meters in northern Toronto, rising further northward to peaks exceeding 400 meters along the Oak Ridges Moraine, a 1,900-square-kilometer ridge of glacial sediments that influences local hydrology by directing drainage southward to Lake Ontario and northward to Lake Simcoe.[59][60] Land use across the GTA's 5,903 square kilometers reflects intensive urbanization in the southern core, where over 80% of the Toronto census metropolitan area's 6.2 million residents (as of 2021) concentrate in developed zones, yielding an average population density of 1,051 persons per square kilometer that masks higher densities exceeding 4,000 per square kilometer in central Toronto.[3] Residential suburbs dominate mid-range municipalities like Mississauga and Brampton, while industrial and commercial lands cluster along transportation corridors, including Highway 401 and rail lines; peripheral areas in Durham and Halton regions retain agricultural uses, with specialty crops on fertile glacial soils supporting local farming amid encroaching development pressures.[2] Natural and recreational lands comprise about 20-25% of the total, bolstered by protections such as the Ontario Greenbelt (enacted 2005), which safeguards 800,000 hectares of farmland, forests, and wetlands overlapping GTA boundaries to mitigate sprawl and preserve aquifer recharge zones tied to moraine hydrology.[61] This mosaic of uses has evolved through post-glacial sediment stability enabling early settlement and modern infrastructure, though glacial till variability poses engineering challenges for foundations and drainage in urban expansion.[58] Recent assessments project sustained demand for employment lands, with needs for 1 million square meters of additional office space by 2041 in Toronto alone, underscoring tensions between development and topographic constraints like ravine preservation.[61]Urban Form and Sprawl
The Greater Toronto Area (GTA) displays a polycentric urban form dominated by a high-density core in the City of Toronto, which transitions into expansive low-density suburbs across surrounding municipalities like Mississauga, Brampton, and Vaughan. Toronto's downtown and inner areas feature concentrated high-rise residential and commercial towers, achieving population densities above 5,000 persons per square kilometer within 1 kilometer of the central business district, while the broader census metropolitan area (CMA) averages around 1,050 persons per square kilometer.[62][3] In contrast, suburban zones in the "905" belt exhibit densities typically under 1,000 persons per square kilometer, characterized by single-detached homes, strip commercial corridors, and separated land uses that prioritize automobile access over pedestrian or transit-oriented design.[63] Urban sprawl in the GTA manifests as outward radial and ribbon expansion from the Toronto core, with the built-up area increasing by 1,115 square kilometers between 1974 and 2014, outpacing population growth and consuming prime agricultural land in regions like Peel and York.[64] This pattern persists into the 2020s, as evidenced by 2016–2021 housing stock growth, where approximately 60% of new units occurred on the urban fringe through low-density greenfield developments, despite provincial targets for intensification.[63][65] Sprawl has been fueled by postwar highway expansions, such as the 401 and Queen Elizabeth Way, which facilitated automobile-dependent commuting, alongside municipal fiscal incentives that favor property tax revenue from new suburban lots over denser infill.[66][67] The effects of this sprawl include elevated infrastructure costs, with per capita spending on roads and utilities rising due to linear extension of services across dispersed areas, estimated to add billions in long-term municipal debt.[68] Vehicular travel demand has correspondingly intensified, correlating with urban form metrics like lower densities and greater separation of residences from employment centers, resulting in average GTA commute times exceeding 30 minutes by car.[69] Environmentally, sprawl contributes to farmland loss—over 300,000 hectares in southern Ontario since 1976—and higher greenhouse gas emissions from transport, though causal links are mediated by policy failures in transit investment rather than density alone.[70][71] Policy responses have oscillated between containment and accommodation. The 2006 Places to Grow Act mandated 70% of new population growth within existing urban boundaries by 2031, promoting densification through transit-oriented nodes, yet compliance has been uneven, with sprawl comprising up to 40% of recent expansions in some analyses.[72] Provincial amendments in 2019–2022 expanded urban area boundaries by 165 square kilometers, prioritizing housing supply amid shortages but enabling further fringe development, as critiqued by environmental groups for undermining greenbelt protections.[73] Empirical evidence from satellite imagery and census data indicates modest suburban densification in auto-oriented areas, challenging narratives of unchecked sprawl but highlighting persistent "tall and sprawl" outcomes where core intensification coexists with peripheral expansion.[74][63]Climate and Environment
Meteorological Characteristics
The Greater Toronto Area experiences a humid continental climate classified under the Köppen system as Dfa, characterized by four distinct seasons with cold, snowy winters and warm, humid summers moderated by Lake Ontario.[75] The lake effect influences weather patterns, providing thermal moderation that prevents extreme cold snaps compared to inland Ontario regions while contributing to enhanced snowfall in lake-facing areas like Toronto's eastern and northern suburbs. Annual mean temperature averages approximately 9.4°C at Toronto Pearson International Airport, based on 1991–2020 normals, with diurnal ranges typically between 10–15°C in summer and narrower in winter due to cloud cover and lake proximity.[76] January, the coldest month, sees mean daily highs of -0.7°C and lows of -7.6°C, while July, the warmest, averages highs of 26.5°C and lows of 17.2°C.[76] Frost-free periods last about 180–200 days, supporting urban agriculture and outdoor activities, though urban heat islands in core Toronto can elevate nighttime lows by 2–4°C relative to rural GTA fringes. Wind patterns, predominantly westerly, average 13–16 km/h year-round, with gusts exceeding 50 km/h during frontal passages, contributing to frequent overcast skies in fall and winter.[75] Precipitation totals average 831 mm annually, distributed fairly evenly but with peaks in summer thunderstorms and winter lake-effect events; approximately 28% falls as snow, yielding about 122 cm of seasonal accumulation.[76] [77] Snow cover persists for 60–70 days on average, deeper in northern GTA municipalities like Vaughan due to elevation and distance from the lake's warming influence. Thunderstorms occur on 20–25 days yearly, often convective and capable of producing hail up to 2 cm in diameter, while fog is common in autumn along the waterfront, reducing visibility below 1 km on 30–40 occasions.[75] Extreme events underscore variability: the record high of 40.6°C occurred on July 8–10, 1936, while the all-time low was -32.8°C on January 10, 1859, both at downtown Toronto stations.[78] More recent extremes include a -31.3°C reading at Pearson Airport on January 4, 1981.[79] Severe weather risks include derechos and microbursts in summer, with historical data showing increasing intensity in short-duration rainfall events, though long-term trends in overall extremes remain debated pending further analysis of localized GTA stations.[80]Environmental Pressures and Sustainability
The Greater Toronto Area (GTA) faces significant environmental pressures from rapid urbanization, including habitat fragmentation and loss of agricultural land due to sprawl, which expanded by approximately 20% between 1985 and 2005, converting natural and rural landscapes into low-density developments.[81] This has increased impervious surfaces, exacerbating stormwater runoff and contributing to downstream flooding risks, with urban areas experiencing heightened vulnerability from climate-driven extreme precipitation events.[82] Air pollution, primarily from traffic-related emissions, remains a concern despite overall improvements; Toronto's annual PM2.5 concentration averaged 7.4 μg/m³ in 2019, ranking it moderately among global cities, though localized traffic pollution affects respiratory health in dense corridors.[83] [84] Water quality in Lake Ontario, the GTA's primary freshwater source, is impaired by combined sewer overflows during storms, discharging untreated or partially treated sewage containing pathogens, nutrients, and microplastics; for instance, a July 2024 storm released over 1.3 billion litres of diluted wastewater into Toronto's waterways, equivalent to 500 Olympic-sized pools.[85] The Toronto region has been designated an Area of Concern by Environment Canada since 1987 due to degraded benthic conditions and contamination from urban discharges, with the Don River alone contributing an estimated 500 billion microplastic particles annually to the lake.[86] [87] Urban heat island effects amplify these pressures, raising surface temperatures by up to 10–15°C in built-up zones compared to rural areas, intensifying heat waves and straining energy demands for cooling.[88] Waste management challenges persist, with Toronto's residential diversion rate for recycling and organics at around 52% in recent years, though up to 30% of collected recyclables still require landfilling due to contamination.[89] [90] Sustainability initiatives aim to mitigate these issues through policy and infrastructure measures, such as the Ontario Greenbelt, which encompasses over 2 million acres of protected farmland, wetlands, and forests to curb sprawl, enhance flood resilience, and sequester carbon, though 2023 proposals to remove portions for housing faced reversal amid evidence of biased site selection lacking environmental justification.[91] Provincial and municipal strategies promote compact growth and green building, with the Toronto Region Conservation Authority noting a decline in sprawl rates alongside rising adoption of low-impact development to manage stormwater and reduce urban heat.[92] Climate adaptation efforts include nature-based solutions like expanded urban forests and wetlands restoration to buffer flooding and heat islands, integrated into regional plans that prioritize habitat connectivity over unchecked expansion.[93] [94] Despite progress, such as declining air pollutant emissions from regulatory controls, ongoing challenges like aging sewer infrastructure and population growth—projected to add millions by 2050—necessitate rigorous enforcement and investment to avoid exacerbating pressures, with economic analyses underscoring the long-term fiscal benefits of ecosystem preservation over short-term development gains.[95]Economy
Major Industries and Employment
The Greater Toronto Area's economy is heavily oriented toward services, which account for the majority of employment, with finance and insurance, professional and technical services, and real estate leading contributions to output and jobs. In 2024, overall employment in the GTA rose by 64,400 positions, or 1.7%, amid moderating growth following post-pandemic recovery. The financial services sector anchors the region, hosting over 10,000 firms and employing more than 270,000 workers, drawing over half of Canada's foreign capital investment in the industry. This sector's prominence stems from Toronto's role as Canada's financial capital, with institutions like the Toronto Stock Exchange and major banks concentrating activity in the downtown core.[96][97] Professional, scientific, and technical services, including a burgeoning technology cluster, support around 285,000 skilled workers across the GTA, bolstered by hubs like MaRS Discovery District and proximity to talent pools. Ontario added 17,837 net tech jobs province-wide in 2024, with Toronto capturing the largest share due to demand in AI, software, and fintech. Manufacturing, concentrated in suburban municipalities like Peel and Halton, comprises about 9.6% of GTA employment but experienced a slight 0.2% decline in 2024, reflecting automation, offshoring pressures, and shifts toward higher-value assembly in automotive and aerospace subsectors.[98][99][100] The film, television, and digital media industries, dubbing the GTA "Hollywood North," generated 25,862 full-time equivalent jobs in Ontario in 2023, with the bulk in Toronto-area studios and post-production facilities amid $1.8 billion in economic activity. Health care, education, and retail also sustain large workforces, though these face strains from immigration-driven population growth outpacing job creation in some segments. Overall, service-based industries drove Toronto's city-level employment gains of 65,010 jobs (4.2%) in 2024, underscoring the region's transition from goods-producing roots to knowledge and creative economies.[101][102]Productivity, Innovation, and Fiscal Realities
The Greater Toronto Area (GTA) exhibits persistent challenges in labor productivity, with Ontario's real per-capita GDP growth averaging just 0.55% annually from 2000 to 2023, lagging the rest of Canada's 0.91%.[103] Despite the GTA generating 21% of national GDP as of 2020, its median employment income growth has averaged only 0.4% annually in recent years, ranking low among comparable North American metros.[104][105] Contributing factors include elevated housing costs, which exacerbate long commutes for essential workers and result in estimated annual productivity losses of $0.65 to $1.95 billion across the region due to time and fuel inefficiencies.[106] Rapid population growth from immigration—26% of Canada's workforce in 2021—has amplified these pressures, as skill mismatches and underemployment among newcomers hinder per-worker output gains, while infrastructure lags fail to accommodate demand.[107] Innovation in the GTA centers on technology and AI sectors, with the Toronto-Waterloo corridor ranking 20th globally in the 2025 startup ecosystem index, supported by 2,468 active startups and over $3.21 billion in total funding.[108][109] However, Canada's gross R&D expenditure stood at 1.79% of GDP in 2024, placing it 22nd internationally and underscoring limited business investment relative to peers.[110] While private AI investments reached $15.3 billion cumulatively from 2013 to 2024—ranking fourth worldwide—the ecosystem's global position has slipped amid headwinds like regulatory burdens and capital flight, tempering its role in offsetting broader productivity stagnation.[111] Fiscal realities in the GTA reflect mounting pressures from high public spending and debt accumulation. Toronto's 2025 operating budget totals $18.8 billion, paired with a $59.6 billion capital plan emphasizing transit and housing, yet municipal debt has surged by $2.253 billion in recent years amid infrastructure backlogs.[112][113] Provincially, Ontario's 2025-26 deficit is projected at $14.6 billion, with net debt climbing to $501.7 billion by 2027-28 and potentially $549.3 billion by 2029-30, driven by elevated interest costs and uneven revenue growth.[114][115][116] These dynamics are compounded by property tax hikes—among Canada's highest—and reliance on intergovernmental transfers, as low productivity growth constrains tax bases while demands from population inflows strain service delivery without corresponding efficiency reforms.[103]Economic Disparities and Vulnerabilities
The Greater Toronto Area (GTA) features pronounced income disparities, with the Gini coefficient for household income exceeding the national average and reflecting growing polarization between high- and low-income groups. Between 1980 and 2016, income inequality in the Toronto region rose by 27% among households and 18% among individuals, driven by a shrinking middle-income segment and concentration of low-wage jobs in suburbs like Peel and Durham regions.[117] Statistics Canada reports a median total household income of $84,000 in the Toronto CMA for 2020, but this masks variations: Peel Region's median after-tax household income reached $94,000 in 2020, a 24% increase from 2015, while Toronto's core urban areas lag due to higher concentrations of renters and recent immigrants in precarious employment.[118][119] Ethnic disparities amplify these gaps, as racialized visible minorities—comprising over 50% of the GTA population—are disproportionately in low-income neighborhoods, with median incomes for groups like South Asians and Blacks trailing those of European-origin residents by 20-30% in some analyses.[120] These inequalities foster economic vulnerabilities, particularly through housing unaffordability and shelter poverty, where households allocate over 30% of income to shelter costs, eroding savings and resilience to shocks. In the GTA, the share of households under 25 with affordable housing fell from 59% in 1991 to 37% in 2016, correlating with rising rents outpacing wage growth in service and construction sectors.[121] Toronto's poverty rate exceeds the GTHA average (around 12-15% vs. 10%), provincial (10.1%), and national (11.1%) benchmarks, with low-income persistence highest among lone-parent families and immigrants.[122] Nationally rising wealth gaps—top 20% holding 64.8% of net worth in Q1 2024—manifest locally in GTA renters' limited equity accumulation, heightening exposure to interest rate hikes and job loss.[123] Fiscal and structural vulnerabilities stem from over-reliance on immigration-fueled growth, which accounts for most GTA population increases but burdens infrastructure without proportional private investment. Immigrants, settling primarily in the GTA, carry higher mortgage debt burdens than native-born residents, exacerbating household leverage amid stagnant business investment outside housing.[124][125] Provincial projections indicate that international migration drives 80-90% of Ontario's growth through 2046, yet lags in housing supply (deficits of 1-2 million units by 2030) and transit capacity risk amplifying precarity if economic slowdowns reduce remittances or low-skill job availability.[51] This dynamic, coupled with polarized employment in volatile sectors like retail and gig work, leaves the GTA susceptible to recessions, as evidenced by disproportionate job losses in suburbs during the 2020 downturn.[120]Infrastructure
Transportation Systems
The Greater Toronto Area's transportation systems encompass a mix of roadways, public transit, rail, and air infrastructure managed primarily by provincial agencies like Metrolinx and the Ontario Ministry of Transportation, alongside municipal operators such as the Toronto Transit Commission (TTC). These systems support daily commutes for over 6 million residents across the region, but face chronic congestion exacerbated by population growth and urban sprawl, with average vehicle speeds on major arterials dropping below 30 km/h during peak hours in core areas. Road transport dominates, accounting for approximately 80% of trips, while public transit serves about 20% of weekday travel in Toronto proper, though regional shares are lower due to limited service coverage in outer municipalities.[126] Highways form the backbone of inter-municipal mobility, with the 400-series network including Highway 401, which spans the GTA and handles some of North America's highest traffic volumes, exceeding 450,000 vehicles per day on sections through Mississauga and Scarborough, and peaking above 500,000 on certain days. This 18-lane stretch between Highway 410 and 403 exemplifies capacity strain, where design limits of 12-18 lanes fail to accommodate demand driven by single-occupancy vehicles, resulting in annual congestion costs estimated at billions in lost productivity. Other key routes like Highways 400, 403, and 407 (a tolled expressway) connect radial suburbs to downtown, but electronic tolling on 407 has shifted some traffic to parallel freeways, intensifying bottlenecks. Provincial data from automatic traffic recorders confirm these volumes, underscoring the need for expansions like high-occupancy toll (HOT) lanes proposed in recent plans.[127][128] Public transit relies on the TTC for local services in Toronto, operating four subway lines, 11 streetcar routes, and over 140 bus routes, which carried 204 million bus trips, 181 million subway rides, and 35 million streetcar boardings in 2024, totaling roughly 420 million passenger trips amid post-pandemic recovery. Regional services under Metrolinx, including GO Transit commuter rail and buses, recorded 71.8 million riders across GO Rail, GO Bus, and UP Express in the 2024-25 fiscal year, with rail emphasizing peak-hour corridors to Union Station, handling over 90% of its Toronto-bound traffic. The PRESTO fare card integrates payments across operators, but service gaps in low-density suburbs limit mode shift from cars, as evidenced by GO's average load factors remaining below 40% outside rush periods. Ongoing projects like the Ontario Line subway aim to add 388,000 daily boardings by alleviating subway overcrowding, though delays tied to labor and supply issues have pushed full operations beyond 2030.[129][130][131] Air transport centers on Toronto Pearson International Airport in Mississauga, Canada's busiest facility, which processed 46.8 million passengers in 2024, a 4.4% increase from 2023, driven by international arrivals comprising over 60% of volume. The airport features three terminals and extensive cargo operations, connected via UP Express rail (part of Metrolinx) offering 25-minute trips to downtown for 6 million annual riders. Billy Bishop Airport on Toronto Islands supplements with 2.8 million passengers yearly, focused on short-haul flights, while Region of Waterloo International serves outer GTA fringes. These hubs facilitate global connectivity but contribute to surface congestion, with Pearson's access roads routinely gridlocked during peak travel seasons.[132] Active transportation infrastructure, including over 1,200 km of cycling paths and multi-use trails in Toronto alone, supports growing but marginal usage, with bicycle trips comprising less than 2% of commutes region-wide due to incomplete networks and seasonal weather barriers. Pedestrian facilities emphasize sidewalks in dense urban cores, yet suburban arterials often prioritize vehicle flow, leading to higher injury rates for non-motorized users in data from provincial collision reports. Investments like protected cycle tracks on major streets aim to boost safety and uptake, but empirical studies show limited impact without denser land-use integration.[133]Utilities, Housing Stock, and Digital Connectivity
Electricity distribution in the Greater Toronto Area (GTA) is managed by multiple local distribution companies, with Toronto Hydro serving approximately 790,000 customers within the City of Toronto, while Hydro One and Alectra Utilities cover surrounding municipalities like Mississauga and Brampton.[134][135] In 2024, Toronto Hydro reported 34 power incidents, yielding a ratio of 1.161 incidents per 1,000 customers, reflecting ongoing investments in grid reliability amid urban density pressures.[136] Natural gas is primarily supplied by Enbridge Gas across the region, supporting heating and industrial needs for millions of residents.[137] Water services fall under municipal authorities, such as Toronto Water, which maintains one of North America's largest systems with rigorous sampling and testing to ensure compliance with quality standards, drawing primarily from Lake Ontario.[138][139] The GTA's housing stock comprises a mix of single-detached homes, low-rise structures, and high-rise apartments, with purpose-built rentals accounting for about one-seventh of total units as of 2025.[140] Much of the existing stock dates from pre-1980s construction booms, contributing to maintenance challenges and lower energy efficiency in older suburbs, while recent condo developments dominate urban cores but have slowed amid high construction costs.[141] The gap between population growth and new housing completions reached its widest in over 50 years by 2024, exacerbating shortages as annual starts in Toronto declined 40% in early 2025 compared to prior years.[142][143] Affordability has deteriorated, with median home prices projected to average around $1.1 million in the GTA for 2025, driven by rapid population influx—largely from immigration—outstripping supply constrained by zoning restrictions, development fees adding $43,000 to $90,000 per unit, and lengthy permitting delays.[144][145][146] Digital connectivity in the GTA benefits from widespread fiber-optic and cable infrastructure, with major providers including Bell, Rogers, and independents like VMedia and telMAX offering plans up to 1.5 Gbps download speeds.[147][148] As of 2024, 74% of Toronto residents access high-speed internet exceeding 50 Mbps, though disparities persist by income, with lower adoption in underserved neighborhoods.[149] Mobile 5G coverage has expanded via shared networks from Bell and TELUS, enhancing urban connectivity, while federal initiatives aim for 98% high-speed broadband penetration nationwide by 2026.[150][151] telMAX leads in measured speeds within the GTA, underscoring competitive alternatives to incumbents amid growing demand from remote work and data-intensive applications.[152]Government and Politics
Multi-Level Governance Structure
The governance of the Greater Toronto Area (GTA) reflects Canada's federal system, with authority layered across federal, provincial, regional, and local levels, though no single entity holds overarching control for the entire region. The federal Government of Canada influences the GTA through funding for national infrastructure projects, such as highways under federal-provincial agreements, and policies on immigration that shape population growth, but direct municipal oversight resides with the province, as local governments derive powers from provincial statutes rather than the Constitution.[153][154] The Province of Ontario maintains primary authority over GTA municipalities via the Municipal Act, 2001, which outlines powers for services like planning, public health, and utilities, while providing conditional grants that constitute a significant portion of local budgets.[155] Ontario established the GTA's four regional municipalities in the 1970s—York Region in 1971, and Durham, Halton, and Peel in 1974—to address cross-jurisdictional needs such as water supply and regional transportation, with each regional council comprising elected officials from constituent lower-tier municipalities.[156] In response to coordination gaps, the province created Metrolinx in 2006 as a crown corporation under the Metrolinx Act, tasked with integrating transit services across the GTA and Hamilton Area, including operation of GO Transit commuter rail and buses serving over 11 million annual riders as of 2023.[157] To expedite housing and infrastructure priorities, Ontario enacted Bill 3 in November 2022, granting "strong mayor" powers to the mayors of Toronto and Ottawa, including veto rights over conflicting bylaws and authority to appoint department heads, powers later proposed for extension to 169 additional municipalities including GTA ones effective May 2025.[158][159] The City of Toronto functions as a single-tier municipality, amalgamated in 1998 from the former City of Toronto and five boroughs under provincial legislation to consolidate services for its 2.8 million residents, governed by a mayor elected at-large and 25 councillors representing wards established in 2018.[160] Surrounding the core city, the two-tier regional structure prevails: upper-tier regional councils manage area-wide functions like sewage treatment and growth management, while lower-tier municipalities—such as Mississauga and Brampton in Peel Region—handle localized responsibilities including zoning enforcement and recreational facilities.[161] This division enables tailored service delivery but relies on provincial intervention for region-spanning issues, as the GTA lacks a dedicated metropolitan authority akin to those in other jurisdictions.[162]Electoral Patterns and Policy Debates
In federal elections, the Greater Toronto Area has historically favored the Liberal Party, particularly within Toronto's urban core (area code 416), where all 25 ridings returned Liberal MPs in the 2021 election, reflecting strong support for progressive policies on social services and multiculturalism.[163] However, suburban ridings in the 905 belt—encompassing Peel, York, and Durham regions—showed greater volatility, with Conservatives securing six seats amid rising concerns over economic pressures and taxation.[164] This pattern intensified in the April 2025 federal election, where Liberals maintained dominance in Toronto but lost several 905 seats to Conservatives, driven by voter frustration with inflation, housing affordability, and perceived federal mismanagement of immigration levels straining local infrastructure.[165] [166] The shift underscores causal links between suburban demographics—often including working-class immigrants and families prioritizing fiscal restraint—and support for Conservative platforms emphasizing reduced spending and deregulation.[167] Provincially, the 2022 Ontario election saw Progressive Conservatives under Doug Ford capture a majority of GTA seats, winning 24 out of approximately 30 ridings, including sweeps in the 905 suburbs where they polled over 50% in many areas, compared to narrower margins in Toronto proper.[168] This outcome reflected suburban priorities for infrastructure investment and lower development charges over urban-focused social programs. The February 2025 provincial election reinforced this, with PCs securing a third consecutive majority, retaining most GTA seats despite scandals, as voters credited Ford's handling of economic recovery post-pandemic.[169] NDP and Liberal support remained confined largely to downtown Toronto ridings, highlighting persistent divides between core-city progressivism and suburban pragmatism on issues like auto insurance rates and highway expansions.[170] Municipal elections reveal fragmentation across GTA municipalities. In Toronto's 2022 vote, incumbent mayor John Tory won re-election with 342,158 votes (63.9% of the popular vote), defeating challengers amid debates on property taxes and homelessness.[171] Suburban cities elected centrist or conservative-leaning mayors: Bonnie Crombie in Mississauga and Patrick Brown in Brampton, both incumbents who emphasized business-friendly policies and transit integration.[172] Council races often turned on local issues like zoning variances, with progressive gains in Toronto wards but conservative holds in outer areas, illustrating how municipal politics amplifies hyper-local concerns over provincial or federal ideologies. Key policy debates in GTA politics revolve around housing supply, where provincial initiatives like Bill 23 (2022) aimed to accelerate development by cutting red tape and minimum density targets near transit stations, yet faced backlash for inflating construction costs without proportional supply gains.[173] The 2023 Greenbelt controversy exemplified tensions, as the Ford government initially removed 7,400 acres of protected farmland for housing—benefiting developers with ties to party insiders—before reversing under public and Integrity Commissioner scrutiny, highlighting risks of politically motivated land swaps over evidence-based planning.[174] Transit funding disputes persist, with municipalities criticizing provincial delays in GO Transit expansions and federal underinvestment relative to ridership growth, exacerbating congestion costs estimated at $10 billion annually.[175] Immigration policy draws contention, as federal targets adding over 500,000 annual newcomers disproportionately burden GTA infrastructure, fueling suburban debates on service wait times and school overcrowding without matching federal funding—evident in 905 voter shifts toward parties advocating intake caps.[176] Property tax hikes, averaging 5-8% in Toronto from 2023-2025, intersect with these, pitting urban demands for social spending against suburban calls for restraint amid stagnant wages.[177]| Election Level | Year | Liberal/Left Wins (Core) | Conservative/Right Wins (Suburbs) | Key Driver |
|---|---|---|---|---|
| Federal | 2021 | 25/25 Toronto ridings | 6 GTA suburban seats | Urban multiculturalism vs. suburban economics[163] |
| Federal | 2025 | Toronto dominance retained | Flips in key 905 ridings | Housing/inflation backlash[165] |
| Provincial | 2022 | Few Toronto seats | 24/30 GTA seats | Infrastructure priorities[168] |
| Municipal | 2022 | Progressive council gains | Centrist mayors in suburbs | Local zoning/taxes[172] |