Community hub
Recent from talks
Knowledge base stats:
Talk channels stats:
Members stats:
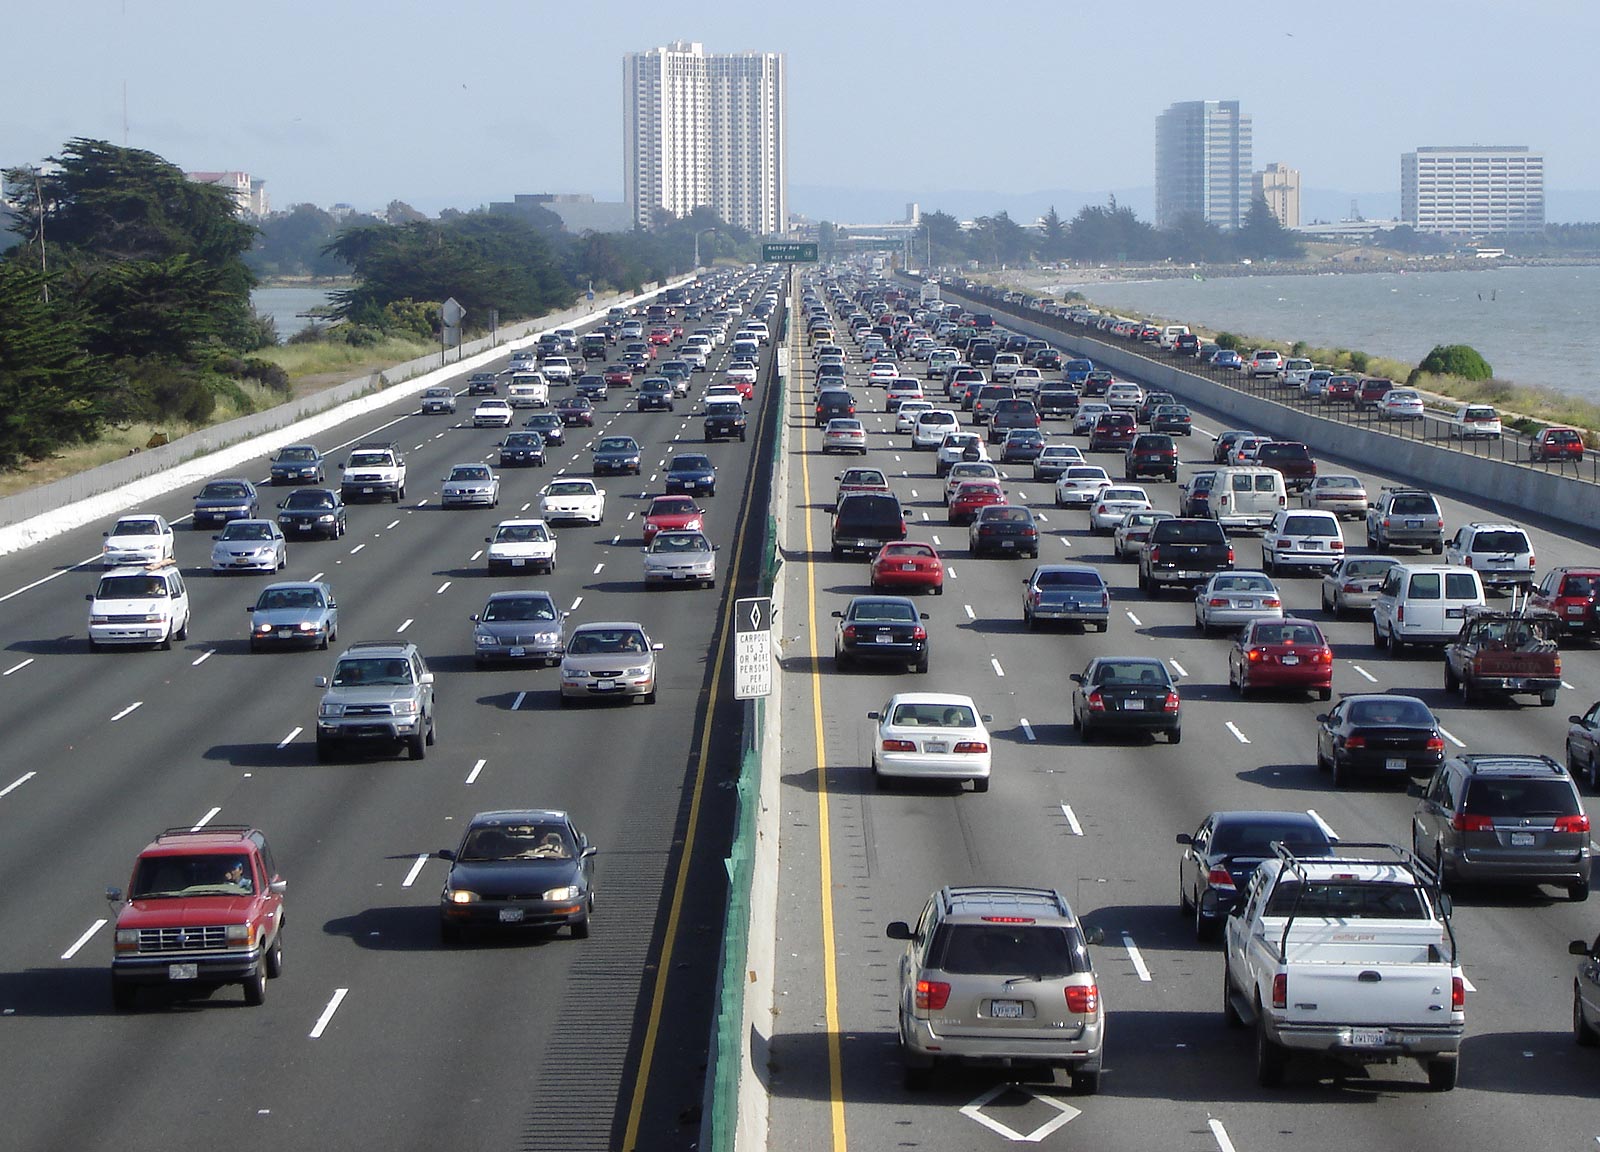
Motor vehicle
A motor vehicle, also known as a motorized vehicle, automotive vehicle, automobile, or road vehicle, is a self-propelled land vehicle, commonly wheeled, that can operate on rails (such as trains or trams), does not fly (such as airplanes or helicopters), does not float on water (such as boats or ships), and is used for the transportation of people or cargo.
The vehicle propulsion is provided by an engine or motor, usually a gasoline/diesel internal combustion engine or an electric traction motor, or some combination of the two as in hybrid electric vehicles and plug-in hybrid vehicles. For legal purpose, motor vehicles are often identified within a number of vehicle classes including cars, buses, motorcycles, off-road vehicles, light trucks, medium trucks and heavy trucks. These classifications vary according to the legal codes of each country. ISO 3833:1977 is the standard for road vehicle types, terms and definitions. Typically, to avoid requiring people with disabilities from having to possess an operator's license to use one, or requiring tags and insurance, powered wheelchairs will be specifically excluded by law from being considered motor vehicles.
As of 2011[update], there were more than one billion motor vehicles in use in the world, excluding off-road vehicles and heavy construction equipment. The US publisher Ward's estimates that as of 2019, there were 1.4 billion motor vehicles in use in the world.
Global vehicle ownership per capita in 2010 was 148 vehicles in operation (VIO) per 1000 people. China has the largest motor vehicle fleet in the world, with 322 million motor vehicles registered at the end of September 2018. The United States has the highest vehicle ownership per capita in the world, with 832 vehicles in operation per 1000 people in 2016. Also, China became the world's largest new car market in 2009. In 2022, a total of 85 million cars and commercial vehicles were built, led by China which built a total of 27 million motor vehicles.
In 1968 the Vienna Convention on Road Traffic gave one of the first international definitions of a motor vehicle:
— Vienna convention on road traffic
Other sources might provide other definitions, for instance in the year 1977, ISO 3833:1977 provide other definitions.
The U.S. publisher Ward's estimates that as of 2010, there were 1.015 billion motor vehicles in use in the world. This figure represents the number of cars, trucks (light, medium and heavy duty), and buses, but does not include off-road vehicles or heavy construction equipment. The world vehicle population passed the 500 million-unit mark in 1986, from 250 million motor vehicles in 1970. Between 1950 and 1970, the vehicle population doubled roughly every 10 years. Navigant Consulting forecasts that the global stock of light-duty motor vehicles will reach 2 billion units in 2035.
Hub AI
Motor vehicle AI simulator
(@Motor vehicle_simulator)
Motor vehicle
A motor vehicle, also known as a motorized vehicle, automotive vehicle, automobile, or road vehicle, is a self-propelled land vehicle, commonly wheeled, that can operate on rails (such as trains or trams), does not fly (such as airplanes or helicopters), does not float on water (such as boats or ships), and is used for the transportation of people or cargo.
The vehicle propulsion is provided by an engine or motor, usually a gasoline/diesel internal combustion engine or an electric traction motor, or some combination of the two as in hybrid electric vehicles and plug-in hybrid vehicles. For legal purpose, motor vehicles are often identified within a number of vehicle classes including cars, buses, motorcycles, off-road vehicles, light trucks, medium trucks and heavy trucks. These classifications vary according to the legal codes of each country. ISO 3833:1977 is the standard for road vehicle types, terms and definitions. Typically, to avoid requiring people with disabilities from having to possess an operator's license to use one, or requiring tags and insurance, powered wheelchairs will be specifically excluded by law from being considered motor vehicles.
As of 2011[update], there were more than one billion motor vehicles in use in the world, excluding off-road vehicles and heavy construction equipment. The US publisher Ward's estimates that as of 2019, there were 1.4 billion motor vehicles in use in the world.
Global vehicle ownership per capita in 2010 was 148 vehicles in operation (VIO) per 1000 people. China has the largest motor vehicle fleet in the world, with 322 million motor vehicles registered at the end of September 2018. The United States has the highest vehicle ownership per capita in the world, with 832 vehicles in operation per 1000 people in 2016. Also, China became the world's largest new car market in 2009. In 2022, a total of 85 million cars and commercial vehicles were built, led by China which built a total of 27 million motor vehicles.
In 1968 the Vienna Convention on Road Traffic gave one of the first international definitions of a motor vehicle:
— Vienna convention on road traffic
Other sources might provide other definitions, for instance in the year 1977, ISO 3833:1977 provide other definitions.
The U.S. publisher Ward's estimates that as of 2010, there were 1.015 billion motor vehicles in use in the world. This figure represents the number of cars, trucks (light, medium and heavy duty), and buses, but does not include off-road vehicles or heavy construction equipment. The world vehicle population passed the 500 million-unit mark in 1986, from 250 million motor vehicles in 1970. Between 1950 and 1970, the vehicle population doubled roughly every 10 years. Navigant Consulting forecasts that the global stock of light-duty motor vehicles will reach 2 billion units in 2035.