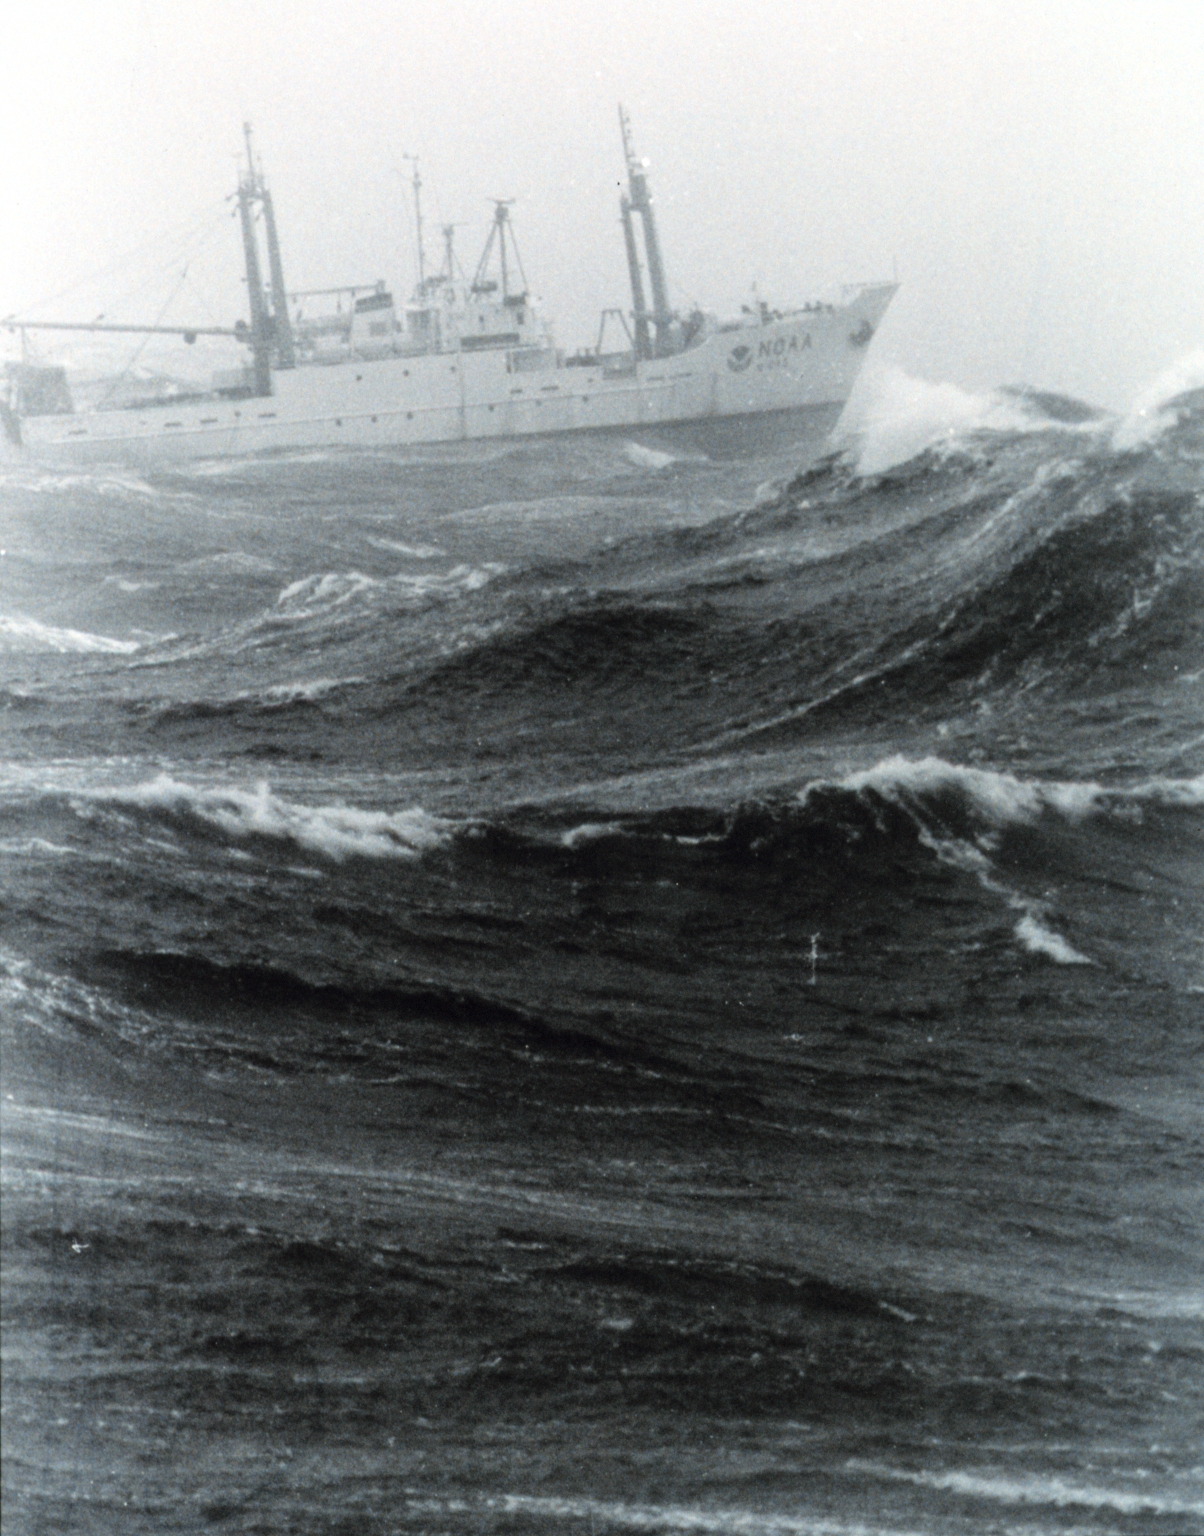

Sea state
View on Wikipedia
.jpg)
In oceanography, sea state is the general condition of the free surface on a large body of water—with respect to wind waves and swell—at a certain location and moment. A sea state is characterized by statistics, including the wave height, period, and spectrum. The sea state varies with time, as the wind and swell conditions change. The sea state can be assessed either by an experienced observer (like a trained mariner) or by using instruments like weather buoys, wave radar, or Earth observation satellites.[1]
The short-term statistics describing the sea state are determined for a time interval in which the sea state is considered to be constant. This duration has to be much longer than the individual wave period, but shorter than the period in which the wind and swell conditions can be expected to vary significantly. Typically, the sea state is assumed to be constant for 15-30 minutes.[1]
The large number of variables involved in creating and describing the sea state cannot be quickly and easily summarized, so simpler scales are used to give an approximate but concise description of conditions for reporting in a ship's log or similar record.[citation needed]
WMO sea state code
[edit]
The World Meteorological Organization (WMO) sea state code largely adopts the 'wind sea' definition of the Douglas Sea Scale.[citation needed] The direction from which the swell is coming should be recorded.[citation needed]

| WMO Sea State Code | Wave height | Characteristics |
|---|---|---|
| 0 | 0 metres (0 ft) | Calm (glassy) |
| 1 | 0 to 0.1 metres (0.0 to 3.9 in) | Calm (rippled) |
| 2 | 0.1 to 0.5 metres (3.9 in to 1 ft 7.7 in) | Smooth (wavelets) |
| 3 | 0.5 to 1.25 metres (1 ft 8 in to 4 ft 1 in) | Slight |
| 4 | 1.25 to 2.5 metres (4 ft 1 in to 8 ft 2 in) | Moderate |
| 5 | 2.5 to 4 metres (8 ft 2 in to 13 ft 1 in) | Rough |
| 6 | 4 to 6 metres (13 to 20 ft) | Very rough |
| 7 | 6 to 9 metres (20 to 30 ft) | High |
| 8 | 9 to 14 metres (30 to 46 ft) | Very high |
| 9 | Over 14 metres (46 ft) | Phenomenal |
| 0. None | |
| Low | 1. Short or average 2. Long |
| Moderate | 3. Short 4. Average 5. Long |
| High | 6. Short 7. Average 8. Long |
| 9. Confused |
Sea states in marine engineering
[edit]In engineering applications, sea states are often characterized by the following two parameters:
- The significant wave height H1/3 — the mean wave height of the highest third of the waves.[2]
- The mean wave period, T1.
In addition to the short-term wave statistics presented above, long-term sea state statistics are often given as a joint frequency table of the significant wave height and the mean wave period. From the long and short-term statistical distributions, it is possible to find the extreme values expected over a given number of years by fitting an extreme value distribution.[3] The extreme value distribution can then inform an engineer about the most extreme significant wave height to be expected during a lifetime of a ship or offshore structure. Using the response amplitude operators of the ship, the engineer can then use the extremes in significant wave height and wave period to calculate the most extreme loads that the ship should be able to withstand. Withstanding significant wave heights that happen on average once in 100 years or once in 1000 years is a common demand for design of ships and offshore structures.[4]
CCI Sea State
[edit]The "Sea State" project within the ESA's Climate Change Initiative (CCI) program created an 18-year data set (2002–2020) covering various sea state-related Essential Climate Variables as measured by the Jason satellite series, other ocean-focused Earth observation satellites, and in situ sources.[5][6][7][8] In 2025, data from CCI Sea State, combined with the new SWOT satellite measurements, were used to describe a new record wave height of nearly 20 m in the open ocean.[9][10]
See also
[edit]Citations
[edit]- ^ a b Holthuijsen, Leo H. (2007). Waves in oceanic and coastal waters. Cambridge: Cambridge University Press. ISBN 978-0-511-27021-5.
- ^ Munk, W.H. (1944). Proposed uniform procedure for observing waves and interpreting instrument records. La Jolla, California: Wave Project at the Scripps Institution of Oceanography.
- ^ Aarnes, Ole Johan; Breivik, Øyvind; Reistad, Magnar (2012). "Wave Extremes in the Northeast Atlantic". Journal of Climate. 25 (5): 1529–1543. doi:10.1175/JCLI-D-11-00132.1. hdl:1956/9253. ISSN 0894-8755.
- ^ Jonathan, Philip; Ewans, Kevin (2013). "Statistical modelling of extreme ocean environments for marine design: A review". Ocean Engineering. 62: 91–109. doi:10.1016/j.oceaneng.2013.01.004.
- ^ "Sea State". ESA Climate Office. Retrieved 2025-10-11.
- ^ "CCI Sea State". Laboratory for Ocean Physics and Satellite remote sensing. Retrieved 2025-10-11.
- ^ Laboratory, Plymouth Marine. "Sea State CCI". Plymouth Marine Laboratory. Retrieved 2025-10-11.
- ^ "CCI+ Sea State". www.dlr.de. Retrieved 2025-10-11.
- ^ "Satellites reveal the power of ocean swell". www.esa.int. Retrieved 2025-10-11.
- ^ Ardhuin, Fabrice; Postec, Taina; Accensi, Mickael; Piolle, Jean-François; Dodet, Guillaume; Passaro, Marcello; De Carlo, Marine; Husson, Romain; Guitton, Gilles; Collard, Fabrice (2025-09-23). "Sizing the largest ocean waves using the SWOT mission". Proceedings of the National Academy of Sciences. 122 (38) e2513381122. doi:10.1073/pnas.2513381122. PMC 12478040. PMID 40956893.
General and cited references
[edit]- Bowditch, Nathaniel (1938), American Practical Navigator, H.O. publication No. 9 (revised ed.), United States Hydrographic Office, OCLC 31033357
- Faltinsen, O. M. (1990), Sea Loads on Ships and Offshore Structures, [Cambridge University Press], ISBN 0-521-45870-6


Sea state
View on GrokipediaFundamentals
Definition
Sea state refers to the general condition of the free surface on a large body of water, such as an ocean or sea, with respect to wind waves and swell at a given location and time.[3] This condition is characterized by statistical properties of the waves, including their height, period, and directional spectrum, which reflect the dynamic interaction between wind forcing and ocean response.[6] A key distinction within sea state is between wind sea and swell. Wind sea comprises waves generated locally by the prevailing wind at or near the observation site, typically featuring shorter periods and irregular forms aligned with the wind direction.[3] In contrast, swell consists of longer-period waves that have traveled far from their distant generation areas, often exhibiting more regular, parallel crests and reduced dependence on local winds.[3][6] For practical reporting, sea state is assumed to remain relatively constant over short temporal intervals, such as 15 to 30 minutes, allowing observers to capture a representative snapshot amid ongoing variability.[6] The term "sea state" has historical roots in maritime traditions, where sailors systematically logged surface conditions in ship journals since at least the mid-19th century to assess navigation risks and weather patterns.[6] Quantitative parameters like significant wave height and dominant period provide essential context for describing these conditions.[3]Key Parameters
The significant wave height, denoted as $ H_s $, serves as a primary indicator of sea roughness and is defined as the average height of the highest one-third of waves in a given sea state, often visually estimated by trained observers as the mean wave height over a 10- to 20-minute period.[7][8] This parameter approximates the maximum expected wave height under Rayleigh-distributed wave heights and is calculated from the wave spectrum as $ H_s \approx 4 \sqrt{m_0} $, where $ m_0 $ is the zeroth spectral moment representing the total variance of the sea surface elevation.[7][9] Spectral moments, such as $ m_0 = \int_0^\infty S(f) , df $ where $ S(f) $ is the one-dimensional frequency spectrum, quantify the distribution of wave energy and provide a statistical foundation for deriving other parameters like wave variance.[7][8] Wave period $ T $, the time interval between successive wave crests, characterizes the temporal aspect of sea state and includes subtypes such as the peak period $ T_p $, which corresponds to the dominant frequency of maximum energy in the wave spectrum, and the mean period $ T_m $, averaged over all waves in a record.[7][8] For instance, $ T_p = 1 / f_p $ where $ f_p $ is the peak frequency, typically ranging from 5 to 20 seconds in open ocean conditions depending on wind fetch and duration.[8] These periods influence wave speed and energy propagation, with longer periods indicating swell-dominated states versus shorter periods in developing wind seas.[7] The wave spectrum describes the distribution of wave energy across frequencies and directions, providing a comprehensive view of sea state complexity through the two-dimensional energy density function $ E(f, \theta) $, where $ f $ is frequency and $ \theta $ is direction.[8][9] Directional spreading, a key spectral feature, quantifies how wave energy is dispersed around the mean direction, often modeled with functions like $ \cos^{2s}(\theta - \theta_m) $ where $ s $ controls the spread (narrow for swell, broader for wind seas).[8] This spreading affects wave interference and is derived from higher-order spectral moments.[7] Additional metrics include the mean wave direction $ \theta_m $, the average propagation angle of wave energy computed as $ \theta_m = \atan2\left( \int \sin \theta , E(f, \theta) , df , d\theta, \int \cos \theta , E(f, \theta) , df , d\theta \right) $, which indicates the principal approach of waves.[9][8] Wave steepness, expressed as $ H_s / L $ where $ L $ is the wavelength (approximately $ L = g T^2 / (2\pi) $ for deep water), measures the ratio of height to length and signals potential for wave breaking when exceeding about 1/7.[7][8] Spectral width $ \epsilon $, defined as $ \epsilon = \sqrt{1 - (m_2^2 / (m_0 m_4))} $ using moments $ m_2 $ and $ m_4 $, assesses the bandwidth of frequencies present, with values near 0 for monochromatic-like swell and approaching 1 for irregular wind-driven seas.[8] These parameters, including $ H_s $, are integral to systems like the WMO Sea State Code for standardized reporting.[8]Classification Systems
Douglas Sea State Scale
The Douglas Sea State Scale, also known as the international sea and swell scale, was devised in 1917 by English Admiral H. P. Douglas while serving as head of the British Meteorological Navy Service, and it was introduced more formally in 1921.[10] This visual classification system was developed for maritime observers on ships to estimate sea roughness based on wave height and general appearance, primarily targeting wind-generated waves (wind sea) rather than swell.[11] It provides a standardized way to report conditions without instruments, aiding navigation and weather logging in the early 20th century. The scale ranges from 0 to 9, with each grade assigned descriptive terms, approximate average wave heights (significant wave height, defined as the average of the highest one-third of waves), and correlations to the Beaufort wind force scale for associated wind speeds.[12] For instance, lower grades align with calm to light winds (Beaufort 0–3), while higher grades correspond to strong gales (Beaufort 8+) and beyond.[4] The scale separates wind sea from swell, with swell assessed independently using similar degrees but focusing on wave length (short <100 m, average 100–200 m, long >200 m) and height categories (low <2 m, moderate 2–4 m, high >4 m).[11]| Sea State | Description | Average Wave Height (m) | Typical Beaufort Correlation |
|---|---|---|---|
| 0 | Calm (glassy) | 0 | 0 (Calm) |
| 1 | Calm (rippled) | 0–0.10 | 0–1 (Light air) |
| 2 | Smooth (wavelets) | 0.10–0.50 | 1–2 (Light breeze) |
| 3 | Slight | 0.50–1.25 | 3–4 (Gentle–moderate breeze) |
| 4 | Moderate | 1.25–2.50 | 5 (Fresh breeze) |
| 5 | Rough | 2.50–4.00 | 6 (Strong breeze) |
| 6 | Very rough | 4.00–6.00 | 7 (Near gale) |
| 7 | High | 6.00–9.00 | 8 (Gale) |
| 8 | Very high | 9.00–14.00 | 9–10 (Strong–storm) |
| 9 | Phenomenal | >14.00 | 11+ (Violent storm–hurricane) |
WMO Sea State Code
The World Meteorological Organization (WMO) Sea State Code provides a standardized numerical system for describing and reporting sea conditions, primarily focusing on wind-generated waves known as "sea," while incorporating separate observations for swell. Adopted by the WMO in 1970, it builds on the Douglas Sea Scale for the wind sea component and extends reporting to include swell characteristics for more comprehensive global marine weather assessments.[14][15] The core of the code consists of values from 0 to 9, each corresponding to specific wave height ranges and qualitative descriptors for the significant wave height of wind sea in open water conditions. These codes prioritize descriptive terms but use height guidelines to aid observers in accounting for factors like local wind and currents. The WMO code is based on the foundational Douglas Sea State Scale for these wind sea elements.[16][15]| Code | Descriptive Terms | Height (meters) |
|---|---|---|
| 0 | Calm (glassy) | 0 |
| 1 | Calm (rippled) | 0–0.1 |
| 2 | Smooth (wavelets) | 0.1–0.5 |
| 3 | Slight | 0.5–1.25 |
| 4 | Moderate | 1.25–2.5 |
| 5 | Rough | 2.5–4 |
| 6 | Very rough | 4–6 |
| 7 | High | 6–9 |
| 8 | Very high | 9–14 |
| 9 | Phenomenal | >14 |