Community hub
Dew point
View on Wikipedia| Humidity and hygrometry |
|---|
 |
| Specific concepts |
| General concepts |
| Measures and instruments |
The dew point is the temperature the air is cooled to at constant pressure in order to produce a relative humidity of 100%.[1] This temperature is a thermodynamic property that depends on the pressure and water content of the air. When the air at a temperature above the dew point is cooled, its moisture capacity is reduced and airborne water vapor will condense to form liquid water known as dew.[2] When this occurs through the air's contact with a colder surface, dew will form on that surface.[3]
The dew point is affected by the air's humidity. The more moisture the air contains, the higher its dew point.[4]
When the temperature is below the freezing point of water, the dew point is called the frost point, as frost is formed via deposition rather than condensation.[5] In liquids, the analog to the dew point is the cloud point.
Humidity
[edit]If all the other factors influencing humidity remain constant, at ground level the relative humidity rises as the temperature falls; this is because the air's capacity to hold water vapor decreases, and less vapor is needed to saturate the air. The dew point temperature equals the air temperature when the air is saturated with water; in all other cases the dew point will be less than the air temperature.[6]: 129
In technical terms, the dew point is the temperature at which the water vapor in a sample of air at constant barometric pressure condenses into liquid water at the same rate at which it evaporates.[7] At temperatures below the dew point, the rate of condensation will be greater than that of evaporation, forming more liquid water. The condensed water is called dew when it forms on a solid surface, or frost if it freezes. In the air, the condensed water is called either fog or a cloud, depending on its altitude when it forms. If the temperature is below the dew point, and no dew or fog forms, the vapor is called supersaturated. This can happen if there are not enough particles in the air to act as condensation nuclei.[8]
The dew point depends on how much water vapor the air contains. If the air is very dry and has few water molecules, the dew point is low and surfaces must be much cooler than the air for condensation to occur. If the air is very humid and contains many water molecules, the dew point is high and condensation can occur on surfaces that are only a few degrees cooler than the air.[9]
A high relative humidity implies that the dew point is close to the current air temperature. A relative humidity of 100% indicates the dew point is equal to the current temperature and that the air is maximally saturated with water. When the moisture content remains constant and temperature increases, relative humidity decreases, but the dew point remains constant.[10]
General aviation pilots use dew point data to calculate the likelihood of carburetor icing and fog, and to estimate the height of a cumuliform cloud base.
Increasing the barometric pressure raises the dew point.[11] This means that, if the pressure increases, the mass of water vapor per volume unit of air must be reduced in order to maintain the same dew point. For example, consider New York City (10 m or 33 ft elevation) and Denver (1610 m or 5280 ft elevation[12]). Because Denver is at a higher elevation than New York, it will tend to have a lower barometric pressure. This means that if the dew point and temperature in both cities are the same, the amount of water vapor in the air will be greater in Denver.
Relationship to human comfort
[edit]When the air temperature is high, the human body uses the evaporation of perspiration to cool down, with the cooling effect directly related to how fast the perspiration evaporates. The rate at which perspiration can evaporate depends on how much moisture is in the air and how much moisture the air can hold. If the air is already saturated with moisture (humid), perspiration will not evaporate. The body's thermoregulation will produce perspiration in an effort to keep the body at its normal temperature even when the rate at which it is producing sweat exceeds the evaporation rate, so one can become coated with sweat on humid days even without generating additional body heat (such as by exercising).
As the air surrounding one's body is warmed by body heat, it will rise and be replaced with other air. If air is moved away from one's body with a natural breeze or a fan, sweat will evaporate faster, making perspiration more effective at cooling the body, thereby increasing comfort. By contrast, comfort decreases as unevaporated perspiration increases.
A wet bulb thermometer also uses evaporative cooling, so it provides a good measure for use in evaluating comfort level.
Discomfort also exists when the dew point is very low (below around −5 °C or 23 °F).[citation needed] The drier air can cause skin to crack and become irritated more easily. It will also dry out the airways. The US Occupational Safety and Health Administration recommends indoor air be maintained at 20–24.5 °C (68–76 °F) with a 20–60% relative humidity,[13] equivalent to a dew point of approximately 4.0 to 16.5 °C (39 to 62 °F) (by Simple Rule calculation below).
Lower dew points, less than 10 °C (50 °F), correlate with lower ambient temperatures and cause the body to require less cooling. A lower dew point can go along with a high temperature only at extremely low relative humidity, allowing for relatively effective cooling.
People inhabiting tropical and subtropical climates acclimatize somewhat to higher dew points. Thus, a resident of Singapore or Miami, for example, might have a higher threshold for discomfort than a resident of a temperate climate like London or Chicago. People accustomed to temperate climates often begin to feel uncomfortable when the dew point gets above 15 °C (59 °F), while others might find dew points up to 18 °C (64 °F) comfortable. Most inhabitants of temperate areas will consider dew points above 21 °C (70 °F) oppressive and tropical-like, while inhabitants of hot and humid areas may not find this uncomfortable. Thermal comfort depends not just on physical environmental factors, but also on psychological factors.[14]
Altitude and clouds
[edit]A rising air mass in the atmosphere will cool as the pressure reduces: its temperature will move closer to the dew point temperature. The relative humidity of this air increases as the pressure drops with the same amount of water vapor. This combination causes the dew point temperature to fall 0.2 °C per 100 m or 4.5 °F per 1000 ft. At the elevation where the dew point is reached condensation begins, creating clouds, or fog as it is called at low altitudes. Cumulus clouds tend to have flat bottoms marking the altitude where the temperature crosses the dew point. The condensation of water vapor into water droplets releases 600 calories of energy per gram of water, heating the surrounding air.[15]: 292
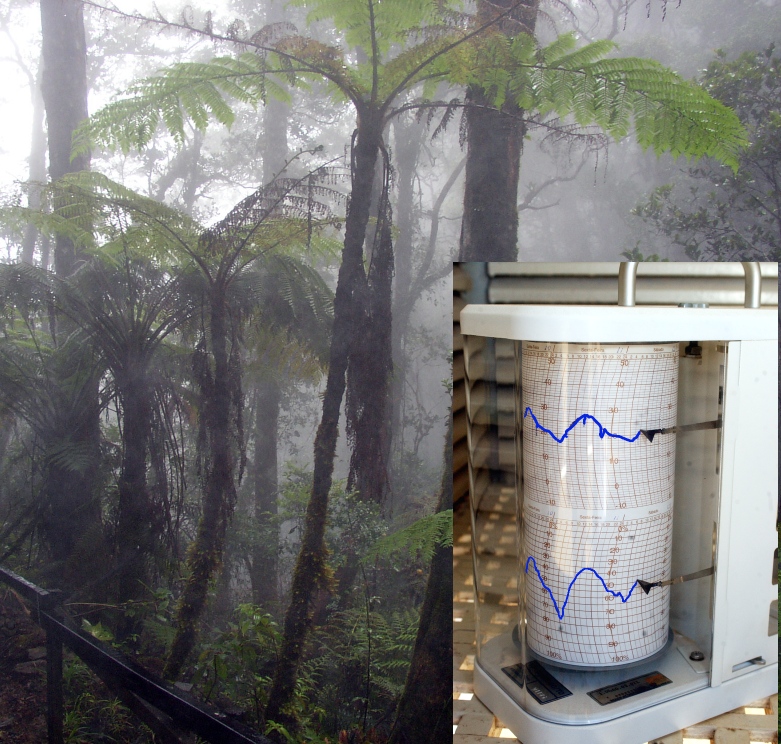
Measurement
[edit]Devices called hygrometers are used to measure dew point over a wide range of temperatures. These devices consist of a polished metal mirror which is cooled as air is passed over it. The dew point is revealed by observing the loss of clarity in the reflection cast by the mirror. Manual devices of this sort can be used to calibrate other types of humidity sensors, and automatic sensors may be used in a control loop with a humidifier or dehumidifier to control the dew point of the air in a building or in a smaller space for a manufacturing process.
| Dew point | Relative humidity at 32 °C (90 °F) | |
|---|---|---|
| Over 27 °C | Over 80 °F | 73% and higher |
| 24–26 °C | 75–79 °F | 62–72% |
| 21–24 °C | 70–74 °F | 52–61% |
| 18–21 °C | 65–69 °F | 44–51% |
| 16–18 °C | 60–64 °F | 37–43% |
| 13–16 °C | 55–59 °F | 31–36% |
| 10–12 °C | 50–54 °F | 26–30% |
| Under 10 °C | Under 50 °F | 25% and lower |
Calculating the dew point
[edit]
A well-known empirical approximation used to calculate the dew point, Tdry, given just the actual ("dry bulb") air temperature, T (in degrees Celsius) and relative humidity (in percent), RH, is the Magnus formula: where b = 17.625 and c = 243.04 °C.[16] The values of b and c were selected by minimizing the maximum deviation over the range −40 °C to +50 °C.
![{\displaystyle {\begin{aligned}\gamma (T,\mathrm {RH} )&=\ln \left({\frac {\mathrm {RH} }{\ 100\ }}\right)+{\frac {b\ T}{\ c\ +\ T\ }}\ ;\\[8pt]T_{\mathsf {dry}}&={\frac {\ c\ \gamma (T,\mathrm {RH} )\ }{\ b\ -\ \gamma (T,\mathrm {RH} )\ }}\ ;\end{aligned}}}](https://wikimedia.org/api/rest_v1/media/math/render/svg/96a67cb61419f19f15b1ef7d0befe726a8e8fb5c)
The more complete formulation and origin of this approximation involves the interrelated saturated water vapor pressure (in units of millibars, also called hectopascals) at T, Ps( T ), and the actual vapor pressure (also in units of millibars), Pa( T ), which can be either found with RH or approximated with the barometric pressure (in millibars), BPmbar, and "wet-bulb" temperature, Twet is (unless declared otherwise, all temperatures are expressed in degrees Celsius):
![{\displaystyle {\begin{aligned}P_{\mathrm {s} }(T)&={\frac {\ 100\ }{\ \mathrm {RH} \ }}\ P_{\mathrm {a} }(T)=a\ e^{\frac {b\ T}{\ c\ +\ T\ }}\ ;\\[8pt]P_{\mathrm {a} }(T)&={\frac {\mathrm {RH} }{100}}\ P_{\mathrm {s} }(T)=a\ e^{\gamma (T,\mathrm {RH} )}\\[8pt]&\approx P_{\mathrm {s} }(T_{\mathrm {w} })-\mathrm {BP} _{\mathsf {mbar}}\ 0.00066\ \left(1+0.00115\ T_{\mathsf {wet}}\right)\left(T-T_{\mathsf {wet}}\right)\ ;\\[8pt]T_{\mathsf {dry}}&={\frac {\ c\ \ln {\frac {\ P_{\mathrm {a} }(T)\ }{a}}\ }{\ b-\ln {\frac {\ P_{\mathrm {a} }(T)\ }{a}}}}\ ;\end{aligned}}}](https://wikimedia.org/api/rest_v1/media/math/render/svg/a3d64c371bee27a5830bf1bcdde566a9e6a85911)
For greater accuracy, Ps(T) (and therefore γ( T, RH ) ) can be enhanced, using part of the Bögel modification, also known as the Arden Buck equation, which adds a fourth constant d: where
![{\displaystyle {\begin{aligned}P_{\mathrm {s,m} }(T)&=a\ e^{\left(b\ -\ {\frac {\ T\ }{d}}\right)\left({\frac {T}{\ c\ +\ T\ }}\right)}\ ;\\[8pt]\gamma _{\mathrm {m} }(T,\mathrm {RH} )&=\ln \left({\frac {\ \mathrm {RH} \ }{\ 100\ }}\ e^{\left(b\ -\ {\frac {\ T\ }{d}}\right)\left({\frac {T}{\ c\ +\ T\ }}\right)}\right)\ ;\\[8pt]T_{\mathsf {dry}}&={\frac {\ c\ \ln {\frac {\ P_{\mathrm {a} }(T)\ }{a}}\ }{\ b-\ln {\frac {\ P_{\mathrm {a} }(T)\ }{a}}\ }}={\frac {\ c\ \ln \left({\frac {\ \mathrm {RH} \ }{\ 100\ }}{\frac {\ P_{\mathrm {s,m} }(T)\ }{a}}\right)\ }{\ b\ -\ \ln \left({\frac {\ \mathrm {RH} \ }{\ 100\ }}{\frac {\ P_{\mathrm {s,m} }(T)\ }{a}}\right)\ }}={\frac {\ c\ \gamma _{m}(T,\mathrm {RH} )\ }{\ b\ -\ \gamma _{m}(T,\mathrm {RH} )\ }};\end{aligned}}}](https://wikimedia.org/api/rest_v1/media/math/render/svg/1fabcacedcec0e5b16baaad561f6f29f6a31884c)
- a = 6.1121 mbar , b = 18.678 , c = 257.14 °C , d = 234.5 °C.
There are several different constant sets in use. The ones used in NOAA's presentation[17] are taken from a 1980 paper by David Bolton in the Monthly Weather Review:[18]
- a = 6.112 mbar, b = 17.67, c = 243.5 °C.
These valuations provide a maximum error of 0.1%, for −30 °C ≤ T ≤ 35°C and 1% < RH < 100% . Also noteworthy is the Sonntag1990,[19]
- a = 6.112 mbar , b = 17.62 , c = 243.12 °C ; for −45 °C ≤ T ≤ 60 °C (error ±0.35 °C).
Another common set of values originates from the 1974 Psychrometry and Psychrometric Charts.[20]
- a = 6.105 mbar , b = 17.27 , c = 237.7 °C ; for 0 °C ≤ T ≤ 60 °C (error ±0.4 °C).
Also, in the Journal of Applied Meteorology and Climatology,[21] Arden Buck provides several different valuation sets, with different maximum errors for different temperature ranges. Two particular sets provide a range of −40 °C to +50 °C between the two, with even lower maximum error within the indicated range than all the sets above:
- a = 6.1121 mbar , b = 17.368 , c = 238.88 °C ; for 0 °C ≤ T ≤ 50 °C (error ≤ 0.05%).
- a = 6.1121 mbar , b = 17.966 , c = 247.15 °C ; for −40 °C ≤ T ≤ 0 °C (error ≤ 0.06%).
Simple approximation
[edit]There is also a simple approximation that allows conversion between the dew point, temperature, and relative humidity. This approach is accurate to within about ±1 °C as long as the relative humidity is above 50%:
![{\displaystyle {\begin{aligned}T_{\mathrm {dry} }&\approx T-{\frac {\ 100-\mathrm {RH} \ }{5}}\ ;\\[5pt]\mathrm {RH} &\approx 100-5\ (T-T_{\mathrm {dry} })\ ;\end{aligned}}}](https://wikimedia.org/api/rest_v1/media/math/render/svg/e8a24375a5b79bcc8270791a43a5d36eb0b572a3)
This can be expressed as a simple rule of thumb:
For every 1 °C difference in the dew point and dry bulb temperatures, the relative humidity decreases by 5%, starting with RH = 100% when the dew point equals the dry bulb temperature.
The derivation of this approach, a discussion of its accuracy, comparisons to other approximations, and more information on the history and applications of the dew point, can be found in an article published in the Bulletin of the American Meteorological Society.[22]
For temperatures in degrees Fahrenheit, these approximations convert to
![{\displaystyle {\begin{aligned}T_{\mathrm {dry,^{\circ }F} }&\approx T_{\mathrm {{}^{\circ }F} }-{\tfrac {\ 9\ }{25}}\ \left(100-\mathrm {RH} \right)\ ;\\[5pt]\mathrm {RH} &\approx 100-{\tfrac {25}{\ 9\ }}\ \left(T_{\mathrm {{}^{\circ }F} }-T_{\mathrm {dry,^{\circ }F} }\right)\ ;\end{aligned}}}](https://wikimedia.org/api/rest_v1/media/math/render/svg/fcd815689372ee57a34e0d7b92dbbededd7e20ed)
For example, a relative humidity of 100% means dew point is the same as air temp. For 90% RH, dew point is 3 °F lower than air temperature. For every 10 percent lower, dew point drops 3 °F.
Frost point
[edit]The frost point is similar to the dew point in that it is the temperature to which a given parcel of humid air must be cooled, at constant atmospheric pressure, for water vapor to be deposited on a surface as ice crystals without undergoing the liquid phase (compare with sublimation). The frost point for a given parcel of air is always higher than the dew point, as breaking the stronger bonding between water molecules on the surface of ice compared to the surface of (supercooled) liquid water requires a higher temperature.[23]
History
[edit]In Ancient Greece, Aristotle considered that dew fell from the sky.[24] During the Renaissance, Ferdinando II de' Medici built a hygrometer to track the temperature and wind conditions that lead to water formation.[25]
In the 18th century, Charles Le Roy attempted to determine the dew point by pouring cold water into a glass container.[25]
The first modern theory of dew was composed by William Charles Wells, who published his experiments in his 1818 Essay on Dew.[24] Meteorologist John Aitken demonstrated in 1887 that dew comes from the earth or from the plants, and does not fall from air.[24]
The highest dew point ever recorded on Earth is 35 °C (95 °F) (with a temperature of 42 °C (108 °F)), observed at Dhahran, Saudi Arabia, at 3:00 p.m. on 8 July 2003.[26][27]
See also
[edit]References
[edit]- ^ US Department of Commerce, NOAA. "Dew Point vs Humidity". www.weather.gov. Retrieved 2025-02-12.
- ^ "How To: Eliminate Window Condensation". 15 November 2021.
- ^ "Dew Point". Glossary – NOAA's National Weather Service. 25 June 2009.
- ^ John M. Wallace; Peter V. Hobbs (24 March 2006). Atmospheric Science: An Introductory Survey. Academic Press. pp. 83–. ISBN 978-0-08-049953-6.
- ^ "Frost Point". Glossary – NOAA's National Weather Service. 25 June 2009.
- ^ Spiridonov, Vlado; Ćurić, Mladjen (2021). Fundamentals of Meteorology. Cham: Springer International Publishing. doi:10.1007/978-3-030-52655-9. ISBN 978-3-030-52654-2.
- ^ "dew point". Merriam-Webster.com Dictionary. Merriam-Webster.
- ^ Skilling, Tom (20 July 2011). "Ask Tom why: Is it possible for relative humidity to exceed 100 percent?". Chicago Tribune. Retrieved 24 January 2018.
- ^ Moisture Control Guidance for Building Design, Construction and Maintenance. U.S. Environmental Protection Agency.
- ^ Horstmeyer, Steve (2006-08-15). "Relative Humidity....Relative to What? The Dew Point Temperature...a better approach". Steve Horstmeyer. Retrieved 2009-08-20.
- ^ "Dew Point in Compressed Air – Frequently Asked Questions" (PDF). Vaisala. Archived from the original (PDF) on 16 February 2018. Retrieved 15 February 2018.
- ^ "Denver Facts Guide – Today". The City and County of Denver. Archived from the original on February 3, 2007. Retrieved March 19, 2007.
- ^ "02/24/2003 - Reiteration of Existing OSHA Policy on Indoor Air Quality: Office Temperature/Humidity and Environmental Tobacco Smoke". Occupational Safety and Health Administration. Retrieved 2020-01-20.
- ^ Lin, Tzu-Ping (10 February 2009). "Thermal perception, adaptation and attendance in a public square in hot and humid regions". Building and Environment. 44 (10): 2017–2026. Bibcode:2009BuEnv..44.2017L. doi:10.1016/j.buildenv.2009.02.004.
- ^ Strahler, A. N. (1963). The Earth Sciences. Japan: Harper & Row.
- ^ Lawrence, Mark G. (February 2005). "The relationship between relative humidity and the dewpoint temperature in moist air: A simple conversion and applications". Bulletin of the American Meteorological Society. 86 (2): 225–234. Bibcode:2005BAMS...86..225L. doi:10.1175/BAMS-86-2-225. Retrieved 15 March 2024.
- ^ "Relative humidity and dewpoint temperature from temperature and wet-bulb temperature" (PDF). weather.gov. NOAA.
- ^ Bolton, David (July 1980). "The computation of equivalent potential temperature" (PDF). Monthly Weather Review. 108 (7): 1046–1053. Bibcode:1980MWRv..108.1046B. doi:10.1175/1520-0493(1980)108<1046:TCOEPT>2.0.CO;2. Archived from the original (PDF) on 2012-09-15. Retrieved 2012-07-04.
- ^ "Dew-point calculation" (PDF). Application note – via irtfweb.ifa.hawaii.edu.
- ^ "MET4 and MET4A Calculation of Dew Point". Archived from the original on 26 May 2012. Retrieved 7 October 2014.
- ^ Buck, Arden L. (December 1981). "New equations for computing vapor pressure and enhancement factor" (PDF). Journal of Applied Meteorology. 20 (12): 1527–1532. Bibcode:1981JApMe..20.1527B. doi:10.1175/1520-0450(1981)020<1527:NEFCVP>2.0.CO;2. Archived from the original (PDF) on 2016-03-04. Retrieved 2016-01-15.
- ^ Lawrence, Mark G. (February 2005). "The relationship between relative humidity and the dewpoint temperature in moist air: A simple conversion and applications". Bulletin of the American Meteorological Society. 86 (2): 225–233. Bibcode:2005BAMS...86..225L. doi:10.1175/BAMS-86-2-225.
- ^ Haby, Jeff. "Frost point and dew point". Retrieved September 30, 2011.
- ^ a b c Shaw, Napier (1911). . Encyclopædia Britannica. Vol. 8 (11th ed.). pp. 135–137.
- ^ a b Livesey, James (2018-10-23). "Measuring Air Humidity". www.whipplemuseum.cam.ac.uk. Retrieved 2025-08-19.
- ^ "Iranian city soars to record 129 degrees: Near hottest on Earth in modern measurements". Washington Post. Archived from the original on 2 July 2017. Retrieved 3 July 2017.
- ^ "Iran city hits suffocating heat index of 165 degrees, near world record". Klean Industries. 4 August 2015. Retrieved 2023-12-28.
External links
[edit]- Often Needed Answers about Temp, Humidity & Dew Point from the sci.geo.meteorology
| International | |
|---|---|
| National | |
| Other | |
Dew point
View on GrokipediaFundamentals
Definition
The dew point is the temperature at which air, when cooled at constant atmospheric pressure and constant water vapor content, becomes saturated with water vapor, leading to the initial formation of liquid water droplets through condensation.[3] This saturation point occurs when the relative humidity reaches 100%, marking the threshold where further cooling would cause dew to form on surfaces or fog in the air if the temperature drops to or below this value.[2] The concept is fundamental in atmospheric science, as it describes the point of transition from vapor to liquid phase without altering the air's pressure or moisture amount during the cooling process.[8] The value of the dew point is determined by the absolute amount of water vapor in the air parcel and the prevailing atmospheric pressure, which is held constant in the definition to isolate the effects of temperature reduction.[7] Higher moisture content elevates the dew point, while variations in pressure can subtly influence it, though the standard assumption is the ambient pressure at the location.[9] In contrast to relative humidity, which measures the current water vapor relative to the maximum capacity at a specific temperature and thus varies with temperature changes, the dew point serves as a stable indicator of absolute moisture content.[10] For example, air at 25°C with 50% relative humidity has a dew point of approximately 14°C, reflecting the fixed water vapor present regardless of the warmer ambient conditions.[11] This distinction makes the dew point a more reliable metric for assessing actual humidity levels in meteorological contexts.[12]Relation to Humidity
The dew point serves as a direct indicator of the absolute humidity in the atmosphere, representing the actual amount of water vapor present regardless of the air temperature, whereas relative humidity measures the air's moisture content as a percentage of the maximum possible at the current temperature and thus varies inversely with temperature changes.[3] This distinction makes the dew point a more stable metric for assessing moisture levels, as it remains constant even if the air warms or cools without adding or removing water vapor, unlike relative humidity which can fluctuate significantly under the same conditions.[3] When the air temperature equals the dew point, the relative humidity reaches 100%, signifying saturation where condensation begins to form.[3] A higher dew point correspondingly indicates greater atmospheric moisture, providing meteorologists and pilots with a reliable gauge for evaluating risks such as fog formation and the height of cloud bases, as the proximity of temperature to dew point signals potential condensation at lower altitudes.[13][14] The dew point depression, defined as the difference between the air temperature and the dew point, inversely correlates with relative humidity: a smaller depression reflects higher relative humidity and moister air, while a larger depression indicates drier conditions and lower relative humidity.[15] This relationship allows for quick assessments of atmospheric moisture without direct humidity measurements, aiding in weather analysis and aviation safety.[16]Calculation and Measurement
Calculating the Dew Point
The dew point temperature $ T_d $ is computed from the air temperature $ T $ (in °C) and relative humidity $ RH $ (in %) using the Magnus-Tetens approximation, a widely adopted empirical formula that provides accurate results for typical meteorological conditions. The formula is given bySimple Approximations
One widely used rule-of-thumb for estimating the dew point temperature $ T_d $ (in °C) from air temperature $ T $ (in °C) and relative humidity $ RH $ (in %) is given by the formulaThis approximation assumes a nearly linear relationship between relative humidity and dew point depression for typical atmospheric conditions.[16] The formula reflects the empirical observation that, for moist air, each 1% decrease in relative humidity below 100% corresponds to approximately 0.2°C increase in the dew point depression (the difference between air temperature and dew point).[16] It is most valid for air temperatures between 20°C and 30°C and relative humidities above 50%, where the relationship between humidity variables is approximately linear.[16] Under moderate conditions within these ranges, the approximation is accurate to within 1°C of the dew point calculated using more precise methods like the Magnus formula.[16] However, accuracy decreases at high relative humidities (near 100%), low temperatures (below 0°C), or extreme dryness (RH below 50%), where errors can exceed 2°C due to nonlinear effects in saturation vapor pressure.[16] This simple method gained popularity in meteorology before the widespread availability of digital calculators and computers, allowing field observers and amateur meteorologists to quickly estimate dew point from basic thermometer and hygrometer readings without complex tables or equations.[16] It serves as a practical refinement of the exact Magnus formula for educational and on-the-spot applications.[16]