

Community hub
Recent from talks
Contribute something
Nothing was collected or created yet.
Rail freight transport
View on WikipediaThis article needs additional citations for verification. (November 2021) |


Rail freight transport is the use of railways and trains to transport cargo, as opposed to passengers.
A freight train, cargo train, or goods train is a group of freight cars (US) or goods wagons (International Union of Railways) hauled by one or more locomotives on a railway, transporting cargo all or some of the way between the shipper and the intended destination as part of the logistics chain. Trains may haul bulk material, intermodal containers, general freight or specialized freight in purpose-designed cars.[1] Rail freight practices and economics vary by country and region.
When considered in terms of ton-miles or tonne-kilometers hauled, energy efficiency can be greater with rail transportation than with other means. Maximum economies are typically realized with bulk commodities (e.g., coal), especially when hauled over long distances. Moving goods by rail often involves transshipment costs, particularly when the shipper or receiver lack direct rail access. These costs may exceed that of operating the train itself, a factor that practices such as containerization, trailer-on-flatcar or rolling highway aim to minimize.
Overview
[edit]| Mode | eurocent per tonne-kilometre |
|---|---|
| Road (LCV) | |
| Road (HGV) | |
| Rail (diesel) | |
| Rail (electric) | |
| Inland vessel |
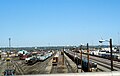
Traditionally, large shippers built factories and warehouses near rail lines and had a section of track on their property called a siding where goods were loaded onto or unloaded from rail cars. Other shippers had their goods hauled (drayed) by wagon or truck to or from a goods station (freight station in US). Smaller locomotives transferred the rail cars from the sidings and goods stations to a classification yard, where each car was coupled to one of several long-distance trains being assembled there, depending on that car's destination. When long enough, or based on a schedule, each long-distance train was then dispatched to another classification yard. At the next classification yard, cars are resorted. Those that are destined for stations served by that yard are assigned to local trains for delivery. Others are reassembled into trains heading to classification yards closer to their final destination. A single car might be reclassified or switched in several yards before reaching its final destination, a process that made rail freight slow and increased costs. Because, of this, freight rail operators have continually tried to reduce these costs by reducing or eliminating switching in classification yards through techniques such as unit trains and containerization, and in some countries these have completely replaced mixed freight trains.[3] In many countries, railroads have been built to haul one commodity, such as coal or ore, from an inland point to a port.[citation needed]
Rail freight uses many types of goods wagon (UIC) or freight car (US). These include box cars (US) or covered wagons (UIC) for general merchandise, flat cars (US) or flat wagons (UIC) for heavy or bulky loads, well wagons or "low loader" wagons for transporting road vehicles; there are refrigerator vans for transporting food, simple types of open-topped wagons for transporting bulk material, such as minerals and coal, and tankers for transporting liquids and gases. Most coal and aggregates are moved in hopper wagons or gondolas (US) or open wagons (UIC) that can be filled and discharged rapidly, to enable efficient handling of the materials.[citation needed]
Rail transport is very energy-efficient, and much more environmentally friendly than road transport.[2][4] Compared to road transport whісh employs the uѕе of trucks (lorries), rail transportation ensures that goods that соuld оtherwіѕе be transported on а number of trucks are transported in а single shipment. Thіѕ saves а lot аѕ fаr аѕ cost connected to the transportation are concerned.[5] Rail freight transport also has very low external costs.[2] Therefore, many governments have been stimulating the switch of freight from trucks onto trains, because of the environmental benefits that it would bring.[2][4] Railway transport and inland navigation (also known as 'inland waterway transport' (IWT) or 'inland shipping') are similarly environmentally friendly modes of transportation, and both form major parts of the 2019 European Green Deal.[2]
In Europe (particularly Britain), many manufacturing towns developed before the railway. Many factories did not have direct rail access. This meant that freight had to be shipped through a goods station, sent by train and unloaded at another goods station for onward delivery to another factory. When lorries (trucks) replaced horses it was often economical and faster to make one movement by road. In the United States, particularly in the West and Midwest, towns developed with railway and factories often had a direct rail connection. Despite the closure of many minor lines carload shipping from one company to another by rail remains common.[citation needed]
Railroads were early users of automatic data processing equipment, starting at the turn of the twentieth century with punched cards and unit record equipment.[6] Many rail systems have turned to computerized scheduling and optimization for trains which has reduced costs and helped add more train traffic to the rails.[citation needed]
Freight railroads' relationship with other modes of transportation varies widely. There is almost no interaction with airfreight, close cooperation with ocean-going freight and a mostly competitive relationship with long distance trucking and barge transport. Many businesses ship their products by rail if they are shipped long distance because it can be cheaper to ship in large quantities by rail than by truck; however barge shipping remains a viable competitor where water transport is available.[7]
Freight trains are sometimes illegally boarded by individuals who do not have the money or the desire to travel legally, a practice referred to as "hopping". Most hoppers sneak into train yards and stow away in boxcars. Bolder hoppers will catch a train "on the fly", that is, as it is moving, leading to occasional fatalities, some of which go unrecorded. The act of leaving a town or area, by hopping a freight train is sometimes referred to as "catching-out", as in catching a train out of town.[8]
Bulk
[edit]
Bulk cargo constitutes the majority of tonnage carried by most freight railroads. Bulk cargo is commodity cargo that is transported unpackaged in large quantities. These cargo are usually dropped or poured, with a spout or shovel bucket, as a liquid or solid, into a railroad car. Liquids, such as petroleum and chemicals, and compressed gases are carried by rail in tank cars.[9]
_rail_yard_weigh_station.jpg)
Hopper cars are freight cars used to transport dry bulk commodities such as coal, ore, grain, track ballast, and the like. This type of car is distinguished from a gondola car (US) or open wagon (UIC) in that it has opening doors on the underside or on the sides to discharge its cargo. The development of the hopper car went along with the development of automated handling of such commodities, with automated loading and unloading facilities. There are two main types of hopper car: open and covered; Covered hopper cars are used for cargo that must be protected from the elements (chiefly rain) such as grain, sugar, and fertilizer. Open cars are used for commodities such as coal, which can get wet and dry out with less harmful effect. Hopper cars have been used by railways worldwide whenever automated cargo handling has been desired. Rotary car dumpers simply invert the car to unload it, and have become the preferred unloading technology, especially in North America; they permit the use of simpler, tougher, and more compact (because sloping ends are not required) gondola cars instead of hoppers.[citation needed]
Heavy-duty ore traffic
[edit]The heaviest trains in the world carry bulk traffic such as iron ore and coal. Loads can be 130 tonnes per wagon and tens of thousands of tonnes per train. Daqin Railway transports more than 1 million tonnes of coal to the east sea shore of China every day and in 2009 is the busiest freight line in the world[10] Such economies of scale drive down operating costs. Some freight trains can be over 7 km long.[citation needed]
Containerization
[edit]
Containerization is a system of intermodal freight transport using standard shipping containers (also known as 'ISO containers' or 'isotainers') that can be loaded with cargo, sealed and placed onto container ships, railroad cars, and trucks. Containerization has revolutionized cargo shipping. As of 2009[update] approximately 90% of non-bulk cargo worldwide is moved by containers stacked on transport ships;[11] 26% of all container transshipment is carried out in China.[12] As of 2005[update], some 18 million total containers make over 200 million trips per year.[citation needed]
Use of the same basic sizes of containers across the globe has lessened the problems caused by incompatible rail gauge sizes in different countries by making transshipment between different gauge trains easier.[13]
While typically containers travel for many hundreds or even thousands kilometers on the railway, Swiss experience shows that with properly coordinated logistics, it is possible to operate a viable intermodal (truck + rail) cargo transportation system even within a country as small as Switzerland.[14]
Double-stack containerization
[edit].jpg)
Most flatcars (flat wagons) cannot carry more than one standard 40-foot (12.2 m) container on top of another because of limited vertical clearance, even though they usually can carry the weight of two. Carrying half the possible weight is inefficient. However, if the rail line has been built with sufficient vertical clearance, a double-stack car can accept a container and still leave enough clearance for another container on top. Both China and India run electrified double-stack trains with overhead wiring.[15]
In the United States, Southern Pacific Railroad (SP) with Malcom McLean came up with the idea of the first double-stack intermodal car in 1977.[16][17] SP then designed the first car with ACF Industries that same year.[18][19] At first it was slow to become an industry standard, then in 1984 American President Lines started working with the SP and that same year, the first all "double stack" train left Los Angeles, California for South Kearny, New Jersey, under the name of "Stacktrain" rail service. Along the way the train transferred from the SP to Conrail. It saved shippers money and now accounts for almost 70 percent of intermodal freight transport shipments in the United States, in part due to the generous vertical clearances used by U.S. railroads. These lines are diesel-operated with no overhead wiring.[citation needed]
Double stacking is also used in Australia between Adelaide, Parkes, Perth and Darwin. These are diesel-only lines with no overhead wiring. Saudi Arabian Railways use double-stack in its Riyadh-Dammam corridor. Double stacking is used in India for selected freight-only lines.[15]
Rolling highways and piggyback service
[edit]In some countries rolling highway, or rolling road,[20] trains are used; trucks can drive straight onto the train and drive off again when the end destination is reached. A system like this is used on the Channel Tunnel between the United Kingdom and France, as well as on the Konkan Railway in India. In other countries, the tractor unit of each truck is not carried on the train, only the trailer. Piggyback trains are common in the United States, where they are also known as trailer on flat car or TOFC trains, but they have lost market share to containers (COFC), with longer, 53-foot containers frequently used for domestic shipments. There are also roadrailer vehicles, which have two sets of wheels, for use in a train, or as the trailer of a road vehicle.[citation needed]
Special cargo
[edit]western New South Wales, Australia
Several types of cargo are not suited for containerization or bulk; these are transported in special cars custom designed for the cargo.
- Automobiles are stacked in open or closed autoracks, the vehicles being driven on or off the carriers.
- Coils of steel strip are transported in modified gondolas called coil cars.
- Goods that require certain temperatures during transportation can be transported in refrigerator cars (reefers, US), or refrigerated vans (UIC), but refrigerated containers are becoming more dominant.
- Center beam flat cars are used to carry lumber and other building supplies.
- Extra heavy and oversized loads are carried in Schnabel cars
Less than carload freight
[edit]Less-than-carload freight is any load that does not fill a boxcar or box motor or less than a boxcar load.[citation needed]
Historically in North America, trains might be classified as either way freight or through freight. A way freight generally carried less-than-carload shipments to/from a location, whose origin/destination was a rail terminal yard. This product sometimes arrived at/departed from that yard by means of a through freight.[citation needed]
At a minimum, a way freight comprised a locomotive and caboose, to which cars called pickups and setouts were added or dropped off along the route. For convenience, smaller consignments might be carried in the caboose, which prompted some railroads to define their cabooses as way cars, although the term equally applied to boxcars used for that purpose. Way stops might be industrial sidings, stations/flag stops, settlements, or even individual residences.[citation needed]
With the difficulty of maintaining an exact schedule, way freights yielded to scheduled passenger and through trains.[21] They were often mixed trains that served isolated communities. Like passenger service generally, way freights and their smaller consignments became uneconomical. In North America, the latter ceased,[22] and the public sector took over passenger transportation.
Regional differences
[edit]This section needs to be updated. (February 2016) |

Railroads are subject to the network effect: the more points they connect to, the greater the value of the system as a whole. Early railroads were built to bring resources, such as coal, ores and agricultural products from inland locations to ports for export. In many parts of the world, particularly the southern hemisphere, that is still the main use of freight railroads. Greater connectivity opens the rail network to other freight uses including non-export traffic. Rail network connectivity is limited by a number of factors, including geographical barriers, such as oceans and mountains, technical incompatibilities, particularly different track gauges and railway couplers, and political conflicts. The largest rail networks are located in North America and Eurasia. Long distance freight trains are generally longer than passenger trains, with greater length improving efficiency. Maximum length varies widely by system. (See longest trains for train lengths in different countries.)[citation needed]
Many countries are moving to increase speed and volume of rail freight in an attempt to win markets over or to relieve overburdened roads and/or speed up shipping in the age of online shopping. In Japan, trends towards adding rail freight shipping are more due to availability of workers rather than other concerns.[citation needed]
Rail freight tonnage as a percent of total moved by country:
Rail freight ton-milage as a percent of total moved by country:
- USA: 27.4% in 2020 [25]
- China: 15.9% in 2022 [26]
- EU28: more than 20% of all "inland traffic" in 2021 [27]
Eurasia
[edit]

There are four major interconnecting rail networks on the Eurasian land mass, along with other smaller national networks.
Most countries in the European Union participate in an auto-gauge network. The United Kingdom is linked to this network via the Channel Tunnel. The Marmaray project connects Europe with eastern Turkey, Iran, and the Middle East via a rail tunnel under the Bosphorus. The 57-km Gotthard Base Tunnel improved north–south rail connections when it opened in 2016. Spain and Portugal are mostly broad gauge, though Spain has built some standard gauge lines that connect with the European high-speed passenger network. A variety of electrification and signaling systems is in use, though this is less of an issue for freight; however, clearances prevent double-stack service on most lines. Buffer-and-screw couplings are generally used between freight vehicles, although there are plans to develop an automatic coupler compatible with the Russian SA3. See Railway coupling conversion.
The countries of the former Soviet Union, along with Finland and Mongolia, participate in a Russian gauge-compatible network, using SA3 couplers. Major lines are electrified. Russia's Trans-Siberian Railroad connects Europe with Asia, but does not have the clearances needed to carry double-stack containers. Numerous connections are available between Russian-gauge countries with their standard-gauge neighbors in the west (throughout Europe) and south (to China, North Korea, and Iran via Turkmenistan). While the USSR had important railway connections to Turkey (from Armenia) and to Iran (from Azerbaijan's Nakhchivan enclave), these have been out of service since the early 1990s, since a number of frozen conflicts in the Caucasus region have forced the closing of the rail connections between Russia and Georgia via Abkhazia, between Armenia and Azerbaijan, and between Armenia and Turkey.
China has an extensive standard-gauge network. Its freight trains use Janney couplers. China's railways connect with the standard-gauge network of North Korea in the east, with the Russian-gauge network of Russia, Mongolia, and Kazakhstan in the north, and with the meter-gauge network of Vietnam in the south.
India and Pakistan operate entirely on broad gauge networks. Indo-Pakistani wars and conflicts currently restrict rail traffic between the two countries to two passenger lines. There are also links from India to Bangladesh and Nepal, and from Pakistan to Iran, where a new, but little-used, connection to the standard-gauge network is available at Zahedan.
The four major Eurasian networks link to neighboring countries and to each other at several break of gauge points. Containerization has facilitated greater movement between networks, including a Eurasian Land Bridge.
North America
[edit]
Canada, Mexico and the United States are connected by an extensive, unified standard gauge rail network. The one notable exception is the isolated Alaska Railroad, which is connected to the main network by rail barge.[citation needed]
Due primarily to external factors such as geography and the commodity mix favoring commodities such as coal, the modal share of freight rail in North America is one of the highest worldwide.[28]
Rail freight is well standardized in North America, with Janney couplers and compatible air brakes. The main variations are in loading gauge and maximum car weight. Most trackage is owned by private companies that also operate freight trains on those tracks. Since the Staggers Rail Act of 1980, the freight rail industry in the U.S. has been largely deregulated. Freight cars are routinely interchanged between carriers, as needed, and are identified by company reporting marks and serial numbers. Most have computer readable automatic equipment identification transponders. With isolated exceptions, freight trains in North America are hauled by diesel locomotives, even on the electrified Northeast Corridor.[citation needed]
Ongoing freight-oriented development includes upgrading more lines to carry heavier and taller loads, particularly for double-stack service, and building more efficient intermodal terminals and transload facilities for bulk cargo. Many railroads interchange in Chicago, and a number of improvements are underway or proposed to eliminate bottlenecks there.[29] The U.S. Rail Safety Improvement Act of 2008 mandates eventual conversion to Positive Train Control signaling. In the 2010s, most North American Class I railroads have adopted some form of precision railroading.[30]
Central America
[edit]The Guatemala railroad is currently inactive, preventing rail shipment south of Mexico. Panama has freight rail service, recently converted to standard gauge, that parallels the Panama Canal. A few other rail systems in Central America are still in operation, but most have closed. There has never been a rail line through Central America to South America.[citation needed]
South America
[edit]Brazil has a large rail network, mostly metre gauge, with some broad gauge. It runs some of the heaviest iron ore trains in the world on its metre gauge network.[citation needed]
Argentina have Indian gauge networks in the south, standard gauge in the east and metre gauge networks in the north. The metre gauge networks are connected at one point, but there has never been a broad gauge connection. (A metre-gauge connection between the two broad gauge networks, the Transandine Railway was constructed but is not currently in service. See also Trans-Andean railways.) Most other countries have few rail systems. The standard gauge in the east, connect with Paraguay and Uruguay.[citation needed]
Africa
[edit]
The railways of Africa were mostly started by colonial powers to bring inland resources to port. There was little regard for eventual interconnection. As a result, there are a variety of gauge and coupler standards in use. A 3 ft 6 in (1,067 mm) gauge network with Janney couplers serves southern Africa. East Africa uses metre gauge. North Africa uses standard gauge, but potential connection to the European standard gauge network is blocked by the Arab–Israeli conflict.[citation needed]
Australia
[edit]
Rail developed independently in different parts of Australia and, as a result, three major rail gauges are in use. A standard gauge Trans-Australian Railway spans the continent.[citation needed]
Statistics
[edit]| Network | Gt-km | Countries |
|---|---|---|
| North America | 2863 | U.S., Canada, Mexico |
| China | 4389 | [32] |
| Russia | 2351 | CIS, Finland, Mongolia |
| India | 1,637.13 | Data for Year ending March 2024 [33] |
| European Union | 400 | 27 member countries[34] |
| Brazil | 269 | includes Bolivia (1) |
| South Africa | 115 | includes Zimbabwe (1.6) |
| Australia | 64 | |
| Japan | 20 | |
| South Korea | 10 |
In 2011, North American railroads operated 1,471,736 freight cars and 31,875 locomotives, with 215,985 employees, They originated 39.53 million carloads (averaging 63 tons each) and generated $81.7 billion in freight revenue. The largest (Class 1) U.S. railroads carried 10.17 million intermodal containers and 1.72 million trailers. Intermodal traffic was 6.2% of tonnage originated and 12.6% of revenue. The largest commodities were coal, chemicals, farm products, nonmetallic minerals and intermodal. Coal alone was 43.3% of tonnage and 24.7% of revenue. The average haul was 917 miles. Within the U.S. railroads carry 39.9% of freight by ton-mile, followed by trucks (33.4%), oil pipelines (14.3%), barges (12%) and air (0.3%).[35]
Railways carried 17.1% of EU freight in terms of tonne-km,[36] compared to road transport (76.4%) and inland waterways (6.5%).[37]
Named freight trains
[edit]Unlike passenger trains, freight trains are rarely named.[citation needed] Some, however, have gained names either officially or unofficially:
Gallery
[edit]-
-
 Freight train in Rostov Oblast, Russia
 -
 Old type of steam-hauled freight train in 1964
 -
 A container train passing through Jacksonville, Florida, with 53 ft (16.15 m) containers used for shipments within North America
 -


See also
[edit]References
[edit]- ^ "Rail Freight Shipping". Archived from the original on 20 February 2016.
- ^ a b c d e Hofbauer, Florian; Putz, Lisa-Maria (2020). "External Costs in Inland Waterway Transport: An Analysis of External Cost Categories and Calculation Methods". Sustainability. 12 (5874). MDPI: 9 (Table 11). Bibcode:2020Sust...12.5874H. doi:10.3390/su12145874. Retrieved 29 March 2022.
- ^ Armstrong, John H. (1978). The Railroad-What It Is, What It Does. Omaha, Neb.: Simmons-Boardman. pp. 7 ff.
- ^ a b Greene, Scott. Comparative Evaluation of Rail and Truck Fuel Efficiency on Competitive Corridors Archived 6 January 2012 at the Wayback Machine p4 Federal Railroad Administration, 19 November 2009. Accessed: 4 October 2011.
- ^ Shefer, Jon (1 December 2015). "Rail Freight Transportation: How To Save Thousands Of Dollars & The Environment". Archived from the original on 8 December 2015.
- ^ Hollerith's Electric Tabulating Machine Archived 30 May 2015 at the Wayback Machine Railroad Gazette, 19 April 1885.
- ^ "Information Systems and Industry Operating Procedures". Railroad Industry Overview Series. IRS. October 2007. Archived from the original on 21 June 2013.
- ^ Modes, Wes. "How To Hop a Freight Train, by Wes Modes". modes.io. Archived from the original on 20 December 2013. Retrieved 18 December 2013.
- ^ Stopford, Martin (1997). Maritime Economics. London: Routledge. pp. 292–93.
- ^ "Heavy-haul heavyweight: China's Daqin heavy-haul railway has undergone a major upgrade to enable it to carry more than three times its original design capacity. David Briginshaw reports from the Ninth International Heavy-Haul Conference in Shanghai on the innovative technology that made this possible | International Railway Journal | Find Articles at BNET". Findarticles.com. 2 June 2009. Retrieved 1 February 2010.
- ^ Ebeling, C. E. (Winter 2009). "Evolution of a Box". Invention and Technology. 23 (4): 8–9. ISSN 8756-7296.
- ^ "Container port traffic (TEU: 20 foot equivalent units) | Data | Table". Data.worldbank.org. Archived from the original on 27 November 2011. Retrieved 28 November 2011.
- ^ See e.g. the description of container transfer process at Alashankou railway station in: Shepard, Wade (28 January 2016). "Why The China-Europe 'Silk Road' Rail Network Is Growing Fast". Forbes (Blog). Archived from the original on 27 August 2017.
- ^ Anitra Green (20 September 2012), "Swiss operators optimise short-haul railfreight", International Railway Journal, archived from the original on 5 June 2015
- ^ a b Das, Mamuni (15 October 2007). "Spotlight on double-stack container movement". The Hindu Business Line. Archived from the original on 2 April 2010. Retrieved 11 February 2013.
- ^ Cudahy, Brian J., - "The Containership Revolution: Malcom McLean’s 1956 Innovation Goes Global" Archived 4 March 2016 at the Wayback Machine TR News. - (c/o National Academy of Sciences). - Number 246. - September–October 2006. - (Adobe Acrobat *.PDF document)
- ^ Union Pacific Railroad Company. "Chronological History". Archived from the original on 10 August 2006.
- ^ Kaminski, Edward S. (1999). - American Car & Foundry Company: A Centennial History, 1899-1999. - Wilton, California: Signature Press. - ISBN 0963379100
- ^ "A new fleet shapes up. (High-Tech Railroading)" Archived 17 October 2008 at the Wayback Machine. - Railway Age. - 1 September 1990
- ^ Rieper, Michael (29 May 2013). "Rail freight - an ancient method". BB Handel. Archived from the original on 7 June 2013. Retrieved 31 May 2013.
- ^ Torfason, Ragnar (28 December 2005). "Freight Trains: Way freights". www.theweebsite.com.
- ^ Irwin, Al (25 July 1977). "End of an era in rail service". Prince George Citizen. p. 1 – via www.pgpl.ca.
- ^ "Russia's RZD speeds up rail service to attract cargo". www.joc.com. Archived from the original on 7 October 2017. Retrieved 8 May 2018.
- ^ "Japan firms shifting to trains to move freight amid dearth of new truckers". The Japan Times. Archived from the original on 28 October 2017. Retrieved 8 May 2018.
- ^ "U.S. Ton-Miles of Freight". Home. Archived from the original on 30 May 2023. Retrieved 25 November 2023.
- ^ "2022年交通运输行业发展统计公报-政府信息公开-交通运输部". Ministry of Transport. 6 June 2023. Archived from the original on 16 October 2023. Retrieved 25 November 2023.
- ^ "File:Modal split of freight transport, EU, 2011-2021 (%, based on tonne-kilometres).png". ec.europa.eu. Archived from the original on 9 May 2023. Retrieved 25 November 2023.
- ^ Manuel Bastos Andrade Furtado, Francisco (Summer 2013). "U.S. and European Freight Railways: The Differences That Matter" (PDF). Journal of the Transportation Research Forum. 52 (2): 65–84. Retrieved 3 August 2023.
- ^ Schwartz, John (7 May 2012). "Freight Train Late? Blame Chicago". The New York Times. Archived from the original on 27 June 2017. Retrieved 28 February 2017. Chicago Rail Congestion Slows the Whole Country, New York Times, 8 May 2012
- ^ Barrow, Kieth (17 September 2019). "Precision Scheduled Railroading Evolution-Revolution". International Railway Journal.
- ^ "Railways, goods transported (million ton-km) - Data". data.worldbank.org. Archived from the original on 23 June 2017. Retrieved 8 May 2018.
- ^ https://www.mot.gov.cn/tongjishuju/tielu/202005/t20200511_3323807.htmlf [permanent dead link]
- ^ https://elocos.railnet.gov.in/Analysis/GTKMs/Summary.html[permanent dead link]
- ^ "Railway freight transport statistics".
- ^ Class I Railroad Statistics Archived 3 November 2013 at the Wayback Machine, Association of American Railroads, 7 February 2013
- ^ Lewandowski, Krzysztof (2015). "New coefficients of rail transport usage" (PDF). International Journal of Engineering and Innovative Technology. 5 (6): 89–91. ISSN 2277-3754. Archived from the original on 6 October 2016.
- ^ "Error". epp.eurostat.ec.europa.eu. Retrieved 8 May 2018.
.png)
.png)
| International | |
|---|---|
| National | |
| Other | |
Rail freight transport
View on GrokipediaFundamentals
Definition and Core Principles
Rail freight transport consists of the commercial movement of goods, commodities, and raw materials using locomotives to haul freight cars—such as hopper cars for bulk solids, tank cars for liquids, or flatcars and well cars for intermodal containers—along fixed steel rail tracks. This mode excels in transporting high-volume, heavy loads like coal, iron ore, grain, chemicals, and manufactured goods over medium to long distances, often spanning hundreds or thousands of kilometers, due to its capacity to assemble trains with dozens or hundreds of cars in classification yards.[3][10] At its core, rail freight operates on the physical principle of low rolling resistance between steel wheels and rails, which—combined with flange-guided steering—allows a single locomotive or distributed set of locomotives to propel trains weighing tens of thousands of tons with energy efficiency far surpassing road or air alternatives for equivalent payloads. This efficiency stems from the ability to couple multiple cars into unit trains dedicated to a single commodity, minimizing handling and maximizing throughput on dedicated lines, though it requires centralized infrastructure like sidings, signals, and maintenance facilities to manage train assembly, routing, and spacing.[3][11] Key operational principles emphasize scale economies, where cost per ton-mile drops with load size and distance, making rail optimal for bulk shipments but less flexible for point-to-point or time-sensitive deliveries compared to trucking. Safety protocols, including automatic brakes, track warrants, and positive train control, underpin reliability by reducing derailment risks through standardized gauge (typically 1,435 mm standard gauge globally) and weight limits enforced by infrastructure design. Interoperability with other modes via terminals enables multimodal integration, such as loading containers onto flatcars for seamless transfer to trucks or ships.[11][12][13]Comparative Advantages
Rail freight transport excels in the carriage of bulk commodities over long distances, offering economies of scale unattainable by road or air alternatives due to its ability to consolidate large volumes into single consists. A typical freight train comprising 100 cars can haul approximately 10,000 tons, equivalent to the payload of 300 to 400 semi-trucks, thereby reducing the number of vehicle movements required.[14][15] This capacity advantage stems from the mechanical efficiency of steel wheels on steel rails, which minimizes rolling resistance compared to rubber tires on asphalt, enabling longer consists with lower proportional energy input.[3] In terms of operational costs, rail achieves lower rates per ton-mile for hauls exceeding 500 miles, particularly for dense, low-value goods like coal, aggregates, or intermodal containers. For instance, rail shipping costs average around 5 cents per ton-mile, versus 15-16 cents for trucking on comparable routes, with intermodal combinations further optimizing expenses at about 9-10 cents per ton-mile.[16][17] These savings arise from reduced labor needs—one crew per train versus drivers per truck—and amortized infrastructure sharing among multiple operators.[12] Energy consumption metrics underscore rail's superiority for land-based freight: locomotives achieve 3 to 4 times the ton-miles per gallon of diesel compared to trucks, with some analyses showing up to 9 times greater efficiency when accounting for mixed freight loads.[18] This efficiency translates to environmental benefits, as rail emits roughly one-third the CO₂ per ton-mile of road freight—approximately 22 grams versus 65-154 grams—potentially cutting emissions by 75% when substituting for truck hauls.[19][20] Safety records further favor rail, with freight trains incurring one-eighth the fatalities and one-sixteenth the injuries per ton-mile relative to trucks, attributable to dedicated rights-of-way that limit exposure to mixed traffic and human error at grade crossings.[21][9] Overall, these attributes position rail as optimal for high-volume, point-to-point corridors, though its advantages diminish for time-sensitive or short-haul shipments where trucking's flexibility prevails.[11]| Metric | Rail Freight | Truck Freight | Source(s) |
|---|---|---|---|
| Fuel Efficiency (ton-miles/gallon) | 400-500 miles per gallon per ton | ~100-150 miles per gallon per ton | [22][11] |
| CO₂ Emissions (grams/ton-mile) | 21-22 | 65-154 | [19][23] |
| Cost (cents/ton-mile, long-haul) | 5-16 | 15-21 | [16][17] |
| Safety (fatalities/ton-mile relative to truck) | 1/8 | 1 | [21] |
Inherent Limitations
Rail freight transport is inherently constrained by its dependence on fixed tracks and infrastructure, which limits routing flexibility and prevents direct door-to-door service. Unlike road-based trucking, which can access origins and destinations via extensive road networks, rail requires shipments to be transported to and from rail terminals, often involving costly and time-consuming intermodal transfers to trucks. This rigidity makes rail unsuitable for low-volume, time-sensitive, or irregularly routed cargo, as schedules are predetermined and deviations are impractical without parallel infrastructure.[24][25][26] The mode's capital-intensive nature imposes significant barriers to entry and adaptation. Constructing and maintaining rail infrastructure demands substantial upfront investments, with U.S. freight railroads alone committing over $825 billion in private capital between 1980 and 2024 to tracks, signals, and yards. High fixed costs per mile—far exceeding those for roads—favor high-volume, consistent flows but render rail uneconomical in sparsely populated or variable-demand regions, where underutilization amplifies per-unit expenses.[27][28] Operational limitations further compound these issues, particularly in speed, terrain adaptability, and resilience. Rail excels in long-haul bulk transport but lags for distances under 500 miles, where three-quarters of truck tonnage occurs, due to terminal handling delays and average speeds of 20-30 mph including dwell times. Steep grades over 1% or tight curves reduce train tonnage and velocity, necessitating expensive alignments in hilly or mountainous areas that can limit route viability. Single- or double-track configurations heighten vulnerability to disruptions, such as derailments or maintenance, where a single blockage can idle entire corridors for hours or days, with limited rerouting options compared to road networks.[29][30][31]Historical Development
Origins in the Early 19th Century
The precursors to modern rail freight transport emerged in the form of horse-drawn wagonways, which utilized wooden rails to guide carts laden with coal and minerals from mines to waterways or ports, with documented examples dating to the late 16th century in Germany and expanding in Britain by the early 18th century for industrial purposes.[32] These systems improved efficiency over road haulage by reducing friction, enabling heavier loads—up to several tons per wagon—but remained limited by equine power, typically achieving speeds of 3-5 miles per hour and requiring frequent horse relays.[33] The advent of steam power marked the true origins of rail freight in 1804, when Richard Trevithick constructed the first practical steam locomotive to haul freight on rails at the Penydarren Ironworks in Merthyr Tydfil, Wales, on February 21. This locomotive pulled a train of ten tons of iron and 70 men approximately 10 miles, demonstrating steam's superiority for bulk transport by achieving speeds up to 5 mph on cast-iron plateway rails, though track wear and mechanical issues curtailed regular use.[34] Trevithick's innovation addressed the causal bottleneck of animal traction in fueling the Industrial Revolution's demand for coal and ore, proving locomotives could economically move heavy freight overland without canals' water dependency.[35] Commercial viability arrived with the Stockton and Darlington Railway, opened on September 27, 1825, as the world's first public railway to employ steam locomotives primarily for freight, transporting coal from collieries in County Durham to the port of Stockton-on-Tees over 26 miles of wrought-iron rails. George Stephenson's Locomotion No. 1 hauled 80-90 tons on opening day at speeds of 12-15 mph, reducing coal delivery costs from 18 shillings to 7 shillings per chaldron and spurring regional economic growth by enabling reliable bulk shipments.[36] While incidental passengers were carried, the line's design prioritized freight capacity, with stationary engines supplementing locomotives on inclines, establishing the template for revenue-generating rail networks centered on industrial commodities.[37]Expansion During Industrialization
The expansion of rail freight networks during the 19th-century Industrial Revolution transformed the movement of bulk commodities, enabling factories to access coal, iron ore, and timber while distributing manufactured goods across growing economies. Steam locomotives, powered by coal-fired boilers, offered superior capacity and speed over canals and roads, hauling loads that previously required horse-drawn wagons or slow water transport; for instance, early railways demonstrated the ability to move several tons of freight at speeds up to 4 miles per hour over distances of 1.5 miles in initial tests.[38] In Britain, the Liverpool and Manchester Railway, opened in 1830, pioneered regular steam freight services, primarily for coal and cotton, reducing transport times and costs by factors of 2 to 5 compared to prevailing methods and spurring coal production which rose from 30 million tons in 1830 to over 100 million tons by 1870.[39] This model rapidly disseminated to continental Europe and the United States, where rail mileage exploded to support resource-intensive industries. By 1850, the U.S. had constructed over 9,000 miles of track—more than the global total outside North America—facilitating the freight haulage of agricultural products eastward and raw materials westward, with coal shipments alone exceeding 10 million tons annually by the 1850s.[38] European networks, expanding from under 5,000 miles in 1840 to over 100,000 miles by 1880, similarly prioritized freight corridors for minerals and grains, as railways lowered per-ton-mile costs by up to 80% in some regions, directly causal to localized industrial clustering near stations where employment in secondary sectors increased by 10-20% within 2 km radii.[40] Rail freight's scalability—trains capable of pulling 100+ tons versus wagons' 5-10 tons—drove causal linkages to output growth, with U.S. rail tonnage climbing from negligible levels in 1830 to 50 million tons by 1870, integrating disparate markets and enabling specialization in heavy industry.[41] Between 1871 and 1900, American track additions of 170,000 miles further amplified this, with freight comprising 70-80% of traffic by volume, underscoring railways' role in sustaining the era's 4-5% annual GDP growth rates through efficient bulk logistics rather than mere passenger services.[41]20th Century Transformations
The early 20th century marked a period of technological experimentation and infrastructural expansion for rail freight, with railroads handling the majority of intercity freight in the United States, comprising about 62% of all freight ton-miles by 1940 at 378,343 million ton-miles annually.[42] Limited electrification efforts targeted high-traffic freight corridors to address steam locomotive inefficiencies, such as the New Haven Railroad's main line project completed between 1907 and 1914, and the Pennsylvania Railroad's extensive catenary system for freight operations.[43] In regions like Europe and Japan, electrification advanced more broadly for freight lines by the mid-century, driven by energy efficiency and urban constraints, though it remained secondary to steam in North America.[44] World War I intensified rail freight's strategic role, with railroads essential for troop and supply movements, leading to overloads that prompted U.S. nationalization under the United States Railroad Administration in 1917 to manage shortages and prioritize military logistics.[45] Post-war, the interwar period saw the gradual introduction of diesel-electric locomotives, beginning with experimental units in the 1920s and accelerating after the 1936 Electro-Motive Division DC-3 model, which offered superior fuel efficiency and reliability for freight over steam.[46] However, steam remained dominant until the 1940s, as railroads grappled with economic regulation that stifled innovation and competition from emerging trucking.[47] World War II propelled rail freight to unprecedented volumes, with U.S. railroads transporting 90% of military freight and 97% of organized troop movements, sustaining peak ton-miles through coordinated operations despite material shortages.[48] Post-war dieselization transformed operations, with steam locomotives largely phased out by the mid-1950s in favor of diesel-electrics that enabled longer, heavier trains and reduced maintenance costs, exemplified by high-horsepower models like the 1953 FM H24-66 at 2,400 hp.[49] Yet, rail's market share eroded amid highway expansions and trucking deregulation, dropping from dominance in bulk commodities to under 10% of freight revenues by 2001, as trucks captured shorter-haul and time-sensitive loads.[50] This shift reflected causal factors like regulatory burdens favoring road transport and the inflexibility of fixed rail networks for last-mile delivery.[47] By the late 20th century, rail freight adapted through unit train innovations for bulk goods like coal, concentrating on long-haul efficiencies where rail's lower cost per ton-mile—often 2-3 cents versus trucking's 10-15 cents—preserved viability despite volume declines from 1929 peaks.[38] Freight car numbers fell sharply post-1945, from over 1.8 million in 1945 to about 1.5 million by the 1970s, signaling consolidation toward specialized, high-capacity equipment.[51] These changes underscored rail's pivot from universal carrier to niche hauler of heavy, voluminous commodities, setting parameters for later efficiency gains.[52]Post-1980s Deregulation and Modernization
The Staggers Rail Act of 1980 fundamentally altered U.S. rail freight by partially deregulating rate-setting, permitting confidential contracts with shippers, expediting mergers and abandonments, and reducing Interstate Commerce Commission oversight.[53][54] These changes addressed chronic undercapitalization and losses, as pre-1980 regulations had constrained pricing flexibility and encouraged uneconomic operations, leading to widespread bankruptcies.[55] Post-enactment, average rail rates, adjusted for inflation, declined by 0.5% annually through the 1990s and beyond, contrasting with pre-deregulation increases of nearly 3% per year.[56] Railroad productivity, measured in ton-miles per employee or per dollar of investment, more than doubled between 1980 and 2000, driven by operational efficiencies such as longer trains and end-to-end routing.[55][57] Freight volumes expanded significantly, with rail tonnage rising 30% and average haul lengths increasing 50% from 1980 to 2008, reflecting a modal shift from trucks for bulk commodities like coal and intermodal containers.[55] U.S. Class I railroads invested over $810 billion in infrastructure and equipment since 1980, enabling network modernization including double-stack container clearance on key routes and adoption of distributed power locomotives for heavier trains.[38] Service reliability improved through contractual guarantees, while safety metrics advanced with technologies like positive train control mandated post-2008 but accelerated by deregulation's financial viability.[58] Mergers consolidated the industry from dozens of carriers to seven Class I operators by the 2000s, enhancing scale economies but prompting antitrust scrutiny; empirical analyses indicate net productivity gains outweighed any monopoly risks in low-density regions.[47] Internationally, deregulation varied in scope and outcomes. In the United Kingdom, rail freight privatization under the Railways Act 1993 separated infrastructure from operations, creating entities like English Welsh & Scottish Railway (EWS) for freight haulage.[59] Initial intermodal traffic grew, supported by EU directives on open access, but overall freight tonnage share stagnated below 10% of inland transport, falling short of expectations due to persistent infrastructure bottlenecks and competition from road haulage with relaxed lorry weight limits.[60][59] European Union liberalization from the 1990s onward, via packages like Directive 91/440/EEC, promoted cross-border competition but retained state involvement, yielding modest efficiency gains in countries like Germany and Sweden through partial privatization, though less transformative than in the U.S. owing to denser passenger networks and regulatory fragmentation.[61] Modernization post-deregulation emphasized technological integration and supply chain optimization. Double-stack intermodal trains, feasible after clearance upgrades in the 1990s, boosted capacity by 50-100% on corridors like the BNSF and Union Pacific mainlines, capturing truck traffic amid e-commerce growth.[47] Precision scheduled railroading, adopted by Class I carriers in the 2010s, reduced dwell times via GPS tracking and automated switching, lifting throughput despite workforce reductions from 1980 levels.[55] Globally, adoption of electronic train management systems and hybrid locomotives addressed emissions, with U.S. rail's carbon intensity per ton-mile remaining 75% lower than trucking, underscoring deregulation's role in sustaining viability amid environmental pressures.[58]Technical Elements
Infrastructure and Track Systems
Rail freight infrastructure consists of specialized track systems designed to support heavy axle loads, long train consists, and efficient throughput of bulk commodities. Tracks typically comprise steel rails mounted on sleepers (ties), secured by fasteners, and supported by a ballast layer over a prepared subgrade. In the United States, freight rails are engineered for axle loads reaching 286,000 pounds (130 tonnes), necessitating heavier rail sections weighing 132 to 141 pounds per yard (66 to 70 kg/m) compared to lighter rails on many passenger lines. European freight networks often standardize on 25 tonnes per axle, with rail weights of 60 kg/m or more on main lines.[62] The predominant track gauge for international freight is the standard gauge of 1,435 mm (4 ft 8½ in), facilitating interoperability across continents like Europe, Asia, and parts of Africa, while North American Class I railroads adhere to the same imperial equivalent of 4 ft 8½ in. Narrow gauges, such as 1,000 mm or 1,067 mm, persist in regional freight operations in Australia, Japan, and parts of South America, often for resource extraction where cost savings outweigh connectivity. Loading gauges, which define the maximum vehicle and load envelope, are generally larger for freight to accommodate oversized containers and bulk hoppers; North American freight profiles allow heights up to 16 feet (4.9 m) and widths exceeding 10 feet 8 inches (3.25 m), contrasting with tighter passenger clearances. Structure gauges account for dynamic sway and cant deficiency, ensuring safe passage under bridges and through tunnels optimized for freight volumes rather than high speeds.[63] Track construction emphasizes durability under repeated heavy loading: continuous welded rail (CWR) minimizes joints and fatigue, with rails laid on concrete sleepers spaced 60 cm apart, clipped to prevent movement. Ballast, typically crushed granite or limestone aggregates sized 25-65 mm, provides drainage, lateral stability, and load distribution, with depths of 200-300 mm under mainline freight tracks to absorb impacts from trains exceeding 10,000 tonnes gross weight. Sub-ballast layers filter fines and protect the subgrade, while geosynthetics may reinforce soft soils in freight corridors serving ports or mines. Freight-specific adaptations include reinforced turnouts for high-tonnage routing and wider spacing in yards to handle articulated cars.[64] Electrification infrastructure for freight remains limited globally, with overhead catenary systems (OCS) at 25 kV 50 Hz AC predominant where implemented, as in Europe's TEN-T corridors or China's high-density coal routes, delivering efficiencies for electric locomotives hauling 20% heavier trains than diesel equivalents. In the U.S., diesel dominance persists due to vast network sprawl and high upfront costs exceeding $2 million per track-mile for OCS, though studies highlight potential emissions reductions via hybrid or full electrification on congested lines. Signaling systems prioritize capacity over speed: centralized traffic control (CTC) enables dynamic block allocation, while positive train control (PTC) mandates in the U.S. prevent collisions and overspeed, boosting single-track throughput via extended sidings. Double-tracking freight mains can double capacity by eliminating meets, with simulation models showing 50-100% gains depending on train mix.[65][62][66]Locomotives, Wagons, and Equipment
Rail freight locomotives are predominantly diesel-electric in unelectrified networks like North America, where units typically feature 12-cylinder engines producing over 4,000 horsepower and weigh more than 400,000 pounds to generate high tractive effort for heavy trains.[67] These locomotives use diesel engines to drive generators or alternators that power traction motors on each axle, enabling speeds up to 125 mph though freight operations average far lower for efficiency.[68] In electrified systems common in Europe and China, electric locomotives draw power from overhead catenary, achieving higher energy efficiency; for instance, multi-system models deliver 5,600 kW with starting tractive efforts of 300 kN, supporting speeds of 120-140 km/h.[69] Hybrid and battery-electric prototypes are emerging to reduce emissions, but diesel and pure electric remain dominant for long-haul freight due to infrastructure and power density advantages.[70] Freight wagons, known as cars in North America, are categorized by design to suit cargo: covered wagons protect goods from weather with internal volumes of 120-138 m³ and payloads up to 68 metric tons; open-top gondolas handle bulk like ore or aggregates with 83-88 m³ volume and up to 71 tons capacity; hoppers facilitate unloading of grains or coal via bottom gates, offering 60-108 m³ and up to 72 tons.[71] Flat wagons support intermodal containers or lumber, while tank cars transport liquids with capacities from 54-80 m³.[72] In the United States, many wagons adhere to 286,000-pound gross rail load standards, enabling payloads of 70-110 tons depending on type, exceeding European norms limited by 22.5-ton axle loads to around 60-70 tons per wagon.[73][74] Supporting equipment includes bogies—pivoted frames with 4-6 wheels per wagon end—for stability and load distribution, often with 33-36 inch wheel diameters in standard gauge systems to balance speed and durability.[75][76] Couplings vary regionally: North America employs automatic Janney knuckle couplers for reliable high-speed shunting, while Europe traditionally uses buffer-and-chain systems, though digital automatic coupling (DAC) is under development to automate connections and enable shorter consists.[77] Braking relies on air systems with continuous brake pipes at 90 psi in North America, ensuring at least 11% braking ratio at shoes and limiting consecutive cars without power brakes to two per train for safety.[78][79] These components adhere to standards like those from the Federal Railroad Administration in the US, prioritizing reliability under heavy loads up to 20-25 tons per axle.[80]Operational Protocols and Technologies
Rail freight operations rely on standardized protocols for dispatching, safety, and crew coordination to ensure efficient movement of goods over long distances. In the United States, railroads adhere to federal regulations under 49 CFR Part 218, which mandate practices such as blue signal protection to safeguard workers performing maintenance on tracks or equipment by displaying blue flags or lights to prevent unauthorized train movements.[81] Dispatching protocols involve centralized traffic control (CTC) systems, where remote operators manage signals, switches, and train routing to optimize line capacity and minimize delays, a practice originating in the 1920s but widely adopted for freight networks to handle high-volume bulk shipments. Crew protocols require pre-departure brake tests, locomotive inspections, and adherence to hours-of-service limits to mitigate fatigue-related risks, with violations tracked by the Federal Railroad Administration.[82] Safety protocols integrate advanced train control technologies to enforce speed limits and prevent collisions. Positive Train Control (PTC), mandated by the Rail Safety Improvement Act of 2008, uses GPS, wireless communication, and onboard computers to automatically stop trains approaching signals, work zones, or other trains, covering nearly 59,000 route miles of freight lines by December 2020.[83] In Europe, the European Train Control System (ETCS), part of the European Rail Traffic Management System (ERTMS), standardizes signaling for cross-border freight interoperability, supervising train speeds and braking via balises and radio-based continuous supervision at levels from 0 to 3, with Level 2 predominant for freight corridors to reduce national system dependencies.[84] These systems have demonstrated effectiveness in averting accidents; for instance, PTC has prevented potential derailments and collisions on U.S. freight routes since full deployment.[85] Emerging technologies focus on automation and data integration to enhance freight efficiency. Centralized monitoring via Industry 4.0 tools, including IoT sensors for real-time wagon tracking and predictive maintenance, optimizes routing and reduces downtime in classification yards where cars are sorted using hump methods—gravity-assisted uncoupling over humps for automated distribution into tracks.[86] Automatic train operation (ATO) pilots, tested since 2020, enable driverless shunting and eco-driving to cut energy use by up to 10% on freight lines, though full autonomy remains limited by regulatory and interoperability challenges.[87] Digital automatic couplers, under development in EU projects, promise to automate coupling and streamline loading, addressing labor-intensive manual processes in bulk freight assembly.[88] These advancements prioritize causal factors like signal latency and human error, with adoption driven by empirical safety data rather than unsubstantiated environmental narratives.Freight Categories
Bulk Commodity Transport
Bulk commodity transport by rail focuses on moving large volumes of unpackaged raw materials, including coal, iron ore, grains, and aggregates, which constitute the majority of rail freight tonnage worldwide.[89] In 2023, global rail networks transported over 12 billion tons of cargo, with bulk commodities forming the largest share due to their high-volume, low-value nature suited to rail's capacity advantages.[89] Rail excels in this segment by enabling trains to carry loads equivalent to hundreds of trucks, reducing per-ton-mile costs and fuel consumption compared to road transport.[11][90] In the United States, bulk commodities account for 52% of rail freight carloads, encompassing energy products like coal and petroleum, agricultural goods such as grains, and minerals including iron ore and aggregates.[3] Coal remains a dominant commodity, with U.S. railroads handling shipments primarily from Appalachian and Powder River Basin mines to utilities and export terminals, though volumes have declined amid shifts to natural gas and renewables.[27] Grain transport, vital for exports, peaks seasonally, with unit trains moving soybeans and wheat from Midwest origins to Gulf ports, supporting over 100 million tons annually in peak years.[91] Internationally, China leads in rail bulk freight volume, transporting vast quantities of coal and iron ore to fuel its steel and power sectors, contributing to its top ranking in global tonne-kilometers.[92] Australia specializes in heavy-haul iron ore lines from Pilbara mines, where trains exceeding 4 kilometers in length carry up to 40,000 tons per trip over dedicated tracks.[93] Russia's rail system similarly prioritizes coal and ore exports, while India's networks handle coal for electricity generation alongside grains.[94] These operations leverage rail's efficiency for long-haul, point-to-point flows, where a single locomotive can haul thousands of tons with lower emissions per ton-mile than trucking—up to five times more fuel-efficient for bulk loads.[22][95] Specialized equipment enhances bulk rail's viability: open hopper cars for coal and grains facilitate rapid loading and unloading via rotary dumpers, while gondolas suit ores and scrap metal.[96] Tank cars dominate chemical and liquid bulk, ensuring safe containment for hazardous materials. Economic analyses confirm rail's cost edge for distances over 500 miles, with rates often 20-30% lower than trucks for bulk densities above 50 pounds per cubic foot, though infrastructure investments are required to maintain reliability.[97][98] Challenges include seasonal variability in grain flows and declining coal demand, prompting operators to adapt with multimodal integrations.[93]Intermodal and Containerized Shipping
Intermodal freight transport integrates rail with other modes such as trucking and maritime shipping, utilizing standardized containers or trailers to minimize cargo handling and enhance supply chain efficiency. In rail operations, this typically involves loading containers onto specialized flatcars or well cars for line-haul movement, with drayage by truck at origin and destination terminals. Containerized shipping by rail leverages ISO-standard 20-foot (6.1 m) or 40-foot (12.2 m) containers, alongside domestic sizes like 53-foot (16.15 m) units in North America, enabling seamless transfers from ocean vessels to rail networks.[99] The adoption of containerization in rail freight accelerated in the late 20th century, building on maritime innovations from the 1950s. Double-stack container trains, which stack containers two-high on railcars to double capacity without increasing train length, emerged in the United States in the mid-1980s, pioneered by railroads like Southern Pacific in collaboration with shipping lines. This configuration requires clearance heights of at least 20 feet (6.1 m) and electrified or heavy-duty locomotives, significantly boosting throughput; a single double-stack train can carry up to 180 forty-foot equivalent units (FEUs). In regions like Europe and parts of Asia, infrastructure constraints limit double-stacking, favoring single-level operations, though India has expanded dedicated freight corridors for such trains since the 2010s.[100][101] Efficiency metrics underscore rail's advantages in intermodal shipping for distances over 500 miles (800 km). A typical freight train achieves approximately 470 miles per gallon of fuel per ton of cargo, rendering it three to four times more fuel-efficient than trucking equivalents, thereby reducing operational costs and emissions. Intermodal rail volumes in the U.S. reached over 18 million units in 2023, comprising a substantial portion of total rail freight and reflecting growth tied to global trade. Globally, the intermodal freight transportation market was valued at USD 42.9 billion in 2023, with rail playing a pivotal role in segments like road-rail combinations, projected to expand amid e-commerce and just-in-time logistics demands.[99][98][102] Operational protocols emphasize terminal automation, such as crane-based loading and GPS tracking, to mitigate dwell times and interchange delays. In competitive markets, rail captures about 27% share in medium-haul intermodal lanes (750-1,500 miles or 1,200-2,400 km) in North America, outperforming trucks in capacity but facing challenges from port congestion and regulatory hurdles. Double-stack systems yield cost savings of up to 20-30% per container-mile compared to single-stack, though adoption varies; for instance, U.S. Class I railroads operate extensive networks supporting this, while European operators prioritize shorter-haul, high-frequency services.[103][104][105]Specialized and Less-Than-Carload Loads
Less-than-carload (LCL) freight denotes shipments insufficient to fill an entire railcar, often consolidated from multiple origins at dedicated freight houses or stations for shared carriage in boxcars or merchandise cars.[106] This service facilitated transport of small-volume, diverse goods like packaged consumer products, machinery parts, and retail merchandise, contrasting with full carload shipments of bulk commodities.[107] LCL operations required extensive manual handling, including loading, sorting, and unloading at intermediate points, which supported rural and small-town economies through local depots until the mid-20th century.[108] LCL traffic peaked during industrialization but began declining post-1920s as trucking emerged for its door-to-door flexibility, eroding rail's market share in time-sensitive, low-volume hauls.[109] By 1954, LCL represented about 18% of total freight on the Long Island Rail Road, yet overall volumes fell amid rising truck competition and rail inefficiencies like high labor costs and slower transit times.[110] Many U.S. railroads phased out LCL by the 1940s–1960s, with services ceasing on urban lines like Chicago's "L" in 1947 due to unprofitability and infrastructure shifts toward bulk and intermodal focus.[111] In Europe and Asia, analogous practices persisted longer but similarly waned, supplanted by containerization. Contemporary rail rarely offers pure LCL, as small shipments favor trucking or intermodal terminals where LCL consolidation occurs within containers for rail legs, particularly on transcontinental routes like China-to-Europe.[112] Railroads prioritize unit trains and carloads for efficiency, with LCL remnants limited to niche or legacy operations, reflecting causal advantages of trucks in handling fragmented, short-haul demand without rail's fixed infrastructure constraints. Specialized loads involve cargo demanding custom railcars, securement protocols, or regulatory compliance beyond standard dry van or bulk handling, including oversized equipment, hazardous substances, and temperature-sensitive perishables.[113] Oversized or dimensional freight, such as construction machinery exceeding standard clearances, ships on flatcars with protective framing and idler cars to manage weight distribution and prevent track damage, often requiring route surveys for bridge and tunnel compatibility.[114] Examples include turbines, excavators, and steel beams, where rail's capacity for heavy loads—up to 286,000 pounds per car in North America—outweighs trucking limits, though permits and escorts add complexity.[115] Hazardous materials transport employs tank cars with reinforced shells, internal linings (e.g., for acids or gases), pressure relief valves, and insulation to contain leaks or reactions, adhering to standards like those from the U.S. Department of Transportation's Pipeline and Hazardous Materials Safety Administration.[73] These cars feature specialized fittings for safe loading/unloading and monitoring, with segregated routing to minimize spill risks; in 2023, U.S. railroads moved over 100 million tons of hazmat annually, primarily chemicals and petroleum products, with incident rates below 0.01% of shipments due to such engineering.[116] Perishables, like fresh produce or pharmaceuticals, utilize refrigerated (reefer) cars with mechanical cooling units maintaining precise temperatures, though rail's share has contracted to under 5% of U.S. movements since the 1980s, yielding to refrigerated trucks for faster, flexible distribution.[117] Other specialized types include autoracks for automobiles, securing vehicles in enclosed racks to prevent damage during multi-car consists, and coil cars cradling steel rolls in protective wells to avoid shifting.[113] Centerbeam cars, with longitudinal beams, handle lumber and construction materials, enabling efficient stacking while resisting lateral forces.[118] These configurations optimize load security and capacity, underscoring rail's role in non-bulk, high-value freight where specialized design mitigates handling vulnerabilities inherent to wheeled transport.Economic Dynamics
Cost Structures and Efficiency Metrics
Rail freight transport exhibits a cost structure with disproportionately high fixed costs relative to variable costs, enabling economies of scale for high-volume, long-distance operations but requiring substantial throughput to achieve profitability. Fixed costs, which do not vary with output volume, include infrastructure maintenance such as track, signals, and bridges; depreciation of locomotives and rolling stock; and right-of-way acquisition or leasing. These often represent the majority of total expenses, with U.S. Class I railroads allocating about 20% of annual revenues to capital reinvestments for network upkeep and upgrades as of 2023.[119][120][121] Variable costs, which scale with freight volume and distance, encompass fuel or electricity for traction, crew wages, and incremental maintenance like wheel and brake wear; these remain low per unit over extended hauls due to rail's capacity to move thousands of tons per train. For instance, traction fuel or electricity typically accounts for 10-15% of operating expenses in locomotive-based systems, varying by electrification levels and commodity density.[122][123] This bifurcated structure contrasts with trucking, where variable costs dominate due to lower infrastructure dependencies, but rail's fixed-cost intensity fosters differential pricing strategies to cover network-wide expenses through higher charges on less elastic shippers and volume discounts for bulk traffic. In practice, total costs per ton for a 1,000-mile U.S. rail shipment rose from $98 in 2018 to $160 in 2023, driven by fuel volatility and labor amid supply chain disruptions, though inflation-adjusted rates remain 44% below 1981 levels due to productivity gains from longer trains and precision scheduling.[124][125][126] Efficiency metrics quantify rail's advantages in energy and throughput utilization, with key indicators including gross ton-miles per gallon of fuel and revenue per ton-mile. U.S. freight rail achieves approximately 470-500 ton-miles per gallon, or equivalently 1.0-1.1 gallons per 1,000 gross ton-miles, outperforming diesel trucking by factors of 3-5 for equivalent payloads; this stems from aerodynamic train configurations and regenerative braking in electric systems.[127] Revenue per ton-mile, a proxy for cost recovery, averaged around 4.2-4.5 U.S. cents for Class I carriers in recent years, reflecting competitive pricing for intermodal and coal hauls while covering fixed obligations through network density.[128][124] Operating ratios, measuring expenses as a percentage of revenue, hovered at 60-65% for major North American operators in 2024, indicating robust margins from scale but vulnerability to volume downturns that underutilize fixed assets.[129] Additional metrics like train velocity (miles per hour) and terminal dwell time track operational throughput, with improvements via positive train control reducing delays and enhancing overall system efficiency by 10-20% since implementation mandates in 2020.[130][131]| Metric | U.S. Rail Freight Value (Recent Average) | Notes |
|---|---|---|
| Fuel Efficiency | 470-500 ton-miles/gallon | Varies by locomotive type; electric rail higher in electrified networks.[127] |
| Revenue per Ton-Mile | 4.2-4.5 cents | Inflation-adjusted decline supports long-term competitiveness.[128][124] |
| Operating Ratio | 60-65% | Expenses/revenue; lower values indicate better cost control.[129] |
| Capital Reinvestment Rate | ~20% of revenues | Primarily for track and equipment to sustain capacity.[119] |
Market Competition with Trucking
Rail freight transport competes with trucking primarily in the long-haul segment for bulk commodities and intermodal containers, where rail's economies of scale provide lower costs per ton-mile, typically around 5.1 cents compared to 15.6 cents for trucks across various freight types.[132] This advantage stems from rail's ability to move larger volumes—up to 280 times more freight per gallon of fuel than a single truck—reducing variable costs for distances over 500 miles.[133] However, trucking maintains dominance in shorter hauls under 500 miles due to its flexibility, direct door-to-door service, and avoidance of intermodal transfers, capturing approximately 65% of U.S. freight by weight in recent assessments, though rail holds a comparable share of ton-miles in long-distance corridors.[24] In terms of operational efficiency, rail's fixed infrastructure costs are amortized over high-capacity trains, yielding external costs of 0.24-0.25 cents per ton-mile versus 1.11 cents for trucking, including congestion, accidents, and emissions not fully internalized by truck operators.[134] Government analyses indicate that unrecovered trucking costs—such as road wear and maintenance—exceed rail's by at least sixfold per ton-mile, subsidizing trucking's competitiveness through public highway investments that rail lacks equivalent access to.[135] Despite this, trucking's adaptability to just-in-time logistics and variable routes allows it to command higher-value, time-sensitive freight, while rail excels in low-margin bulk goods like coal, grain, and chemicals, where transit time predictability is less critical.[9] Intermodal rail-truck combinations have intensified competition by leveraging rail's core-haul efficiency with truck drayage for last-mile delivery, enabling double-stacked containers that reduce costs by over half for multimodal shipments compared to all-truck alternatives.[17] Railroads have innovated to challenge trucking in mid-range lanes (300-800 miles) through faster transit times and terminal expansions, but service reliability issues—such as delays from network congestion—persist as barriers, allowing trucks to retain market share during periods of low truckload rates.[99] In the U.S., long-haul trucking volumes reached about 954 billion ton-miles in 2023, underscoring trucks' overall ton-mile lead despite rail's niche strengths, with intermodal growth dependent on collaborative rail-truck partnerships rather than zero-sum rivalry.[136][137] Regulatory and infrastructural factors further shape this rivalry; post-1980 deregulation in markets like the U.S. bolstered rail's pricing flexibility, enabling recapture of traffic lost to trucks in the mid-20th century, yet persistent highway subsidies and truck weight limits favor trucking for oversized loads.[138] Empirical data show rail's safety edge—fewer accidents per ton-mile—and lower emissions, but trucking's speed (direct routing without fixed schedules) sustains its edge for perishable or urgent goods, limiting rail's penetration to about 40% of potential intermodal-eligible freight.[139] Overall, causal dynamics favor rail for volume-driven, distance-sensitive economics, while trucking prevails where service agility trumps scale.Investment and Profitability Factors
Rail freight transport demands substantial upfront capital investment due to its infrastructure-intensive nature, including tracks, signaling systems, locomotives, and rolling stock, which can exceed billions of dollars for network expansions or new lines.[140] This capital intensity creates high barriers to entry, as new operators require access to existing rights-of-way, regulatory approvals, and economies of scale to compete, often limiting market entrants to established incumbents or state-backed entities.[141] In contrast to trucking, which features lower initial costs and flexible entry via overbuilt public highways, rail's fixed assets yield lower variable costs per ton-mile—typically 3-4 times more fuel-efficient—but demand consistent high-volume traffic to achieve positive returns on investment.[142][143] Profitability hinges on operational efficiency metrics such as operating ratio (expenses as a percentage of revenue), which for U.S. Class I railroads averaged around 60-65% in 2024, indicating strong margins after covering maintenance and fuel costs.[144] Deregulation via the Staggers Rail Act of 1980 enabled rate flexibility and abandonment of unprofitable lines, reversing pre-1980 losses and boosting productivity by over 100% through 2020, with real freight rates declining 0.5% annually post-reform while revenues grew.[56][145] Factors like fuel price volatility and intermodal competition with trucking can erode margins, as seen in productivity slowdowns since the 2000s, yet high-density bulk commodities (e.g., coal, grain) sustain profitability through network effects and low marginal costs.[146] Investment decisions prioritize long-haul routes with predictable demand, as return on invested capital (ROIC) improves with traffic density; for instance, U.S. railroads invested $25 billion privately in 2023, funding 90% of infrastructure without direct public subsidies, unlike road freight's reliance on taxpayer-funded highways.[124][147] In Europe, state involvement and track access charges introduce variability, with profitability determinants including labor productivity and freight volumes, though open-access policies have not fully overcome incumbents' scale advantages.[148] Regulatory burdens, such as capacity allocation on shared networks, further deter greenfield investments, emphasizing the causal link between policy stability and sustained capital inflows.[149] Overall, rail's economic viability rests on leveraging fixed investments for volume-driven returns, tempered by competition and external shocks.Environmental and Safety Profiles
Energy Use and Emission Realities
Rail freight transport exhibits significantly lower energy intensity than road freight due to reduced rolling resistance from steel wheels on steel rails and economies of scale in hauling large volumes. In the United States, Class I railroads achieve an average fuel efficiency of approximately 423 ton-miles per gallon of diesel fuel, equivalent to roughly 328 British thermal units (BTU) per ton-mile.[124] This contrasts sharply with heavy-duty trucks, which require about 3,000-3,500 BTU per ton-mile, making rail up to 10 times more energy-efficient on a per-ton-mile basis.[150] Energy intensity for U.S. rail has improved over time, with Bureau of Transportation Statistics data showing a decline from around 831 BTU per ton-mile in earlier decades to under 400 BTU per ton-mile in recent years for Class I operations.[151] Greenhouse gas (GHG) emissions from rail freight are correspondingly low, primarily from diesel combustion in non-electrified systems. U.S. freight rail emits about 0.046 pounds of CO2 equivalent per ton-mile, roughly 75% less than trucking's 0.465 pounds per ton-mile.[152] Globally, rail accounts for only 1% of transport sector GHG emissions despite handling 6% of tonne-kilometers, reflecting inherent efficiency advantages.[153] In electrified networks, such as those prevalent in Europe and parts of Asia, emissions can approach near-zero at the tailpipe but depend on the electricity grid's carbon intensity; for instance, coal-dominated grids yield higher lifecycle emissions than natural gas or renewables.[153] Industry reports from the Association of American Railroads note that operational optimizations, like Energy Management Systems, further reduced U.S. rail fuel use by 18 million gallons and GHG emissions by 247,000 metric tons in 2023 alone.[154]| Mode | Energy Intensity (BTU/ton-mile, approx.) | CO2e Emissions (lb/ton-mile, approx.) |
|---|---|---|
| U.S. Rail | 328 | 0.046 |
| Heavy Truck | 3,200 | 0.465 |
Accident Rates and Risk Mitigation
Rail freight transport demonstrates substantially lower accident rates per ton-mile compared to highway trucking, with U.S. analyses estimating rail to be approximately 28 times safer for both the public and workforce when normalized for freight volume and distance.[156] This advantage is particularly pronounced for hazardous materials like chemicals, fuel, and gas, where more than 99.99% of rail shipments arrive without a release due to train accidents, and hazmat accident rates per carload have declined 80% since 2005.[124] By replacing several hundred trucks with a single train, rail reduces road accident risks, highway congestion, and wear on public infrastructure. In the United States, the Federal Railroad Administration (FRA) recorded a 27% decline in overall rail accident rates in recent years, alongside reductions in incidents involving hazardous materials transport.[157] Freight-specific derailments, a leading accident type, occur at rates inversely correlated with track class and traffic density, with higher-quality infrastructure yielding fewer events per million train-miles; for instance, studies indicate derailment frequencies below 1 per million car-miles on well-maintained lines.[158] Employee safety metrics further underscore rail freight's profile: on-duty fatalities across U.S. railroads fell 71% from 2000 to 2023, reaching historic lows, while Class I freight carriers reported a 46% drop in injury and fatality rates since 2005.[159][160] Track-related accidents decreased 56% between 2005 and 2024, and yard-switching incidents per million miles declined 32% over the same period.[124] Globally, data is less granular for freight alone, but European Union railway fatalities—which include freight operations—dropped 32.4% from 1,245 in 2010 to 841 in 2023, reflecting infrastructure upgrades and regulatory enforcement.[161] In Asia, comprehensive freight-specific rates vary by jurisdiction, with international benchmarks showing ongoing improvements tied to electrification and signaling investments, though underreporting in developing networks complicates direct comparisons.[162] Key risk mitigation strategies emphasize technology and maintenance to address human error, track defects, and mechanical failures, which account for most incidents. Positive Train Control (PTC), a GPS- and radio-based system deployed on over 60,000 miles of U.S. freight routes by 2020, automatically enforces speed limits, prevents collisions, and stops trains before misaligned switches or foul territory, directly averting dozens of potential derailments and spills annually.[163][164] Mandated by the 2008 Rail Safety Improvement Act for lines with hazardous materials or high speeds, PTC has integrated with existing signals to reduce overspeed-related risks by up to 80% in equipped territories.[165] Additional measures include electronically controlled pneumatic (ECP) brakes for faster stopping on unit trains, which cut derailment propagation in hazmat loads, and automated inspection technologies like ultrasonic rail testing, deployed routinely on Class I networks to detect flaws preemptively.[166] Regulatory frameworks, such as FRA's track safety standards and European Train Control System (ETCS) equivalents, enforce minimum classes for freight corridors, correlating with lower accident frequencies; compliance has yielded sustained declines in cause-specific rates, though challenges persist at grade crossings, where over 80% of non-train accidents occur due to vehicle incursions.[167][168] These interventions, grounded in empirical risk modeling, prioritize causal factors over generalized narratives, ensuring freight's safety edge endures amid rising volumes.Policy Controversies
Regulatory Burdens and Deregulation Impacts
Prior to the late 20th century, rail freight in the United States faced extensive economic regulation under the Interstate Commerce Commission (ICC), established in 1887, which mandated uniform rates, restricted pricing flexibility, and prohibited abandonment of unprofitable lines without approval, leading to cross-subsidization where profitable routes funded losses elsewhere.[53][169] This regime stifled competition, inflated costs by an estimated $6.7 billion annually through resource misallocation and deadweight losses, and contributed to infrastructure deterioration as railroads diverted funds to cover regulatory-mandated services rather than maintenance or innovation.[58][170] Meanwhile, trucking and other modes faced lighter regulation, eroding rail's market share from over 75% of intercity freight in 1929 to under 40% by 1970.[170] The Staggers Rail Act of October 14, 1980, partially deregulated U.S. rail freight by exempting up to 40% of traffic from ICC rate oversight, streamlining merger approvals, easing line abandonments, and promoting confidential contracts between railroads and shippers, thereby enabling market-driven pricing and operational efficiencies.[53][169] Post-Staggers, inflation-adjusted freight rates fell by approximately 40% from 1980 levels, with annual declines of 0.5% compared to pre-deregulation increases of nearly 3%, driven largely by productivity gains and cost reductions that accounted for 90% of rate drops.[55][56][171] Shippers saved up to $7 billion annually by 1987 through lower rates and improved service quality, while rail freight volumes surged 63% from 1980 to 2000, reflecting enhanced competitiveness against trucking.[58][172] Deregulation facilitated industry consolidation into seven Class I carriers by 2020, enabling network rationalization, massive private investments exceeding $250 billion since 1980 in tracks and equipment, and productivity doublings per employee, transforming a bankrupt-prone sector into a profitable one with operating ratios improving from over 90% to under 60%.[173][174] Peer-reviewed analyses confirm positive efficiency effects, including lower rates for shippers, higher profits for viable operators, and overall welfare gains from reduced regulatory distortions, though critics attribute service disruptions to consolidation without evidence overturning net productivity benefits.[175][176] Internationally, partial deregulations like Sweden's 1990s reforms yielded mixed freight outcomes with modest efficiency gains but persistent state dominance, while Sub-Saharan African efforts post-1990s often reduced freight demand due to inadequate infrastructure transitions, underscoring that deregulation's causal benefits hinge on competitive markets and private incentives absent in heavily state-controlled systems.[177][178]Labor Disputes and Operational Constraints
In the United States, rail freight labor disputes frequently revolve around wage increases, scheduling flexibility, and quality-of-life provisions such as paid sick leave, which unions argue are essential to combat fatigue and high attrition rates amid demanding operational schedules. A prominent example occurred in 2022, when 12 rail unions representing over 115,000 workers rejected a tentative agreement negotiated after years of stalled talks, citing insufficient paid time off and rigid attendance policies that penalized illness or family emergencies despite a proposed 24% wage increase over five years from 2020 to 2024.[179][180] Rail carriers, including Class I operators like Union Pacific and BNSF, maintained that such policies were necessary for maintaining network fluidity under precision scheduled railroading (PSR) models, which prioritize long trains and fixed schedules to optimize capacity but exacerbate crew shortages and turnaround times.[181] The dispute escalated to the brink of a nationwide strike that could have halted 30% of U.S. freight tonnage, disrupting supply chains for commodities like chemicals, autos, and agriculture, until Congress intervened on December 1, 2022, passing legislation to impose the agreement and avert economic losses estimated at $1 billion per day.[182][183] President Biden signed the bill on December 2, 2022, marking the first such federal imposition of a rail contract since 1992, though it included seven paid sick days as a concession following union pressure.[181] Critics from labor groups contended the resolution favored carriers' efficiency demands over worker well-being, contributing to ongoing turnover, while carriers highlighted investments in training and bonuses to address shortages, with unionized workforce levels stabilizing but still below pre-pandemic peaks.[184] In Europe, freight-specific strikes are rarer due to integrated passenger-freight networks where disruptions often prioritize public services, though general rail union actions, such as those in Greece in October 2025 over working hours, have occasionally idled freight operations alongside passenger lines.[185] Operational constraints in rail freight stem primarily from capacity limitations, workforce shortages, and regulatory requirements that restrict throughput on aging infrastructure. U.S. Class I railroads operate near full capacity on key corridors, with intermodal traffic growth exacerbating bottlenecks; for instance, mainline utilization often exceeds 80% in high-density routes like the Chicago hub, leading to dwell times averaging 24-48 hours for containers during peak surges.[186][187] Crew shortages, driven by retirements, rigorous Federal Railroad Administration (FRA) training mandates, and post-2022 dispute attrition, have reduced train starts by up to 10% in affected periods, with carriers reporting fewer but longer holds for locomotive engineers in 2023-2024 compared to prior years.[188][189] Maintenance backlogs compound these issues, as deferred track and equipment repairs—exacerbated by skilled labor gaps in repair shops—increase risks of delays and safety incidents; U.S. railroads performed over 1.5 million track miles of inspections annually but faced constraints from FRA hours-of-service rules limiting crew shifts to 12 hours daily with mandatory rest, hindering rapid recovery from disruptions like weather events or mechanical failures.[190] Globally, similar patterns emerge in capacity-strained networks, such as Europe's spatial limits on terminal expansions near urban areas and Asia's infrastructure deficits in developing regions, where freight yields to passenger priority, reducing modal share despite lower per-ton emissions.[149][25] These constraints underscore causal trade-offs between efficiency-driven models like PSR and resilience, with carriers investing in automation and recruitment to mitigate fluidity losses estimated at 5-10% during peak constraints.[191]Privatization Outcomes vs. State Control
In the United States, the Staggers Rail Act of 1980, which deregulated pricing, contracting, and abandonments for privately owned railroads, reversed decades of decline under heavy regulation akin to state control. Prior to deregulation, railroads faced annual inflation-adjusted rate increases of nearly 3 percent, widespread bankruptcies, and stagnant freight volumes; post-Staggers, rates fell by 0.5 percent annually, shippers saved up to $7 billion yearly by 1987 in transportation costs, and rail freight ton-miles more than quadrupled from 1980 to 2020, capturing market share from trucks through efficiency gains like optimized routing and equipment utilization.[56][58][55] These outcomes stemmed from market incentives enabling railroads to shed unprofitable lines (over 9,000 miles abandoned by 2000) and invest in double-stack intermodal services, boosting productivity by 2-3 percent annually without subsidies.[174] In the United Kingdom, full privatization of British Rail's freight operations in the 1990s under the Railways Act 1993 introduced competition via access rights to state-owned tracks, yielding freight volume growth of 80 percent from 1993 to 2023 alongside real cost reductions per ton-mile, as private operators like DB Cargo UK specialized in bulk commodities and intermodal traffic.[192] This contrasted with pre-privatization stagnation, where state monopoly led to cross-subsidization from passengers and modal shift losses to roads; however, vertical separation of infrastructure from operations created coordination frictions, limiting gains compared to integrated U.S. models.[193] European Union freight liberalization since the 2001 First Railway Package has shown weaker but positive efficiency links, with entry of over 300 new operators correlating to modest productivity rises in competitive markets like Sweden and Germany, though incumbent state firms retain 70-90 percent market share amid regulatory barriers.[194][195] State-controlled systems, such as India's Indian Railways, exemplify persistent inefficiencies from monopoly operations and political pricing, with freight modal share dropping from 90 percent in 1950 to under 30 percent by 2020 due to chronic underinvestment in capacity, average speeds of 25 km/h for goods trains, and diversion to trucks despite lower marginal costs.[196][197] In China, state ownership via China State Railway Group has enabled massive scale—freight volumes exceeding 4 billion tons annually by 2023 through centralized planning—but at the cost of overcapacity in low-value bulk hauls, subsidy dependence, and lower per-ton efficiency than privatized peers, as evidenced by slower adoption of market-driven innovations like private sidings.[198][199] Empirical comparisons indicate privatization fosters causal improvements in allocative efficiency by aligning incentives with user needs, whereas state control prioritizes non-commercial goals like employment or universal service, often eroding competitiveness absent competitive pressures.[200]Global and Regional Patterns
North America
Rail freight transport in North America is dominated by privately owned Class I railroads operating across an extensive network primarily in the United States, with significant extensions into Canada and Mexico. The U.S. freight rail system spans approximately 140,000 route miles, making it the largest, safest, and most cost-efficient in the world, handling long-haul bulk and intermodal shipments. Seven Class I carriers—BNSF Railway, Union Pacific, CSX Transportation, Norfolk Southern, Canadian National, Canadian Pacific Kansas City, and the integrated Mexico operations—control the majority of traffic, generating nearly $80 billion in annual revenue as of 2024. These for-profit entities have reinvested about $840 billion in infrastructure since 1980 without relying on taxpayer subsidies, enabling operational efficiencies like precision scheduled railroading.[3][201] In terms of volume, North American rail freight moved an estimated 2.69 trillion ton-kilometers in 2025, with the U.S. alone accounting for over 1.7 trillion ton-miles annually in recent years, reflecting recovery from pandemic disruptions into 2024. Rail captures around 40% of U.S. intercity freight ton-miles, particularly for distances over 500 miles, compared to trucks' dominance in shorter hauls and by tonnage (about 67% of total freight tons). This disparity arises from rail's superior efficiency for heavy, low-value commodities over long distances, moving one ton of freight nearly 500 miles per gallon of fuel. Cross-border trade under USMCA further integrates the system, with rail facilitating 543.5 million tons of goods tied to international ports in 2023, though trucks handle over 60% of surface border value.[202][27][203] Key commodities include coal (historically significant but declining), chemicals, grain, and metals, alongside growing intermodal traffic—containers and trailers—which surged 4.1% in early 2025 carloads. Intermodal represents a shift toward time-sensitive manufactured goods, competing with trucking while leveraging rail's capacity for volumes exceeding 3.7 million carloads of non-rail vehicles and machinery annually. Bulk hauls like agricultural products and energy resources underscore rail's role in regional economies, with operators like BNSF excelling in intermodal and coal from the Powder River Basin. Overall volumes rose 2.5% through mid-2025, driven by miscellaneous and intermodal gains despite coal weakness, highlighting adaptability amid economic fluctuations.[27][204][205]Europe and Eurasia
In the European Union, rail freight transport accounted for 16.9% of inland freight tonne-kilometres in 2023, a decline from 18.9% in 2018, reflecting persistent competition from road haulage despite policy efforts to promote rail as a lower-emission alternative.[206] Overall performance in tonne-kilometres fell by 4.9% in 2023 compared to 2022, with Germany maintaining the largest share of volumes due to its industrial base and extensive network.[207] The combined modal share of rail and inland waterways reached a series low of 21.9% for total EU freight in 2023, underscoring structural barriers such as regulatory fragmentation, infrastructure bottlenecks, and higher operational costs relative to road transport.[208] Eleven EU countries reported lower rail freight volumes in 2023 than a decade prior, with sharp declines in the Baltic states attributable to shifts in trade patterns and energy imports.[209] Eastern non-EU European nations, including Ukraine and Belarus, exhibit varying patterns influenced by geopolitical disruptions, but data scarcity limits precise quantification; Ukraine's rail freight has been hampered by conflict since 2022, reducing cross-border flows. In contrast, Russia's state-owned Russian Railways (RZD) handled 1.23 billion tons of freight loading in 2023, a marginal 0.2% decrease from 2022, primarily comprising commodities like coal, oil, and metals that dominate its vast network.[210] Volumes dropped further to 1.18 billion tons in 2024 amid sanctions and export reorientations, marking the lowest since at least 2020, with freight turnover at 3.1 trillion tonne-kilometres.[211] [212] First-half 2025 loading fell 7.6% year-on-year to 554.5 million tons, driven by reduced coal and metal shipments, though construction materials saw gains.[213] Across Eurasia, rail freight corridors linking China to Europe via Russia and Central Asian states have expanded under the Belt and Road Initiative, with Russia-China rail volumes rising 9% in 2024 to over 175 million tons, facilitating pivots from Western markets.[214] These transcontinental routes, including the New Eurasian Land Bridge, offer transit times of 12-18 days versus sea freight's 30-45 days, with rates approximately 59% lower than maritime alternatives, though volumes remain below sea freight's scale due to capacity constraints and gauge differences.[215] Geopolitical tensions, including sanctions on Russia, have spurred alternative paths like the Middle Corridor through Kazakhstan, Azerbaijan, and Georgia, yet Eurasian rail's growth hinges on infrastructure harmonization and reduced border delays rather than subsidies alone. Central Asian republics, such as Kazakhstan, serve as key nodes, with freight volumes bolstered by resource exports but challenged by underinvestment in electrification and signaling. Overall, Eurasia's rail freight patterns contrast Europe's stagnation: commodity-heavy hauls sustain high absolute volumes in Russia and CIS states, while EU declines highlight the causal role of market distortions over mere environmental rhetoric.[216]Asia and Developing Regions
China accounts for the majority of rail freight activity in Asia, with its state-operated network handling substantial volumes of bulk commodities such as coal and iron ore. In 2023, provincial data indicated Shanxi Province alone transported over 1 billion tons of freight by rail, contributing to national totals exceeding 4 trillion ton-kilometers in freight turnover.[217][218] The sector's efficiency stems from extensive infrastructure, including over 159,000 kilometers of track, enabling rail to capture about 14.7% of total freight turnover despite competition from roads and waterways.[219] India's rail freight, managed by Indian Railways, focuses on coal, iron ore, and food grains, with volumes reaching approximately 1.47 billion metric tons in the financial year 2023-24.[220] Efforts to enhance capacity through dedicated freight corridors have supported growth, though rail's modal share lags behind roads due to regulatory and infrastructural bottlenecks.[221] In Japan, rail freight volumes are modest, totaling around 26.5 million tons in 2023, primarily miscellaneous goods via JR Freight's network, reflecting a shift toward trucking for shorter hauls amid geographic constraints.[222] Southeast Asia exhibits limited rail freight penetration, with rail comprising roughly 7.8% of intra-regional transport, hindered by fragmented networks and varying gauges across countries like Thailand and Vietnam.[223] In developing regions outside Asia, rail freight is predominantly commodity-driven, serving mineral exports in Africa and Latin America. Sub-Saharan Africa's rail sector, valued at USD 4.77 billion in 2025 projections, handles low volumes—around 100 billion ton-kilometers annually—concentrated in ore trains in countries like Mauritania and South Africa, where underinvestment and maintenance issues limit broader utility.[224][225] Brazil's rail network, key for iron ore and soybeans, supports a market estimated at USD 7.39 billion in 2025, with production focused on export corridors, though overall freight remains road-dominant due to historical underdevelopment of rail alternatives.[226] Across these areas, World Bank analyses highlight rail's potential for cost-effective bulk transport but note persistent challenges from state monopolies, inadequate investment, and road biases that elevate emissions and congestion without corresponding economic gains.[227] Emerging economies' rail freight underutilization contrasts with efficiency gains possible from modal shifts, as evidenced by China's model, yet institutional biases toward roads—often unsubstantiated by lifecycle cost analyses—perpetuate inefficiencies in regions like Africa and Latin America.[227][228]Statistical Overview
Historical and Current Volumes
Global rail freight transport volumes, measured in tonne-kilometres (tkm), have expanded substantially since the post-World War II era, coinciding with electrification, containerization, and economic industrialization, particularly in Asia. Early 20th-century figures were dominated by Europe and North America, where rail handled the bulk of bulk commodities like coal and iron ore, but comprehensive global aggregates were not systematically compiled until later decades through organizations such as the International Union of Railways (UIC). By the 2000s, reported volumes reflected a shift toward Asia, with China's rapid infrastructure buildup driving much of the increase; for instance, Chinese rail freight grew from under 1.5 trillion tkm in the early 1990s to over 2.8 trillion tkm by the late 2010s.[229] In recent years, worldwide rail freight activity has stabilized around 10-11 trillion tkm annually, with Asia-Pacific accounting for the largest share due to high-density networks in China, India, and Russia. In 2020, global performance reached 10,800 billion tkm, encompassing both national and international hauls of commodities such as coal, iron ore, and intermodal containers.[230] The top three contributors—China (approximately 2,852 billion tkm), Russia (2,602 billion tkm), and the United States (2,364 billion tkm)—represented over 75% of the total in the period around 2019-2020, underscoring concentration in state-influenced or vast territorial networks.[92] Europe, by contrast, recorded 410 billion tkm in 2018 before declining to 378 billion tkm in 2023 amid competition from road haulage and energy transitions reducing coal volumes.[207]| Region/Country | Approximate Annual Volume (billion tkm, circa 2019-2020) |
|---|---|
| China | 2,852 |
| Russia | 2,602 |
| United States | 2,364 |
| Europe (total) | ~400 |
| Global Total | ~10,800 (2020) |
Growth Projections to 2030
Global rail freight transport volumes are forecasted to grow moderately through 2030, driven primarily by infrastructure expansions in emerging markets, intermodal containerization, and policy incentives for modal shifts from road haulage, though competition from trucking and supply chain disruptions pose risks to realization. Market value projections indicate a compound annual growth rate (CAGR) ranging from 2.4% to 6.8% across analyses, reflecting variances in assumptions about economic recovery, trade volumes, and fuel costs. For instance, one estimate places the rail freight market at USD 326.09 billion in 2025, expanding to USD 405.76 billion by 2030.[233] Another projects growth from USD 574.19 billion in 2024 to USD 852.09 billion in 2030, emphasizing containerized and bulk commodity segments.[234] The International Energy Agency's base scenario anticipates rail freight activity roughly doubling globally by 2050 from 2015 levels, implying an interim increase of approximately 30-50% by 2030 if trends hold, contingent on electrification and efficiency gains.[235] In North America, rail freight growth is expected to align with overall freight tonnage expansion of about 25.6% by 2030, with intermodal traffic—particularly containers and trailers—targeted for revenue uplift to sustain profitability amid flat carload volumes in coal and agriculture.[236][103] Volume metrics project around 2.69 trillion tonne-kilometers (TKM) in 2025, supported by optimized routes for heavier loads but tempered by regulatory hurdles and labor constraints.[202] Europe's projections hinge on ambitious policy targets rather than baseline trends, with the sector aiming for a 30% modal share of land freight by 2030—up from roughly 18%—to accommodate an estimated 30% rise in overall inland freight demand.[237][238] Actual activity could see 29.6% growth in tonne-kilometers by 2030 under baseline scenarios, bolstered by EU infrastructure funding, though chronic underinvestment and cross-border bottlenecks have historically undermined similar goals.[239] Railroad market revenues in the region are forecasted to reach USD 97.5 billion by 2030 at a 5.9% CAGR, prioritizing high-speed freight corridors.[240] Asia, particularly China and India, is poised for the strongest expansion, with rail freight volumes projected at 4.66 trillion TKM in 2025 and accelerating via Belt and Road Initiative investments and urban logistics hubs.[241] The Asia-Pacific railroad market anticipates USD 73.7 billion in revenues by 2030 at a 6.2% CAGR, fueled by coal, minerals, and container traffic, though overreliance on state-controlled networks introduces execution risks.[242] Corridors linking Asia to Europe, such as the Middle Corridor, could triple volumes to 11 million tonnes by 2030, enhancing Eurasian connectivity.[243]| Region | Projected 2030 Market Value (USD Billion) | CAGR (2024/2025-2030) | Key Driver |
|---|---|---|---|
| Global | 406-852 | 4.5-6.8% | Infrastructure, e-commerce |
| North America | N/A (focus on tonnage +25%) | ~3-4% (implied) | Intermodal optimization |
| Europe | 97.5 | 5.9% | Modal share targets |
| Asia-Pacific | 73.7 | 6.2% | Export-oriented bulk cargo |