
Community hub
Recent from talks
Contribute something
Nothing was collected or created yet.
Hyperspectral imaging
View on Wikipedia
Hyperspectral imaging collects and processes information from across the electromagnetic spectrum.[1] The goal of hyperspectral imaging is to obtain the spectrum for each pixel in the image of a scene, with the purpose of finding objects, identifying materials, or detecting processes.[2][3] There are three general types of spectral imagers. There are push broom scanners and the related whisk broom scanners (spatial scanning), which read images over time, band sequential scanners (spectral scanning), which acquire images of an area at different wavelengths, and snapshot hyperspectral imagers, which uses a staring array to generate an image in an instant.
Whereas the human eye sees color of visible light in mostly three bands (long wavelengths, perceived as red; medium wavelengths, perceived as green; and short wavelengths, perceived as blue), spectral imaging divides the spectrum into many more bands. This technique of dividing images into bands can be extended beyond the visible. In hyperspectral imaging, the recorded spectra have fine wavelength resolution and cover a wide range of wavelengths. Hyperspectral imaging measures continuous spectral bands, as opposed to multiband imaging which measures spaced spectral bands.[4]
Engineers build hyperspectral sensors and processing systems for applications in astronomy, agriculture, molecular biology, biomedical imaging, geosciences, physics, and surveillance. Hyperspectral sensors look at objects using a vast portion of the electromagnetic spectrum. Certain objects leave unique "fingerprints" in the electromagnetic spectrum. Known as spectral signatures, these "fingerprints" enable identification of the materials that make up a scanned object. For example, a spectral signature for oil helps geologists find new oil fields.[5]
Sensors
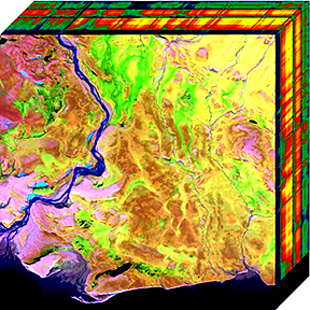
[edit]Figuratively speaking, hyperspectral sensors collect information as a set of "images." Each image represents a narrow wavelength range of the electromagnetic spectrum, also known as a spectral band. These "images" are combined to form a three-dimensional (x, y, λ) hyperspectral data cube for processing and analysis, where x and y represent two spatial dimensions of the scene, and λ represents the spectral dimension (comprising a range of wavelengths).[6]
Technically speaking, there are four ways for sensors to sample the hyperspectral cube: spatial scanning, spectral scanning, snapshot imaging,[5][7] and spatio-spectral scanning.[8]
Hyperspectral cubes are generated from airborne sensors like NASA's Airborne Visible/Infrared Imaging Spectrometer (AVIRIS), or from satellites like NASA's EO-1 with its hyperspectral instrument Hyperion.[9][10] However, for many development and validation studies, handheld sensors are used.[11]
The precision of these sensors is typically measured in spectral resolution, which is the width of each band of the spectrum that is captured. If the scanner detects a large number of fairly narrow frequency bands, it is possible to identify objects even if they are only captured in a handful of pixels. However, spatial resolution is a factor in addition to spectral resolution. If the pixels are too large, then multiple objects are captured in the same pixel and become difficult to identify. If the pixels are too small, then the intensity captured by each sensor cell is low, and the decreased signal-to-noise ratio reduces the reliability of measured features.
The acquisition and processing of hyperspectral images is also referred to as imaging spectroscopy or, with reference to the hyperspectral cube, as 3D spectroscopy.
Scanning techniques
[edit]
There are four basic techniques for acquiring the three-dimensional (x, y, λ) dataset of a hyperspectral cube. The choice of technique depends on the specific application, seeing that each technique has context-dependent advantages and disadvantages.
Spatial scanning
[edit]
In spatial scanning, each two-dimensional (2D) sensor output represents a full slit spectrum (x, λ). Hyperspectral imaging (HSI) devices for spatial scanning obtain slit spectra by projecting a strip of the scene onto a slit and dispersing the slit image with a prism or a grating. These systems have the drawback of having the image analyzed per lines (with a push broom scanner) and also having some mechanical parts integrated into the optical train. With these line-scan cameras, the spatial dimension is collected through platform movement or scanning. This requires stabilized mounts or accurate pointing information to 'reconstruct' the image. Nonetheless, line-scan systems are particularly common in remote sensing, where it is sensible to use mobile platforms. Line-scan systems are also used to scan materials moving by on a conveyor belt. A special case of line scanning is point scanning (with a whisk broom scanner), where a point-like aperture is used instead of a slit, and the sensor is essentially one-dimensional instead of 2D.[7][12]
Spectral scanning
[edit]In spectral scanning, each 2D sensor output represents a monochromatic (i.e. single wavelength), spatial (x, y)-map of the scene. HSI devices for spectral scanning are typically based on optical band-pass filters (either tunable or fixed). The scene is spectrally scanned by exchanging one filter after another while the platform remains stationary. In such "staring", wavelength scanning systems, spectral smearing can occur if there is movement within the scene, invalidating spectral correlation/detection. Nonetheless, there is the advantage of being able to pick and choose spectral bands, and having a direct representation of the two spatial dimensions of the scene.[6][7][12] If the imaging system is used on a moving platform, such as an airplane, acquired images at different wavelengths corresponds to different areas of the scene. The spatial features on each of the images may be used to realign the pixels.
Non-scanning
[edit]In non-scanning, a single 2D sensor output contains all spatial (x, y) and spectral (λ) data. HSI devices for non-scanning yield the full datacube at once, without any scanning. Figuratively speaking, a single snapshot represents a perspective projection of the datacube, from which its three-dimensional structure can be reconstructed.[7][13] The most prominent benefits of these snapshot hyperspectral imaging systems are the snapshot advantage (higher light throughput) and shorter acquisition time. A number of systems have been designed, including computed tomographic imaging spectrometry (CTIS), fiber-reformatting imaging spectrometry (FRIS), integral field spectroscopy with lenslet arrays (IFS-L), multi-aperture integral field spectrometer (Hyperpixel Array), integral field spectroscopy with image slicing mirrors (IFS-S), image-replicating imaging spectrometry (IRIS), filter stack spectral decomposition (FSSD), coded aperture snapshot spectral imaging (CASSI), image mapping spectrometry (IMS), and multispectral Sagnac interferometry (MSI).[14] However, computational effort and manufacturing costs are high. In an effort to reduce the computational demands and potentially the high cost of non-scanning hyperspectral instrumentation, prototype devices based on Multivariate Optical Computing have been demonstrated. These devices have been based on the Multivariate Optical Element[15][16] spectral calculation engine or the Spatial Light Modulator[17] spectral calculation engine. In these platforms, chemical information is calculated in the optical domain prior to imaging such that the chemical image relies on conventional camera systems with no further computing. As a disadvantage of these systems, no spectral information is ever acquired, i.e. only the chemical information, such that post processing or reanalysis is not possible.
Spatiospectral scanning
[edit]In spatiospectral scanning, each 2D sensor output represents a wavelength-coded ("rainbow-colored", λ = λ(y)), spatial (x, y)-map of the scene. A prototype for this technique, introduced in 2014, consists of a camera at some non-zero distance behind a basic slit spectroscope (slit + dispersive element).[8][18] Advanced spatiospectral scanning systems can be obtained by placing a dispersive element before a spatial scanning system. Scanning can be achieved by moving the whole system relative to the scene, by moving the camera alone, or by moving the slit alone. Spatiospectral scanning unites some advantages of spatial and spectral scanning, thereby alleviating some of their disadvantages.[8]
Distinguishing hyperspectral from multispectral imaging
[edit]
Hyperspectral imaging is part of a class of techniques commonly referred to as spectral imaging or spectral analysis. The term "hyperspectral imaging" derives from the development of NASA's Airborne Imaging Spectrometer (AIS) and AVIRIS in the mid-1980s. Although NASA prefers the earlier term "imaging spectroscopy" over "hyperspectral imaging," use of the latter term has become more prevalent in scientific and non-scientific language. In a peer reviewed letter, experts recommend using the terms "imaging spectroscopy" or "spectral imaging" and avoiding exaggerated prefixes such as "hyper-," "super-" and "ultra-," to prevent misnomers in discussion.[19]
Hyperspectral imaging is related to multispectral imaging. The distinction between hyper- and multi-band is sometimes based incorrectly on an arbitrary "number of bands" or on the type of measurement. Hyperspectral imaging (HSI) uses continuous and contiguous ranges of wavelengths (e.g. 400 - 1100 nm in steps of 1 nm) whilst multiband imaging (MSI) uses a subset of targeted wavelengths at chosen locations (e.g. 400 - 1100 nm in steps of 20 nm).[20]
Multiband imaging deals with several images at discrete and somewhat narrow bands. Being "discrete and somewhat narrow" is what distinguishes multispectral imaging in the visible wavelength from color photography. A multispectral sensor may have many bands covering the spectrum from the visible to the longwave infrared. Multispectral images do not produce the "spectrum" of an object. Landsat is a prominent practical example of multispectral imaging.
Hyperspectral deals with imaging narrow spectral bands over a continuous spectral range, producing the spectra of all pixels in the scene. A sensor with only 20 bands can also be hyperspectral when it covers the range from 500 to 700 nm with 20 bands each 10 nm wide, while a sensor with 20 discrete bands covering the visible, near, short wave, medium wave and long wave infrared would be considered multispectral.
Ultraspectral could be reserved for interferometer type imaging sensors with a very fine spectral resolution. These sensors often have (but not necessarily) a low spatial resolution of several pixels only, a restriction imposed by the high data rate.
Applications
[edit]Hyperspectral remote sensing is used in a wide array of applications. Although originally developed for mining and geology (the ability of hyperspectral imaging to identify various minerals makes it ideal for the mining and oil industries, where it can be used to look for ore and oil),[11][21] it has now spread into fields as widespread as ecology and surveillance, as well as historical manuscript research, such as the imaging of the Archimedes Palimpsest. This technology is continually becoming more available to the public. Organizations such as NASA and the USGS have catalogues of various minerals and their spectral signatures, and have posted them online to make them readily available for researchers. On a smaller scale, NIR hyperspectral imaging can be used to rapidly monitor the application of pesticides to individual seeds for quality control of the optimum dose and homogeneous coverage.
Agriculture
[edit]
Although the cost of acquiring hyperspectral images is typically high for specific crops and in specific climates, hyperspectral remote sensing use is increasing for monitoring the development and health of crops. In Australia, work is under way to use imaging spectrometers to detect grape variety and develop an early warning system for disease outbreaks.[22] Furthermore, work is under way to use hyperspectral data to detect the chemical composition of plants,[23] which can be used to detect the nutrient and water status of wheat in irrigated systems.[24] On a smaller scale, NIR hyperspectral imaging can be used to rapidly monitor the application of pesticides to individual seeds for quality control of the optimum dose and homogeneous coverage.[25]
Another application in agriculture is the detection of animal proteins in compound feeds to avoid bovine spongiform encephalopathy (BSE), also known as mad-cow disease. Different studies have been done to propose alternative tools to the reference method of detection, (classical microscopy). One of the first alternatives is near infrared microscopy (NIR), which combines the advantages of microscopy and NIR. In 2004, the first study relating this problem with hyperspectral imaging was published.[26] Hyperspectral libraries that are representative of the diversity of ingredients usually present in the preparation of compound feeds were constructed. These libraries can be used together with chemometric tools to investigate the limit of detection, specificity and reproducibility of the NIR hyperspectral imaging method for the detection and quantification of animal ingredients in feed.
HSI cameras can also be used to detect stress from heavy metals in plants and become an earlier and faster alternative to post-harvest wet chemical methods.[27][28]
Zoology
[edit]Hyperspectral imaging is also used in zoology; it is used to investigate the spatial distribution of coloration and its extension into the near-infrared and SWIR range of the spectrum.[29] Some animals for example, such as some tropical frogs and certain leaf-sitting insects are highly reflective in the near-infrared.[29][30]
Waste sorting and recycling
[edit]Hyperspectral imaging can provide information about the chemical constituents of materials which makes it useful for waste sorting and recycling.[31] It has been applied to distinguish between substances with different fabrics and to identify natural, animal and synthetic fibers.[32] HSI cameras can be integrated with machine vision systems and, via simplifying platforms, allow end-customers to create new waste sorting applications and other sorting/identification applications.[33] A system of machine learning and hyperspectral camera can distinguish between 12 different types of plastics such as PET and PP for automated separation of waste of, as of 2020, highly unstandardized[34][additional citation(s) needed] plastics products and packaging.[35][36]
Eye care
[edit]Researchers at the Université de Montréal are working with Photon etc. and Optina Diagnostics[37] to test the use of hyperspectral photography in the diagnosis of retinopathy and macular edema before damage to the eye occurs. The metabolic hyperspectral camera will detect a drop in oxygen consumption in the retina, which indicates potential disease. An ophthalmologist will then be able to treat the retina with injections to prevent any potential damage.[38]
Food processing
[edit]
In the food processing industry, hyperspectral imaging, combined with intelligent software, enables digital sorters (also called optical sorters) to identify and remove defects and foreign material (FM) that are invisible to traditional camera and laser sorters.[39][40] By improving the accuracy of defect and FM removal, the food processor's objective is to enhance product quality and increase yields.
Adopting hyperspectral imaging on digital sorters achieves non-destructive, 100 percent inspection in-line at full production volumes. The sorter's software compares the hyperspectral images collected to user-defined accept/reject thresholds, and the ejection system automatically removes defects and foreign material.

The recent commercial adoption of hyperspectral sensor-based food sorters is most advanced in the nut industry where installed systems maximize the removal of stones, shells and other foreign material (FM) and extraneous vegetable matter (EVM) from walnuts, pecans, almonds, pistachios, peanuts and other nuts. Here, improved product quality, low false reject rates and the ability to handle high incoming defect loads often justify the cost of the technology.
Commercial adoption of hyperspectral sorters is also advancing at a fast pace in the potato processing industry where the technology promises to solve a number of outstanding product quality problems. Work is under way to use hyperspectral imaging to detect "sugar ends,"[41] "hollow heart"[42] and "common scab,"[43] conditions that plague potato processors.
Mineralogy
[edit]
Geological samples, such as drill cores, can be rapidly mapped for nearly all minerals of commercial interest with hyperspectral imaging. Fusion of SWIR and LWIR spectral imaging is standard for the detection of minerals in the feldspar, silica, calcite, garnet, and olivine groups, as these minerals have their most distinctive and strongest spectral signature in the LWIR regions.[44]
Hyperspectral remote sensing of minerals is well developed. Many minerals can be identified from airborne images, and their relation to the presence of valuable minerals, such as gold and diamonds, is well understood. Currently, progress is towards understanding the relationship between oil and gas leakages from pipelines and natural wells, and their effects on the vegetation and the spectral signatures. Recent work includes the PhD dissertations of Werff[45] and Noomen.[46]
Surveillance
[edit]
Hyperspectral surveillance is the implementation of hyperspectral scanning technology for surveillance purposes. Hyperspectral imaging is particularly useful in military surveillance because of countermeasures that military entities now take to avoid airborne surveillance. The idea that drives hyperspectral surveillance is that hyperspectral scanning draws information from such a large portion of the light spectrum that any given object should have a unique spectral signature in at least a few of the many bands that are scanned. Hyperspectral imaging has also shown potential to be used in facial recognition purposes. Facial recognition algorithms using hyperspectral imaging have been shown to perform better than algorithms using traditional imaging.[47]
Traditionally, commercially available thermal infrared hyperspectral imaging systems have needed liquid nitrogen or helium cooling, which has made them impractical for most surveillance applications. In 2010, Specim introduced a thermal infrared hyperspectral camera that can be used for outdoor surveillance and UAV applications without an external light source such as the sun or the moon.[48][49]
Astronomy
[edit]In astronomy, hyperspectral imaging is used to determine a spatially resolved spectral image. Since a spectrum is an important diagnostic, having a spectrum for each pixel allows more science cases to be addressed. In astronomy, this technique is commonly referred to as integral field spectroscopy, and examples of this technique include FLAMES[50] and SINFONI[51] on the Very Large Telescope. The Advanced CCD Imaging Spectrometer on the Chandra X-ray Observatory uses this technique.
Chemical imaging
[edit]
Soldiers can be exposed to a wide variety of chemical hazards. These threats are mostly invisible but detectable by hyperspectral imaging technology. The Telops Hyper-Cam, introduced in 2005, has demonstrated this at distances up to 5 km.[53]
Environment
[edit]
Most countries require continuous monitoring of emissions produced by coal and oil-fired power plants, municipal and hazardous waste incinerators, cement plants, as well as many other types of industrial sources. This monitoring is usually performed using extractive sampling systems coupled with infrared spectroscopy techniques. Some recent standoff measurements performed allowed the evaluation of the air quality but not many remote independent methods allow for low uncertainty measurements.
Civil engineering
[edit]Recent research indicates that hyperspectral imaging may be useful to detect the development of cracks in pavements[55] which are hard to detect from images taken with visible spectrum cameras.[55]
Biomedical imaging
[edit]Hyperspectral imaging has also been used to detect cancer, identify nerves and analyze bruises.[56]
Advantages and disadvantages
[edit]The primary advantage to hyperspectral imaging is that, because an entire spectrum is acquired at each point, the operator needs no prior knowledge of the sample, and postprocessing allows all available information from the dataset to be mined. Hyperspectral imaging can also take advantage of the spatial relationships among the different spectra in a neighbourhood, allowing more elaborate spectral-spatial models for a more accurate segmentation and classification of the image.[57][58]
The primary disadvantages are cost and complexity. Fast computers, sensitive detectors, and large data storage capacities are needed for analyzing hyperspectral data. Significant data storage capacity is necessary since uncompressed hyperspectral cubes are large, multidimensional datasets, potentially exceeding hundreds of megabytes. All of these factors greatly increase the cost of acquiring and processing hyperspectral data. Also, one of the hurdles researchers have had to face is finding ways to program hyperspectral satellites to sort through data on their own and transmit only the most important images, as both transmission and storage of that much data could prove difficult and costly.[9] As a relatively new analytical technique, the full potential of hyperspectral imaging has not yet been realized.
See also
[edit]- Acousto-optic tunable filter
- Airborne real-time cueing hyperspectral enhanced reconnaissance
- Cathodoluminescence
- Full spectral imaging
- HyMap, a widely used hyperspectral imaging sensor
- Liquid crystal tunable filter
- Metamerism (color), the perceptual equivalence that hyperspectral imaging overcomes
- Multispectral image
- Sensor fusion
- Video spectroscopy
References
[edit]- ^ Chilton, Alexander (2013-10-07). "The Working Principle and Key Applications of Infrared Sensors". AZoSensors. Archived from the original on 26 April 2025. Retrieved 2020-07-11.
- ^ Chein-I Chang (31 July 2003). Hyperspectral Imaging: Techniques for Spectral Detection and Classification. Springer Science & Business Media. ISBN 978-0-306-47483-5.
- ^ Hans Grahn; Paul Geladi (27 September 2007). Techniques and Applications of Hyperspectral Image Analysis. John Wiley & Sons. ISBN 978-0-470-01087-7.
- ^ Hagen, Nathan; Kudenov, Michael W. (2013). "Review of snapshot spectral imaging technologies" (PDF). Optical Engineering. 52 (9) 090901. Bibcode:2013OptEn..52i0901H. doi:10.1117/1.OE.52.9.090901. S2CID 215807781.
- ^ a b Lu, G; Fei, B (January 2014). "Medical Hyperspectral Imaging: a review". Journal of Biomedical Optics. 19 (1) 10901. Bibcode:2014JBO....19a0901L. doi:10.1117/1.JBO.19.1.010901. PMC 3895860. PMID 24441941.
- ^ a b "Spectral Imaging and Linear Unmixing". Nikon's MicroscopyU.
- ^ a b c d Coltof, Gideon. "Hyperspectral Techniques Explained" (PDF). Bodkin Design & Engineering.
- ^ a b c Grusche, Sascha (2014). "OSA – Basic slit spectroscope reveals three-dimensional scenes through diagonal slices of hyperspectral cubes". Applied Optics. 53 (20): 4594–5103. Bibcode:2014ApOpt..53.4594G. doi:10.1364/AO.53.004594. PMID 25090082.
- ^ a b Schurmer, J.H., (Dec 2003), Air Force Research Laboratories Technology Horizons
- ^ "Earth Observing 1 (EO-1)". earthobservatory.nasa.gov. 2000-11-15. Retrieved 2020-07-17.
- ^ a b Ellis, J., (Jan 2001) Searching for oil seeps and oil-impacted soil with hyperspectral imagery Archived 2008-03-05 at the Wayback Machine, Earth Observation Magazine.
- ^ a b Lu, Guolan; Fei, Baowei (2014). "SPIE – Journal of Biomedical Optics – Medical hyperspectral imaging: a review". Journal of Biomedical Optics. 19 (1) 010901. Bibcode:2014JBO....19a0901L. doi:10.1117/1.JBO.19.1.010901. PMC 3895860. PMID 24441941.
- ^ "StackPath". www.laserfocusworld.com. Archived from the original on 2019-10-10. Retrieved 2021-08-20.
- ^ Hagen, Nathan; Kester, Robert T.; Gao, Liang; Tkaczyk, Tomasz S. (2012). "SPIE – Optical Engineering – Snapshot advantage: a review of the light collection improvement for parallel high-dimensional measurement systems". Optical Engineering. 51 (11) 111702. Bibcode:2012OptEn..51k1702H. doi:10.1117/1.OE.51.11.111702. PMC 3393130. PMID 22791926.
- ^ Myrick, Michael L.; Soyemi, Olusola O.; Haibach, Fred; Zhang, Lixia; Greer, Ashley; Li, Hongli; Priore, Ryan; Schiza, Maria V.; Farr, J. R. (2002-02-22). Christesen, Steven D; Sedlacek Iii, Arthur J (eds.). "Application of multivariate optical computing to near-infrared imaging". Vibrational Spectroscopy-Based Sensor Systems. 4577: 148–158. Bibcode:2002SPIE.4577..148M. doi:10.1117/12.455732. S2CID 109007082.
- ^ J Priore, Ryan; Haibach, Frederick; V Schiza, Maria; E Greer, Ashley; L Perkins, David; Myrick, M.L. (2004-08-01). "Miniature Stereo Spectral Imaging System for Multivariate Optical Computing". Applied Spectroscopy. 58 (7): 870–3. Bibcode:2004ApSpe..58..870P. doi:10.1366/0003702041389418. PMID 15282055. S2CID 39015203.
- ^ Davis, Brandon M.; Hemphill, Amanda J.; Cebeci Maltaş, Derya; Zipper, Michael A.; Wang, Ping; Ben-Amotz, Dor (2011-07-01). "Multivariate Hyperspectral Raman Imaging Using Compressive Detection". Analytical Chemistry. 83 (13): 5086–5092. Bibcode:2011AnaCh..83.5086D. doi:10.1021/ac103259v. ISSN 0003-2700. PMID 21604741.
- ^ Hyperspectral imaging with spatiospectral images from a simple spectroscope. 12 July 2014. Archived from the original on 2021-12-19 – via YouTube.
- ^ Polder, Gerrit; Gowen, Aoife (27 February 2020). "The hype in spectral imaging" (PDF). Journal of Spectral Imaging. 9 a4. doi:10.1255/jsi.2020.a4 (inactive 11 September 2025). S2CID 213347436. Retrieved 23 July 2021.
{{cite journal}}: CS1 maint: DOI inactive as of September 2025 (link) - ^ CM Veys; et al. (2017). "An Ultra-Low-Cost Active Multispectral Crop Diagnostics Device" (PDF). IEEE Sensors Journal. 113: 1005–1007.
- ^ Smith, R.B. (July 14, 2006), Introduction to hyperspectral imaging with TMIPS Archived 2008-05-09 at the Wayback Machine, MicroImages Tutorial Web site
- ^ Lacar, F.M.; et al. (2001). "Use of hyperspectral imagery for mapping grape varieties in the Barossa Valley, South Australia". IGARSS 2001. Scanning the Present and Resolving the Future. Proceedings. IEEE 2001 International Geoscience and Remote Sensing Symposium (Cat. No.01CH37217). Vol. 6. pp. 2875–2877. doi:10.1109/IGARSS.2001.978191. hdl:2440/39292. ISBN 0-7803-7031-7. S2CID 61008168.
- ^ Ferwerda, J.G. (2005), Charting the quality of forage: measuring and mapping the variation of chemical components in foliage with hyperspectral remote sensing, Wageningen University, ITC Dissertation 126, 166p. ISBN 90-8504-209-7
- ^ Tilling, A.K., et al., (2006) Remote sensing to detect nitrogen and water stress in wheat, The Australian Society of Agronomy
- ^ Vermeulen, Ph.; et al. (2017). "Assessment of pesticide coating on cereal seeds by near infrared hyperspectral imaging" (PDF). Journal of Spectral Imaging. 6 a1. doi:10.1255/jsi.2017.a1 (inactive 11 September 2025).
{{cite journal}}: CS1 maint: DOI inactive as of September 2025 (link) - ^ Fernández Pierna, J.A., et al., 'Combination of Support Vector Machines (SVM) and Near Infrared (NIR) imaging spectroscopy for the detection of meat and bone meat (MBM) in compound feeds' Journal of Chemometrics 18 (2004) 341-349
- ^ Gardner, Elizabeth K. "Study finds that heavy metal-contaminated leafy greens turn purple". Purdue University. Retrieved 26 January 2022.
- ^ Zea, Maria; Souza, Augusto; Yang, Yang; Lee, Linda; Nemali, Krishna; Hoagland, Lori (1 January 2022). "Leveraging high-throughput hyperspectral imaging technology to detect cadmium stress in two leafy green crops and accelerate soil remediation efforts". Environmental Pollution. 292 (Pt B) 118405. Bibcode:2022EPoll.29218405Z. doi:10.1016/j.envpol.2021.118405. ISSN 0269-7491. PMID 34710518. S2CID 239975631.
- ^ a b Pinto, Francisco; Mielewczik, Michael; Liebisch, Frank; Walter, Achim; Greven, Hartmut; Rascher, Uwe (2013), "Non-Invasive Measurement of Frog Skin Reflectivity in High Spatial Resolution Using a Dual Hyperspectral Approach.", PLOS ONE, vol. 8, no. 9, Bibcode:2013PLoSO...873234P, doi:10.1371/journal.pone.0073234, hdl:20.500.11850/76533, PMC 3776832, PMID 24058464
- ^ Mielewczik, Michael; Liebisch, Frank; Walter, Achim; Greven, Hartmut. "Near-infrared (NIR)-reflectance in insects–Phenetic studies of 181 species". Entomologie Heute. 24: 183–215.
- ^ Karaca, Ali Can; Erturk, Alp; Gullu, M. Kemal; Elmas, M.; Erturk, Sarp (June 2013). "Automatic waste sorting using shortwave infrared hyperspectral imaging system". 2013 5th Workshop on Hyperspectral Image and Signal Processing: Evolution in Remote Sensing (WHISPERS). pp. 1–4. doi:10.1109/WHISPERS.2013.8080744. ISBN 978-1-5090-1119-3. S2CID 37092593.
- ^ Brunn, Michael (1 September 2020). "Hyperspectral imaging reducing textile waste". RECYCLING magazine. Retrieved 26 January 2022.
- ^ "Specim launches complete spectral imaging platform for the sorting industry". optics.org. Retrieved 26 January 2022.
- ^ Qureshi, Muhammad Saad; Oasmaa, Anja; Pihkola, Hanna; Deviatkin, Ivan; Tenhunen, Anna; Mannila, Juha; Minkkinen, Hannu; Pohjakallio, Maija; Laine-Ylijoki, Jutta (1 November 2020). "Pyrolysis of plastic waste: Opportunities and challenges". Journal of Analytical and Applied Pyrolysis. 152 104804. Bibcode:2020JAAP..15204804Q. doi:10.1016/j.jaap.2020.104804. ISSN 0165-2370. S2CID 200068035.
- ^ "Breakthrough in separating plastic waste: Machines can now distinguish 12 different types of plastic". Aarhus University. Retrieved 19 January 2022.
- ^ Henriksen, Martin L.; Karlsen, Celine B.; Klarskov, Pernille; Hinge, Mogens (1 January 2022). "Plastic classification via in-line hyperspectral camera analysis and unsupervised machine learning". Vibrational Spectroscopy. 118 103329. Bibcode:2022VibSp.11803329H. doi:10.1016/j.vibspec.2021.103329. ISSN 0924-2031. S2CID 244913832.
- ^ "Home". Optina.
- ^ AM Shahidi; et al. (2013). "Regional variation in human retinal vessel oxygen saturation". Experimental Eye Research. 113: 143–147. doi:10.1016/j.exer.2013.06.001. PMID 23791637.
- ^ Higgins, Kevin. "Five New Technologies for Inspection". Food Processing. Archived from the original on 15 August 2013. Retrieved 6 September 2013.
- ^ "Hyperspectral Imaging Fights Food Waste". www.photonics.com. Retrieved 26 January 2022.
- ^ Burgstaller, Markus; et al. (February 2012). "Spotlight: Spectral Imaging Sorts 'Sugar-End' Defects". PennWell.
- ^ Dacal-Nieto, Angel; et al. (2011). Non-Destructive Detection of Hollow Heart in Potatoes Using Hyperspectral Imaging (PDF). Springer. pp. 180–187. ISBN 978-3-642-23677-8. Archived from the original (PDF) on 2014-08-10.
- ^ Dacal-Nieto, Angel; et al. (2011). "Common Scab Detection on Potatoes Using an Infrared Hyperspectral Imaging System". Image Analysis and Processing – ICIAP 2011. Lecture Notes in Computer Science. Vol. 6979. pp. 303–312. doi:10.1007/978-3-642-24088-1_32. ISBN 978-3-642-24087-4.
- ^ a b c Holma, H., (May 2011), Thermische Hyperspektralbildgebung im langwelligen Infrarot Archived July 26, 2011, at the Wayback Machine, Photonik
- ^ Werff H. (2006), Knowledge based remote sensing of complex objects: recognition of spectral and spatial patterns resulting from natural hydrocarbon seepages, Utrecht University, ITC Dissertation 131, 138p. ISBN 90-6164-238-8
- ^ Noomen, M.F. (2007), Hyperspectral reflectance of vegetation affected by underground hydrocarbon gas seepage, Enschede, ITC 151p. ISBN 978-90-8504-671-4.
- ^ Di, Wei; Zhang, Lei; Zhang, David; Pan, Quan (November 2010). "Studies on Hyperspectral Face Recognition in Visible Spectrum With Feature Band Selection". IEEE Transactions on Systems, Man, and Cybernetics - Part A: Systems and Humans. 40 (6): 1354–1361. Bibcode:2010ITSMA..40.1354D. CiteSeerX 10.1.1.413.3801. doi:10.1109/TSMCA.2010.2052603. S2CID 18058981.
- ^ Frost & Sullivan (Feb 2011). Technical Insights, Aerospace & Defence: World First Thermal Hyperspectral Camera for Unmanned Aerial Vehicles.
- ^ Specim's Owl sees an invisible object and identifies its materials even in a pitch-dark night. Archived 2011-02-21 at the Wayback Machine.
- ^ "FLAMES – Fibre Large Array Multi Element Spectrograph". ESO. Retrieved 30 November 2012.
- ^ "SINFONI – Spectrograph for INtegral Field Observations in the Near Infrared". ESO. Retrieved 30 November 2012.
- ^ M. Chamberland, V. Farley, A. Vallières, L. Belhumeur, A. Villemaire, J. Giroux et J. Legault, "High-Performance Field-Portable Imaging Radiometric Spectrometer Technology For Hyperspectral imaging Applications," Proc. SPIE 5994, 59940N, September 2005.
- ^ Farley, V., Chamberland, M., Lagueux, P., et al., "Chemical agent detection and identification with a hyperspectral imaging infrared sensor," Archived 2012-07-13 at archive.today Proceedings of SPIE Vol. 6661, 66610L (2007).
- ^ Gross, Kevin C.; Bradley, Kenneth C.; Perram, Glen P. (2010). "Remote Identification and Quantification of Industrial Smokestack Effluents via Imaging Fourier-Transform Spectroscopy". Environmental Science & Technology. 44 (24): 9390–9397. Bibcode:2010EnST...44.9390G. doi:10.1021/es101823z. PMID 21069951.
- ^ a b Abdellatif, Mohamed; Peel, Harriet; Cohn, Anthony G.; Fuentes, Raul (2020). "Pavement Crack Detection from Hyperspectral Images Using a Novel Asphalt Crack Index". Remote Sensing. 12 (18): 3084. Bibcode:2020RemS...12.3084A. doi:10.3390/rs12183084.
- ^ Lu, Guolan; Fei, Baowei (2014). "Medical hyperspectral imaging: a review". Journal of Biomedical Optics. 19 (1) 010901. Bibcode:2014JBO....19a0901L. doi:10.1117/1.JBO.19.1.010901. ISSN 1083-3668. PMC 3895860. PMID 24441941.
- ^ A. Picon, O. Ghita, P.F. Whelan, P. Iriondo (2009), Spectral and Spatial Feature Integration for Classification of Non-ferrous Materials in Hyper-spectral Data, IEEE Transactions on Industrial Informatics, Vol. 5, N° 4, November 2009.
- ^ Ran, Lingyan; Zhang, Yanning; Wei, Wei; Zhang, Qilin (2017-10-23). "A Hyperspectral Image Classification Framework with Spatial Pixel Pair Features". Sensors. 17 (10): 2421. Bibcode:2017Senso..17.2421R. doi:10.3390/s17102421. PMC 5677443. PMID 29065535.
External links
[edit]- ASTER Spectral Library (compilation of over 2400 spectra of natural and man made materials)
- Sample Hyperspectral (AVIRIS) images from JPL
- HyperSpy – multidimensional data analysis with python
| Vibrational (IR) | |||||||
|---|---|---|---|---|---|---|---|
| UV–Vis–NIR "Optical" | |||||||
| X-ray and Gamma ray | |||||||
| Electron | |||||||
| Nucleon | |||||||
| Radiowave | |||||||
| Others |
| ||||||
Hyperspectral imaging
View on GrokipediaFundamentals
Definition and Principles
Hyperspectral imaging is a technique that captures and processes images across a wide range of the electromagnetic spectrum, acquiring data in hundreds of contiguous narrow spectral bands, typically spanning the visible to short-wave infrared regions from approximately 400 to 2500 nm.[1] This approach produces a three-dimensional hyperspectral data cube, where two dimensions represent spatial information (x and y coordinates of the image) and the third dimension encodes the spectral information (λ) for each pixel.[7] Unlike traditional imaging, which captures only a few broad bands, hyperspectral imaging enables the detailed characterization of materials by recording the full spectrum of reflected, absorbed, or transmitted light at every spatial location.[8] The core principles of hyperspectral imaging rely on the fundamental interactions of light with matter, governed by phenomena such as absorption, reflection, and transmission across different wavelengths of the electromagnetic spectrum. In the visible (400-700 nm), near-infrared (700-1000 nm), and short-wave infrared (1000-2500 nm) regions, these interactions produce unique spectral signatures that correspond to molecular compositions and structures.[9] For instance, the reflectance spectrum of vegetation or minerals exhibits distinct patterns due to electronic transitions and vibrational modes, allowing for precise material identification.[1] This is underpinned by the Lambert-Beer law, which describes the linear relationship between the absorption of light and the concentration of absorbing species in a medium, stating that absorbance A is proportional to concentration c, path length l, and the molar absorptivity ε at a given wavelength: .[10] By measuring how light intensity decreases through or reflects off a sample, hyperspectral imaging quantifies these interactions to reveal compositional details. A key feature enabling this discrimination is the high spectral resolution of hyperspectral systems, which typically employs narrow bandwidths of 5-10 nm per band, allowing detection of subtle variations in molecular absorption and emission features that broader systems might overlook.[11] This fine resolution facilitates the differentiation of materials with similar appearances but distinct chemical properties, such as various types of minerals or plant health indicators, by resolving narrow spectral lines in the data.[1] The resulting data cube is formed by stacking multiple two-dimensional spatial images, each captured at a specific wavelength, into a single volume; for example, a 512 × 512 pixel image acquired across 200 spectral bands yields a 512 × 512 × 200 data cube containing over 50 million spectral measurements.[7] This structure preserves both spatial context and spectral continuity, providing a comprehensive dataset for subsequent analysis of light-matter interactions and material properties.[8]Historical Development
The roots of hyperspectral imaging trace back to the 1970s, when early efforts in remote sensing focused on capturing detailed spectral data for geological mapping. In the early 1980s, NASA's Jet Propulsion Laboratory (JPL) developed the Airborne Imaging Spectrometer (AIS), a pioneering instrument mounted on aircraft to acquire hyperspectral data across 128 contiguous bands in the visible and near-infrared regions, primarily for mineral identification and Earth surface analysis.[12] This system marked the transition from multispectral to hyperspectral approaches, enabling finer discrimination of materials based on their unique spectral signatures. The AIS was operational in 1983, laying the groundwork for more advanced sensors. The first fully operational hyperspectral system emerged in the late 1980s with the Airborne Visible/Infrared Imaging Spectrometer (AVIRIS), deployed by NASA in 1987 on the ER-2 aircraft. AVIRIS expanded spectral coverage to 224 bands from 400 to 2500 nm, providing high-fidelity data for environmental and geological studies, and remains in use today with upgrades.[13] During this period, military applications gained traction, particularly in the late 1980s for detecting camouflage through spectral analysis of obscured targets, as explored in early U.S. Department of Defense initiatives. NASA's JPL played a central role in these developments, leading instrument design and calibration efforts that bridged airborne testing to broader applications. By the 1990s, the technology expanded to spaceborne platforms, exemplified by the Hyperion instrument on NASA's Earth Observing-1 (EO-1) satellite, launched on November 21, 2000, which delivered 220 contiguous bands for global Earth observation.[14] Post-1990s, hyperspectral imaging shifted from predominantly military and research uses to civilian domains, driven by declassification of technologies and growing commercial interest. The 2010s saw significant advancements in portable sensors, with companies like Headwall Photonics introducing compact, field-deployable systems weighing under 5 kg and covering over 200 bands, facilitating on-site applications in agriculture and mining.[15] Technologically, the field evolved from analog whiskbroom scanners in the 1980s, which captured about 100 bands, to digital pushbroom and snapshot sensors today offering over 400 bands, enabled by improvements in focal plane arrays and computing power that reduced data processing times from days to hours.[15] Recent developments through 2025 have integrated artificial intelligence for real-time hyperspectral data analysis, with convolutional neural networks accelerating classification tasks on airborne and satellite platforms.[16] A key milestone is the European Space Agency's (ESA) and German Aerospace Center's (DLR) EnMAP mission, launched on April 1, 2022, which provides 242 spectral bands from 420 to 2450 nm for high-resolution global environmental monitoring, entering routine operations in November 2022.[17] In 2024, NASA's AVIRIS-4 airborne imaging spectrometer entered service, offering improved signal-to-noise ratio and extended spectral coverage from 375 to 2504 nm across 338 bands.[18]Technology
Sensors and Hardware
Hyperspectral imaging systems rely on specialized sensors to capture high-dimensional data across numerous narrow spectral bands, typically spanning the visible, near-infrared (VNIR), short-wave infrared (SWIR), and mid-wave infrared (MWIR) regions. The primary sensor types include whiskbroom (point scanners), which mechanically scan a single pixel across the scene while dispersing light spectrally; pushbroom (line scanners), which image an entire line of pixels simultaneously and build the scene through motion; and snapshot sensors, which use 2D focal plane arrays to capture the full spatial-spectral datacube in a single exposure without scanning. Detector materials are selected based on the target spectral range, with charge-coupled devices (CCD) or complementary metal-oxide-semiconductor (CMOS) arrays commonly used for VNIR (400-1000 nm) due to their high quantum efficiency and low noise. For SWIR (1000-2500 nm), indium gallium arsenide (InGaAs) detectors provide extended sensitivity with cutoff wavelengths up to 2.65 μm when tuned with indium phosphide substrates, while mercury cadmium telluride (HgCdTe) is preferred for MWIR and long-wave infrared applications owing to its tunable bandgap and high detectivity.[19][20][21] Recent advancements as of 2024 include colloidal quantum dot (CQD) detectors, such as lead sulfide (PbS) CQDs, enabling single-pixel detection in the near-infrared range (1050–1630 nm) with average spectral resolution of 8.59 nm, superior signal-to-noise ratio, and lower costs compared to traditional focal plane arrays.[22] Core hardware components encompass spectrometers for spectral dispersion and optics for light collection. Grating-based spectrometers employ diffraction gratings to separate wavelengths onto linear detector arrays, offering high spectral resolution (e.g., 5-10 nm) but requiring precise alignment to minimize aberrations. Fourier transform spectrometers, in contrast, use interferometry—such as Michelson or Sagnac configurations—to encode spectral information via interference patterns, enabling broader spectral coverage and higher signal-to-noise ratios (SNR) through multiplexing, though they demand computational reconstruction. Optics typically include collimators to parallelize incoming light, slit apertures for spectral isolation, and bandpass filters to reject out-of-band radiation, ensuring efficient coupling to the detector.[23][24][25] Performance metrics define sensor capabilities, with typical spectral ranges covering 400-2500 nm to encompass key molecular absorption features. Spatial resolutions vary by platform, achieving 1-30 m for airborne systems to balance coverage and detail. A high SNR, often exceeding 100:1, is essential for distinguishing subtle spectral signatures amid noise from photon shot, read-out, or dark current sources.[9][26][27] These sensors integrate with diverse platforms for operational flexibility. Airborne systems, mounted on drones or aircraft, enable high-resolution surveys over variable terrains; spaceborne instruments on satellites provide global monitoring with revisit times of days; and ground-based setups, such as handheld or tripod-mounted units, support close-range, real-time applications like material inspection.[9][28][29] Accurate data requires rigorous calibration to mitigate errors from environmental and instrumental factors. Radiometric calibration converts raw digital numbers to radiance or reflectance using integrating spheres or field references, correcting for detector response variations. Spectral calibration aligns measured wavelengths to true values via monochromatic sources like lasers, accounting for grating drift. Geometric calibration rectifies distortions from optics or platform motion, often using ground control points to ensure pixel-level accuracy. These processes collectively address atmospheric attenuation and sensor instabilities, enabling quantitative analysis.[30][31]Data Acquisition Methods
Hyperspectral imaging data acquisition methods encompass a range of techniques designed to capture both spatial and spectral information simultaneously or sequentially, enabling the formation of three-dimensional datacubes where two dimensions represent spatial coordinates and the third represents wavelength. These methods can be broadly categorized into scanning and non-scanning approaches, each balancing factors such as acquisition speed, spatial resolution, spectral fidelity, and signal-to-noise ratio (SNR). Scanning methods typically involve mechanical or optical movement to build the datacube over time, while non-scanning or snapshot methods capture the entire scene in a single exposure, making them suitable for dynamic environments.[9] Spatial scanning, also known as whiskbroom or point scanning, employs a mirror or scanning mechanism to direct light from individual pixels across the scene onto a spectrometer, acquiring one spatial point at a time while dispersing the spectrum for all wavelengths simultaneously. This approach uses a single detector or small array, with the scanning mirror oscillating to cover the field of view pixel-by-pixel, resulting in high spectral and spatial resolution but requiring longer acquisition times for large scenes. The Airborne Visible/Infrared Imaging Spectrometer (AVIRIS), a seminal whiskbroom instrument developed by NASA, exemplifies this method by using a scanning mirror to produce images with 224 contiguous spectral bands at 10-20 nm resolution across 400-2500 nm, achieving high fidelity for Earth observation applications.[32][33] Spectral scanning techniques sequentially capture different wavelength bands across the entire spatial field of view using tunable optical elements, allowing a fixed imaging sensor to record images one spectral band at a time. Common implementations include acousto-optic tunable filters (AOTFs), which use acoustic waves in a crystal to diffract and select specific wavelengths rapidly, and Fabry-Pérot etalons, which are interferometric cavities that tune the transmission band by adjusting the cavity length via voltage or piezoelectrics. AOTFs enable fast switching (microseconds) for applications like real-time biomedical imaging, while Fabry-Pérot etalons provide narrow bandpass control (down to 10 nm) for high-resolution spectral selectivity in the infrared. These methods are advantageous for static scenes but can introduce artifacts from temporal changes during sequential acquisition.[34][35] Non-scanning or snapshot methods acquire the full spatiospectral datacube in a single integration period, ideal for imaging fast-moving or time-varying scenes such as in video-rate applications. One prominent example is the computed tomography imaging spectrometer (CTIS), which disperses the scene's light through a diffractive optical element onto a focal plane array, encoding spatial and spectral information into a two-dimensional dispersed image that is computationally reconstructed into a hyperspectral cube. Mosaic filter arrays, akin to Bayer filters but with multiple narrowband interference filters deposited on sensor pixels, enable compact, video-rate hyperspectral imaging by capturing interleaved spatial-spectral data directly, though at the cost of reduced per-band resolution. Emerging compressive sensing approaches, such as single-pixel imaging using quantum dot filters, further enhance non-scanning capabilities by reconstructing hyperspectral data from modulated measurements, achieving high SNR in the NIR with reduced hardware complexity.[36][22] These techniques support frame rates up to 30 Hz or higher, facilitating applications in surveillance and robotics. Spatiospectral scanning, often exemplified by pushbroom methods, combines line-wise spatial scanning with spectral dispersion to acquire one spatial line of the scene at a time, where each pixel in the line has its full spectrum measured simultaneously via a dispersive element like a prism or grating. As the sensor platform moves forward (e.g., in airborne systems), successive lines build the image, offering a compromise between speed and resolution by utilizing linear detector arrays. This hybrid approach is widely used in satellite and UAV-based systems for efficient coverage of large areas, such as environmental monitoring, with acquisition speeds enhanced by the platform's motion.[37] Trade-offs among these methods primarily revolve around acquisition speed, resolution, and SNR; for instance, scanning techniques like whiskbroom provide superior SNR and resolution (e.g., >1000:1 in AVIRIS) but are slower, taking seconds to minutes per frame, whereas snapshot methods excel in speed for dynamic scenes yet suffer lower SNR due to light dilution across dispersed elements or reduced per-band exposure. Pushbroom and spectral scanning offer intermediate performance, with pushbroom favoring extended spatial coverage at the expense of cross-track resolution uniformity. Selection depends on the application, such as high-fidelity static mapping via whiskbroom versus real-time analysis via snapshot CTIS.[38][32]Comparison to Related Techniques
Hyperspectral vs. Multispectral Imaging
Hyperspectral imaging and multispectral imaging both capture spectral data across multiple wavelengths but differ fundamentally in spectral resolution and data granularity. Hyperspectral imaging acquires data in hundreds of contiguous narrow spectral bands, typically 200 or more bands with widths of around 10 nm, enabling detailed spectral signatures akin to spectroscopy.[39] In contrast, multispectral imaging uses a smaller number of discrete broader bands, often 3 to 10 bands with widths ranging from 50 to 200 nm, as seen in systems like the Landsat satellites.[40] These differences arise from the design of sensors: hyperspectral systems scan or snapshot across fine intervals in the electromagnetic spectrum, while multispectral systems filter into predefined coarse channels.[41] Historically, multispectral imaging predates hyperspectral techniques, with roots in early 20th-century photography experiments and widespread adoption in the 1960s through aerial photography for remote sensing.[42] NASA's Landsat 1 in 1972 marked a key milestone with its four-band Multispectral Scanner, focusing on broad land cover mapping.[39] Hyperspectral imaging emerged in the 1970s from field spectroscopy efforts supporting Landsat analysis, with NASA's Airborne Visible/Infrared Imaging Spectrometer (AVIRIS) in 1987 extending multispectral methods to provide spectroscopy-like detail for material identification.[12] The richer data from hyperspectral imaging allows for fine-grained material discrimination, such as distinguishing specific types of crop stress through unique spectral absorption features, whereas multispectral imaging supports coarser classifications like general land cover types or vegetation health.[40] This enhanced resolution in hyperspectral data stems from its contiguous bands, which capture subtle variations in reflectance that broad multispectral bands average out.[43] Hyperspectral imaging generates significantly larger data volumes, often gigabytes per scene due to the high number of bands and pixels, imposing greater computational demands for storage, processing, and analysis compared to the more efficient multispectral data suitable for broad-scale monitoring.[44] Specialized algorithms and hardware are typically required to handle hyperspectral datasets, while multispectral processing can often occur in near real-time with standard tools.[45]| Aspect | Hyperspectral Imaging | Multispectral Imaging |
|---|---|---|
| Number of Bands | 200+ contiguous bands | 3–10 discrete bands |
| Band Width | ~10 nm | 50–200 nm |
| Data Volume per Scene | Gigabytes | Megabytes |
| Primary Strength | Fine material discrimination | Efficient broad classification |