
Community hub
Recent from talks
Contribute something
Nothing was collected or created yet.
Proof-of-payment
View on Wikipedia
_03.jpg)
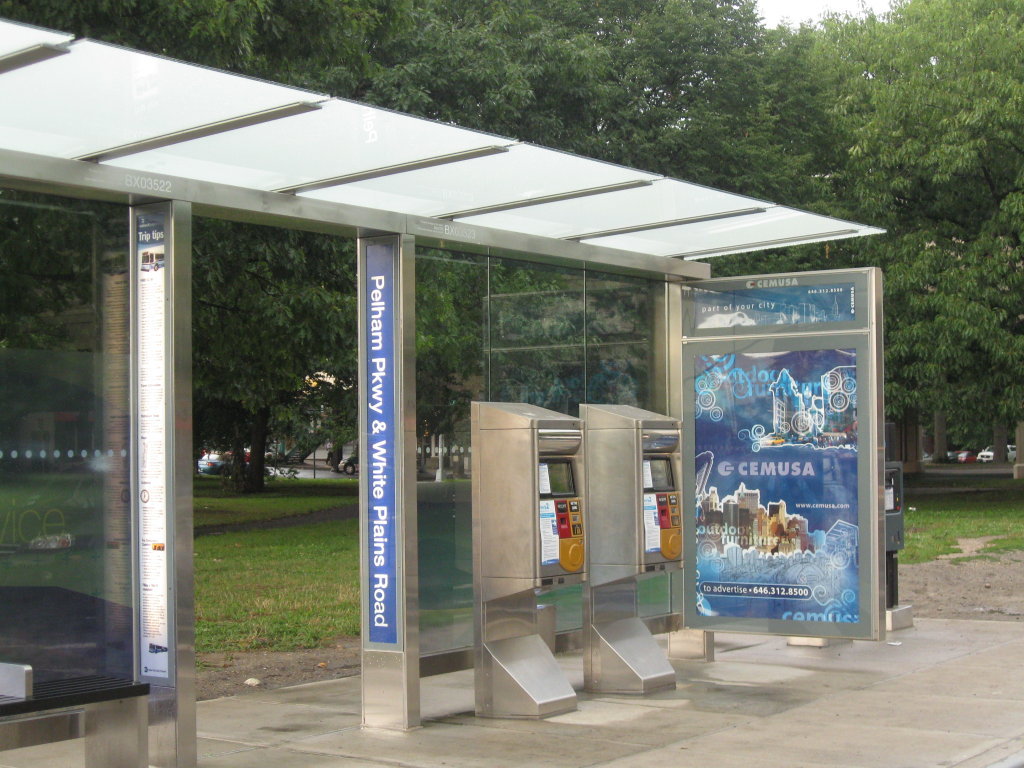
Proof-of-payment (POP) or proof-of-fare (POF) is an honor-based fare collection system used on many public transportation systems. Instead of checking each passenger as they enter a fare control zone, passengers are required to carry a paper ticket, transit pass, transit smartcard — or open payment methods such as contactless credit or debit cards (if applicable) — after swiping or tapping on smart card readers, to prove that they have paid the valid fare. Fares are enforced via random spot-checks by inspectors such as conductors or enforcement officers, to ensure that passengers have paid their fares and are not committing fare evasion. On many systems, a passenger can purchase a single-use ticket or multi-use pass at any time in advance, but must insert the ticket or pass into a validation machine immediately before use. Validation machines in stations or on board vehicles time stamp the ticket. The ticket is then valid for some period of time after the stamped time.
This method is implemented when the transit authority believes it will lose less money to the resultant fare evasion than it would cost to install and maintain a more direct collection method. It may be used in systems whose passenger volume and density are not very high most of the time—as passenger volumes increase, more-direct collection methods become more profitable. However, in some countries it is common even on systems with very high passenger volume. Proof-of-payment is usually applied on one-person operated rail and road vehicles as well as on automatically operated rail lines.
The honor system can be complemented with a more direct collection approach where this would be feasible—a transit authority using POP will usually post fare inspectors, sometimes armed as a police force, to man entrances to stations on a discretionary basis when a high volume of passengers is expected. For example, transit users leaving a stadium after a major concert or sporting event will likely have to buy a ticket from an attendant (or show proof of payment) to gain access to the station serving the stadium. Direct fare collection methods may also be used at major hubs in systems that otherwise use POP. An example of this is the Tower City station on Cleveland's RTA Rapid Transit Red Line, which uses faregates.
Travel without a valid ticket is not usually a criminal offense, but a penalty fare or a fine can be charged.
Advantages and disadvantages
[edit]Advantages of proof-of-payment include lower labor costs for fare collection, simpler station design, easier access for mobility-impaired passengers, easier access for those carrying packages or in case of an emergency, and a more open feel for passengers. On buses, proof-of-payment saves drivers the time needed to collect fares, and makes it possible for all doors to be used for boarding. Validated tickets can double as transfers between lines. Collecting fares outside a bus "offers the greatest potential for reducing dwell time."[1]
Disadvantages include higher rates of fare evasion, reduced security on station platforms when no barrier is used, increased potential of racial profiling and other unequal enforcement as "likely fare evaders" are targeted, and regularly exposing passengers to unpleasant confrontational situations when a rider without the proper proof is detained and removed from the vehicle. Visitors unfamiliar with a system's validation requirements who innocently misunderstand the rules are especially likely to get into trouble.
Worldwide uses
[edit]Proof-of-payment is popular in Germany, where it was widely introduced during the labor shortages resulting from the Economic Miracle of the 1960s. It has also been adopted in Eastern Europe and Canada and has made some inroads in newer systems in the United States. The first use of the term "POP" or "Proof of Payment" on a rail line in North America is believed to have been in Edmonton in 1980. Since then, many new light rail, streetcar, and bus rapid transit systems have adopted the procedure, mainly to speed up boarding by avoiding the hassles of crowding at doors to pay fares at a farebox beside the driver as is common practice on traditional buses. TriMet in Portland, Oregon was the first large transit agency to adopt proof of payment on its bus system, from September 1982 to April 1984. It was discontinued after finding that fare evasion and vandalism increased and little productivity was added through drivers waiting for fares to be paid.[2] San Francisco's MUNI system became the first North American system-wide adopter of the proof-of-payment system on July 1, 2012 across its buses, light rail and heritage streetcars, with the exception of cable cars, allowing boarding on all the available doors.[3]
References
[edit]- ^ "Fare Collection". Federal Transit Administration.
- ^ Wagner, Daniel; Harper, Wesley; Schueftan, Oliver (1986-09-01). "Self-Service Fare Collection on Buses in Portland, OR". TriMet Collection.
- ^ "Muni to begin all-door boarding for buses on July 1". San Francisco Examiner. Archived from the original on April 26, 2012. Retrieved March 17, 2012.
External links
[edit]| Bus service | |
|---|---|
| Rail | |
| Vehicles for hire | |
| Carpooling | |
| Ship | |
| Cable | |
| Other transport | |
| Locations | |
| Ticketing and fares |
|
| Routing | |
| Facilities | |
| Scheduling | |
| Politics | |
| Technology and signage | |
| Models | |
| Other topics | |
Proof-of-payment
View on GrokipediaHistory
Early Origins and Ticket-Based Systems
The earliest precursors to modern proof-of-payment systems appeared in the mid- to late 19th century with the advent of standardized railway ticketing, where passengers purchased paper tickets in advance at stations and presented them as proof of fare to onboard conductors for manual validation, often via clipping or punching to prevent reuse.[2] This method eliminated the need for immediate payment at boarding points and relied on periodic inspection rather than entry barriers, establishing the core principle of deferred verification to streamline operations on expanding rail networks.[2] In Britain, the Railway Clearing House's adoption of pre-printed, numbered cardboard tickets around 1842 facilitated interoperability and accountability across lines, with conductors enforcing compliance through spot checks.[6] Ticket-based systems extended to urban trams and early electric railways by the late 19th and early 20th centuries, particularly in North American streetcar networks, where prepurchased tickets functioned as receipts validated by conductors or transfer systems to allow seamless interline travel without repeated payments.[2] These setups prioritized efficiency over constant oversight, as conductors collected and punched tickets during travel, reducing dwell times at stops compared to cash-handling methods.[7] Fare evasion remained low initially due to cultural norms of compliance and the visible presence of uniformed inspectors, though it required robust numbering and anti-forgery features like embossed designs on tickets.[2] In continental Europe, ticket validation evolved toward self-service mechanisms by the mid-20th century, with passengers stamping or inserting paper tickets into onboard or platform machines to generate dated proof before random inspections by roving fare controllers.[8] This honor-based approach gained traction in the 1960s across systems like German trams and light rail, where it supported high-capacity operations without costly turnstiles, as inspectors used portable validators to confirm ticket authenticity during rides.[8] Empirical data from early implementations showed boarding speeds improved by 20-30% over pay-on-board models, though success hinged on inspection rates of 5-10% per trip to deter evasion effectively.[9]Evolution in 20th-Century Public Transit
In the mid-20th century, European public transit systems increasingly adopted proof-of-payment mechanisms on trams and buses to address rising labor costs and improve operational efficiency, shifting from conductor-enforced onboard collection to pre-validation or self-service ticketing with periodic inspections. This transition accelerated post-World War II as cities rebuilt infrastructure and sought to minimize staffing amid economic pressures, allowing vehicles to operate without dedicated fare collectors.[9] In Germany, buses and trains implemented the honor-based system widely from the 1960s onward, relying on passengers to validate tickets upon boarding or at stations, with enforcement via roving inspectors to deter evasion.[10] A notable example occurred in the Netherlands, where Amsterdam's Gemeente Vervoerbedrijf announced self-service operations for trams in July 1965, introducing validation machines to replace conductors and enable faster passenger flow without barriers.[11] This model emphasized passenger responsibility for fare compliance, supported by spot checks, and spread to other Dutch cities, reducing dwell times at stops by eliminating onboard transactions. Similar adaptations appeared in other Western European nations, such as Austria and Switzerland, where tram networks phased out conductors in favor of ticket punching or pre-purchase systems by the 1970s, fostering barrier-free designs that prioritized capacity over constant oversight.[12] By the late 20th century, proof-of-payment extended to urban rail and expanded bus services, influencing North American implementations amid growing light rail revivals. In the United States, early trials on buses, such as TriMet's Portland system from September 1982 to April 1984, tested the approach but faced challenges with evasion rates prompting discontinuation; however, it succeeded on light rail lines like those opening in the 1980s, where off-board validation supported high-frequency operations without turnstiles. These developments marked a causal shift toward systems balancing trust in riders with targeted enforcement, yielding data on evasion rates typically below 5% in mature European setups when inspection coverage exceeded 5-10% of trips.[4]Expansion with Bus Rapid Transit in the Late 20th and Early 21st Centuries
The integration of proof-of-payment (PoP) systems gained momentum alongside the proliferation of bus rapid transit (BRT) networks starting in the late 1970s and accelerating through the 1980s and 1990s, as transit agencies prioritized rapid boarding to achieve higher capacities and reliability akin to rail systems.[13] Early BRT pioneers like Curitiba, Brazil's Rede Integrada de Transporte, implemented in 1974, featured off-board fare prepayment at dedicated tube stations to streamline passenger flow, though initial setups often included barriers rather than pure honor-based validation.[14] This approach reduced on-bus payment delays, setting a precedent for subsequent systems emphasizing pre-boarding fare handling.[15] In North America, Ottawa's OC Transpo introduced PoP in 1982 with the deployment of articulated buses, directly supporting the 1983 launch of the Transitway BRT corridor, which employed all-door boarding and random inspections to enforce compliance without fixed barriers.[16] [13] The system facilitated multiple-stream boarding at high-volume stations, cutting dwell times and enabling frequencies up to every 3-5 minutes during peak hours.[17] Similarly, Pittsburgh's busways, operational since the South Busway in 1977 and East Busway in 1983, experimented with off-board elements, though full PoP adoption lagged until later premium services influenced by rail precedents.[18] By the early 2000s, PoP became a standard feature in new BRT implementations to support gold-standard elements like platform-level boarding and headway adherence, as documented in Federal Transit Administration analyses of U.S. projects.[13] Examples include Las Vegas's MAX express service, launched in the mid-2000s, which utilized PoP for efficient fare verification and multi-door access, simulating rail operations.[13] This period saw global BRT mileage expand from pioneering late-20th-century corridors to over 5,000 km by 2010, with PoP contributing to empirical gains in passenger throughput, such as 20-30% reductions in boarding times observed in surveyed systems.[19] Enforcement relied on mobile inspector teams, achieving evasion rates typically under 5% in well-monitored routes.[4]Operational Principles
Core Mechanism and Validation Methods
Proof-of-payment systems require passengers to obtain and validate a fare medium, such as a ticket or electronic pass, prior to boarding transit vehicles or entering designated areas, without mandatory physical barriers or universal upfront checks.[3] This open-access approach facilitates rapid entry and exit, distinguishing it from gated or conductor-verified methods by relying on post-validation enforcement to ensure compliance.[1] Passengers typically validate fares at off-vehicle machines that imprint timestamps or activate digital media, confirming payment validity for the journey duration.[18] Validation enforcement occurs through randomized inspections by dedicated fare control personnel, who board vehicles or patrol stations to demand proof from selected riders.[20] Inspectors verify the fare medium's authenticity, validity period, and activation status, issuing citations or fines—often substantially higher than the base fare—for non-compliance.[4] In electronic implementations, portable readers may scan contactless cards or apps to confirm payment records against backend systems.[18] Inspection protocols emphasize unpredictability to deter evasion, with personnel deployment varying by route, time, and evasion risk factors.[4] Empirical models indicate optimal inspection frequencies around 3-4% of passengers to balance revenue recovery against operational costs, as higher rates yield diminishing returns while lower ones encourage widespread non-payment.[21] Systems may integrate data analytics to target high-evasion segments, enhancing efficiency without routine checks.[22]Enforcement Strategies and Inspection Protocols
Enforcement in proof-of-payment systems relies primarily on random or targeted inspections conducted by dedicated fare enforcement officers, who verify passengers' valid tickets, passes, or digital validations during spot-checks on vehicles or platforms.[18] These officers, employed directly by transit agencies in 60% of surveyed North American systems, often operate with police powers (58.6% of cases) and prioritize customer-oriented tactics such as warnings and education over immediate penalties.[18] Strategies include periodic sweeps covering entire vehicles or stations (used by 75.9% of agencies), data-driven deployment to high-evasion routes, and surges during peak hours or special events, where temporary barriers or additional staffing may supplement checks.[18] Inspection protocols typically involve teams of 2 to 6 officers boarding transit vehicles at stops, requesting proof of payment systematically from all passengers to minimize evasion opportunities, as seen in New York City Transit's "Eagle Team" model of closing doors post-boarding for comprehensive verification.[18] Officers use handheld validators for contactless media in 11 of 13 smart card systems and issue oral or written warnings (allowed by 96.5% of agencies), escalating to citations for non-compliance, with average first-offense fines of $121 and maximums up to $314.[18] In TriMet's Portland system, enforcement officers conduct non-discriminatory requests on platforms or trains, offering 90-day stays on citations for first-time violators to resolve via reduced fines ($75–$175) or community service, while repeat cases proceed to court with penalties up to $250.[23] Saturation audits, achieving 100% coverage, serve as supplements to random checks (average rate 11.3%, ranging 0.4%–30%) for accurate evasion measurement within ±2% error.[18] Variations emphasize safety and efficiency, with training in conflict resolution and verbal de-escalation required in programs like San Francisco Muni's, where inspectors lack arrest powers or weapons and focus on avoidance protocols, though inconsistent emergency guidelines have led to recommendations for regular retraining every three years.[24] Targeted inspections at "paid zones" (designated platforms in 70% of systems) integrate signage and multilingual outreach, while some agencies like Phoenix METRO employ weekly random sweeps enhanced by mobile validators since 2010.[18] Fare inspection remains the dominant global strategy against evasion in barrier-free networks, with optimization models balancing random and hotspot-focused scheduling to deter non-payment without universal coverage.[4]Integration with Fare Media Types
Proof-of-payment systems accommodate diverse fare media, enabling passengers to obtain verifiable proof of fare payment prior to boarding for subsequent inspection. Integration requires validation mechanisms that generate portable evidence, such as timestamps or digital confirmations, compatible with inspector verification tools. This flexibility supports transition from legacy paper-based methods to digital alternatives, though compatibility demands standardized interfaces for vending machines, validators, and handheld readers.[25] Paper tickets remain prevalent in many POP implementations, purchased via vending machines or ticket counters and validated by insertion into stamping devices that imprint date-time marks. These validated tickets serve as primary proof during random checks, as employed in bus rapid transit corridors like Quito's Ecovía, where manual stamping facilitates fare verification without barriers. However, paper media's vulnerability to forgery necessitates supplementary anti-fraud features, such as unique serial numbers or watermarks.[25] Smart cards and stored-value media integrate through contactless readers at station or platform validators, deducting fares and logging transactions in account-based systems. In Caltrain's network, Clipper cards must be tapped before boarding, with the card itself or issued receipt acting as proof; inspectors verify via portable readers confirming zone validity and activation dates. Similarly, Toronto's TTC accepts tapped PRESTO cards, applying two-hour transfers automatically, where failure to present a valid tap incurs fines up to $425.[26][27] Contactless open payments, including debit and credit cards, extend integration by allowing taps at validators akin to smart cards, often generating paper receipts as tangible proof to mitigate disputes during enforcement. These systems, standardized by payment networks, support rapid processing at 15-20 passengers per minute, as in select BRT setups, but require backend reconciliation to track usage without physical media retention.[25] Mobile ticketing apps provide digital fare media, where users purchase and activate tickets via smartphones, displaying QR codes or barcodes for inspector scanning with dedicated apps. San Francisco's MuniMobile exemplifies this, treating the activated on-screen ticket as proof-of-payment, valid for the journey duration and subject to retention post-alighting. Integration challenges include ensuring offline functionality and battery independence, addressed through time-stamped activations verifiable against central servers.[28]| Fare Media Type | Validation Mechanism | Proof of Payment Form | Example Systems |
|---|---|---|---|
| Paper Tickets | Stamping or printing at validators | Timestamped physical ticket | Quito Ecovía BRT[25] |
| Smart/Stored-Value Cards | Contactless tap at readers | Card presentation or receipt | Caltrain Clipper[26] |
| Contactless Bank Cards | Tap with EMV-enabled device | Digital log or printed receipt | TTC open payments[27] |
| Mobile Apps | App purchase and QR activation | On-screen digital ticket | SFMTA MuniMobile[28] |
Economic and Operational Benefits
Cost Reductions in Infrastructure and Staffing
Proof-of-payment (PoP) systems reduce infrastructure costs by eliminating the need for physical fare barriers such as turnstiles, gates, and extensive platform enclosures, which are capital-intensive to install and maintain, particularly in multi-station networks. For example, the Dallas Area Rapid Transit (DART) opted for PoP on its light rail lines, avoiding approximately $46 million in 2002 dollars that would have been required to install barriers at 59 stations.[18] Similarly, Phoenix's METRO light rail system selected PoP over a barrier-based approach to minimize upfront capital expenditures while accommodating at-grade stations and pedestrian access.[18] These savings extend to off-board fare collection points, where fewer or simplified ticket vending machines are needed compared to gated systems requiring validation hardware at every entry.[1] In bus rapid transit (BRT) and surface rail applications, PoP further lowers infrastructure demands by enabling all-door boarding without onboard fareboxes or driver-assisted collection devices, reducing vehicle modification costs and simplifying stop designs to basic shelters.[15] Bus systems like New York City's Select Bus Service exemplify this, where PoP allows for streamlined shelters without integrated payment kiosks at every door, contributing to broader capital efficiencies in high-volume corridors.[15] On staffing, PoP shifts fare enforcement from continuous onboard personnel to intermittent inspections, potentially decreasing overall labor requirements by obviating dedicated conductors or ticket collectors per vehicle. Traditional pay-on-board systems often necessitate one staff member per train or bus to handle transactions, whereas PoP relies on roving teams of inspectors who cover multiple routes, achieving economies of scale in personnel deployment.[1] For instance, agencies like the Los Angeles Metro have integrated PoP with selective gating to further reduce dependence on full-time fare-checkers, reallocating resources from routine collections to targeted enforcement.[18] The San Francisco Municipal Transportation Agency (SFMTA) employs 42 full-time fare inspectors and 5 supervisors for its PoP bus and rail operations, a fraction of what would be required for onboard staffing across its fleet.[18] However, this model incurs dedicated inspection costs, which empirical analyses indicate are offset by avoided onboard wages and faster operations in systems with low evasion rates.[15][1]Improvements in Boarding Speed and System Capacity
Proof-of-payment systems facilitate faster boarding by enabling passengers to validate fares off-vehicle prior to entry, allowing all-door boarding without on-board transaction delays. This eliminates bottlenecks associated with single-door, pay-on-board collection, where drivers handle payments and change, often extending dwell times. In multiple-door configurations typical of proof-of-payment implementations, passenger service times can drop to 0.6–1.5 seconds per passenger, depending on the number of door channels.[13] Empirical analyses indicate boarding time reductions of up to 38% compared to traditional systems.[13] Dwell time reductions from proof-of-payment have been documented across implementations, particularly in bus rapid transit corridors. For instance, San Francisco's systemwide adoption of all-door boarding with proof-of-payment enforcement yielded a 37% average decrease in dwell times, with per-passenger dwell falling from 4.2 to 2.7 seconds and overall bus speeds rising by 2%.[15] In New York City's Select Bus Service routes, per-passenger dwell times declined by 28%–51% (e.g., 43% on the Bx12 and 51% on the M15), correlating with ridership increases of 6.3%–30%.[15] Ottawa's Transitway phases using proof-of-payment with articulated buses achieved 13%–21% dwell reductions, supporting higher service frequencies.[13] Off-board collection in such systems can halve per-passenger dwell times overall.[15] These boarding efficiencies enhance system capacity by minimizing vehicle dwell at stops, reducing congestion in loading areas, and enabling shorter headways or more trips per hour. In high-demand settings, faster throughput allows vehicles to handle greater passenger volumes without proportional increases in fleet size; for example, Vancouver's 99 B-Line saw a 17% per-passenger dwell reduction (1 second) and 3% overall trip time cut amid rising ridership.[15] Chicago trials with off-board payment demonstrated approximately 50% reductions in boarding dwell, underscoring potential for scaled capacity gains in proof-of-payment frameworks.[15] Such improvements prioritize operational flow over upfront verification, though they rely on effective enforcement to sustain benefits.[3]Empirical Evidence from Implementation Studies
In the Las Vegas MAX Bus Rapid Transit (BRT) system along North Las Vegas Boulevard, implementation of proof-of-payment (POP) with off-board ticket vending machines and multiple-door boarding yielded a 47% ridership increase from 17,100 daily passengers in 2002 to higher levels by 2004, attributed to reduced dwell times enabling faster service and higher throughput, with passenger service times as low as 0.6 seconds per passenger across six doors.[13] Potential dwell time reductions reached up to 38%, as supported by broader transit quality metrics, enhancing schedule adherence and operational reliability without onboard fare validation delays.[13] Ottawa's Transitway BRT, employing POP on articulated buses with three-door access, achieved 13-21% dwell time reductions from 1982 to 1984, alongside a 2% cut in overall running times, allowing fleet efficiency gains such as replacing three standard buses with two articulated units and thereby lowering driver hours and operating costs.[13] These outcomes facilitated simultaneous boarding and alighting, boosting system capacity and level-of-service in high-demand corridors.[29] A before-after evaluation of ticketing methods on Zaragoza's light rail line revealed that shifting from POP to pay-on-entry increased average journey times by 15%, reduced ridership by 10%, and necessitated 14% more vehicles (an additional 49 units) to sustain prior frequencies, highlighting POP's role in minimizing delays and supporting higher passenger volumes through streamlined, barrier-free operations. Such findings align with transit research emphasizing POP's capacity to halve per-passenger boarding times relative to front-door collection, though sustained enforcement is required to offset evasion risks.[29]Challenges and Empirical Drawbacks
Fare Evasion Rates and Causal Factors
Fare evasion rates in proof-of-payment (POP) systems vary significantly by region, enforcement rigor, and socioeconomic context, often exceeding those in barrier-enforced systems due to reliance on voluntary compliance. Empirical studies report average rates of around 4.2% across collective transport modes globally, with POP configurations showing higher prevalence in bus and light rail applications.[21] In European POP networks like those in Germany and Switzerland, rates typically range from 2-5%, supported by cultural norms of compliance and consistent inspections.[30] By contrast, U.S. implementations, such as New York City's Select Bus Service (a POP BRT variant), recorded bus evasion rates of 48% in early 2024, declining to 44% later that year amid intensified enforcement, while Los Angeles Metro reported 46% overall evasion in 2024, including POP elements.[31][32] Minneapolis-St. Paul light rail lines using POP averaged 8-12% evasion in 2020 audits.[33] The primary causal factor is the perceived probability of detection, as rational choice models demonstrate that evasion rises inversely with inspection frequency; for instance, optimizing inspections at 3.8% minimizes net losses by balancing deterrence against costs, based on data from 27,514 inspections revealing evasion sensitivity to enforcement presence.[34] Socioeconomic variables, including low income and unemployment, correlate strongly with higher evasion, as evidenced in Lisbon bus studies where disadvantaged demographics evaded at rates up to twice the system average, driven by affordability barriers rather than mere opportunism.[35] System design elements exacerbate this: complex fare structures and accidental non-compliance (e.g., ticket misuse) contribute 20-30% of cases in POP setups, while lax enforcement in high-density urban areas fosters habitual evasion by reducing perceived risks.[36] Empirical reviews of 113 studies identify multifaceted determinants, including service quality deficits (e.g., overcrowding enabling concealment) and low perceived legitimacy of fares, which amplify deliberate evasion in low-trust environments.[37] Psychological models distinguish deliberate evasion—tied to moral disengagement and low sanction certainty—from unintentional errors, with the former predominant in POP systems lacking physical barriers; interventions raising fine certainty reduced evasion by 15-20% in controlled Dutch rail experiments.[38] In U.S. contexts, socioeconomic disadvantage in neighborhoods predicts enforcement hotspots, suggesting causal links to poverty cycles where evasion substitutes for unaffordable fares, though this does not mitigate revenue losses exceeding $1 billion annually for agencies like New York's MTA.[39][40]Enforcement Costs and Resource Allocation
Enforcement in proof-of-payment systems requires substantial investment in personnel for random inspections, as agencies must deploy inspectors to verify fares without fixed barriers, leading to ongoing labor and operational expenses. These costs encompass salaries, training, equipment, and scheduling for coverage across vehicles and stations, often involving specialized teams or police auxiliaries. For example, in systems like Metro Transit's proof-of-payment operations, audits have revealed that fare enforcement processes demand dedicated police resources, yet struggle to quantify direct links between expenditures and evasion reductions.[33] Optimal resource allocation hinges on balancing inspector numbers against ridership volumes to achieve credible deterrence; studies derive an inspection rate of 3.8% as maximizing net revenue, derived from empirical data on 27,514 stop-level checks and 10,586 passenger interviews, beyond which marginal costs exceed recovered fares.[41] Game-theoretic models for patrol scheduling emphasize unpredictable deployment to counter evader adaptation, but limited budgets constrain inspector availability, potentially elevating evasion if perceived inspection probabilities fall below 5%. In King County's RapidRide corridors, a 2018 audit found transit authorities unable to assess enforcement efficiency, as data gaps hindered evaluation of costs relative to citations issued or evasion deterred, highlighting systemic challenges in resource optimization.[42][43] Caltrain's proof-of-payment enforcement, for instance, recovered $578,579 in fares during 2019 through citations, yet this figure pales against broader operational strains, including a projected $545 million deficit over a decade partly attributed to evasion persistence despite intensified checks.[44][45] Variations in enforcement efficacy arise from jurisdictional differences in inspector productivity and fine collection rates; for example, only 6-12% of civil citations in comparable systems yield payments, diminishing returns on allocated resources. Recent reviews underscore that cost-effectiveness demands data-driven strategies for inspector distribution, yet resource scarcity in underfunded agencies often results in suboptimal coverage, perpetuating higher evasion and necessitating trade-offs with other security or service priorities.[46][4]Security Risks and Mitigation Data
Proof-of-payment systems expose fare inspectors to elevated risks of verbal and physical assaults during verification checks, as passengers without valid payment may react confrontationally to evade fines. In San Francisco's Municipal Transportation Agency, transit fare inspectors reported over 130 incidents in 2006, approximately 400 in 2007, and around 200 in 2008, including multiple assaults linked to proof-of-payment enforcement interactions.[47] Technical reviews confirm that such assaults on inspectors occur frequently across proof-of-payment networks, stemming from the direct interpersonal nature of spot-checks without physical barriers.[4] These risks arise causally from the system's reliance on random, on-vehicle or platform verifications, which can provoke resistance from non-compliant riders, particularly in high-evasion environments where enforcement visibility is low.[4] Digital implementations of proof-of-payment, such as mobile apps or contactless cards, introduce data privacy vulnerabilities, including unauthorized tracking of rider locations and payment histories, potentially compromising personal security if breached. Transit agencies adopting new fare media must mitigate these through privacy-by-design principles, as lapses can erode public trust and expose users to identity theft or surveillance risks.[48] Broader system-level concerns include indirect safety impacts, where unchecked fare evasion correlates with increased disorder, such as loitering or minor crimes, heightening perceived insecurity for compliant passengers, though empirical links require site-specific analysis.[49] Mitigation strategies emphasize de-escalation training and operational protocols to reduce inspector exposure. Agencies like San Francisco's provide initial conflict resolution training but often rely on outdated materials; recommended enhancements include mandatory retraining every three years, digital incident logging for trend analysis, and standardized emergency response protocols to expedite police assistance during assaults.[47] Deploying unarmed civilian inspectors in teams, as practiced in systems like Berlin's, minimizes escalation risks compared to armed policing, fostering a customer-service-oriented approach over adversarial enforcement.[50] Technological aids, such as real-time digital verification tools and AI-assisted scheduling for inspections, further deter evasion while limiting direct confrontations by enhancing perceived enforcement coverage without proportional staff increases.[4] For digital proofs, encryption and tokenization protocols safeguard against breaches, with agencies required to comply with standards like PCI DSS for payment data handling.[48][51]| Mitigation Category | Key Measures | Empirical Basis |
|---|---|---|
| Personnel Training | Conflict de-escalation, quarterly safety reviews | Reduces reported incidents by standardizing responses; SFMTA data shows gaps in current protocols leading to inconsistent handling.[47] |
| Enforcement Model | Unarmed teams, selective over mass checks | Lowers violence risk per interaction; adopted in European POP systems with lower assault rates than policed models.[4] [50] |
| Technology Integration | Digital tools, AI scheduling | Improves deterrence efficiency; studies indicate up to 20-30% evasion reduction without added manpower exposure.[4] |
| Data Security | Privacy policies, tokenization | Prevents breaches in mobile proofs; recommended for all contactless systems to maintain rider compliance.[48] |
Global Adoption and Variations
European Systems and Honor-Based Traditions
Proof-of-payment systems have been extensively adopted across Europe, particularly in Germanic-speaking countries such as Germany, Austria, and Switzerland, where they operate under terms like Kontrollsystem or honor-based fare collection. These systems eliminate physical barriers at entry points, requiring passengers to validate tickets or holds passes prior to boarding via machines or onboard validators, with compliance enforced through random inspections by plainclothes controllers. This approach, prevalent on buses, trams, subways, and regional trains, dates back to at least the mid-20th century, with widespread implementation by the 1980s to enhance boarding efficiency and reduce infrastructure costs in high-volume networks.[12] In Germany, major operators like Berlin's BVG exemplify the model, where U-Bahn and S-Bahn lines feature no turnstiles, relying instead on passengers' self-validation and the deterrent of fines up to €60 for non-compliance. Similarly, Vienna's Wiener Linien network employs an honor system across its U-Bahn, trams, and buses, with passengers stamping single tickets upon entry and presenting proof during unannounced checks. Switzerland's regional transport, including SBB services, follows suit, integrating POP with integrated ticketing under Verkehrsverbünde frameworks that coordinate fares across modalities. These traditions stem from a cultural emphasis on civic responsibility and effective deterrence, yielding evasion rates typically below 5%, as evidenced by industry studies estimating an average of 4.2% in proof-of-payment bus systems.[21] The success of European honor-based systems hinges on rigorous enforcement protocols, including frequent random audits and substantial penalties that exceed standard fares by factors of 10 or more, fostering high voluntary compliance rates. For instance, in Vienna, operator-reported evasion hovered at 2-3% in recent years, attributed to visible inspector presence and public awareness campaigns. Unlike barrier-controlled setups, these systems prioritize fluid passenger flow, with empirical data showing reduced dwell times at stops—critical for maintaining schedule adherence in dense urban environments. However, sustained low evasion demands ongoing investment in inspection teams, as lapses can lead to revenue shortfalls, underscoring the causal link between enforcement intensity and system integrity.[21]North American Implementations and BRT Focus
In North America, proof-of-payment (POP) systems have been widely adopted in bus rapid transit (BRT) implementations to enable all-door boarding and reduce dwell times at stations. These systems typically involve passengers purchasing tickets or activating fares at station validators prior to boarding, with random inspections by enforcement teams verifying compliance. Early adopters include Canadian cities like Ottawa, where the Transitway network introduced POP fare collection on dedicated busways starting in the early 1980s, allowing articulated buses to board passengers through multiple doors while maintaining revenue through periodic checks.[52][53] New York City's Select Bus Service (SBS), launched in 2009 with the M15 route, exemplifies POP integration in urban BRT-like corridors, featuring off-board payment kiosks at stops and receipt validation on buses. By 2023, SBS encompassed 19 routes serving over 200,000 daily passengers, with enforcement yielding lower fare evasion rates than standard bus services—studies indicate SBS evasion around 5-10%, compared to 20-30% on local buses—due to dedicated inspector teams and fines up to $100 for violations.[54][55][56] Cleveland's HealthLine BRT, operational since October 2008 along a 9.2-mile corridor, utilizes POP with designated "fare paid zones" at stations equipped with ticket vending machines, supporting all-door boarding on electric articulated buses. The system initially relied on police-led inspections, but a 2017 municipal court ruling deemed warrantless searches unconstitutional, prompting a shift to unarmed civilian enforcers and temporary restrictions on multi-door access to mitigate evasion risks, which had hovered below 5% pre-ruling.[57][58][59] Other notable U.S. BRT examples include Los Angeles' Metro G Line (formerly Orange Line), a 18-mile busway since 2005 employing POP to achieve headways as low as 3-4 minutes during peak hours, and incremental BRT projects like those in Pittsburgh and Los Angeles suburbs, where POP vending machines at enhanced stations enable cashless pre-payment and random verification to boost throughput by 20-30% over traditional front-door collection. In Canada, York Region's VIVA network, initiated in 2005, applies POP across rapid bus routes with contactless smart cards, emphasizing enforcement to sustain low evasion under 3%. These implementations highlight POP's role in scaling BRT capacity without full barrier infrastructure, though success hinges on consistent enforcement resources.[60][61][62]Adoption in Other Regions and Emerging Markets
In Latin America, proof-of-payment systems have been widely adopted within Bus Rapid Transit (BRT) networks, particularly in cities facing rapid urbanization and budget constraints for infrastructure. Bogotá's TransMilenio, operational since December 2000, utilizes off-board fare collection with electronic cards or single-trip tickets purchased at stations, enabling all-door boarding and reducing dwell times to support peak-hour capacities exceeding 45,000 passengers per hour per direction.[63] Similarly, field assessments of South American BRT systems, including those in Curitiba (pioneered in 1974) and other Brazilian cities, highlight proof-of-payment or electronic off-board options as standard for minimizing boarding delays, with fares validated sporadically by inspectors rather than at entry points.[64] These implementations prioritize cost-effective scalability over barrier-enforced gates, aligning with regional emphases on high-volume service amid limited capital for rail alternatives.[13] In Southeast Asia, Jakarta's TransJakarta BRT, launched in January 2004 as one of the world's largest networks spanning over 250 kilometers, employs off-board automatic fare collection using contactless cards tapped at station gates or validators, functioning as a proof-of-payment model without mandatory on-bus checks for all riders.[65] This approach supports daily ridership above 1 million while integrating with multi-modal electronic payments, though periodic enforcement audits are required to curb evasion rates estimated at 5-10% in high-density corridors. Adoption here reflects emerging market priorities for integrating legacy bus operations with modern verification tech, avoiding the expense of full barriers. African cities have incorporated proof-of-payment in BRT rollouts to enhance efficiency in informal transport contexts. Johannesburg's Rea Vaya, introduced in phases starting February 2009, relies on smart card validation at dedicated stations or on-board readers, allowing proof-of-payment flows that eliminated cash handling on vehicles by 2010 and facilitated transfers across 30+ routes.[66] Lagos, Nigeria's BRT, operational since 2008, similarly shifted to electronic proof-of-payment systems by the mid-2010s, with empirical studies noting increased acceptance through perceived security in e-payments despite initial resistance to non-cash models.[67] In these regions, adoption is driven by infrastructure economies—proof-of-payment avoids costly turnstiles—but faces elevated enforcement demands due to socioeconomic factors like informal vending, with evasion linked to inspector ratios below 1:1,000 passengers in under-resourced operations.[21]Technological Developments
Shift to Digital and Mobile Proofs
The transition to digital and mobile proofs in proof-of-payment systems emerged prominently in the early 2010s, driven by rising smartphone penetration and the need for efficient, paperless fare validation in barrier-free environments.[68] Mobile ticketing applications allow users to purchase fares remotely, activate electronic tickets, and present them on demand to enforcement officers via screen display, QR code scanning, or near-field communication (NFC) verification, thereby maintaining the honor-based enforcement core while reducing physical media handling.[69] This shift has been documented in implementations on light rail, buses, and commuter services, where digital proofs serve as the primary validation method during random inspections.[70] Key technologies facilitating this evolution include QR codes for ticket activation and visual proof, which enable quick inspector scans using handheld devices, with global transportation spend via QR payments projected to nearly triple by 2028 due to their simplicity in proof-of-payment setups.[71] NFC-enabled mobile wallets and apps further integrate seamless payment and proof, allowing contactless taps on validators or direct phone presentations that mimic traditional visual checks but with encrypted data for fraud prevention.[72] Open-loop payment systems, adopting credit/debit cards and digital wallets since the mid-2010s, extend this by treating validated taps as ongoing proof-of-payment without dedicated agency-issued media, as seen in U.S. and international transit pilots.[73][74] Adoption accelerated around 2012 in North American commuter rail networks, with agencies like those in major U.S. metros deploying apps for direct smartphone-based fare payment and validation, reducing reliance on printed tickets.[68] By 2018, contactless open payments were rolling out in systems such as New York's MTA, integrating mobile proofs into proof-of-payment verification to streamline boarding and enforcement.[75] Empirical studies on systems like EZfare mobile ticketing highlight increased user adoption through ease of access, though causal factors include perceived convenience over legacy methods, with validation rates tied to app reliability during inspections.[69] Privacy concerns arise from data tracking in these digital proofs, prompting recommendations for anonymization protocols to mitigate risks in honor-based systems.[48] This digital pivot has lowered operational costs for ticket issuance—estimated reductions of up to 20-30% in media production for adopting agencies—while empirical data from U.S. transit scans indicate higher ridership convenience in proof-of-payment contexts, though enforcement efficacy depends on inspector training for digital verification tools.[70] Hybrid approaches combining QR and NFC persist, as in proposed NFC-QR public transport payment methods that balance accessibility with real-time proof validation.[76] Overall, the move enhances scalability for high-volume, unchecked transit but requires robust backend systems to counter digital forgery attempts, with adoption rates correlating to urban smartphone usage exceeding 80% in implementing regions.[77]Post-2020 Innovations and Contactless Verification
The COVID-19 pandemic accelerated the adoption of contactless verification methods in proof-of-payment (POP) systems, as transit agencies sought to minimize physical interactions during fare inspections. By 2021, many operators integrated near-field communication (NFC) capabilities into handheld inspector devices, allowing verification of payments made via contactless bank cards or mobile wallets without requiring passengers to present physical tickets.[78] This shift reduced enforcement contact time by an estimated 20-30% in tested systems, based on processing speeds for EMV-standard taps compared to manual checks.[79] Account-based ticketing (ABT) emerged as a core post-2020 innovation, storing fare validation data in the cloud rather than on physical media, enabling inspectors to confirm payment status via a passenger's device identifier—such as a phone number or email—using secure API queries from handheld scanners. Implemented in systems like the Bay Area's Next Generation Clipper rollout starting December 2025, ABT supports seamless verification across contactless cards, apps, and wearables, with real-time authentication reducing fraud risks through tokenized transactions.[80][81] In California, the California Integrated Travel Project (Cal-ITP) piloted open-loop contactless payments in 2021 across agencies like Monterey-Salinas Transit, allowing fare inspectors to validate bank card taps directly, which expanded to full deployment by 2023 and improved verification efficiency in POP environments.[82] Mobile app-based proofs further advanced contactless verification, with QR code or barcode displays serving as digital tickets scannable by inspectors' devices at distances up to 10-15 cm, eliminating paper handling. Agencies like TriMet in Portland equipped fare inspectors with handheld units by 2022 capable of scanning Hop cards, credit cards, or phones for validity, reporting a 15% drop in inspection disputes due to instantaneous backend confirmation.[83] Similarly, BART's contactless "Tap and Ride" system, enhanced post-2020, uses inspector devices to verify entry tags from any NFC-enabled payment, maintaining POP integrity without station-side barriers.[84] These developments prioritize empirical reductions in dwell times and evasion, though challenges persist in ensuring device interoperability across diverse payment ecosystems.[85]Future Prospects for AI and Real-Time Monitoring
Advancements in artificial intelligence are poised to enhance proof-of-payment systems through real-time monitoring of passenger behavior and ticket validation, shifting from random inspections to targeted enforcement. Computer vision technologies, deployed via onboard or station cameras, analyze actions such as bypassing validators or exhibiting evasion patterns, generating alerts for inspectors via mobile applications. For instance, Ferrocarrils de la Generalitat de Catalunya (FGC) in Barcelona has utilized AWAAIT's AI system since 2015 to detect fare evasion in real-time at key stations, enabling selective checks that deter non-compliance without full barriers.[86] Similarly, the New York MTA has integrated real-time detection tools through its Transit Tech Lab, validating AI for security protocols in subway stations.[86] Emerging multi-technology frameworks combine behavioral AI, reinforcement learning, and IoT sensors to predict and flag evasion, such as lingering near exits or avoiding NFC readers, while processing data on edge devices for immediacy. These systems employ federated learning to maintain privacy by training models without centralizing raw passenger data, addressing regulatory concerns in jurisdictions like the EU.[87] In bus applications, AI video analytics like those from AWAAIT measure evasion rates in real-time, prioritizing high-risk cases to optimize inspector deployment.[88] Prospects include predictive analytics for evasion hotspots, potentially reducing rates by 15-20% and recovering millions in lost revenue annually, as modeled in behavioral AI studies.[87] Integration with contactless mobile proofs and biometric verification could enable seamless, low-friction validation, minimizing human oversight while leveraging edge computing for scalable, low-latency monitoring across networks.[86] However, efficacy depends on accuracy in diverse environments and balancing deterrence gains against implementation costs, with ongoing pilots indicating viability for widespread adoption by 2030.[87]Effectiveness and Impact Assessments
Quantitative Studies on Revenue Recovery
A 2009 empirical study conducted by the San Francisco Municipal Transportation Agency (SFMTA) analyzed fare compliance across buses, light rail, and streetcars using surveys of 41,239 passengers over 1,141 vehicle runs, yielding a systemwide evasion rate of 9.5% under proof-of-payment (POP) enforcement. This translated to an estimated $19 million in annual uncaptured revenue from bus and light rail operations, which generated $157 million total in 2009 fares, with back-door bus boarders showing 55% invalid payment rates compared to 5% on consistently enforced light rail. Reducing invalid POP instances by half via targeted enforcement was projected to recover $9-10 million yearly, though fine collection specifics were not quantified.[89] A 2020 audit by the Minnesota Metropolitan Council examined light rail POP systems, estimating evasion rates of 7.6-11.8% on the Blue Line and 8.4-10.8% on the Green Line through inspection data, highlighting revenue leakage from inconsistent verification but without direct dollar recovery figures. In contrast, a 2018 study on urban bus lines in a proof-of-payment context reported peak daily evasion of 3.56% via on-site detections, suggesting lower losses in systems with routine checks, though fines recovered only partial offsets due to evasion persistence.[33][35] Broader analyses, such as a Union Internationale des Transports Publics (UITP) committee review, pegged average bus evasion at 4.2% across collective systems including POP variants, with revenue recovery hinging on inspection frequency; models from Italian PTC data indicate optimal inspection levels could minimize net losses to under 5% evasion but require fines exceeding 200% of fare value for full deterrence, often unachievable due to non-payment rates exceeding 30%. These findings underscore that while POP enables operational efficiencies, empirical revenue recovery remains partial—typically 20-50% of evasion losses via fines—dependent on enforcement rigor and cultural compliance factors.[21][41]Comparative Performance Against Barrier Systems
Barrier systems, such as turnstiles or gated entry points, generally achieve lower fare evasion rates compared to proof-of-payment (POP) systems, particularly in environments with inconsistent enforcement of spot-checks. In North American barrier-equipped light rail and rapid transit systems, evasion rates range from 2% to 4%, often due to turnstile jumping or transfer abuse.[90] Well-enforced POP systems in European light rail transit (LRT) report evasion as low as 0.1% to 3%, while North American examples like Vancouver's SkyTrain and San Diego's trolley maintain rates around 0.27% to 1.35%.[90] However, in under-enforced POP setups, such as Seattle's Sound Transit Link light rail, evasion can reach 45%, highlighting enforcement's causal role in performance disparities.[91] Revenue recovery favors barriers in high-evasion contexts, as gating can reduce non-payment to 5% or less, yielding substantial net gains after costs. A Sound Transit analysis projected that installing gates at the top five highest-ridership stations would generate $383.4 million in net revenue over 20 years, with a 1209% return on investment and breakeven in two years, assuming increased compliance to 95%.[91] In contrast, POP systems recover revenue through lower operational overhead but risk losses from evasion; Australian LRT modeling showed pay-on-entry (POE) barriers reducing evasion-related shortfalls by A$8.1 million annually, yet overall benefit-cost ratios below 1 due to offsetting expenses.[92] Empirical data indicate POP's viability when inspection levels optimize deterrence without excessive staffing, as evasion rises nonlinearly with reduced checks.[21] Operational efficiency metrics reveal POP's advantages in throughput and flexibility, especially for surface-level or bus rapid transit (BRT) alignments incompatible with barriers. POP enables all-door boarding, cutting dwell times and journey durations by up to 15% versus single-door POE systems, which necessitate queuing and validation at entry.[92] [15] Barriers impose design constraints, higher labor for monitoring jumps, and reduced adaptability for on-street LRT, whereas POP inspectors multitask in security and passenger assistance.[90] Cost structures underscore POP's economic edge for lower-density or enforcement-capable networks. Annualized capital costs for POP in LRT systems range from $320,000 to $640,000, with operating expenses at $530,000 to $1.06 million (9 cents per passenger), versus barriers' $250,000 annualized capital but $2.1 million operating (18-35 cents per passenger).[90] Gating demands significant upfront investment—e.g., $34.2 million capital plus $3.3 million annual operations for select stations—and ongoing maintenance, potentially exceeding revenue gains in low-evasion POP regimes.[91] POE systems further inflate costs by requiring 14% more vehicles to offset capacity losses from extended dwells.[92]| Metric | Proof-of-Payment (POP) | Barrier Systems |
|---|---|---|
| Typical Evasion Rate | 0.1%-3% (enforced); up to 45% (under-enforced) | 2%-5% |
| Operating Cost per Passenger | ~9 cents | 18-35 cents |
| Dwell Time Impact | Reduced (all-door boarding) | Increased (15% longer journeys) |
| Capital Intensity | Low (inspection-focused) | High (infrastructure-heavy) |