Hubbry Logo
ShrinkflationShrinkflationMain
Open search
Shrinkflation
Community hub
Shrinkflation
logo
8 pages, 0 posts
0 subscribers
Be the first to start a discussion here.
Shrinkflation
Shrinkflation
from Wikipedia

Toblerone chocolate bar, 2006
2016 Toblerone bar from the United Kingdom with larger gaps between peaks, using 10% less chocolate[1]
Photo showing size difference of 165g and 134g Pringles cans.
Kellogg's shortened and shrank the diameter of the standard tube of Pringles in Australia through the 2010s and 2020s, as they shifted production from the United States to Malaysia. The net weight of each tube was reduced from 165g to 134g, the size of each Pringle was also reduced, and consumers also noticed a blander taste. These changes also coincided with price increases.[2][3]

In economics, shrinkflation, also known as package downsizing, weight-out,[4] and price pack architecture[5] is the process of available products shrinking in size or quantity while the prices remain the same.[6][7] The word is a portmanteau of the words shrink and inflation and was coined as the counterpart to economic inflation, wherein prices rise while the product remains unchanged. A related term, skimpflation, involves a reformulation or other reduction in quality.[8]

Shrinkflation allows manufacturers and retailers to manage rising production costs while maintaining sales volume, operating margin, and profitability, and is often used as an alternative to raising prices in line with inflation.[9][7] Consumer protection groups are critical of the practice.

Economic definition

[edit]
A parallel to shrinkflation is currency debasement. This graph shows decline in coin silver content over the history of the Roman Empire.

Shrinkflation is a rise in the general price level of goods per unit of weight or volume, brought about by a reduction in the weight or size of the item sold.[10] The price for one piece of the packaged product remains the same. This sometimes does not affect inflation measures such as the consumer price index or Retail Price Index, i.e. it might not increase in the cost of a basket of retail goods and services,[citation needed] but many indicators of price levels and thus inflation are linked to units of volume or weight of products, so that shrinkflation also affects the statistically represented inflation figures.

The first use of the term shrinkflation with its current meaning has been attributed to the economist Pippa Malmgren, though the same term had been used earlier by historian Brian Domitrovic to refer to an economy shrinking while also suffering high inflation.[11]

Causes

[edit]

Barak Orbach, an academic economist, argues that competition typically drives shrinkflation: "When supply shocks or other factors inflate production costs, businesses must pass on cost increases to maintain profitability. However, in competitive markets, direct price increases are risky. Under such conditions, businesses often choose to raise prices indirectly through downsizing."[12][unreliable source?]

Without explicitly using the term shrinkflation, macroeconomist Vivek Moorthy much earlier documented and analysed the shrinkage effect of inflation, explaining it by Arthur Okun's "invisible handshake" approach: "Prices are ... based on notions of trust and fairness. it is considered acceptable for firms to respond to cost increases, but not to demand increases. Firms selling a branded product will make deliberate efforts to continue selling at the same price thereby retaining loyal customers. Hence, to cope with inflation, fast moving consumer goods firms would often resort to shrinking the product size to avoid raising prices."[13]

Consumer impact

[edit]
Many grocery stores provide unit price information for all products. In this Norwegian grocery store, the price for a bottle of ketchup is displayed in terms of the price paid per package (64.90 kr) as well as the price paid per kilogram (111.90 kr). This allows customers to see how much they will pay and to quickly compare products that have different sizes of packages.

Consumer advocates are critical of shrinkflation because it has the effect of reducing product value by "stealth".[14] The reduction in pack size is sufficiently small as not to be immediately obvious to regular consumers.[15] An unchanged price means that most consumers will not immediately notice the higher unit price, which adversely affects consumers' ability to make informed buying choices. Consumers have been found to be deterred more by rises in prices than by reductions in pack sizes, and some customers would rather have a smaller package at the old price than the old package size at a higher price.[8]

Suppliers and retailers have been called upon to be upfront with customers. According to Ratula Chakraborty, a professor of business management, they should be legally obliged to notify shoppers when pack sizes have been reduced.[16] In 2023 the French grocery chain Carrefour has started to warn their customers about these practises.[17][18]

Corporate bodies deflect attention from product shrinkage with "less is more" messaging, for example by claiming health benefits of smaller portions or environmental benefits of less packaging.[19][unreliable source?]

Shrinkflation is not the only cause of reduced package sizes. In some cases, such as junk food, some customers do prefer smaller package sizes.[8]

In other cases, the change is part of a trend to adjust package sizes. In 2003, Danone shrank its yogurt containers from 8 ounces to 6 ounces, because consumers thought their larger product was too expensive overall; many, though not all, of the grocery stores selling it maintained the old price for the smaller product.[20] Most yogurt manufacturers followed suit, resulting in smaller packages.[8][20]

Just-noticeable difference

[edit]

In experimental psychology, a just-noticeable difference is the amount something must be changed for a difference to be noticeable.[21] Discovered by Ernst Heinrich Weber, the JND is a fixed proportion of the reference sensory level, and so the ratio of the JND/reference is roughly constant: where is the original intensity of the particular stimulation, is the addition to it required for the change to be perceived, and k is a constant. Weber's law has important applications in marketing. Manufacturers and marketers endeavor to determine the relevant JND for their products for two very different reasons:

  1. Negative changes (e.g. reductions in product size or quality, or increase in product price) are not discernible to the public (i.e. remain below JND) and
  2. Product improvements (e.g. improved or updated packaging, larger size or lower price) are very apparent to consumers without being wastefully extravagant (i.e. they are at or just above the JND).

When it comes to product improvements, marketers very much want to meet or exceed the consumer's differential threshold; that is, they want consumers to readily perceive any improvements made in the original products. Marketers use the JND to determine the amount of improvement they should make in their products. Less than the JND is wasted effort because the improvement will not be perceived; more than the JND is again wasteful because it reduces the level of repeat sales. On the other hand, when it comes to price increases, less than the JND is desirable because consumers are unlikely to notice it.

Statistics

[edit]

The UK Office for National Statistics wrote in 2019, "We identified 206 products that shrank in size and 79 that increased in size between September 2015 and June 2017. There was no trend in the frequency of size changes over this period, which included the EU referendum. The majority of products experiencing size changes were food products and in 2016, we estimated that between 1% and 2.1% of food products in our sample shrank in size, while between 0.3% and 0.7% got bigger. We also observed that prices tended not to change when products changed size, consistent with the idea that some products are undergoing 'shrinkflation'."[22]

Impact of Shrinkflation on CPIH in the UK, with the number of food price quotes that saw a change in package size per month

In the United States, the Bureau of Labor Statistics has written that "the impact of product downsizing at the all commodity and services level is minimal, with an average annual effect of 0.01 percent per year, so while consumers may notice shrinkflation at the grocery store, it has a very small impact the overall inflation picture they face."[23]

Examples

[edit]
  • Coffee sold in 1 lb (453.6 g) bags shrank to 400 g or smaller in the 1980s.[8]
  • In India in 2008, Procter and Gamble reduced the pack size of its detergent Tide from 1 kg to 850 g while maintaining the same price. Similarly around 2012, Orbit reduced the chewing gum pack size from 6 to 5 units, keeping the price at ₹5. In 2013 the staple breakfast item idli was shrunk from 100 g to 75 g, as reported in the Bangalore Mirror.[24]
  • In January 2009, Häagen-Dazs announced that it would be reducing the size of their ice cream cartons in the US from 16 US fl oz (470 ml) to 14 US fl oz (410 ml).[25][26]
  • In 2010, Kraft reduced its 200 g Toblerone bar to 170 g.[27]
  • Tetley tea bags were sold in boxes of 88 instead of 100.[27]
  • Nestlé reduced its After Eight Mint Chocolate Thins box from 200 g to 170 g.[27]
  • Cadbury's Crunchie were sold in packs of three instead of four.[27]
  • In 2015, Cadbury Fingers removed two fingers from each pack, reducing the weight of a pack from 125 grams to 111 grams.[28]
  • In July 2015, a tub of Cadbury Roses which weighed 975 g in 2011, was reduced to under 730 g, while a tub of Cadbury Heroes was reduced to 695 g. However the price remained the same at around £9.[29]
  • Around 2015, Kellogg's shortened and shrank the diameter of the standard tube of Pringles in Australia and New Zealand, as they shifted production from the United States to Malaysia. The net weight of each tube was reduced from 165g to 134g, the size of each Pringle was also reduced, and consumers also noticed a blander taste. These changes also coincided with price increases.[2][3]
  • In 2016, Terry's Chocolate Orange was reduced from 175 g to 157 g by changing the moulded shape of each segment to leave an air gap between each piece.[30]
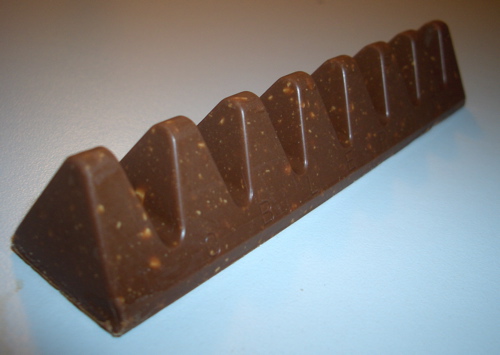
  • In 2016, Mondelez International again reduced the size of the UK 170 g Toblerone bar to 150 g, while the 400 g bar was reduced to 360 g. This was done by enlarging the gap between the chocolate triangles.[1]
  • In 2017, Milka Alpine Milk and Milka Nuts & Raisins got reduced from 300 g to 270 g while Triolade got reduced from 300 g to 280 g, all without changing the bag size.[31]
  • In 2017, McVities reduced the number of Jaffa Cakes in every standard packet from 12 to 10, raising the cost per cake from 9.58 p to 9.9 p.[32]
  • In 2020, Unilever reduced the size of Ben & Jerry's ice-cream tubs in Europe, going from 500 ml to 465 ml, whilst still retaining the RRP of around 5 euros. Despite this, Unilever has publicly criticized rival ice-cream brands for shrinkflation in the United States, where Ben & Jerry's ice-cream is still sold in pint-sized (473 ml) tubs.[25][26]
  • In 2021, General Mills shrank their family-sized boxes of cereal down from 19.3 ounces to 18.1 ounces. That means the unit cost per ounce of the product has increased, but for the consumer, the average price in the United States remained $2.99.[33]
  • In 2022, Procter & Gamble reduced the number of double-ply sheets per roll of toilet paper from 264 to 244 sheets in the 18-count mega package. This amounts to approximately a roll and a half in the 18-count package.[34]
  • In 2022, Unilever reduced the size of Dove soap bars from 100 g to 90 g, with most retailers either maintaining the same price or increasing prices.[35]
  • In 2023, Mars, Incorporated reduced the weight of their Whiskas cat food by 15%, reducing the weight of each pouch from 100 g to 85 g. The price of the packs did not change. This was applicable to their 12×100 g, 40×100 g, 80×100 g, and individual products for both the "in jelly" and "in gravy" products.[36]

Legislation

[edit]

In 2024, a bill was introduced in the U.S. Senate which would ban shrinkflation.[37] A separate bill, introduced in the U.S. House of Representatives, would require brands to label products that contain less product than before at the same price.

[edit]

In October 2021, NPR's Greg Rosalsky from Planet Money proposed the term skimpflation to refer to a degradation in the quality of services while keeping the price constant, such as a hotel offering a more meager breakfast or reducing the frequency of housekeeping.[38] In 2023, Guardian Money described a number of ingredient changes in British supermarket foods – such as a brand of mayonnaise changing from 9% egg yolk to 6% egg and 1.5% egg yolk – as an example of skimpflation.[39]

Unlike changes to the size and weight of a product, skimpflation is more difficult to measure in a standardized way, and consequently goes unrecorded in measurements of inflation.[8]

Conversely, in September 2022, Izabella Kaminska's The Blind Spot published an article that proposed the term shitflation in reference to maintaining a product's price while decreasing quality.[40][unreliable source?] The article's author, Dario Garcia Giner, proposed that shrinkflation and shitflation spoke to the Grossman-Stiglitz paradox, and argued they were akin to "Trojan horses buried in the heart of mainstream finance — just waiting to tear down the system by discombobulating relative values in the big-data spreadsheets that central bankers and financiers depend on to manage economic allocation."

[edit]

The term has been used by President Joe Biden in 2023 and 2024 to blame companies for deploying this tactic to increase their profits, deflecting criticism about inflation during his administration and instead pinning the blame on big business.[41] Biden's claim has been criticized, with some conservatives arguing that his economic policies and the Inflation Reduction Act were the primary cause of price increases and shrinking products.[42][43]

See also

[edit]

References

[edit]
[edit]
Revisions and contributorsEdit on WikipediaRead on Wikipedia
from Grokipedia
Shrinkflation is the reduction in the size, weight, or quantity of a consumer product while its nominal price remains unchanged, resulting in a higher that masks underlying cost pressures. This tactic, distinct from overt price , enables producers to preserve profit margins amid rising input costs without triggering immediate consumer resistance tied to visible price tags. The term, a portmanteau of "shrink" and "," gained prominence around 2009, though the underlying practice traces to historical precedents like medieval bakers reducing loaf sizes during shortages. Empirical analyses reveal its widespread occurrence in categories such as snacks, paper products, and beverages, with downsizing affecting up to one-third of grocery items during recent inflationary episodes. Shrinkflation challenges official metrics like the U.S. (CPI), potentially understating true cost-of-living increases unless adjustments for packaging changes are incorporated, as explored in research series. While firms cite competitive pricing and cost management as rationales, consumer studies indicate limited detection of these subtle shifts, fueling discussions on market transparency and measurement accuracy over regulatory overreach.

Definition and Conceptual Framework

Economic Definition

Shrinkflation denotes the strategy employed by producers to diminish the quantity, volume, or size of a product—such as by reducing package contents—while maintaining the nominal retail at the same level or effecting only a minor increase, which results in a higher effective per unit of measure. This adjustment effectively embeds a price rise that is less conspicuous to consumers than a direct nominal increase, as it preserves the sticker familiarity while eroding real value received. Economically, shrinkflation functions as a covert mechanism for transmitting upstream cost pressures, such as elevated or labor expenses, to downstream buyers without triggering immediate backlash from price-sensitive . Firms implement it to safeguard margins in oligopolistic markets where overt pricing power is constrained by or scrutiny, often targeting commoditized like packaged foods and household items where unit size variations are normalized. Unlike explicit , which adjusts prices proportionally to , shrinkflation decouples nominal stability from real output contraction, complicating short-term inflationary signaling in aggregate indices. In macroeconomic measurement, shrinkflation contributes to underlying price level creep by elevating unit costs, though consumer price indices like the U.S. CPI mitigate its distortion through quality-adjustment protocols that impute effective per-unit pricing based on observed shifts. For instance, if a box's weight drops from 12 ounces to 10.5 ounces at unchanged pricing, the implicit unit approximates 14%, assuming proportional value equivalence—a central to hedonic and unit-value adjustments in . This practice thus embodies a microeconomic response to inflationary environments, prioritizing perceptual stealth over transparency, with prevalence documented in sectors facing stagnant demand elasticity. Shrinkflation differs from conventional inflation, which involves explicit increases in the nominal price of goods while quantity remains constant, as it instead maintains the listed price but reduces the product's size or volume, thereby raising the effective per-unit cost. This practice obscures cost pass-through to consumers, who may overlook unit price changes, unlike overt price hikes that trigger immediate scrutiny or switching behavior. A key distinction lies in skimpflation, where firms degrade product quality—such as substituting inferior ingredients or diminishing service levels—without altering quantity or nominal price, contrasting shrinkflation's focus on quantity reduction. For instance, skimpflation might involve thinner fabrics in or diluted formulations in snacks, preserving package size to evade detection, whereas shrinkflation targets measurable volume, like fewer ounces in a box. Both contribute to understated metrics, but quality adjustments pose greater measurement hurdles for indices like the , which relies more readily on quantity data. Shrinkflation also contrasts with practices like premiumization, where companies introduce higher-priced upscale variants alongside standard products to capture revenue from price-insensitive buyers, without necessarily downsizing the base offering. Unlike deflationary responses, which lower prices to stimulate amid falling costs, shrinkflation sustains or elevates unit economics during input cost pressures, prioritizing margin preservation over volume growth. These tactics, while related under broader cost-management umbrellas, diverge in their consumer impact and transparency, with shrinkflation leveraging subtlety to minimize backlash.

Historical Development

Origins and Terminology

The practice of shrinkflation, involving the reduction of product quantity or quality while maintaining nominal prices, traces its origins to ancient economies where rulers debased by lowering the content in coins without altering their , effectively imposing a hidden on holders. For instance, Roman emperors progressively reduced the silver in denarii from nearly pure silver under to under 5% by the mid-3rd century AD, allowing governments to expand amid fiscal pressures without overt price hikes. This mechanism mirrored modern shrinkflation by preserving the illusion of stable value while eroding , often justified as necessary for economic survival in eras of scarcity or warfare. In the , the tactic reemerged in consumer goods amid inflationary episodes, predating the specific term. During the 1970s oil crisis and subsequent cost pressures, manufacturers began systematically downsizing packaged products; for example, coffee cans that traditionally held 1 pound (453 grams) shifted to 13 ounces (369 grams) by the late 1980s, as documented in a 1988 consumer report on brands like . Similar adjustments occurred in other staples, such as tea bags and candy bars, where quantity reductions masked rising per-unit costs without triggering consumer backlash against explicit price increases. The term "shrinkflation" itself, a portmanteau blending "shrink" and "," gained prominence in economic discourse around 2009-2013, attributed to British economist , who used it to describe producers shrinking package contents as a stealthy response to cost while avoiding direct adjustments that might deter buyers. Malmgren's formulation, detailed in her 2013 book Signals: How Everyday Signs Can Help Us Navigate the World’s Economic Peril, highlighted observable consumer signals like smaller product sizes as indicators of underlying economic strain. Earlier isolated uses existed, such as a 1991 reference potentially in a different context, but Malmgren's application to packaged goods established its contemporary meaning. The concept distinguishes itself from mere "downsizing" by emphasizing its inflationary dynamic, where reduced volume equates to higher effective pricing per unit.

Acceleration in Modern Contexts

Shrinkflation practices intensified in the early 2020s amid the global surge that began in mid-2021 and peaked in 2022. Reports of product downsizing by consumer goods manufacturers rose notably from early 2022, driven by sustained cost pressures including bottlenecks and elevated energy prices following the and geopolitical events. Empirical analyses of grocery items reveal widespread adoption during this period, with approximately one-third of roughly 100 tracked consumer products experiencing size or serving reductions between 2020 and 2024. Categories such as cereals and saw particularly high incidences; for example, 43.8% of 16 examined cereals downsized, including family-size by 9.6%. brands like reduced sheet counts, with one-ply mega rolls dropping from 340 to 312 sheets. U.S. Department of Labor data indicate shrinkflation became more prevalent post-2021 compared to the initial years. This acceleration masked some price increases from official metrics, contributing up to 3.6 percentage points to in specific categories like paper products from 2019 to 2023, though its net effect on broader consumer price indices remained modest at under 0.3 percentage points for food-at-home in 2022. evaluations confirm the phenomenon's limited aggregate impact despite heightened consumer awareness, with 71% of Americans reporting notice of downsizing by 2024. In contexts like the , shrinkflation exacerbated divergences between household inflation measures such as CPIH, where unadjusted indices undercaptured unit price rises due to quantity changes. Overall, while the strategy proliferated as firms navigated competitive pressures without overt price hikes, data underscore it as a symptom of underlying ary dynamics rather than a primary accelerator thereof.

Underlying Causes

Production Cost Pressures

Rising input costs, such as those for raw materials, , and labor, compel manufacturers to implement shrinkflation as a to offset expenses without overtly increasing retail prices, thereby maintaining profit margins amid competitive pressures. Empirical models demonstrate that when production costs escalate, firms in less competitive markets disproportionately reduce product sizes, leading to higher per-unit prices that consumers may overlook due to inattention. This response is particularly pronounced during disruptions or commodity price spikes, where direct price hikes risk alienating price-sensitive buyers. The post-2020 period exemplifies these pressures, with global driven by pandemic-related supply bottlenecks and the 2022 Russia-Ukraine conflict causing energy costs to surge—European natural gas prices, for instance, rose over 300% year-over-year in mid-2022—and commodity inputs like and to increase by 20-50%. Food and beverage producers, facing these hikes, resorted to downsizing: U.S. data from 2021-2023 shows shrinkflation contributing to measured price changes in categories like cereals and snacks, where package weights declined by 5-10% on average while nominal prices held steady. Similarly, manufacturers reduced can sizes amid bean price volatility, resulting in per-unit price increases of up to 32%. Labor cost inflation has compounded these dynamics, with U.S. adjustments and union pressures adding 3-5% to expenses annually since 2021, prompting non-food sectors like paper products to shrink rolls or sheets—evidenced by 12% average per-unit hikes in downsized paper towels. Economic analyses confirm that such cost-push factors, rather than , underlie much of observed shrinkflation, as firms prioritize volume reduction over margin erosion in oligopolistic industries. However, the practice's prevalence wanes when input costs stabilize, as seen in easing commodity pressures by late 2024.

Business Strategy and Market Dynamics

Shrinkflation functions as a deliberate for companies confronting elevated production costs, such as those from raw materials, labor, or disruptions, allowing firms to offset expenses by diminishing product volume or weight while holding nominal prices steady, thus safeguarding gross margins without triggering immediate customer pushback against explicit hikes. This tactic exploits documented consumer behavior where attention skews toward visible price tags over comparative unit or metrics, enabling per unit to rise covertly. For instance, during the post-2020 inflationary surge driven by commodity price volatility, manufacturers in the consumer goods sector reported utilizing shrinkflation to sustain profitability amid input cost increases averaging 10-20% in categories. From a market dynamics perspective, shrinkflation thrives in concentrated industries with oligopolistic structures, where limited competitors and high grant firms sufficient pricing power to execute quantity reductions without provoking aggressive undercutting or loss of . In such settings, inattentive buyers—prevalent due to cognitive biases and shopping heuristics—facilitate higher effective per-unit s, as firms can coordinate tacitly on non-price dimensions like to evade price wars. Conversely, in fragmented or hyper-competitive markets, overt price adjustments may dominate because shrinkflation heightens detection risks via comparative shopping apps or regulatory scrutiny, potentially eroding if discrepancies become salient. Businesses weigh shrinkflation against alternatives like premiumization or promotional , opting for it when elasticity is low and cost pass-through via prices risks volume declines; data from U.S. retail sectors post-2021 inflation peaks show it correlating with stable sales volumes in staple goods despite 5-15% effective price escalations through downsizing. Long-term, however, repeated application can undermine trust, prompting shifts to value-oriented competitors or calls for unit-price transparency mandates, as evidenced by consumer complaints surging 300% in affected categories by mid-2023.

Mechanisms of Implementation

Psychological and Perceptual Factors

Consumers prioritize nominal price cues over quantity reductions when evaluating products, rendering shrinkflation less salient than equivalent price increases due to a toward price anchoring. This perceptual asymmetry stems from , where shoppers process shelf prices more readily than package dimensions or weights, underestimating effective hikes. Empirical analysis of scanner data reveals that consumer demand elasticity with respect to package size is roughly one-third to one-half the magnitude of price elasticity, indicating muted responsiveness to downsizing. In less competitive markets, inattentive buyers further amplify this effect by fixating on stable nominal prices, allowing firms to extract higher per-unit revenues without widespread backlash. Inertia and compound these factors, as repeat purchasers overlook gradual size decrements amid routine shopping, perceiving continuity in value despite reduced volume. Surveys confirm high —over 80% of U.S. consumers report noticing shrinkflation in categories like snacks—yet behavioral persistence endures, driven by switching costs and perceived equivalence in branding. Such dynamics exploit less intensely than overt price hikes, preserving short-term loyalty while masking inflationary pass-through.

Measurement and Detection Challenges

Shrinkflation is inherently difficult for consumers to detect due to subtle packaging redesigns, such as altered dimensions or added empty space, which obscure reductions without explicit disclosure requirements. Shoppers often overlook these changes, failing to compare historical sizes or calculate price per unit, as cognitive biases and time constraints limit routine scrutiny of labels. Official economic measurements, such as the U.S. (CPI), address shrinkflation by deriving effective —dividing nominal by or weight—to capture implicit increases, as in a box reduced from 12 to 11 ounces at unchanged , yielding a roughly 9% rise. Data collectors must actively monitor outlets, report suspected downsizing, and verify via manufacturer websites or specifications, a labor-intensive process vulnerable to incomplete coverage since not all items (e.g., or fresh produce sold by fixed ) lend themselves to adjustments. Quantifying shrinkflation at scale encounters further obstacles from high product turnover, with food UPCs showing 21.6% annual exit rates and 18.4% entry rates from 2012 to 2021, disrupting matched-sample comparisons essential for longitudinal indices. models, used to adjust for size as a attribute, require granular barcode-level on attributes, yet up to 42% of products are excluded due to missing information, risking understated in affected categories like snacks (where downsizing contributed 2.64% to category inflation from 2015-2019). Distinguishing pure quantity shrinkage from concurrent quality degradations or promotional upsizing adds analytical complexity, as does varying prevalence across sectors—less than 5% of items in seven grocery categories from 2021-2023, concentrated in products and . These challenges result in shrinkflation's muted representation in aggregate inflation metrics, with its overall CPI contribution estimated at 0.01% annually from 2015-2019, though sector-specific under-detection may amplify real household cost pressures during inflationary periods peaking in 2022. Empirical studies confirm size reductions averaged 7.24% in packaged foods from 2012-2021, elevating cumulative by 3.9 percentage points when adjusted, underscoring the need for enhanced data protocols to mitigate biases from unobservables or assumption-dependent models.

Empirical Evidence

Prevalence Statistics

According to an analysis by the U.S. Government Accountability Office (GAO) of from 2019 to 2024, product downsizing contributed less than 0.1 to the overall 34.5 percent rise in prices during that period. In a review of retail scanner from 2021 to 2023 across seven product categories, fewer than 5 percent of items experienced downsizing. For instance, in the category, 1.1 percent of items—accounting for 8.6 percent of sales—were downsized, while household paper products like paper towels showed higher contributions to category-specific , up to 3.0 percentage points from shrinkage between 2019 and 2023. A September 2024 LendingTree analysis of approximately 100 common consumer products found that about one-third had shrunk in size or quantity without a corresponding reduction since 2020. Among selected national grocery brands examined in 2024, shrinkflation averaged a 16.2 percent reduction in product size, with specific examples including cookies reduced by 50 percent (from 1.5 s to 1 ) and by 35.1 percent (from 13.1 s to 9.7 s). In the , earlier data from 2016 indicated that 1 to 2.1 percent of sampled products experienced size reductions. More recent surveys, such as a 2024 YouGov poll, reported that around 37 percent of Britons noticed shrinkflation in beverage packages and 36 percent in , though these figures reflect awareness rather than verified product-level incidence. Across both U.S. and U.K. contexts, shrinkflation appears concentrated in and , with empirical evidence suggesting it affects a minority of items despite high rates—79 percent of U.S. s reported noticing it in 2023.

Contributions to Inflation Metrics

Shrinkflation contributes to official inflation metrics, such as the (CPI) and its variants, when statistical agencies adjust for reductions in product quantity or size while prices remain constant or rise nominally. These adjustments treat shrinkflation as an effective price increase per unit, thereby incorporating it into price relatives used to compute index changes. For instance, the U.S. (BLS) calculates effective unit prices (e.g., price per ) by verifying reported size changes through data collectors and supplementary research, such as manufacturer specifications, ensuring downsizing in categories like snacks or household paper products is reflected as upward pressure on the CPI. Quantitative assessments indicate this contribution is minimal at the aggregate level. BLS analysis from 2015 to 2019 found shrinkflation added just 0.01 percentage points annually to the overall CPI for all commodities and services, with the largest effects in food and beverages totaling 0.21 percentage points over the period, driven by frequent downsizing in items like (2.81 percentage points) and snacks (2.64 percentage points). Similarly, in the , the Office for National Statistics (ONS) estimated that adjustments for shrinkflation in the Consumer Prices Index including owner-occupiers' housing costs (CPIH) raised the index by 0.03 percentage points overall from January 2012 to June 2017, primarily in where the adjusted index exceeded the unadjusted by 1.22 points; unadjusted series would otherwise underestimate due to ignored weight reductions. Despite these inclusions, challenges persist in timely and comprehensive detection, potentially leading to partial underestimation if adjustments lag or miss subtle changes, as noted in methodological discussions on CPI immeasurability for automatic downsizing. However, independent reviews, including from the U.S. Government Accountability Office, affirm that shrinkflation's net effect on broader inflation measures remains negligible, accounting for less than 2 percentage points in affected prices but diluting to insignificant levels across the full basket. This contrasts with public perceptions of widespread evasion, but empirical data from agencies underscore its limited role in distorting headline inflation figures.

Case Studies

Food and Beverage Examples

In the food and beverage industry, shrinkflation commonly involves reducing product weights or volumes while maintaining retail prices, often in response to rising input costs such as commodities and labor. A prominent case occurred with chocolate bars in November 2016, when decreased the net weight of its standard bars from 170 grams to 140 grams—a reduction of approximately 18%—and modified the iconic shape by increasing gaps between the triangular segments to accommodate higher and prices without raising the selling price. This adjustment preserved the external packaging dimensions but effectively delivered less product per unit. In Japan, chocolate manufacturers have implemented "stealth price increases" (ステルス値上げ) by reducing product quantities, such as smaller bars or fewer pieces, while maintaining retail prices, largely due to surging cacao prices. This trend was observed in 2024 and is expected to continue into 2025 and possibly 2026 amid ongoing supply shortages. Breakfast cereals have also experienced notable shrinkflation. General Mills reduced the contents of select family-size cereal boxes, such as certain varieties of and , from 19.3 ounces to 18.1 ounces in 2024 while keeping prices unchanged initially, before subsequent price increases; this 6% volume cut contributed to perceptions of diminished value amid ongoing pressures. Similarly, has faced criticism for redesigning packaging to obscure size reductions, including thinner boxes for products like that maintain shelf presence but contain less cereal by weight compared to prior formulations. In beverages and snacks, coffee brands exemplify the trend. Classic Roast ground coffee canisters shrank from 48 ounces to 40.3 ounces, a 16% reduction, as documented in a 2024 analysis of over 100 consumer products, allowing producers to offset elevated roasting and packaging costs without proportional price hikes. , a subsidiary, similarly downsized chip bags—including by about 5% in prior years—prompting a partial reversal announced in October 2024, where select and Ruffles packages would receive 20% more contents at the same price to address backlash over "skimpflation." These instances highlight how manufacturers adjust portion sizes to sustain profit margins amid volatile markets, often evading immediate consumer detection through subtle packaging tweaks.

Non-Food Product Instances

In the realm of non-food consumer goods, shrinkflation manifests through reductions in product volume, weight, or count, often in essentials such as agents and personal care items, allowing producers to offset input cost increases without overt price hikes. For instance, laundry detergents have seen container sizes diminish; Procter & Gamble's packaging shifted from 81-count to 73-count packs in some markets by 2023, while maintaining or slightly adjusting prices upward. Similarly, liquid laundry detergent reduced effective yield per bottle amid 2022 pressures, with formulations altered to deliver fewer loads per unit volume at the same retail . Household paper products provide another clear vector, where sheet counts or roll dimensions contract subtly. Kleenex facial tissues decreased from 65 sheets per box to 60 sheets by mid-2024, preserving the $1-2 price range despite consumer complaints logged in retail tracking. Angel Soft toilet paper exhibited shrinkflation in 2022, with 6-packs featuring thinner or shorter rolls totaling fewer linear feet of paper, sold at $5.49 per pack without quantity disclosure changes on labeling. Ultra Clean Care toilet paper followed suit, trimming ply thickness and sheet length in ultra-strength variants around 2023-2024, contributing to an estimated 5-10% effective quantity reduction per pack. Personal care and cleaning supplies further illustrate the practice. Dove soap bars, produced by , shrank from 3.17 ounces to 2.6 ounces per bar between 2021 and 2023, with prices held steady at approximately $1 per unit in major U.S. retailers. Similarly, Brazilian brand Ypê offers bar soap packs in varying sizes, such as 1 kg singles alongside 900 g (5 × 180 g) and 800 g (5 × 160 g) options, to maintain accessible prices amid rising production costs. Dish soap bottles, such as those from Dawn, downsized from 24 ounces to 21 ounces in select formulations by 2025, amid persistent raw material cost elevations from sources. Toothpaste tubes have also contracted, with Colgate varieties reducing from 6.4 ounces to 5.1 ounces in family sizes during 2022-2024, often without proportional price concessions, as verified through packaging comparisons by consumer watchdogs. These adjustments, while enabling margin preservation amid volatile energy and labor costs, have prompted scrutiny from bodies like the U.S. for potential masking of inflationary pressures.

Impacts and Effects

Consumer-Level Consequences

Shrinkflation reduces the quantity or quality of goods consumers receive for the same nominal price, effectively increasing the unit cost and diminishing . For instance, analyses of downsized products show per-unit price hikes ranging from 12% for paper towels to 32% for between 2021 and 2023. This hidden exacerbates household strains, particularly as consumers may not immediately adjust spending habits, leading to higher effective expenditures on essentials like groceries, which constitute a larger share for low-income families. Consumer inattention amplifies these effects, with empirical studies indicating that many fail to detect size reductions, underestimating true price inflation. In U.S. retail grocery markets, shrinkflation proves effective precisely because shoppers often overlook package changes, continuing purchases at inflated unit prices. Surveys reveal mixed awareness: while a poll in 2024 found 78% of noticing consumers observed shrinkflation in snack foods and 53% in desserts, broader inattentiveness persists, especially for subtle adjustments in non-food items. This detection challenge hinders price comparisons and informed decision-making, as varying package sizes obscure value assessments without unit pricing disclosures. When detected, shrinkflation fosters dissatisfaction and perceptions of unfairness, with consumers viewing size reductions as more deceptive than equivalent price increases. A 2024 study on responses showed 81% had noticed changes, often prompting brand switches or reduced loyalty. Such reactions erode trust in manufacturers, potentially altering long-term consumption patterns, though overall demand impacts remain modest in competitive markets. Low-income households face amplified consequences, as their higher essential spending ratios magnify the cumulative unit price erosion across frequent purchases.

Producer and Market Benefits

Producers employ shrinkflation to preserve profit margins when facing elevated input costs, such as raw materials or labor, by reducing product while maintaining nominal s, thereby avoiding the demand elasticity penalties associated with explicit price hikes. This strategy is particularly advantageous in price-sensitive sectors like consumer packaged , where overt increases can trigger immediate backlash or switching to competitors, as evidenced by studies showing consumers are up to four times more responsive to price changes than to quantity reductions. For instance, during periods of disruptions post-2020, manufacturers reported using shrinkflation to offset costs without alienating budget-conscious buyers, sustaining revenue streams that might otherwise decline by 10-20% from direct adjustments. Shrinkflation also yields operational efficiencies for producers, including lower material and packaging expenditures—potentially reducing costs by 5-15% per unit through smaller formats—and decreased shipping weights, which lowers expenses and enables higher shelf density in retail environments, minimizing stockouts. In less competitive markets, where firms hold greater pricing power, this tactic proves especially effective for per-unit revenue enhancement, as firms can incrementally raise effective prices without regulatory scrutiny or consumer detection in standardized product categories like snacks or household items. From a market perspective, shrinkflation facilitates adaptive that aligns with underlying pressures, preventing broader disruptions like widespread surges that could contract overall or inflate volatility in sectors. It incentivizes producers to optimize production processes and packaging innovations, fostering long-term gains that benefit supply chains by conserving resources and reducing , as smaller units less raw input per equivalent output value. In dynamic markets, this mechanism signals realities to consumers indirectly, encouraging competitive responses such as value-oriented alternatives or improvements across rivals, thereby maintaining market fluidity without the deflationary risks of aggressive discounting.

Broader Economic Ramifications

Shrinkflation contributes to discrepancies in official metrics by altering product quantities without nominal price changes, potentially understating true cost-of-living increases in consumer price indices like the CPI. The U.S. accounts for such changes by tracking effective unit prices in its basket of goods, yet challenges in real-time detection can lead to measurement lags or biases that affect calibration. A 2025 U.S. Government Accountability Office analysis of data from 2019 to 2024 found that the aggregate inflationary impact of product downsizing remained relatively small, contributing minimally to overall CPI variance. This limited effect suggests shrinkflation does not substantially distort central bank assessments of , though it may amplify perceived inflation mismatches between official figures and household experiences. On a macroeconomic scale, shrinkflation erodes real purchasing power and can dampen as consumers receive diminished value for expenditures, indirectly pressuring . Empirical studies indicate that combined with , it correlates with reduced GDP expansion by constraining consumption and responsiveness to pressures. In competitive markets, firms employ shrinkflation to adjust margins amid rising input s—often stemming from monetary expansion—without triggering immediate wars, thereby preserving operational viability during inflationary episodes. However, in sectors with weaker , such practices may signal entrenched oligopolistic tendencies, exacerbating real wage declines as nominal stability masks unit price hikes. Longer-term ramifications include potential erosion of price transparency, which could hinder efficient and consumer-driven market corrections. While shrinkflation enables gradual pass-through of cost increases, avoiding abrupt nominal shocks that might fuel wage-price spirals, it risks undermining trust in market signals if widespread. Central banks, relying on adjusted indices, may thus overlook subtle inflationary persistence, prolonging accommodative policies that amplify underlying monetary distortions. Overall, as a symptom of broader inflationary environments, shrinkflation underscores the real economic costs of sustained growth over demand-driven adjustments.

Debates and Perspectives

Claims of Corporate Deception

Critics, including consumer advocacy groups and policymakers, contend that shrinkflation constitutes a form of corporate by failing to transparently communicate reductions in product quantity or quality while maintaining nominal prices, thereby misleading s about the true cost per unit. The National Consumers League has endorsed legislation designating shrinkflation as an unfair or deceptive act, citing multiple surveys where a majority of respondents reported noticing smaller packages and perceiving it as a hidden price hike that erodes trust in branding. Similarly, a 2023 YouGov poll found that 73% of American s expressed concern over shrinkflation, with 41% viewing it very negatively as a tactic that obscures value loss. Legal actions have amplified these claims, with lawsuits alleging violations of and laws. In January 2025, a class-action suit was filed against in New York, accusing the chain of deceptively reducing portion sizes for items like fries and drinks—such as shrinking medium fries from 113 grams to 89 grams—without adjusting prices downward or notifying customers, thereby increasing effective costs by up to 27%. In Europe, the Hamburg Consumer Advice Centre initiated proceedings against Mondelez Deutschland in September 2025 over Milka chocolate bars, claiming the company engaged in shrinkflation by reducing bar weights (e.g., from 100g to 80g) without clear disclosure, constituting misleading packaging under German . Proponents of such suits argue that without mandatory unit or size change notifications, manufacturers exploit cognitive biases, as consumers often overlook subtle package tweaks. Legislative responses reflect these deception allegations, framing shrinkflation as a deliberate evasion of scrutiny. U.S. Senator Tammy Baldwin's Shrinkflation Prevention Act, introduced on February 28, 2024, targets corporations for "deceiving consumers by selling smaller sizes of the same products at the same price," proposing Federal Trade Commission authority to impose penalties for undisclosed quantity reductions exceeding 5% within a year. Representative Lou Correa's Deceptive Downsizing Prohibition Act, introduced September 11, 2025, similarly empowers the FTC to combat such practices, asserting they harm consumer choice by masking inflation. Consumer Action and other advocates have backed these bills, emphasizing that shrinkflation's opacity—unlike overt price increases—prevents informed purchasing and fosters perceptions of corporate dishonesty. While some analyses question the intent behind shrinkflation, viewing it as a market response rather than malice, claimants maintain it prioritizes profit concealment over ethical transparency.

Free-Market Rationales and Empirical Rebuttals

Proponents of free-market economics argue that shrinkflation represents a rational, voluntary adjustment by firms facing exogenous cost pressures, such as increases in prices, labor wages, or disruptions, allowing them to preserve profit margins without triggering immediate resistance to overt price hikes. This strategy enables companies to signal higher marginal costs through quantity reductions rather than nominal prices, which can maintain perceived affordability and in the short term while permitting market competition to discipline excessive practices over time. Economists like Veronique de Rugy contend that shrinkflation is a standard business response in inflationary environments, often less disruptive than alternatives like widespread price increases that could accelerate wage-price spirals or reduce overall consumption. Empirical analyses rebut claims that shrinkflation systematically deceives consumers or substantially distorts metrics, as (BLS) data from 2023–2024 indicates it accounted for only a negligible fraction—less than 0.2%—of overall (CPI) changes, far below levels that would imply a "hidden" driver. Studies on consumer packaged goods, including a comprehensive review of U.S. scanner data from 2010–2022, demonstrate that while initial responses to downsizing may involve temporary sales dips of 5–10%, markets self-correct through brand switching and competitive entry, with affected products losing up to 15% market share within six months as shoppers compare unit prices. This responsiveness underscores that shrinkflation operates within observable market signals, such as shelf labels and online comparisons, rather than constituting undetectable deception, particularly since documentation confirms retailers increasingly highlight unit pricing to mitigate opacity. Critics' assertions of widespread consumer unawareness are further challenged by longitudinal showing shrinkflation's prevalence correlates directly with verified cost —e.g., a 2022–2023 spike in input costs averaging 12%—rather than opportunistic , with firms in competitive sectors exhibiting smaller quantity reductions (under 5%) compared to concentrated markets. reviews of BLS methodologies affirm that quality-adjustment protocols in CPI calculations explicitly capture downsizing effects, preventing systematic underreporting of and rendering panic over "stealth" hikes empirically unfounded. In essence, these findings align with causal mechanisms where firm-level adaptations to real economic frictions enhance , as excessive shrinkflation invites by rivals offering stable quantities, thereby benefiting consumers through restored choice without regulatory intervention.

Policy and Regulatory Approaches

Domestic and International Measures

In the United States, legislative efforts to combat shrinkflation have primarily focused on empowering the (FTC) to treat it as an unfair or deceptive practice, though no federal laws have been enacted as of October 2025. The Shrinkflation Prevention Act of 2024 (S.3819), introduced in March 2024, directs the FTC to promulgate regulations within 18 months classifying undisclosed product downsizing as deceptive, with enforcement authority granted to the agency and state attorneys general. Similar proposals, such as the bill introduced by Representatives and in March 2024, aim to prohibit such practices through FTC rulemaking. Additional measures include requirements for clearer packaging labeling to prevent misleading consumers with unchanged designs post-downsizing, as proposed in Representative J. Luis Correa's Deceptive Downsizing Prohibition Act of 2024, introduced in December 2024. The Government Accountability Office (GAO) has highlighted unit pricing as a consumer tool against shrinkflation in its July 2025 report, recommending enhanced transparency without new mandates. Internationally, regulatory responses emphasize mandatory disclosures to enhance consumer awareness rather than outright bans. In , a effective July 1, 2024, requires retailers to post visible notices at point-of-sale for products where has decreased without a proportional reduction, specifying the prior and current quantities and effective price increase per unit. Italy's Consumer Code amendments, effective April 1, 2025, mandate that manufacturers and distributors inform consumers of any or size reductions via labeling or advertising, with fines up to €100,000 for non-compliance under unfair commercial practices rules. The anticipates new obligations in October 2025 under proposed Digital Markets, Competition and Consumers Act amendments, compelling supermarkets to alert customers to shrinkflation via or digital displays; the Groceries Labelling (Size Reduction) Bill, introduced in July 2025, further seeks to enforce size-change notifications on packaging. Other nations have adopted targeted approaches: and impose fines for undisclosed downsizing under laws updated in 2024, while South Korea's Fair Trade Commission requires pre-notification of quantity changes exceeding 10% since October 2024. In the , while no harmonized directive exists, member states leverage Unfair Commercial Practices Directive 2005/29/EC to prosecute misleading omissions, with a 2025 query noting 74% of consumers perceiving shrinkflation as deceptive. Spain's pending legislation mirrors France's disclosure model, and broader global trends show nine countries considering similar transparency rules as of mid-2025, prioritizing information over prohibition to balance competition and consumer rights.

Economic Critiques of Regulation

Economists associated with free-market institutions contend that government regulation of shrinkflation, such as mandates for fixed package sizes or disclosure requirements, interferes with efficient price signaling and . Shrinkflation enables producers to adjust real prices in response to rising input costs without triggering immediate consumer resistance to nominal price hikes, a phenomenon rooted in where buyers exhibit greater sensitivity to explicit price increases than to quantity reductions. Forcing uniform sizes would compel firms to raise sticker prices instead, potentially exacerbating affordability issues for price-sensitive households, particularly low-income consumers who benefit from varied product options. Empirical data from the U.S. indicates that shrinkflation has not materially distorted official inflation metrics, as methodologies already adjust for quantity changes in calculating the , rendering regulatory interventions redundant for measurement accuracy. Analyses by the further demonstrate that shrinkflation's prevalence remains historically typical and marginal in inflationary episodes, attributing broader price pressures to monetary expansion rather than corporate tactics, thus framing anti-shrinkflation policies as scapegoating that diverts attention from fiscal and monetary root causes. Such regulations risk , including reduced market and , as firms face compliance burdens that favor larger incumbents over nimble entrants. Academic assessments highlight that broad bans or controls on would generate administrative inefficiencies and fail to address underlying cost drivers, advocating instead for enhanced unit pricing transparency to empower without coercive mandates. In competitive markets, shrinkflation's persistence is self-limiting, as vigilant shoppers switch to alternatives, underscoring that intervention distorts voluntary transactions more than it protects against perceived .

Variants of Pricing Adjustment

Skimpflation represents a variant of pricing adjustment wherein producers maintain nominal prices while diminishing product quality or service levels, thereby increasing the effective cost per unit of value delivered. For instance, restaurants may reduce portion sizes in meals or substitute lower-grade ingredients without altering menu prices, as observed in U.S. dining sectors amid post-2022 inflationary pressures. This tactic differs from shrinkflation by targeting qualitative attributes rather than quantifiable volume, allowing firms to offset input cost rises—such as a 20-30% increase in commodity prices between 2021 and 2023—without prompting immediate consumer backlash to overt price hikes. Sneakflation constitutes another adjustment mechanism, involving the removal of inclusions or add-ons from product bundles at unchanged prices, effectively raising the unit cost through diminished bundled value. Examples include fast-food chains providing fewer complementary items, such as reduced condiment packets or fries per order, reported in complaints during 2023-2024. This form parallels shrinkflation in its subtlety but extends to non-physical elements, enabling cost pass-through amid disruptions that elevated expenses by up to 15% in affected industries. In service-oriented sectors, variants manifest as "stealth" reductions in non-monetary offerings, such as airlines curtailing in-flight amenities or hotels minimizing housekeeping frequency while holding rates steady. Data from the U.S. indicate that such quality adjustments influenced measurements, with downsizing events contributing to understated readings by 0.1-0.5 percentage points annually in select categories from 2020 onward. These strategies collectively serve as alternatives to direct pricing, preserving sales volume by exploiting consumer inertia toward detecting non-price changes. Empirical analyses confirm their prevalence during high- episodes, with firm-level studies showing a 10-20% incidence rate in packaged between 2021 and 2024.

Historical Analogues in Economic History

Currency debasement in pre-modern economies represents a primary historical analogue to shrinkflation, involving the reduction of precious metal content in coins while preserving their nominal face value, thereby diminishing real purchasing power in a manner akin to decreasing product quantity at fixed prices. This practice allowed issuers, typically governments or monarchs, to expand the money supply covertly to finance deficits, mirroring how firms today adjust package sizes to offset cost pressures without explicit price hikes. In the , systematic debasement began under Emperor in AD 64, when the silver coin's pure silver weight dropped from 3.9 grams to 3.4 grams, initiating a trend of progressive dilution that reduced silver fineness to under 5% by the mid-3rd century AD under emperors like . This monetary contraction in real value fueled rates estimated at over 1,000% in some periods, eroding and contributing to the empire's fiscal crises, as clipped or base-metal coins circulated at original denominations. Medieval European rulers employed similar tactics, periodically lowering coin bullion content or elevating nominal values without metal augmentation, as documented in monetary policies from the 8th to 15th centuries. England's under from 1542 to 1551 exemplifies this, slashing silver content in coins like the teston from 92% to as low as 30% to fund military campaigns, which spiked to 200-400% and prompted rapid reminting reforms under Mary I. Unlike contemporary shrinkflation confined to private goods, these state-driven debasements often triggered widespread loss of monetary confidence, resurgence, and policy reversals, underscoring risks of perceived value erosion on systemic scales.

References

Add your contribution
Related Hubs
User Avatar
No comments yet.