
Community hub
Recent from talks
Contribute something
Nothing was collected or created yet.
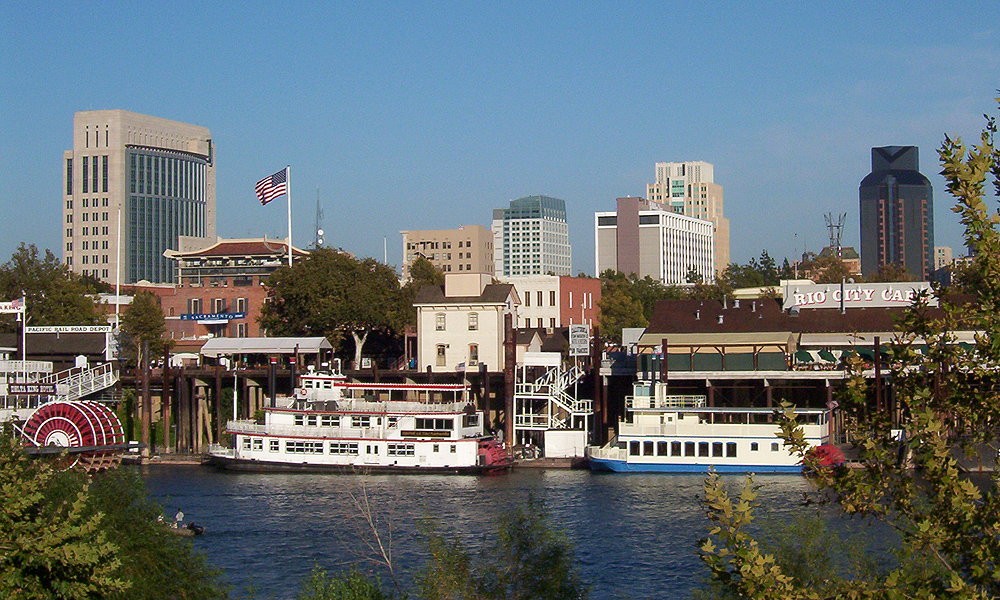
Sacramento Valley
View on WikipediaThe Sacramento Valley is the area of the Central Valley of the U.S. state of California that lies north of the Sacramento–San Joaquin River Delta and is drained by the Sacramento River. It encompasses all or parts of ten Northern California counties. Although many areas of the Sacramento Valley are rural, it contains several urban areas, including the state capital, Sacramento.
Key Information


Comparatively water-rich relative to the other segment of the Central Valley to the south, the San Joaquin Valley, there are slight differences in the crops typically grown in the Sacramento Valley. Much wetter winters (averaging between 25–60 inches (640–1,520 mm) of annual precipitation in the nearby foothills) and an extensive system of irrigation canals allows for the economic viability of water-thirsty crops such as rice and rootstock walnuts. Since 2010, statewide droughts in California (combined with unprecedented summer heat) have strained both the Sacramento Valley's and the Sacramento metropolitan region's water security.[1]
Geography
[edit]The Sacramento River and its tributaries are a significant part of the geography of the Sacramento Valley. Rising in the various mountain ranges (the various Northern Coast Ranges to the west, the southern Siskiyou Mountains to the north, and the northern Sierra Nevada to the east) that define the shape of the valley, they provide water for agricultural, industrial, residential, and recreation uses. Most of the rivers are heavily dammed and diverted. In more recent years, statewide droughts in California have further strained the Sacramento Valley's water security.[1]

The terrain of the Sacramento Valley is primarily flat grasslands that become lusher as one moves east from the rain shadow of the Coast Ranges toward the Sierra. Unlike the San Joaquin Valley, which in its pre-irrigation state was a vegetation-hostile desert, the somewhat less arid Sacramento Valley had significant tracts of forest prior to the arrival of settlers of European ancestry. Most of it was cut down during the California Gold Rush and the ensuing wave of American settlement, although there are still some heavily tree-populated areas, such as the greater Sacramento area.
Foothills become more common from just south of Corning to Shasta Lake City. These are known as the Valley Hills and begin south of the Tehama-Glenn County line near Corning. There are also a few hills in Red Bluff and Corning. There is one major range of foothills between Cottonwood and Red Bluff known as the Cottonwood Hills (a.k.a. 9-mile Hill), and there is the Cottonwood Ridge between Anderson and Cottonwood. There are some hills in Redding, a few more than Red Bluff, and north of Redding it is mainly foothills.
One distinctive geographic feature of the Sacramento Valley is the Sutter Buttes. Nicknamed the smallest mountain range in the world, it consists of the remnants of an extinct volcano and is located just outside Yuba City, 44 miles (71 km) north of Sacramento.
Agriculture
[edit]
Citrus and nut orchards and cattle ranches are common to both halves of the Central Valley. The Sacramento Valley's agricultural industry also resembles that of the San Joaquin Valley to the south. Nuts, such as almonds and walnuts, are of greater importance north of the Delta, and rice, nonviable in the drier San Joaquin Valley, is a major crop. While the region is wetter, soils are somewhat poorer in the Sacramento Valley; this means some crops, particularly vegetables, are less profitable compared to the San Joaquin Valley. The Sacramento Valley is also not as extensively cultivated; there are many more smallholdings and more uncultivated arable land compared to south of the Delta.
The town of Corning produces olives for oil extraction and for consumption as fruit. The Sunsweet Growers Incorporated headquarters are in Yuba City. The valley controls more than two-thirds of the worldwide prune market through the over 400 growers in California.[2]
Climate
[edit]Weather patterns in the Sacramento Valley are very similar to those in the San Joaquin Valley to the south, although the humidity and precipitation tend to be a bit higher. Summers are the dry season, with average daytime temperatures in the low to high 90s °F (low to mid 30s °C) but triple digits (38 °C and above) are a common occurrence, especially in Chico, Redding, Red Bluff, and Sacramento. Redding in particular has been notorious for having extremely hot summers despite its northern latitude within the United States,[3] with temperatures often matching and even exceeding that of Phoenix, Arizona in its hottest years; the city's annual high temperature averages at 112 °F (44 °C).[4]
In the summer, the "Delta Breeze", which comes in from the San Francisco Bay Area, is known for bringing cooler temperatures and higher humidity to the southern parts of the valley. While it brings comparative relief for residents of Sacramento and Roseville, it often results in somewhat muggy conditions, with dew points sometimes reaching above 70 °F (20 °C) and occasionally pushing the heat index above 115 °F (46 °C) on the hottest days. At times the Breeze is gusty with wind speeds up to 30 mph (50 km/h) in the valley and 45 mph (70 km/h) in the windy delta region. This Breeze can also bring morning low clouds at times into the region, but the clouds generally burn off quickly and temperatures stay cool. Summer-like conditions continue into early to mid-September but weather starts to change to cooler, wetter, foggier weather during October which gives trees vibrant autumn foliage.
Winters, also known as the rainy season, are generally mild to cool, foggy and wet. The valley and lower foothills are completely snowless outside of exceptional years where some flurries may occur. The rainy season runs from November to early-April, with some rainfall in September, October, and May. Up north, the temperature averages in the mid-40s °F (mid-to-high single digits °C) and lows reaching to the low-10s °F (-10 to -12 °C), colder in the northern part of the valley and colder still in the foothills and frost can occur almost anywhere. Farther south near Sacramento, temperatures tend to stay between the low-50s and high-60s °F (10-20 °C), with nighttime temperatures dropping to the mid-30s and 40s °F (1-7 °C). Lower-elevation snowfall (in a relative sense) is more consistent in the foothills immediately above Sacramento and Folsom than anywhere else in California; Pollock Pines at 3,980 feet (1,210 m), gets an average of 65 inches (170 cm) of snow every winter, nearly double that of Yosemite Valley and more than triple that of Lucerne, Switzerland.
During the rainy season, the Sacramento Valley is prone to strong thunderstorms and tornadoes, mostly of EF0 or EF1 intensity, especially in Colusa County and areas around Corning and Orland. Flooding does occur at times during wetter periods, usually November to March. Snow in the valley is rare, although Redding and Red Bluff, being at the north end of the valley, often experience a light dusting or two per year. Chico may get a rain-snow mix every few years, but, on the average, only snows about every 5 years. Farther south in Sacramento, snow rarely occurs. During the autumn and winter months, the entire Central Valley is susceptible to dense tule fog that makes driving hazardous, especially at night and especially south of Corning. The fog can last for weeks depending on how weak the wind is. In more recent years, statewide droughts in California have further strained both the Sacramento Valley's and the San Joaquin Valley's water security.[1]
| Climate data for Sacramento, California (Sacramento Executive Airport), 1991–2020 normals, extremes 1941–present[a] | |||||||||||||
|---|---|---|---|---|---|---|---|---|---|---|---|---|---|
| Month | Jan | Feb | Mar | Apr | May | Jun | Jul | Aug | Sep | Oct | Nov | Dec | Year |
| Record high °F (°C) | 76 (24) |
78 (26) |
88 (31) |
95 (35) |
105 (41) |
115 (46) |
114 (46) |
112 (44) |
114 (46) |
104 (40) |
87 (31) |
74 (23) |
115 (46) |
| Mean maximum °F (°C) | 65.2 (18.4) |
71.1 (21.7) |
78.1 (25.6) |
87.4 (30.8) |
95.3 (35.2) |
103.1 (39.5) |
105.3 (40.7) |
104.1 (40.1) |
100.6 (38.1) |
91.8 (33.2) |
76.5 (24.7) |
65.1 (18.4) |
107.0 (41.7) |
| Mean daily maximum °F (°C) | 56.0 (13.3) |
61.3 (16.3) |
66.3 (19.1) |
72.1 (22.3) |
80.3 (26.8) |
87.9 (31.1) |
92.6 (33.7) |
91.9 (33.3) |
88.5 (31.4) |
78.8 (26.0) |
65.0 (18.3) |
56.0 (13.3) |
74.7 (23.7) |
| Daily mean °F (°C) | 47.6 (8.7) |
51.4 (10.8) |
55.4 (13.0) |
59.5 (15.3) |
66.1 (18.9) |
72.2 (22.3) |
75.9 (24.4) |
75.3 (24.1) |
72.5 (22.5) |
64.5 (18.1) |
53.9 (12.2) |
47.3 (8.5) |
61.8 (16.6) |
| Mean daily minimum °F (°C) | 39.2 (4.0) |
41.5 (5.3) |
44.5 (6.9) |
47.0 (8.3) |
52.0 (11.1) |
56.5 (13.6) |
59.2 (15.1) |
58.8 (14.9) |
56.5 (13.6) |
50.3 (10.2) |
42.7 (5.9) |
38.5 (3.6) |
48.9 (9.4) |
| Mean minimum °F (°C) | 29.1 (−1.6) |
31.7 (−0.2) |
35.1 (1.7) |
37.9 (3.3) |
44.1 (6.7) |
49.5 (9.7) |
54.1 (12.3) |
53.8 (12.1) |
49.6 (9.8) |
41.7 (5.4) |
32.7 (0.4) |
28.7 (−1.8) |
26.9 (−2.8) |
| Record low °F (°C) | 20 (−7) |
23 (−5) |
26 (−3) |
31 (−1) |
34 (1) |
41 (5) |
48 (9) |
48 (9) |
42 (6) |
35 (2) |
26 (−3) |
18 (−8) |
18 (−8) |
| Average precipitation inches (mm) | 3.66 (93) |
3.49 (89) |
2.68 (68) |
1.26 (32) |
0.75 (19) |
0.23 (5.8) |
0.00 (0.00) |
0.04 (1.0) |
0.09 (2.3) |
0.85 (22) |
1.66 (42) |
3.43 (87) |
18.14 (461) |
| Average precipitation days (≥ 0.01 in) | 10.0 | 9.1 | 9.0 | 5.1 | 3.6 | 1.1 | 0.1 | 0.2 | 0.7 | 3.1 | 6.1 | 9.6 | 57.7 |
| Average relative humidity (%) | 83.3 | 76.8 | 71.6 | 64.5 | 58.9 | 55.0 | 53.2 | 55.7 | 57.0 | 63.1 | 75.6 | 82.9 | 66.5 |
| Average dew point °F (°C) | 39.4 (4.1) |
42.1 (5.6) |
42.8 (6.0) |
43.7 (6.5) |
46.9 (8.3) |
50.4 (10.2) |
53.1 (11.7) |
53.4 (11.9) |
50.9 (10.5) |
47.5 (8.6) |
43.7 (6.5) |
39.2 (4.0) |
46.1 (7.8) |
| Mean monthly sunshine hours | 145.5 | 201.3 | 278.0 | 329.6 | 406.3 | 419.5 | 440.2 | 406.9 | 347.8 | 296.7 | 194.9 | 141.1 | 3,607.8 |
| Percentage possible sunshine | 48 | 67 | 75 | 83 | 92 | 94 | 98 | 96 | 93 | 86 | 64 | 48 | 81 |
| Source: NOAA (relative humidity, dew point and sun 1961–1990)[6][7][8] | |||||||||||||
| Climate data for Sacramento 5 ESE, California (Sacramento State[9]), 1991–2020 normals, extremes 1877–present | |||||||||||||
|---|---|---|---|---|---|---|---|---|---|---|---|---|---|
| Month | Jan | Feb | Mar | Apr | May | Jun | Jul | Aug | Sep | Oct | Nov | Dec | Year |
| Record high °F (°C) | 79 (26) |
80 (27) |
90 (32) |
98 (37) |
107 (42) |
112 (44) |
114 (46) |
112 (44) |
116 (47) |
102 (39) |
86 (30) |
72 (22) |
116 (47) |
| Mean maximum °F (°C) | 66.4 (19.1) |
72.5 (22.5) |
80.6 (27.0) |
89.5 (31.9) |
97.1 (36.2) |
104.4 (40.2) |
106.7 (41.5) |
105.5 (40.8) |
102.0 (38.9) |
92.3 (33.5) |
77.3 (25.2) |
65.9 (18.8) |
108.1 (42.3) |
| Mean daily maximum °F (°C) | 56.5 (13.6) |
62.2 (16.8) |
67.8 (19.9) |
73.5 (23.1) |
81.3 (27.4) |
89.0 (31.7) |
94.4 (34.7) |
93.5 (34.2) |
89.3 (31.8) |
78.9 (26.1) |
65.3 (18.5) |
56.4 (13.6) |
75.7 (24.3) |
| Daily mean °F (°C) | 48.8 (9.3) |
52.9 (11.6) |
57.2 (14.0) |
61.4 (16.3) |
67.7 (19.8) |
73.9 (23.3) |
77.9 (25.5) |
77.3 (25.2) |
74.0 (23.3) |
65.9 (18.8) |
55.3 (12.9) |
48.5 (9.2) |
63.4 (17.4) |
| Mean daily minimum °F (°C) | 41.1 (5.1) |
43.7 (6.5) |
46.7 (8.2) |
49.3 (9.6) |
54.0 (12.2) |
58.7 (14.8) |
61.4 (16.3) |
61.0 (16.1) |
58.8 (14.9) |
52.9 (11.6) |
45.3 (7.4) |
40.7 (4.8) |
51.1 (10.6) |
| Mean minimum °F (°C) | 32.5 (0.3) |
35.4 (1.9) |
38.8 (3.8) |
41.6 (5.3) |
47.2 (8.4) |
51.9 (11.1) |
55.9 (13.3) |
55.9 (13.3) |
52.4 (11.3) |
45.1 (7.3) |
36.2 (2.3) |
31.9 (−0.1) |
30.5 (−0.8) |
| Record low °F (°C) | 19 (−7) |
21 (−6) |
29 (−2) |
34 (1) |
37 (3) |
43 (6) |
47 (8) |
48 (9) |
44 (7) |
34 (1) |
27 (−3) |
17 (−8) |
17 (−8) |
| Average precipitation inches (mm) | 3.87 (98) |
3.63 (92) |
2.82 (72) |
1.44 (37) |
0.86 (22) |
0.21 (5.3) |
0.00 (0.00) |
0.02 (0.51) |
0.15 (3.8) |
0.93 (24) |
1.78 (45) |
3.49 (89) |
19.20 (488) |
| Average precipitation days (≥ 0.01 in) | 10.8 | 9.6 | 9.2 | 5.3 | 3.7 | 1.2 | 0.1 | 0.2 | 0.8 | 3.1 | 6.8 | 10.1 | 60.9 |
| Source: NOAA[6][10][11], Western Regional Climate Center[12] | |||||||||||||
| Climate data for Chico, California (1981–2010 normals) | |||||||||||||
|---|---|---|---|---|---|---|---|---|---|---|---|---|---|
| Month | Jan | Feb | Mar | Apr | May | Jun | Jul | Aug | Sep | Oct | Nov | Dec | Year |
| Record high °F (°C) | 77 (25) |
82 (28) |
93 (34) |
98 (37) |
108 (42) |
115 (46) |
117 (47) |
116 (47) |
114 (46) |
107 (42) |
91 (33) |
78 (26) |
117 (47) |
| Mean daily maximum °F (°C) | 55.1 (12.8) |
61.1 (16.2) |
66.3 (19.1) |
72.6 (22.6) |
81.3 (27.4) |
88.7 (31.5) |
94.2 (34.6) |
93.7 (34.3) |
89.7 (32.1) |
79.4 (26.3) |
64.8 (18.2) |
55.6 (13.1) |
75.3 (24.1) |
| Mean daily minimum °F (°C) | 35.4 (1.9) |
38.3 (3.5) |
41.5 (5.3) |
45.2 (7.3) |
51.9 (11.1) |
56.7 (13.7) |
60.5 (15.8) |
58.3 (14.6) |
54.6 (12.6) |
46.9 (8.3) |
39.9 (4.4) |
35.3 (1.8) |
47.1 (8.4) |
| Record low °F (°C) | 12 (−11) |
16 (−9) |
23 (−5) |
27 (−3) |
30 (−1) |
38 (3) |
40 (4) |
38 (3) |
35 (2) |
23 (−5) |
20 (−7) |
11 (−12) |
11 (−12) |
| Average precipitation inches (mm) | 4.86 (123) |
4.42 (112) |
4.29 (109) |
1.75 (44) |
1.04 (26) |
.48 (12) |
.02 (0.51) |
.08 (2.0) |
.42 (11) |
1.42 (36) |
3.28 (83) |
4.61 (117) |
26.67 (677) |
| Source: Western Regional Climate Center [13] | |||||||||||||
| Climate data for Redding, California (1961–1990) | |||||||||||||
|---|---|---|---|---|---|---|---|---|---|---|---|---|---|
| Month | Jan | Feb | Mar | Apr | May | Jun | Jul | Aug | Sep | Oct | Nov | Dec | Year |
| Mean daily maximum °F (°C) | 57.3 (14.1) |
61.3 (16.3) |
62.5 (16.9) |
69.9 (21.1) |
80.5 (26.9) |
90.4 (32.4) |
98.3 (36.8) |
95.7 (35.4) |
89.3 (31.8) |
77.6 (25.3) |
62.1 (16.7) |
54.7 (12.6) |
74.8 (23.8) |
| Daily mean °F (°C) | 45.5 (7.5) |
50.7 (10.4) |
52.5 (11.4) |
58 (14) |
66.4 (19.1) |
76.1 (24.5) |
81.5 (27.5) |
79.5 (26.4) |
74.1 (23.4) |
63.5 (17.5) |
51.8 (11.0) |
45 (7) |
62 (17) |
| Mean daily minimum °F (°C) | 35.7 (2.1) |
40 (4) |
41.7 (5.4) |
46 (8) |
52.3 (11.3) |
61.8 (16.6) |
64.7 (18.2) |
63.1 (17.3) |
58.8 (14.9) |
49.2 (9.6) |
41.4 (5.2) |
35.2 (1.8) |
49.2 (9.6) |
| Average precipitation inches (mm) | 6.06 (154) |
4.45 (113) |
4.38 (111) |
2.08 (53) |
1.27 (32) |
0.56 (14) |
0.17 (4.3) |
0.46 (12) |
0.91 (23) |
2.24 (57) |
5.21 (132) |
5.51 (140) |
33.3 (850) |
| Average precipitation days | 13.1 | 8.7 | 12.3 | 7.9 | 7.2 | 4.0 | 0.6 | 0.9 | 2.1 | 4.1 | 6.8 | 10.2 | 77.9 |
| Mean monthly sunshine hours | 226 | 256 | 312 | 351 | 395 | 423 | 451 | 421 | 338 | 314 | 251 | 204 | 3,942 |
| Source: [14] | |||||||||||||
Transportation
[edit]Interstate 5 is the primary route through the Sacramento Valley, traveling north–south roughly along the valley's western edge. Interstate 80 cuts a northeast-to-southwest swath through the southern end of the valley, mostly through Sacramento and Yolo Counties, and ends at the San Francisco-Oakland Bay Bridge. Several secondary routes connect the two roads, including Interstate 505 and State Route 113. The Sacramento area has a web of urban freeways.
Other principal routes in the region include State Route 99, which runs along the valley's eastern edge, roughly parallel to I-5, from Sacramento until its northern terminus in Red Bluff; State Route 20, which traverses the valley from west to east on its route from State Route 1 in Mendocino County to the Donner Pass; State Route 49, named in honor of the California Gold Rush and running through many old mining towns in the foothills of the valley; and State Route 45, which runs along the course of the Sacramento River roughly ten miles (16 km) east of I-5.
The Union Pacific Railroad serves the valley, with its principal north–south line from Oakland, California to Portland, Oregon, via Sacramento, Marysville, Chico, and Redding. This is also the route of Amtrak's Coast Starlight passenger train. The Union Pacific also has two east–west lines, through Donner Pass (the former Central Pacific Railroad), and through the Feather River gorge (the former Western Pacific Railroad). Amtrak's California Zephyr uses the Donner Pass route. The BNSF Railway has a line from Klamath Falls, Oregon, to a junction with the Union Pacific Feather River line at Keddie. The BNSF has trackage rights on both the UP east–west routes. In addition, the California Northern Railroad operates the former Southern Pacific Railroad line on the west side of the valley from Davis to Tehama (near Red Bluff).
Educational institutions
[edit]
.jpg)
- University of California, Davis
- California State University, Chico
- California State University, Sacramento
- Simpson University, in Redding
- William Jessup University, in Rocklin
- McGeorge School of Law in Sacramento
- American River College, in Sacramento
- Butte College, in Oroville
- Cosumnes River College, in Sacramento
- Folsom Lake College, in Folsom
- Sacramento City College, in Sacramento
- Shasta College, in Redding
- Sierra College, in Rocklin
- Solano Community College, Vacaville Center, in Vacaville
- Woodland Community College, in Woodland
- Yuba Community College, in Marysville
Professional sports teams
[edit]National Basketball Association (NBA)
[edit]Major League Baseball (MLB)
[edit]Pacific Coast League (minor league baseball)
[edit]Independent Women's Football League
[edit]Women's Premier Soccer League
[edit]United Soccer League (USL)
[edit]Cities
[edit]Cities with over 500,000 inhabitants
[edit]Cities with 100,000 to 400,000 inhabitants
[edit]Cities with 50,000 to 100,000 inhabitants
[edit]Cities with 10,000 to 50,000 inhabitants
[edit]Cities with under 10,000 inhabitants
[edit]See also
[edit]- Sacramento Valley Museum
- Sacramento Valley Railroad (1852–77)
- Sacramento Valley and Eastern Railway (1908–1930s)
- Leonard M. Landsborough (ca. 1858–1927) — Sacramento Valley landowner and legislator for the area.
- John Buttencourt Avila — father of the sweet potato industry.
- Sacramento Valley National Cemetery
Notes
[edit]References
[edit]- ^ a b c McGough, Michael (April 29, 2022). "Southern California gets drastic water cutbacks amid drought. What's next for Sacramento?". Sacramento Bee. Retrieved May 1, 2022.
- ^ "Sunsweet Growers Inc". Careers in food. Archived from the original on 2011-09-30. Retrieved 2011-11-13.
- ^ Rocca, A.M.; Society, S.H. (2004). Redding. Images of America. Arcadia. p. 36. ISBN 978-0-7385-2934-9. Retrieved 2024-07-21.
- ^ "Climate". www.weather.gov. Retrieved 2025-02-01.
- ^ "Threaded Extremes". threadex.rcc-acis.org.
- ^ a b "NowData – NOAA Online Weather Data". National Oceanic and Atmospheric Administration. Retrieved 2021-10-14.
- ^ "Summary of Monthly Normals SACRAMENTO EXECUTIVE AP, CA US 1991-2020". National Oceanic and Atmospheric Administration. Archived from the original on 2023-07-05. Retrieved 2021-10-14.
- ^ "WMO Climate Normals for SACRAMENTO/EXECUTIVE ARPT CA 1961–1990". National Oceanic and Atmospheric Administration. Archived from the original on 2023-07-05. Retrieved 2020-07-19.
- ^ Reese, Phillip (January 7, 2015). "2014 was hottest year in Sacramento's history". Sacramento Bee.
- ^ "Summary of Monthly Normals SACRAMENTO 5 ESE, CA US 1991–2020". National Oceanic and Atmospheric Administration. Retrieved 2021-10-14.
- ^ "Global Summary of the Month". National Oceanic and Atmospheric Administration. Retrieved 2021-10-14.
- ^ "SACRAMENTO 5 ESE, CALIFORNIA". Western Regional Climate Center.
- ^ "CHICO EXPERIMENT STN, CALIFORNIA". Western Regional Climate Center. Retrieved October 24, 2012.
- ^ "Average Weather for Redding, CA - Temperature and Precipitation". Retrieved 31 December 2009.
- ^ West Sacramento is the temporary home of the Athletics from 2025-2027
| International | |
|---|---|
| National | |
| Other | |
Sacramento Valley
View on GrokipediaGeography
Topography and Boundaries
The Sacramento Valley forms the northern segment of California's Central Valley, extending roughly 150 miles from the vicinity of Redding southward to the Sacramento-San Joaquin Delta.[7] It is bounded on the east by the Sierra Nevada and southern Cascade Range, on the west by the Coast Ranges, on the north by the Klamath Mountains, and on the south by the topographic transition into the San Joaquin Valley near the Delta.[9][10] The valley encompasses approximately 10,500 square miles across portions of nine counties, including Butte, Colusa, Glenn, Sacramento, and Yolo.[11] Topographically, the region consists primarily of a flat to gently undulating alluvial plain, shaped by millennia of sediment deposition from rivers draining the surrounding highlands.[12] Elevations across the valley floor range from slightly below sea level in subsiding areas near the Delta to about 300 feet above sea level toward the northern end.[12] The average width varies from 30 to 60 miles, narrowing in the north and broadening slightly southward.[7] Distinct topographic features include the Sutter Buttes, a cluster of eroded volcanic domes constituting the valley's sole significant inland elevation anomaly, with peaks reaching 2,122 feet at South Butte. The valley margins feature steeper foothills and bluffs where alluvial sediments abut the resistant bedrock of adjacent ranges, influencing drainage patterns and local microclimates.[13] These boundaries and landforms result from tectonic subsidence in the Great Valley forearc basin, filled by erosional products from uplifted margins since the Cretaceous period.[13]Rivers and Hydrology
The Sacramento River serves as the primary waterway of the Sacramento Valley, originating near Mount Shasta and extending approximately 380 miles southward before merging with the San Joaquin River to form the Sacramento-San Joaquin Delta.[14] Its basin encompasses about 27,000 square miles, draining the eastern slopes of the Coast Ranges, Mount Shasta, the western Cascades, and the northern Sierra Nevada.[15] The river's average annual runoff reaches 27 billion cubic meters, making it California's largest by discharge volume.[16] Major tributaries include the Feather River, the largest at 211 miles long, originating in the Sierra Nevada and joining the Sacramento near Verona; the Yuba River, flowing from the Sierra Nevada to the Feather near Yuba City; and the American River, which contributes from the Sierra Nevada foothills.[17] These rivers collectively supply the valley's surface water, with the Sacramento-Feather system featuring natural levees that historically formed backwater basins.[18] Hydrologically, the system relies on Sierra Nevada snowmelt for peak flows from April to June, with low summer discharges augmented by reservoirs.[19] Flooding has been recurrent due to winter storms and rapid snowmelt; pre-levee eras saw regular inundations, prompting construction of weirs, bypasses, and dams like Shasta Dam for control.[20] [21] The Central Valley Project and State Water Project manage flows, reducing flood risks while supporting irrigation and urban supply, though backwater effects from high Feather River flows persist near key weirs.[22] Annual runoff in the Sacramento River Hydrologic Region averages 22.4 million acre-feet.[23]History
Indigenous Peoples and Pre-Columbian Era
The Sacramento Valley was inhabited by several indigenous groups prior to European contact, including the Patwin peoples to the west of the Sacramento River, the Nisenan (also known as Southern Maidu) in the eastern reaches along the American and Yuba Rivers, the Plains Miwok to the south, and the Maidu to the north.[24][5][25] These groups maintained distinct territories shaped by riverine and foothill ecotones, with overlapping seasonal use of resources across tribal boundaries.[26] Archaeological evidence documents human occupation in the valley extending back at least 7,000 years, with sites revealing stratified deposits of artifacts, food remains, and structural features often preserved beneath alluvial sediments from periodic flooding.[27][28] Earlier Paleo-Indian presence in California is attested from around 8,000 BCE, though Sacramento Valley-specific records emphasize post-glacial adaptations to wetland and oak-savanna environments by the mid-Holocene.[29] Over time, prehistoric patterns shifted toward greater residential stability near major waterways like the Sacramento River, as indicated by increased density of village middens and grinding tools.[26][30] These societies practiced a hunter-gatherer economy reliant on the valley's seasonal abundance, harvesting acorns as a staple through leaching and grinding into flour, fishing salmon and sturgeon during river runs, and hunting deer, rabbits, and waterfowl across tule marshes and grasslands.[24][31] Semi-permanent villages of earth-covered lodges clustered along rivers supported populations sustained by controlled burns to promote seed production and game habitats, with tule reeds used for basketry, mats, and watercraft.[32][5] Social organization centered on tribelets—small kin-based polities of a few hundred people—governed by headmen and shamans, with trade networks exchanging shell beads and obsidian tools from distant Sierra Nevada sources.[33] The region's pre-contact population contributed to California's estimated 310,000 indigenous inhabitants in 1769, with the Central Valley's reliable hydrology supporting one of the state's densest concentrations due to predictable food surpluses.[34][35]European Exploration and Early Settlement
The first recorded European sighting of the Sacramento Valley occurred during the Spanish expedition led by Pedro Fages in 1772, when members ascended Mount Diablo and observed the expansive plain of the Central Valley to the north, though they did not enter it directly.[36] Subsequent Spanish military expeditions under Gabriel Moraga penetrated the valley proper starting in 1806, with Moraga's 1808 campaign from Mission San José marking the initial overland entry by Europeans, where his party of soldiers traversed the region, encountered indigenous groups, and identified key waterways including the forks of the Sacramento River, which they named Rio de los Sacramentso after observing native rituals.[37][38] These punitive and exploratory forays, numbering several between 1805 and 1817, aimed to subjugate native populations for mission labor and map the interior, extending as far north as the upper Sacramento River basin but establishing no permanent outposts due to logistical constraints and focus on coastal missions.[37] Further reconnaissance followed in 1817 under Lieutenant Luis Argüello, who led a party northward along the Sacramento River from the San Francisco Bay Delta, mapping its course and assessing potential mission sites amid reports of hostile native encounters.[39] American fur trappers introduced the next wave of non-Hispanic European activity, with Jedediah Smith crossing the Sierra Nevada in 1827 as the first U.S. citizen to enter the valley overland, trapping beaver along the rivers and documenting the terrain's fertility and native populations in his journals, which later informed American expansionist interests.[36] These transient visits by trappers from the Hudson's Bay Company and American firms in the 1820s and 1830s heightened awareness of the valley's resources but yielded minimal settlement until the Mexican secularization of missions in the 1830s disrupted Spanish influence. Early permanent European settlement commenced with John Augustus Sutter, a Swiss immigrant fleeing debts, who arrived in Mexican Alta California in 1839 and secured a provisional land grant from Governor Juan Bautista Alvarado for the 48,000-acre Rancho New Helvetia near the confluence of the American and Sacramento Rivers.[40] By 1841, Sutter formalized the grant and constructed Sutter's Fort, a fortified adobe compound that served as an agricultural outpost, trading post, and refuge, attracting a multiracial workforce of approximately 1,000 including Hawaiian, Native American, and European laborers to cultivate wheat, raise cattle, and produce lumber via a water-powered sawmill.[40] This settlement, operational until the Gold Rush overwhelmed it, represented the valley's inaugural non-indigenous agricultural enterprise, fostering trade networks with coastal pueblos and laying infrastructural foundations amid ongoing native resistance and Mexican administrative instability.[40] Isolated homesteads, such as that of Flemish settler Jan Low, emerged nearby by 1844, but Sutter's operations dominated the sparse pre-1848 European footprint, numbering fewer than a dozen families.[5]Gold Rush and American Expansion
The discovery of gold at Sutter's Mill on January 24, 1848, by James W. Marshall, a carpenter working for John Sutter, marked the onset of the California Gold Rush in the foothills bordering the Sacramento Valley.[41][42][43] The site, located on the South Fork of the American River near Coloma, yielded nuggets that confirmed placer deposits, drawing initial prospectors from nearby settlements despite Sutter's efforts to suppress the news to protect his agricultural enterprises.[44] This event accelerated American expansion into California, which had been formally transferred to the United States via the Treaty of Guadalupe Hidalgo on May 30, 1848, ending the Mexican-American War that began in 1846. News of the strikes spread rapidly via ships and overland routes, prompting an influx of migrants dubbed "forty-niners," primarily from the eastern United States, but also from Europe, Latin America, and Asia.[42] California's non-native population exploded from approximately 14,000 in early 1848 to nearly 100,000 by the end of 1849, with the Sacramento Valley serving as the primary entry point and supply corridor due to its navigable rivers and proximity to the Sierra Nevada diggings.[43] Sacramento emerged as a pivotal settlement in this expansion, evolving from Sutter's Fort—a pre-rush trading outpost—into a bustling port city laid out in late 1848 and incorporated on February 22, 1849.[45] Its location at the confluence of the Sacramento and American Rivers facilitated steamboat transport of goods like tools, food, and lumber to miners, generating immense economic activity; by 1849, the city hosted thousands of temporary merchants and serviced routes to the gold fields, though it also suffered from fires and floods amid unchecked growth. The rush's demographic surge overwhelmed provisional governance, spurring the Monterey Constitutional Convention in 1849 and California's rapid admission to the Union as a free state on September 9, 1850, under the Compromise of 1850.[46] This formalized American dominance in the region, shifting the Sacramento Valley from frontier outpost to integrated economic hub, though early yields peaked by 1852 as surface deposits dwindled, prompting diversification into agriculture on valley farmlands enriched by miner runoff.[47]Irrigation Era and 20th-Century Growth
The Irrigation Era in the Sacramento Valley began in earnest after the decline of wheat monoculture in the late 19th century, as declining soil fertility and market competition prompted farmers to adopt water diversion systems for more reliable cropping. The California Wright Act of 1887 enabled the formation of public irrigation districts, allowing collective financing and management of water infrastructure through bonds and assessments, which facilitated expansion beyond riparian lands.[6] By 1900-1920, extensive irrigation networks transformed the landscape, with major developments accelerating from 1905 onward; these systems supported cultivation of water-intensive crops like orchards, rice, and alfalfa on previously marginal soils.[6] By 1912, approximately 76,500 acres in the Sacramento Valley were under irrigation, excluding Delta areas, reflecting early district-led efforts.[48] In 1929, 51 irrigation districts and related entities delivered water to 282,000 acres across the valley, comprising 22 public districts under the Wright Act, 19 mutual water companies, and 10 public utility systems.[6] This infrastructure spurred agricultural diversification, shifting from grain dominance to permanent crops such as fruit trees—outranking wheat in acreage by 1883-1900—and boosted land values through reclamation, subdivision of large ranches, and increased tax revenues.[6] Federal intervention marked a pivotal advancement with the Central Valley Project (CVP), initially conceptualized in the 1870s to transfer surplus Sacramento River water southward but authorized as a state project in 1933 and federally adopted in 1935 under President Roosevelt.[21] Key northern facilities included Shasta Dam, construction of which began in the late 1930s and provided storage for flood control, hydropower, and irrigation; Folsom Dam, completed in 1956; and the Red Bluff Diversion Dam, operational by 1969.[21] The Sacramento River Division of the CVP supplied water to counties like Tehama, Glenn, Colusa, and Yolo, irrigating vast expanses and underpinning three-quarters of California's total irrigated farmland by mid-century.[21] These developments fueled 20th-century economic growth, with irrigated agriculture generating output exceeding the cumulative value of all gold mined in California since 1848 and preventing over $5 billion in flood damages from 1950-1991.[21] Mechanization, including widespread adoption of tractors and harvesters in the early 20th century, amplified productivity, while crop specialization—such as rice in the northern valley, introduced around 1912—drove exports and rural prosperity.[49] Population in agricultural counties expanded alongside farmland conversion, though urban centers like Sacramento benefited indirectly from stabilized water supplies and ag-related processing industries.[50] By the late 20th century, the valley's irrigated cropland supported a diverse economy, with 82% of Sacramento Valley farmland reliant on irrigation from rivers, districts, and projects like the CVP.[51]Post-2000 Developments
The Sacramento Valley experienced accelerated population growth and urbanization following 2000, with the Sacramento metropolitan area's population rising from about 1.5 million in 2000 to 2.243 million by 2024, driven by relative housing affordability and influx from coastal California regions.[52] This demographic shift converted significant farmland into residential and commercial suburbs, particularly in counties like Sacramento, Placer, and Yolo, contributing to economic diversification beyond agriculture through expanded government, healthcare, and logistics sectors.[53] Sacramento County's population increased in 11 of 12 years between 2010 and 2022, with the largest annual gain of 2.2% occurring from 2019 to 2020 amid broader state migration patterns.[54] Agriculturally, the valley maintained its role as a powerhouse, producing over 250 crops valued at billions annually, though farming's share of the regional economy declined amid urbanization and water constraints.[18] The 2008 financial crisis temporarily slowed growth, but recovery saw rising farm water values supporting diversified enterprises like nut orchards and specialty crops, bolstered by State Water Project deliveries that enabled population and economic expansion.[55][56] Water marketing reforms emerged as a tool to address scarcity, facilitating transfers between agricultural users during shortages.[57] Environmental challenges intensified, including the severe 2012–2016 drought, which strained groundwater and surface supplies, prompting legislative responses like the 2014 Sustainable Groundwater Management Act to curb overpumping in overdrafted basins.[58] Subsequent atmospheric river events caused major flooding, such as in 2017 when levee breaches affected communities, and in early 2023 when storms overwhelmed parts of the valley, killing at least one and testing infrastructure built for historical risks.[59][60] These cycles of drought and flood, exacerbated by increased weather extremes, underscored vulnerabilities in the region's levee-dependent flood control and water allocation systems, originally designed in the 19th and 20th centuries.[61]Climate and Environment
Climatic Characteristics
The Sacramento Valley exhibits a hot-summer Mediterranean climate, marked by prolonged hot and arid summers contrasted with mild, wet winters, influenced by its inland position and proximity to the Pacific Ocean's moisture-laden storms.[62] This regime results in low annual precipitation concentrated in the cooler months, fostering conditions suitable for agriculture with irrigation but prone to seasonal extremes.[63] Average annual precipitation across the valley floor totals about 18 inches, primarily from winter frontal systems, with over half occurring between November and February; summers from June through August receive negligible rainfall, often less than 0.1 inches per month.[63] [62] Temperatures show marked seasonality, with annual averages of 75°F for highs and 49°F for lows; July, the warmest month, sees average highs of 93°F and lows of 58°F, while December features highs around 55°F and lows near 40°F.[64] [63]| Month | Avg. High (°F) | Avg. Low (°F) | Avg. Precip. (in) |
|---|---|---|---|
| January | 56 | 40 | 3.7 |
| February | 62 | 42 | 3.5 |
| March | 66 | 45 | 2.8 |
| April | 72 | 47 | 1.2 |
| May | 80 | 52 | 0.7 |
| June | 87 | 57 | 0.2 |
| July | 93 | 58 | 0.1 |
| August | 92 | 58 | 0.1 |
| September | 89 | 55 | 0.3 |
| October | 79 | 50 | 1.0 |
| November | 65 | 44 | 2.3 |
| December | 55 | 39 | 3.0 |
Historical Variability and Natural Disasters
The Sacramento Valley's climate exhibits pronounced historical variability, characterized by oscillations between extended wet and dry periods influenced by atmospheric rivers and large winter storms. Paleo-climatic reconstructions indicate multi-century megadroughts, such as one spanning approximately 1100 to 1400 CE in the Sacramento River basin, alongside intense single-year dry spells and multi-year deficits evident in tree-ring and sediment records spanning over 1,000 years.[65] Instrumental records since the late 19th century confirm this pattern, with the valley experiencing severe droughts like the six-year event of 1929-1934 and the two-year drought of 1976-1977, the latter marked as the most intense in terms of precipitation and runoff deficits.[66] [67] Conversely, extreme wet phases have triggered catastrophic flooding, underscoring the region's hydrological sensitivity to Pacific storm variability.[61] Flooding represents the most recurrent and destructive natural disaster in the Sacramento Valley, primarily driven by overflows from the Sacramento River and its tributaries during prolonged atmospheric river events. The Great Flood of 1861-1862 stands as the largest in California's recorded history, inundating the valley for 43 days and transforming much of it into an inland lake, with Sacramento City submerged under 10 feet of water and economic losses exceeding $10 million (equivalent to hundreds of millions today).[68] Subsequent major floods include the 1955 event that damaged levees across 219,000 acres, the 1986 storm yielding the highest recorded elevations in the Point Pleasant area over a 10-day period, and the 1997 New Year's flood that caused widespread levee breaches and over $500 million in damages across Northern California.[59] [69] [70] More recent incidents in 2006 and 2017 further highlight ongoing vulnerabilities despite infrastructure like weirs and levees, with riverine flooding affecting agricultural lands, urban areas, and water conveyance systems.[59] [20] Droughts have profoundly impacted the valley's agriculture-dependent economy, depleting surface and groundwater supplies and exacerbating soil salinity and subsidence. The 1976-1977 drought, though brief, registered as California's most severe in hydrological terms, with Sacramento Valley streamflows dropping to 20-30% of average and triggering widespread crop failures.[66] The prolonged 1987-1992 drought reduced Central Valley rice production by up to 50% in peak years, while the 2012-2016 event—the longest in modern records—led to fallowed lands exceeding 1 million acres valley-wide, groundwater overdraft acceleration, and tree mortality in adjacent Sierra foothills.[71] [72] Historical analyses reveal that such droughts often cluster in decadal cycles, with the 1929-1934 period compounding Dust Bowl conditions and prompting early irrigation expansions.[67] While floods and droughts dominate, the valley faces secondary risks from seismic activity and wildfires, though these are less frequent in the flatlands compared to surrounding uplands. Moderate earthquakes, linked to regional faults like the Foothills Fault System, have occasionally damaged levees, as in the 1975 Oroville event (magnitude 5.7) that threatened Delta infrastructure.[20] Wildfires, intensified by dry fuels during drought phases, primarily threaten foothill communities but contribute to post-fire debris flows and water quality degradation in valley rivers.[73] Overall, the interplay of climatic extremes has driven adaptive measures, from 19th-century levee construction to modern reservoir management, yet paleo-evidence suggests potential for surpassing instrumental-era intensities under shifting variability.[74]Economy
Agricultural Sector
The Sacramento Valley's agricultural sector spans approximately 2.5 million irrigated acres, forming a critical component of California's $59.4 billion agricultural output in 2023, with the region specializing in water-intensive field crops due to its alluvial soils and proximity to the Sacramento River watershed. Rice dominates production, comprising about 95% of California's total rice acreage and yield, primarily in counties like Colusa, Sutter, and Butte, where flooded fields support high-efficiency cultivation yielding over 8,000 pounds per acre in normal years. Other key commodities include processing tomatoes, walnuts, almonds, prunes, and wine grapes, with the valley's diverse climate zones enabling year-round operations supported by extensive canal networks and reservoirs.[75] Irrigation underpins the sector, drawing from surface diversions averaging 5.5 million acre-feet annually after in-stream flows, supplemented by groundwater that constitutes up to 40% of supply in drier periods, enabling the valley to account for 21% of California's irrigated farmland. Efficient practices, such as laser-leveling for rice paddies and drip systems for orchards, have improved water productivity, but the region's dependence on Sierra Nevada snowpack and variable precipitation exposes it to hydrological risks. In Sacramento County, a representative area, 2023 gross crop value reached $584.8 million, down 3% from 2022 amid fluctuating commodity prices.[76][55] Droughts pose severe challenges, as evidenced by the 2020-2022 event, which inflicted over $1.3 billion in losses through fallowing 600 square miles of land, a 50% rice acreage reduction, and 14,300 job cuts, amplifying pest outbreaks like migratory insects thriving in desiccated landscapes. Regulatory water allocations prioritizing environmental flows have curtailed senior rights holders, while evolving threats from heat stress, herbicide-resistant weeds, and diseases compound yield uncertainties, prompting shifts toward drought-tolerant varieties and precision agriculture technologies. Despite these pressures, the sector remains economically resilient, generating billions in regional value and supporting downstream industries like processing and export.[77][78]Non-Agricultural Industries and Diversification
The Sacramento Valley's non-agricultural economy is anchored by government administration, healthcare, education, and emerging technology sectors, which collectively employ hundreds of thousands and contribute significantly to regional GDP outside of farming. As the state capital, Sacramento hosts the largest state government workforce in California, with over 100,000 employees in public administration roles as of 2024, driving administrative, regulatory, and policy functions that support statewide operations.[79] [80] Healthcare represents another pillar, with major systems like UC Davis Health, Kaiser Permanente, Sutter Health, and Dignity Health employing tens of thousands; the sector accounted for more than 280,000 jobs across the broader Sacramento region in recent estimates, bolstered by medical research and aging population demands.[81] [80] [82] Education and higher learning institutions further diversify employment, with universities such as the University of California, Davis, and California State University, Sacramento, providing over 20,000 faculty and staff positions while fostering research in biotechnology and engineering.[83] The technology sector has gained traction since the 2010s, attracting firms in semiconductors, software, and agrifood tech—though the latter overlaps with processing—through incentives and proximity to Silicon Valley; companies like Intel and regional startups added thousands of jobs by 2024, supported by clusters in precision manufacturing and cleantech.[84] [83] Manufacturing, excluding primary food processing, includes aerospace components and advanced materials, with initiatives like the Sacramento Valley Manufacturing Initiative aiming to enhance competitiveness via workforce training and supply chain development since 2010.[85] Diversification efforts, led by organizations such as the Greater Sacramento Economic Council, emphasize tradable goods and services to reduce reliance on volatile agriculture amid water constraints and climate variability; their 2024-2027 strategic plan targets growth in life sciences, semiconductors, and clean energy, projecting moderate job increases of 0.7% annually through 2028 in knowledge-based industries.[86] [87] These initiatives have yielded mixed results, with service-oriented growth outpacing manufacturing but facing headwinds from housing costs and economic fragility, as evidenced by persistent industrial vacancies reaching highs not seen since 2017 by late 2024.[88] [89] Public-private partnerships, including tax incentives for business expansion, have facilitated relocations in tech and healthcare, contributing to a shift toward innovation-driven employment projected to add 1,100 jobs in 2024 alone.[90] [91]Water Resources and Management
Key Infrastructure Projects
The Central Valley Project (CVP), administered by the U.S. Bureau of Reclamation since the 1930s, anchors water infrastructure in the Sacramento Valley through a network of 20 dams and reservoirs, 11 powerplants, and over 500 miles of canals, primarily enabling irrigation for agriculture, flood control along the Sacramento River and tributaries, and hydroelectric generation.[92] [93] Shasta Dam, constructed between 1938 and 1945 on the upper Sacramento River, stands as the CVP's foundational asset with a 4.55 million acre-foot reservoir capacity—California's largest—storing winter runoff to mitigate downstream flooding that historically devastated valley farmlands and supplying regulated flows for irrigating over 2 million acres in the region.[94] [95] Folsom Dam, built in 1955 on the American River east of Sacramento, provides 976,000 acre-feet of storage for flood risk reduction benefiting the capital region, alongside irrigation diversions, municipal supplies, and hydropower output exceeding 200 megawatts annually.[96] [97] Ongoing modifications, including a 3.5-foot dam raise completed in phases through 2020, have enhanced its capacity to handle extreme inflows while integrating habitat restoration for native fish species.[98] Oroville Dam, the tallest in the United States at 770 feet and completed in 1968 on the Feather River—a major Sacramento Valley tributary—forms a key State Water Project component with Lake Oroville's 3.5 million acre-foot capacity, capturing Sierra Nevada snowmelt for flood attenuation, groundwater recharge, and diversions supporting valley agriculture and exports southward.[99] [100] Post-2017 spillway repairs following erosion damage have reinforced its structural integrity against high-magnitude storms.[101] Canals integral to distribution include the Tehama-Colusa Canal, a 140-mile CVP conduit diverting from the Sacramento River near Red Bluff to irrigate 150,000 acres across Tehama, Glenn, Colusa, and Yolo counties on the valley's west side, operational since the 1950s and managed by the Tehama-Colusa Canal Authority.[102] Complementing this, the Glenn-Colusa Irrigation District's 65-mile main canal system, drawing from both river intakes and Tehama-Colusa supplies, serves 145,000 acres via nearly 1,000 miles of secondary channels, drains, and laterals, emphasizing efficient conveyance for rice and other crops since its early 20th-century origins.[103] [104] These facilities collectively transformed the valley's semi-arid lowlands into productive cropland by harnessing seasonal precipitation variability, though they have reduced natural sediment transport and salmonid habitats in rivers.[93]Water Rights and Allocation Systems
California's water rights system combines riparian and appropriative doctrines, with the former granting landowners adjacent to a watercourse the right to reasonable use of surface water without permits, while the latter follows a "first in time, first in right" principle for diversions not tied to riparian land, requiring state permits for post-1914 appropriations.[105][106] In the Sacramento Valley, riparian rights predominate due to early 19th-century settlement patterns along the Sacramento River and its tributaries, enabling unlimited correlative shares among users during shortages without forfeiture for non-use.[107] Appropriative rights, established via the 1913 Water Commission Act that created the State Water Resources Control Board (SWRCB), overlay this foundation and govern most new diversions, prioritizing senior holders—often pre-1914 vested claims from mining and early irrigation—in allocation during droughts.[105] The Sacramento Valley's system traces to Spanish and Mexican land grants recognizing riparian uses, formalized under California statehood in 1850, when the Civil Code affirmed riparian priority over subsequent appropriations.[108] Gold Rush-era diversions from 1848 onward introduced appropriative practices, but riparian claims remained superior until the 1928 constitutional amendment mandated reasonable beneficial use for all rights, curbing waste.[105] Pre-1914 appropriative rights, unregistered but enforceable via court adjudication, comprise many senior entitlements in the valley, particularly for agriculture; for instance, Sacramento River Settlement Contractors, numbering over 100 entities with claims dating to the 1880s, hold protected allocations integrated with federal Central Valley Project (CVP) operations from Shasta Dam.[109] Allocation occurs through SWRCB permitting for post-1914 rights, with curtailment orders in shortages enforced by date of priority: seniors receive full contracted supplies before juniors face reductions, as seen in the 2022 drought when some valley districts secured 75% of entitlements while others received 18% or less.[110][111] The Sacramento Water Allocation Model (SacWAM), developed by SWRCB and the Stockholm Environment Institute since 2019, simulates hydrologic flows and diversions across the Sacramento River basin to evaluate compliance with flow standards, such as those under Water Right Decision 1641 for Delta exports, balancing agricultural demands against ecosystem needs like salmon temperature refugia.[112][113] Groundwater rights, akin to riparian overlying uses, complement surface allocations but face regulation under the 2014 Sustainable Groundwater Management Act, requiring local agencies to curb overdraft in priority basins covering much of the valley by 2040. This seniority-based framework incentivizes historical investment in valley agriculture—producing over 2.5 million acre-feet annually for crops like rice—but draws criticism for inefficiency, as unused senior riparian rights can block junior development without market transfers.[114] SWRCB enforces public trust obligations, including 2019-2023 efforts to verify unregistered claims amid climate variability, though adjudication remains judicial for riparian and pre-1914 rights, with over 500,000 unquantified claims statewide complicating valley-wide planning.[105]Environmental Regulations and Impacts
The Sacramento Valley is subject to stringent environmental regulations primarily enforced through the California Environmental Quality Act (CEQA), which mandates state and local agencies to assess and mitigate significant environmental impacts from proposed projects, including agricultural expansions and infrastructure developments.[115] Complementing CEQA, the Porter-Cologne Water Quality Control Act empowers the Central Valley Regional Water Quality Control Board to regulate surface and groundwater protection, addressing pollution from agricultural runoff and industrial discharges across the basin.[116] Additionally, the Sustainable Groundwater Management Act (SGMA), implemented since 2014, requires local Groundwater Sustainability Agencies to develop plans preventing undesirable effects like land subsidence and overdraft, with the California Department of Water Resources issuing draft best management practices in July 2025 to guide subsidence mitigation.[117] Water quality standards are outlined in the Basin Plan for the Sacramento and San Joaquin River Basins, adopted by the Central Valley Regional Water Quality Control Board, which sets objectives for parameters like pH, turbidity, and contaminants to safeguard aquatic life and drinking water sources.[118] These regulations have led to impairments identified in the Sacramento and Feather Rivers, including elevated levels of copper, mercury, toxicity, and pesticide residues from upstream agricultural activities, prompting ongoing restoration efforts by the U.S. Environmental Protection Agency.[119] Agricultural practices in the Valley, dominated by rice, orchards, and field crops, contribute to environmental impacts such as pesticide contamination detected across multiple national wildlife refuges, where 36 compounds—including insecticides, herbicides, and fungicides—were found in soil and water samples as of March 2025, exposing wildlife to chronic low-level mixtures.[120] Nutrient runoff from fertilizers exacerbates eutrophication in rivers and the Sacramento-San Joaquin Delta, while historical groundwater overpumping has caused land subsidence rates exceeding 1 foot per year in localized areas during dry periods like Water Year 2021, damaging canals and aquifers.[121] Regulatory responses under SGMA have prompted Sacramento Valley agencies to revise groundwater sustainability plans by October 2023 to better address subsidence risks, particularly in subbasins reliant on pumping during droughts, where surface water reductions—such as 11% crop losses in 2021—intensify extraction pressures.[122][8] These measures aim to balance agricultural demands with ecological stability, though enforcement challenges persist due to the region's senior water rights prioritizing irrigators during shortages.[110] Climate-driven extremes, including prolonged heat waves and reduced precipitation projected to decline field crop yields by 2-11%, further strain compliance, as warmer water temperatures degrade habitat for species like salmon in the Sacramento River system.[123][61]Transportation
Road and Highway Networks
Interstate 5 forms the backbone of the north-south road network in the Sacramento Valley, running along the valley's western flank from its junction with Interstate 80 in Sacramento northward through Yolo, Colusa, Glenn, and Tehama counties before climbing into the foothills near Red Bluff. This route, operational since the 1960s and fully completed in California by 1979, facilitates efficient long-haul trucking for agricultural exports and commuter traffic, with average annual daily traffic (AADT) exceeding 100,000 vehicles in the Sacramento vicinity as of recent counts.[124][125] Parallel to Interstate 5 and serving denser population centers, California State Route 99 traverses the eastern Sacramento Valley, connecting Sacramento to Yuba City, Marysville, and Gridley before merging northward influences with routes like State Route 70 toward Chico. Designated as the primary alternative to I-5, SR 99 carries higher volumes of local and regional traffic, often surpassing 150,000 AADT south of Sacramento, reflecting its role in accessing farming communities and urban hubs amid the valley's flat terrain conducive to straight alignments but prone to fog-related incidents.[126][127] East-west connectivity relies on U.S. Route 50, which spans from Sacramento eastward through El Dorado County to the Sierra Nevada, and Interstate 80, linking the valley's core to the Bay Area via the American River Canyon. These corridors support tourism, commuting, and goods movement, with recent infrastructure enhancements like the $511 million Fix 50 project adding high-occupancy vehicle lanes along US 50 between Sacramento and Placerville to mitigate congestion exacerbated by population growth.[124][128] Secondary state routes such as CA-65 and CA-70 augment the network, with CA-65 providing access from Roseville northward and CA-70 following the Feather River eastward. Rural areas feature a grid of county-maintained roads optimized for farm equipment, though maintenance challenges arise from seasonal flooding and heavy agricultural loads. Caltrans District 3 oversees state highways in the northern valley, prioritizing resilience against seismic and flood risks inherent to the region's alluvial soils.[129][130]Rail, Aviation, and Water Transport
The Sacramento Valley's rail network supports both passenger and freight services, with Sacramento serving as a key hub. Passenger rail primarily operates through the Sacramento Valley Station at 401 I Street in downtown Sacramento, which accommodates Amtrak routes including the Capitol Corridor providing daily service to the Bay Area with up to 16 round trips, the Coast Starlight to Los Angeles and Seattle, and the California Zephyr to Chicago.[131][132] Valley Rail extends Amtrak San Joaquins service northward from the San Joaquin Valley into the Sacramento region with additional daily round trips.[133] Freight rail dominates, with Union Pacific and BNSF Railway operating mainline tracks through the valley for transcontinental and regional shipments of agricultural products, intermodal containers, and industrial goods; the Sacramento Subdivision between Sacramento and Stockton handles 12 to 20 freight trains daily.[134] Short-line operators like the Sacramento Valley Railroad provide local switching and connections at McClellan, handling commodities such as lumber and metals.[135] Aviation infrastructure centers on Sacramento International Airport (SMF), located 10.5 miles northwest of downtown Sacramento, which functions as the primary commercial gateway for the valley with domestic and limited international flights; it processed over 12 million passengers in 2023 before expansions for increased capacity.[136] General aviation is supported by reliever airports including Sacramento Executive Airport for business and private flights, Mather Airport for corporate and flight training operations, and McClellan Airport, a public-use facility 10 miles northeast of Sacramento focused on general aviation and occasional cargo.[137] These facilities alleviate congestion at SMF while serving regional needs, though air cargo volumes remain modest compared to rail and truck transport for valley agriculture.[138] Water transport along the Sacramento River plays a limited commercial role due to navigational constraints like shallow drafts and seasonal flows, with barges handling niche cargoes such as aggregates, rice, and construction materials. The Sacramento Deep Water Ship Channel, maintained at 30 feet deep and 200 feet wide over 43 miles to the Port of Sacramento, enables occasional ocean-going vessel access, but cargo throughput is low—among the lowest in California ports—with the Port of West Sacramento reporting minimal transported volumes via barge canal connections to the river.[139] Historically vital for Gold Rush-era steamboats and early agricultural exports, river shipping now constitutes less than 1% of valley freight tonnage, overshadowed by more efficient rail and highway modes amid infrastructure maintenance challenges from sedimentation and flood control priorities.[140]Demographics
Population Growth and Trends
The population of the Sacramento Valley, encompassing counties such as Sacramento, Yolo, Butte, Sutter, Yuba, Colusa, Glenn, Tehama, and Plumas, has grown steadily since 2000, outpacing the statewide average in earlier decades due to internal migration and economic opportunities in agriculture and government. From 2000 to 2010, Sacramento County alone increased from approximately 1.23 million to 1.42 million residents, reflecting a growth rate of about 15.5%.[141] By the 2020 Census, the county's population reached 1.585 million, with the broader Sacramento metropolitan area (including Yolo County but excluding some peripheral foothill counties) totaling around 2.4 million. This expansion was part of a regional pattern where the Sacramento area added nearly 50,000 residents annually in the early 2000s, driven by suburban development and job availability.[142] Post-2010 growth slowed amid the Great Recession's aftermath and broader California housing constraints, but the Valley continued to attract domestic migrants seeking affordability relative to coastal regions. Between 2020 and 2023, the six-county Sacramento region (Sacramento, Yolo, Sutter, Yuba, El Dorado, and Placer) gained 27,457 residents, with Placer County contributing the majority through net in-migration.[142] Sacramento County's population peaked near 1.6 million in 2020 before a slight decline of 0.2% in 2021-2022, stabilizing at about 1.58 million by 2023, while the metropolitan area grew 1.44% from 2021 to 2022.[54] [52] Over 2017-2021, roughly one-third of California's internal migrants to inland areas originated from the Bay Area, bolstering Valley counties with lower housing costs and commuting feasibility.[143] Key drivers include state capital employment, agricultural stability, and emerging sectors like healthcare and logistics, which draw workers from high-cost urban centers; natural increase contributes modestly, offset by out-migration of younger cohorts to opportunity-rich areas.[144] Regional projections from the California Department of Finance anticipate continued modest expansion, with the Sacramento area potentially reaching 3.1 million by 2050, contingent on infrastructure accommodating an additional 580,000 residents.[145] This trajectory aligns with inland California's role in absorbing statewide growth amid coastal stagnation, though challenges like water scarcity and urban sprawl may temper rates.[146]Ethnic and Socioeconomic Composition
The Sacramento Valley's ethnic composition varies by urban and rural areas, with non-Hispanic whites forming the plurality in most counties but comprising a minority in the densely populated Sacramento County. According to 2020 U.S. Census data analyzed for Sacramento County, the largest in the valley with a population of 1,585,055, non-Hispanic whites accounted for 41.5% of residents, followed by Hispanics or Latinos (of any race) at 23.4%, Asians at 17.2%, non-Hispanic Blacks at 10.2%, and multiracial individuals at 6.9%.[147] [54] In rural counties like Sutter and Yuba, which rely heavily on agriculture, Hispanics constitute over 40% of the population, reflecting historical patterns of seasonal migrant labor from Mexico and Central America.[148] Asian populations, including significant Hmong, Indian, and Chinese subgroups, concentrate in urban Sacramento, comprising 19.4% citywide, driven by post-1965 immigration and refugee resettlement.[149] Non-Hispanic Black residents, at around 10-12% in Sacramento County, trace roots to mid-20th-century Great Migration inflows for wartime industry jobs.[54] Socioeconomic indicators reveal disparities tied to geography and industry, with urban-suburban zones outperforming rural agricultural pockets. In Sacramento County, the 2023 median household income stood at $88,724, above the national median of $78,538 but below California's $95,065, supported by government, tech, and service sectors.[147] [150] Poverty rates averaged 12.6% in the county, down from prior years, though higher at 14.4% within Sacramento city limits, correlating with lower-wage service and retail occupations.[149] Rural areas, such as those in Colusa or Glenn counties, exhibit lower medians around $60,000-$70,000 and elevated poverty exceeding 15%, attributable to volatile farm incomes, limited diversification, and dependence on low-skill seasonal labor.[151] Affluent suburbs like Placer County portions report medians over $100,000, fueled by commuting professionals and real estate growth. Unemployment hovered at 5.5% regionally in 2023, with agriculture contributing to cyclical fluctuations.[152]| County Example | Median Household Income (2023) | Poverty Rate (2023) | Dominant Ethnic Groups (2020 %) |
|---|---|---|---|
| Sacramento | $88,724 | 12.6% | White NH (41.5%), Hispanic (23.4%), Asian (17.2%)[147] |
| Sutter/Yuba (rural aggregate proxy) | ~$65,000 | ~16% | Hispanic (>40%), White NH (~45%)[148] |