

Community hub
Recent from talks
Contribute something
Nothing was collected or created yet.
Bus lane
View on Wikipedia
.jpg)
A bus lane or bus-only lane is a lane restricted to buses, generally to speed up public transport that would be otherwise held up by traffic congestion. The related term busway describes a roadway completely dedicated for use by buses, whilst bus gate describes a short bus lane often used as a short cut for public transport. Bus lanes are a key component of a high-quality bus corridor (QBC) and bus rapid transit (BRT) network, improving bus travel speeds and reliability by reducing delay caused by other traffic.
A dedicated bus lane may occupy only part of a roadway which also has lanes serving general automotive traffic; in contrast to a transit mall which is a pedestrianized roadway also served by transit.
History
[edit]
The first bus lane is often erroneously attributed to Chicago, where in 1939 Sheridan Road was installed with reversible lanes north of Foster Avenue.[1][2] The setup consisted of three-lanes towards the peak direction (south in the morning; north in the evening), and one contraflow lane. None of the lanes exclusively carried buses, but were designed to facilitate bus operations. In 1948, the East Side Trolley Tunnel in Providence, Rhode Island was converted to bus-only use and became the first dedicated busway in the United States, continuing to operate to this day. In 1956 Nashville became the first city to implement on-street bus lanes. Later that year, Chicago implemented a bus lane in the center of Washington Street, a five lane one-way street downtown.[3][4]
The first bus lanes in Europe were established in 1963 in the German city of Hamburg, when the tram system was closed and the former dedicated tram tracks were converted for bus travel. Other large German cities soon followed, and the implementation of bus lanes was officially sanctioned in the German highway code in 1970. Many experts from other countries (Japan among the first) studied the German example and implemented similar solutions. On 15 January 1964 the first bus lane in France was designated along the quai du Louvre in Paris and the first contraflow lane was established on the old pont de l’Alma on 15 June 1966.[5]
On 26 February 1968 the first bus lane in London was put into service on Vauxhall Bridge.[6] The first contraflow bus lane in the UK was introduced in King's Road, Reading as a temporary measure when the road was made one-way (eastwards to Cemetery Junction) on 16 June 1968. The initial reason was to save the expense of rerouting the trolleybus, which was due to be scrapped on 3 November of that year. However the experiment proved so successful that it was made permanent for use by motor buses.[7] In October 1971 Runcorn opened the world's first bus rapid transitway. Upon opening, the 7-mile (11 km) busway featured specialized stations, signal priority, grade separation, and was expanded to 14 miles (23 km) by 1980.[4][8][9]
By 1972 there were over 140 kilometres (87 mi) of with-flow bus lanes in 100 cities within OECD member countries, and the network grew substantially in the following decades.[10]
The El Monte Busway between El Monte and Downtown Los Angeles was the first dedicated busway in the US, constructed in 1974.[11]
Design
[edit]
Bus lanes may be located in different locations on a street, such as on the sides of a street near the curb, or down the center. They may be long, continuous networks, or short segments used to allow buses to bypass bottlenecks or reduce route complexity, such as in a contraflow bus lane.[12]
Bus lanes may be demarcated in several ways. Descriptive text such as "BUS LANE" may be marked prominently on the road surface, particularly at the beginning and end. Some cities use a diamond-shaped pavement marking to indicate an exclusive bus lane. The road surface may have a distinctive color, usually red, which has been shown to reduce prohibited vehicles from entering bus lanes.[13] Road signs may communicate when a bus lane is in effect.[14]
Bus lanes may also be physically separated from other traffic using bollards, curbs, or other raised elements.[15]
In some cities, such as The Hague in the Netherlands, buses are allowed to use reserved tram tracks, usually laid in the middle of the road and marked with the text "Lijnbus".
Bus gates
[edit]
In the United Kingdom bus gates are common in towns and cities. A bus gate consists of a short section of road that only buses, cycles and sometimes other vehicles (typically taxis) can pass through. They lack most of the signage of bus lanes and have the words "BUS GATE" on the carriageway instead of "BUS LANE".[16]
Some highway authorities wanted to create short sections of bus-only route but couldn't meet the requirements for a bus lane, in particular the lead-in signage. Instead they used a "No Entry" sign with the plate "Except buses".[17] As they weren't allowed to use the thick white line which separates a bus lane from other traffic, they had to separate the entire section of bus-only road from the rest of the carriageway by traffic islands. Bus gates could also be used as "short cuts" at junctions, roundabouts or through one-way systems.[18]
To ensure that only buses could use the bus-only route, some authorities put a gate or a rising barrier across it,[19] similar to those used at toll plazas[20] and car parks. Until 2015 there was a rising barrier at the bus gate from Byward Street to Great Tower Street in the City of London.[21] Where a bus-only route was the full width of the road, physical cues would be used such as narrowing at the entry point, along with psychological ones such as coloured road surface.[22]
Rising barriers were superseded by rising bollards from 1995.[23][24] Now all physical barriers have been removed, to be replaced by CCTV enforcement.[25] Many motorists are fined for going through bus gates.[26] The Highway Code (2025 edition) does not show the "BUS GATE" road marking or explain what a bus gate is. The regulations only require traffic signs at the bus gates; highway authorities (which receive the income from fines) choose how much advance signage to install.[27]
Between 2005 and 2022, local authorities outside London could issue fines for contravening bus lanes but not for other moving traffic offences, such as contravening the signage for bus gates.[28] Some local authorities issued fines at bus gates alleging contravention of a bus lane. The status of bus gates was settled by two cases: the Oxford bus gate case R (Oxfordshire County Council) v The Bus Lane Adjudicator [2010] EWHC 954 (Admin) and the Nottingham bus gate case R (Nottingham City Council) v Bus Lane Adjudicator [2017] EWHC 430 (Admin). In the course of the Oxford case, the Department for Transport sent a letter to the court setting out its views about what bus gates are and the law relating to them; the judgment largely followed this.
Operation
[edit]Bus lanes may have separate sets of dedicated traffic signals, to allow transit signal priority at intersections.[29]
Peak-only bus lanes are enforced only at certain times of the day, usually during rush hour, reverting to a general purpose or parking lane at other times. Peak-only bus lanes may be in effect only in the main direction of travel, such as towards a downtown during morning rush hour traffic, with the buses using general purpose lanes in the other direction.[30]
Entire streets can be designated as bus lanes (such as Oxford Street in London, Princes Street in Edinburgh, or Fulton Street in Downtown Brooklyn), allowing buses, taxis and delivery vehicles only, or a contra-flow bus lane can allow buses to travel in the opposite direction to other vehicles.[31]
Some locations allow bicyclists or taxis to use bus lanes, however where bus or bicycle volumes are high, mixed traffic operations may result in uncomfortable conditions or delays.[32] Certain other vehicles may also be permitted in bus lanes, such as taxis, high occupancy vehicles, motorcycles, or bicycles. Police, ambulance services and fire brigades can also use these lanes.[33]
In the Netherlands mixed bus/cycle lanes are uncommon. According to the Sustainable Safety guidelines they would violate the principle of homogeneity and put road users of very different masses and speed behaviour into the same lane, which is generally discouraged.[34]
Some locations have allowed access to bus lanes to electric cars and/or hybrid cars. Oslo removed one such exception in 2017 following protests due to congestion in bus lanes. The large number of electric vehicles on Norwegian roads slowed buses, defeating the purpose of bus lanes.[35]
Enforcement
[edit].jpg)
Bus lanes can become ineffective if weak enforcement allows use by unauthorized vehicles[36] or illegal parking. Center-running bus lanes avoid the problem of private vehicles blocking the lane by double parking for loading of passengers or cargo.
Evidence from the operation of urban arterials in Brisbane shows that a properly enforced bus lane, operating as designed without interference, can increase passenger throughput. In 2009 and 2010 traffic surveys showed that in Brisbane on a number of urban arterials with bus and transit lanes, noncompliance rates were approaching 90%. Following enhanced enforcement of the lanes, noncompliance rates dropped and overall efficiency of the bus and transit lanes improved with an up to 12% increase in total passenger throughput in the lane. Average bus journey times dropped, in some cases, by up to 19%.[37]
Some cities, including San Francisco and New York, employ automated camera enforcement, using either stationary cameras adjacent to the bus lane, or cameras on the front of buses to automatically issue citations to vehicles obstructing the bus lane.[38][39]
Effectiveness
[edit]Bus lanes give priority to buses, cutting down on journey times where roads are congested with other traffic and increasing the reliability of buses. The introduction of bus lanes can significantly assist in the reduction of air pollution.[40]
Bus lanes marked with colored pavement have been shown to reduce intrusions into bus lanes, speeding travel time and increasing bus reliability.[41]
Major networks
[edit]Some network lengths of bus lanes in major cities, listed by buses per km of bus lane):
| City | Country | Population (million) | Buses (#s) | Population per bus | Bus lanes (km) | Buses per 1 km of bus lane |
|---|---|---|---|---|---|---|
| Helsinki | Finland | 0.6 | 470[42] | 1,238 | 44[43] | 11 |
| Sydney | Australia | 4.3 | 1,900 | 2,260 | 90+[44] | 21 |
| Santiago | Chile | 6.5 | 4,600 | 1,400 | 200[45] | 23 |
| London | England | 8.7 | 8,600 | 1,010 | 304[46] | 28 |
| Singapore | Singapore | 5.5 | 3,775 | 1,200 | 200 (23 km are 24-hour restricted bus lane)[47] | 29 |
| Seoul | South Korea | 10.4 | 8,910 | 1,167 | 282[48] | 32 |
| Madrid | Spain | 7 | 2,022[49] | 2,720 | 50[50] | 40 |
| Jakarta | Indonesia | 10.1 | 524 | 5,000 | 184.31[51] | 30 |
| Bogotá | Colombia | 6.7 | 1,080[52] | 6,200 | 84[52] | 13 |
| São Paulo | Brazil | 10.9 | 14,900[53] | 730 | 155[54] | 96 |
| Kunming | People's Republic of China | 5.7 | ~ | ~ | 42[55] | |
| Beijing | People's Republic of China | 19.6 | 26,000 | 754 | 294 | 88 |
| Hong Kong | Hong Kong | 6.8 | 19,768[56] | 666 | 22[57] | 899 |
| Vienna | Austria | 1.8 | 56[58] | |||
| New York | United States | 8.5 | 5,777 | 1,480 | 222.7[59] | 26 |
| Auckland | New Zealand | 1.6 | 1,360[60] | 1,176 | 128 (by the end of 2017)[61] | 11 |
| Country | Highway | Bus lanes (km) | Section |
|---|---|---|---|
| South Korea | Gyeongbu Expressway | 137.4 | Hannam IC (Seoul) ~ Sintanjin IC (Daejeon) |
| Hong Kong | Tuen Mun Road | 8.5[62] | So Kwun Wat ~ Sham Tseng |
The busiest bus lane in the United States is the Lincoln Tunnel XBL (exclusive bus lane) along the Lincoln Tunnel Approach and Helix in Hudson County, New Jersey, which carries approximately 700 buses per hour during morning peak times an average of one bus every 5.1 seconds.[63] In contrast, the Cross-Harbour Tunnel in Hong Kong carries 14,500 buses per day,[64] or an average of about 605 an hour all day (not just peak times), but the bus lane must give way to all the other road users resulting in long queues of buses.[further explanation needed]
Criticism
[edit]Some residents and observers criticize bus lane plans and implementations because they take space from other vehicles or require road widening,[65] which can require the use of eminent domain.[66]
Gallery
[edit]-
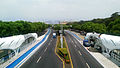
 In Jingtong Expressway in Beijing
 -
 Rapid transit of Transjakarta in Jakarta, separated from heavy traffic
 -
 Bus lane in the middle of Roosevelt Road in Taipei, Taiwan
 -
 BRT lane laid on Taiwan Boulevard in Taichung, Taiwan
 -
 Bus and taxicab lane sign in Norway
 -

-
 Bus lane on Gloucester Road in Hong Kong, with the words "bus lane" painted in English and "巴士綫" in Chinese
 -

-


See also
[edit]References
[edit]- ^ Milestones in U.S. Public Transportation History Archived 7 August 2007 at the Wayback Machine (from the APTA website. Retrieved 6 December 2007.)
- ^ History of the NTD and Transit in the US Archived 12 October 2007 at the Wayback Machine (from the NTD website. Retrieved 6 December 2007.)
- ^ Agrawal, Asha Weinstein; Goldman, Todd; Hannaford, Nancy (April 2012). "Shared-Use Bus Priority Lanes on City Streets: Case Studies in Design and Management" (PDF). Mineta Transportation Institute. Archived from the original (PDF) on 21 April 2024. Retrieved 3 November 2021.
- ^ a b Levinson, Herbert S.; Hoey, William F.; Sanders, David B.; Wyn, F. Houston (1973). Bus Use of Highways: State of the Art (PDF). National Cooperative Highway Research Program Report 143 (Report). Highway Research Board. Retrieved 4 November 2021.
- ^ Les zones bleues et les couloirs pour autobus Archived 14 November 2007 at the Wayback Machine (from the AMTUIR website, Musée des Transports Urbains. Retrieved 6 December 2007.(in French))
- ^ Matthews, Peter (2008), London's Bridges, Oxford: Shire, ISBN 978-0-7478-0679-0, OCLC 213309491
- ^ "WHEN Mrs. Barbara Castle, in her role of Minister of - 15th August 1969 - The Commercial Motor Archive". archive.commercialmotor.com.
- ^ "Runcorn New Town - 7.3 Transport". rudi.net. Archived from the original on 18 October 2014. Retrieved 24 July 2020.
- ^ "Runcorn buses enthusiast site detailing the busway" (PDF). Members.lycos.co.uk. Archived from the original (PDF) on 13 September 2016. Retrieved 8 September 2016.
- ^ Assessing travel time impacts of measures to enhance bus operations - Jepson, D.; Ferreira, L., Road & Transport Research, December 1999. Retrieved 6 December 2007.)
- ^ Los Angeles Archived 11 June 2007 at the Wayback Machine (from the San Francisco Metropolitan Transportation Commission website. Retrieved 6 December 2007.)
- ^ "Transit Lanes - National Association of City Transportation Officials". 18 April 2016.
- ^ "Pavement Markings & Color - National Association of City Transportation Officials". National Association of City Transportation Officials. Retrieved 20 December 2016.
- ^ Krichevsky, Sophie (21 July 2022). "In Downtown Flushing, busway hours reduced". Queens Chronicle. Retrieved 12 July 2023.
- ^ "Separation Elements - National Association of City Transportation Officials". 19 April 2016.
- ^ "The Traffic Signs Regulations and General Directions 2016". legislation.gov.uk.
- ^ "The Traffic Signs Regulations and General Directions 1975". legislation.gov.uk.
- ^ "Bus lanes, gates and tram gates". www.sheffield.gov.uk. Retrieved 4 March 2021.
- ^ Greater London Council (1978). "The Harrow (Prescribed Routes) (No. 2) Traffic Order 1978" (PDF). What Do They Know.
- ^ Geni. "Itchen Bridge Toll Booths". Wikimedia.
- ^ "Bus Gate into Great Tower Street". Geograph.
- ^ Keeping Buses Moving. London: HMSO. December 1991. pp. 17–19. ISBN 0115510753.
- ^ Department for Transport (March 1997). "Rising Bollards". The National Archives.
- ^ "Automatic bus gate at Wood Lane, Tinsley". Geograph. 2009.
- ^ "Bus gates in Bristol's heart". Geograph. 2024.
- ^ Simson, Pete (22 March 2024). "'Atrocious' bus gate fines top £500k since January". BBC News.
- ^ "The Highway Code". The Highway Code.
- ^ Department for Transport (November 2022). "Civil Enforcement of Road Traffic Contraventions: Certification of Approved Devices" (PDF). Gov.uk.
- ^ "Signals & Operations - National Association of City Transportation Officials". National Association of City Transportation Officials. Retrieved 20 December 2016.
- ^ "Peak-Only Bus Lane - National Association of City Transportation Officials". National Association of City Transportation Officials. Retrieved 20 December 2016.
- ^ "Signs Giving Orders". Highway Code. Retrieved 10 January 2008.
- ^ "Shared Bus-Bike Lane - National Association of City Transportation Officials". National Association of City Transportation Officials. Retrieved 20 December 2016.
- ^ The Use of Bus Lanes by Motorcycles (from Traffic Advisory Leaflet 2/07, Department for Transport, United Kingdom) Archived 8 August 2008 at the Wayback Machine
- ^ "Sustainable Safety". 2 January 2012.
- ^ "Electric cars lose right to drive in Oslo bus lanes". The Local. 6 May 2015. Archived from the original on 18 September 2015. Retrieved 30 November 2020.
- ^ McNaughton, Maggie (3 October 2006). "1779 cheats spotted in single morning using bus lanes". The New Zealand Herald. Retrieved 22 September 2011.
- ^ Lyndon, S. Marinelli, P.A. Macintosh, K. and McKenzie, S. High occupancy vehicle lane enforcement: a successful trial in Brisbane by adding a splash of magenta. Proceedings of the 34th Australasian Transport Research Forum, 28–30 September 2011, Adelaide. http://www.atrf11.unisa.edu.au/PaperListing.aspx Archived 31 July 2012 at the Wayback Machine. Retrieved 9 February 2012.
- ^ "Red Light Camera and Other Automated Enforcement". SFMTA. 2 May 2013. Retrieved 20 December 2016.
- ^ "Bus Lane Camera Violations". NYC 311. Retrieved 20 December 2016.
- ^ Beevers, Sean; Carslaw, David; Westmoreland, Emily; Mittal, Hrishi (April 2009). "Air pollution and emissions trends in London" (PDF). Department for Environment Food & Rural Affairs. Archived (PDF) from the original on 1 July 2015. Retrieved 24 February 2023.
- ^ San Francisco Municipal Transportation Agency (February 2015). "Church Street Transit Lanes Final Report" (PDF). Retrieved 20 December 2016.
- ^ "Automäärät pääkaupunkiseudun bussilinjoilla". www.kuukankorpi.com.
- ^ HKL SUY D: 10/2009: Joukkoliikenteen luotettavuuden kehittämisohjelma
- ^ Bus lanes (from Roads & Traffic Authority, 18 February 2008
- ^ The slow lane - The Economist, Thursday 7 February 2008
- ^ "Question on bus lane length - FOI request". Transport for London. 5 April 2024. Retrieved 29 April 2024.
- ^ "More bus lanes and bigger stops in Singapore". Archived from the original on 17 December 2013. Retrieved 17 December 2013.
- ^ "Transportation in Seoul for Sustainability" (PDF). Archived from the original (PDF) on 16 February 2010. Retrieved 5 December 2009.
- ^ "EMT - Empresa Municipal de Transportes de Madrid, S.A. - Presentación". www.emtmadrid.es. Archived from the original on 29 June 2008.
- ^ "Publications | UITP" (PDF). Archived from the original (PDF) on 16 November 2008.
- ^ "Berita – PT Transportasi Jakarta". Archived from the original on 23 June 2012. Retrieved 23 April 2012. (Jakarta Trans Jakarta official website. Accessed 26 June 2012.)
- ^ a b "TRANSMILENIO S.A. - Estad?sticas Generales". Archived from the original on 10 August 2013. Retrieved 5 April 2009. (Bogotá TransMilenio official website. Accessed 5 April 2009.)
- ^ Frota das linhas municipais de ônibus Archived 19 December 2014 at the Wayback Machine (São Paulo local government website. Accessed 27 March 2008.)
- ^ Extensão dos corredores Archived 23 February 2014 at the Wayback Machine (São Paulo local government website. Accessed 27 March 2008.)
- ^ "BRT Developments in China" (PDF).
- ^ Hong Kong The facts (Information Services Department, Hong Kong Special Administrative Region Government, July 2009, from the Hong Kong Transport Department website. Accessed 16 September 2008.)
- ^ Transport in Hong Kong > Public Transport > Buses Archived 27 October 2009 at the Wayback Machine (from the Hong Kong Transport Department website. Accessed 16 September 2008.)
- ^ Berger, Michael (8 April 2008). "Busspur für Zweiräder". Kurier (in German). Vienna, Austria. p. 20.
- ^ "How the Candidates for N.Y.C. Mayor Plan to Improve Transit". New York Times. 27 May 2021. Retrieved 28 May 2021.
- ^ "Auckland, New Zealand Explores Full Implementation of Electric Bus Fleet - OpenGov Asia". 23 January 2020. Retrieved 31 January 2023.
- ^ "New Bus Priority coming". Greater Auckland. 24 November 2014. Retrieved 21 May 2017.
- ^ "Transport Department - Transport Department". www.td.gov.hk.
- ^ "About". arctunnel.com. Archived from the original on 13 September 2011.
- ^ "P201003030140_0140_62651.doc" (DOC). Hong Kong Government. Archived (DOC) from the original on 4 March 2016. Retrieved 24 February 2023.
- ^ Hu, Winnie; Schaverien, Anna (12 February 2022). "Eric Adams Is Pushing a Plan to Speed Up Buses. Will It Work?". The New York Times. ISSN 0362-4331. Retrieved 6 July 2023.
- ^ Dearnaley, Mathew (12 March 2007). "Transport plan will force homes and businesses to move". The New Zealand Herald. Archived from the original on 29 September 2007. Retrieved 22 September 2011.
External links
[edit]- Transit lane design guidance from the National Association of City Transportation Officials Transit Street Design Guide.
| Bus service | |
|---|---|
| Rail | |
| Vehicles for hire | |
| Carpooling | |
| Ship | |
| Cable | |
| Other transport | |
| Locations | |
| Ticketing and fares |
|
| Routing | |
| Facilities | |
| Scheduling | |
| Politics | |
| Technology and signage | |
| Models | |
| Other topics | |
| Vehicles | |
|---|---|
| Systems (List) | |
| See also | |
| International | |
|---|---|
| National | |
| Other | |