

Community hub
Recent from talks
Contribute something
Nothing was collected or created yet.
Monterey County, California
View on Wikipedia
Monterey County (/ˌmɒntəˈreɪ/ ⓘ MON-tə-RAY), officially the County of Monterey, is a county located on the Pacific coast in the U.S. state of California. As of the 2020 United States census, its population was 439,035.[5] The county's largest city and county seat is Salinas.[6] Monterey County comprises the Salinas, California, Metropolitan Statistical Area. It borders on the southern part of Monterey Bay, after which it is named (northern half of the bay is in Santa Cruz County). Monterey County is a member of the regional governmental agency: the Association of Monterey Bay Area Governments. Scenic features along the coastline - including Carmel-by-the-Sea, Big Sur, State Route 1, and the 17 Mile Drive on the Monterey Peninsula - have made the county famous around the world. Back when California was under Spanish and Mexican rule, the city of Monterey was its capital. Today, the economy of the county is mostly based on tourism in its coastal regions, and on agriculture in the region of the Salinas River valley. Most of the county's inhabitants live near the northern coast or in Salinas Valley; the southern coast and inland mountainous regions are sparsely populated.
Key Information
.jpg)


.jpg)


History
[edit].jpg)
Monterey County was one of the original counties of California, created in 1850 at the time of statehood. Parts of the county were given to San Benito County in 1874. The area was originally populated by Ohlone, Salinan and the Esselen tribes.
The county derives its name from Monterey Bay. The bay was named by Sebastián Vizcaíno in 1602 in honor of the Conde de Monterrey (or Count of Monterrey), then the Viceroy of New Spain.[7] Monterrey is a variation of Monterrei, a municipality in the Galicia region of Spain where the Conde de Monterrey and his father (the Fourth Count of Monterrei) were from.
Geography
[edit]According to the U.S. Census Bureau, the county has a total area of 3,771 square miles (9,770 km2), of which 3,281 square miles (8,500 km2) is land and 491 square miles (1,270 km2) (13%) is water.[8] The county is roughly 1.5 times larger than the state of Delaware, and roughly similar in population and the size to Santa Barbara County.
Adjacent counties
[edit]
Santa Cruz County to the north, San Benito County, Fresno County, and Kings County to the east as well as San Luis Obispo County to the south.
National protected areas
[edit]- Los Padres National Forest (part)
- Pinnacles National Park (part)
- Salinas River National Wildlife Refuge
- Ventana Wilderness (part)
In October 2019, the Bureau of Land Management ended a five-year moratorium on leasing federal land in California to fossil fuel companies, opening 725,000 acres (1100 sq. miles; 29,000 ha) to drilling in San Benito, Monterey, and Fresno counties.[9]
Marine protected areas
[edit]- Soquel Canyon State Marine Conservation Area
- Elkhorn Slough State Marine Reserve
- Elkhorn Slough State Marine Conservation Area
- Moro Cojo Slough State Marine Reserve
- Portuguese Ledge State Marine Conservation Area
- Pacific Grove Marine Gardens State Marine Conservation Area
- Lovers Point State Marine Reserve
- Edward F. Ricketts State Marine Conservation Area
- Asilomar State Marine Reserve
Flora and fauna
[edit]Monterey County has habitat to support the following endangered species:
Demographics
[edit]| Census | Pop. | Note | %± |
|---|---|---|---|
| 1850 | 1,872 | — | |
| 1860 | 4,739 | 153.2% | |
| 1870 | 9,876 | 108.4% | |
| 1880 | 11,302 | 14.4% | |
| 1890 | 18,637 | 64.9% | |
| 1900 | 19,380 | 4.0% | |
| 1910 | 24,146 | 24.6% | |
| 1920 | 27,980 | 15.9% | |
| 1930 | 53,705 | 91.9% | |
| 1940 | 73,032 | 36.0% | |
| 1950 | 130,498 | 78.7% | |
| 1960 | 198,351 | 52.0% | |
| 1970 | 250,071 | 26.1% | |
| 1980 | 290,444 | 16.1% | |
| 1990 | 355,660 | 22.5% | |
| 2000 | 401,762 | 13.0% | |
| 2010 | 415,057 | 3.3% | |
| 2020 | 439,035 | 5.8% | |
| 2024 (est.) | 436,251 | [10] | −0.6% |
| U.S. Decennial Census[11] 1790–1960[12] 1900–1990[better source needed][13] 1990–2000[14] 2010[15] 2020[16] | |||
2020 census
[edit]| Race / Ethnicity (NH = Non-Hispanic) | Pop 1980[17] | Pop 1990[18] | Pop 2000[19] | Pop 2010[15] | Pop 2020[16] | % 1980 | % 1990 | % 2000 | % 2010 | % 2020 |
|---|---|---|---|---|---|---|---|---|---|---|
| White alone (NH) | 173,456 | 186,166 | 162,045 | 136,435 | 120,077 | 59.72% | 52.34% | 40.33% | 32.87% | 27.35% |
| Black or African American alone (NH) | 18,425 | 21,506 | 14,085 | 11,300 | 9,051 | 6.34% | 6.05% | 3.51% | 2.72% | 2.06% |
| Native American or Alaska Native alone (NH) | 2,927 | 2,124 | 1,782 | 1,361 | 1,314 | 1.01% | 0.60% | 0.44% | 0.33% | 0.30% |
| Asian alone (NH) | 19,696 | 25,365 | 23,203 | 23,777 | 25,123 | 6.78% | 7.13% | 5.78% | 5.73% | 5.72% |
| Native Hawaiian or Pacific Islander alone (NH) | x [20] | x [21] | 1,543 | 1,868 | 1,859 | 0.38% | 0.45% | 0.38% | 0.45% | 0.42% |
| Other race alone (NH) | 811 | 929 | 1,190 | 741 | 2,170 | 0.28% | 0.26% | 0.30% | 0.18% | 0.49% |
| Mixed race or Multiracial (NH) | x [22] | x [23] | 9,945 | 9,572 | 14,120 | x | x | 2.48% | 2.31% | 3.22% |
| Hispanic or Latino (any race) | 75,129 | 119,570 | 187,969 | 230,003 | 265,321 | 25.87% | 33.62% | 46.79% | 55.41% | 60.43% |
| Total | 290,444 | 355,660 | 401,762 | 415,057 | 439,035 | 100.00% | 100.00% | 100.00% | 100.00% | 100.00% |
Income, education and poverty 2013
[edit]

Generally, the western/southern parts of the Monterey Peninsula, Carmel Valley, Creekbridge (Salinas), and eastern parts of Prunedale were the county's most affluent and educated (see dark blue on map). These areas had a median household income significantly above that of the California or the U.S. overall (typically above $95,000 vs. $60,000 for California and $52,000 for the U.S.)[25] and comprised roughly 8%-10% of neighborhoods (as defined by Census Block Groups).[26] Educational attainment was at least on part with, or above, state and national levels,[27] in these areas while the percentage of people living in poverty was typically a third or less than national and statewide average (with the exception of South Salinas).[28]
Social deprivation (poverty and low levels of educational attainment) was concentrated in the central and eastern parts of Salinas, and central areas of Monterey, Seaside, Marina, Soledad and King City. In central and eastern Salinas up to 46% of individuals lived below the poverty line and those without a secondary educations formed a plurality or majority of residents.[27][28] Overall, the Salinas metropolitan area, defined as coterminous with Monterey County, was among the least educated urban areas in the nation.
Most affluent neighborhoods
[edit]Roughly 8% of neighborhoods, as defined by Census Block Groups, had a median household income above $100,000 per year, about 60% above the national median. This coincided with the top 20 census block groups in the county listed below.[25][26]
Most affluent neighborhoods (Median Household Income above $100k/yr.)[26][29]
| Rank | neighborhood | Census Reference/Geo-Unit | Median Household Income |
|---|---|---|---|
| 1 | Carmel Valley (North-West) | Block Group 1, Census Tract 116.02 | $152,411 |
| 2 | Mount Toro Foothills, Salinas Valley | Block Group 3, Census Tract 107.01 | $143,508 |
| 3 | Jacks Peak, Monterey | Block Group 1, Census Tract 132 | $142,143 |
| 4 | Mount Toro Foothills, Salinas Valley | Block Group 2, Census Tract 107.02 | $141,364 |
| 5 | Skyline Forest, Monterey | Block Group 3, Census Tract 128 | $130,221 |
| 6 | Yankee Point, Carmel | Block Group 3, Census Tract 117 | $126,389 |
| 7 | Carmel Valley (North-West) | Block Group 3, Census Tract 116.02 | $122,056 |
| 8 | Carmel Valley (North-West) | Block Group 4, Census Tract 116.02 | $118,159 |
| 9 | Carmel Valley (North-West) | Block Group 2, Census Tract 110 | $118,125 |
| 10 | Carmel Valley (North-West) | Block Group 4, Census Tract 110 | $115,667 |
| 11 | Carmel (East, outside of city limits) | Block Group 2, Census Tract 117 | $115,357 |
| 12 | Jacks Peak, Monterey | Block Group 2, Census Tract 132 | $113,750 |
| 13 | Skyline Forest, Monterey | Block Group 5, Census Tract 128 | $111,500 |
| 14 | City of Carmel (Southern half) | Block Group 1, Census Tract 118.02 | $110,962 |
| 15 | Las Palmas, Salinas Valley | Block Group 2, Census Tract 107.01 | $110,918 |
| 16 | Pebble Beach, Monterey Peninsula Country Club | Block Group 4, Census Tract 119 | $107,500 |
| 17 | Mount Toro Foothills, Salinas Valley | Block Group 1, Census Tract 107.02 | $105,511 |
| 18 | Carmel Valley (North-West) | Block Group 1, Census Tract 116.04 | $104,902 |
| 19 | City of Carmel (Northern half) | Block Group 2, Census Tract 118.01 | $101,984 |
| 20 | Creekbridge (incl. Falcon Meadows), Salinas | Block Group 2, Census Tract 106.03 | $100,673 |
| 141* | United States | N/A | $53,046 |
| 104* | California | N/A | $61,094 |
| 154* | City of Salinas | N/A | $49,264 |
* Asterisk denotes a hypothetical rank among Monterey County's 226 Census Block Groups (e.g. if the U.S. overall was a Census Block Group in Monterey County, it would be the 141st most affluent of 226).
Least affluent neighborhoods
[edit]About 4.5% of neighborhoods, as defined by Census Block Groups, had a median household income below $30,000 per year, about 60% below the national median. This coincided with the 10 poorest of the 20 lowest income neighborhoods listed in the table below.[25][26]
Least affluent neighborhoods (Median Household Income of $34.1k or less)[26][29]
| Rank | neighborhood | Census Reference/Geo-Unit | Median Household Income |
|---|---|---|---|
| 1 | Downtown Salinas | Block Group 1, Census Tract 13 | $21,411 |
| 2 | Central Seaside | Block Group 3, Census Tract 137 | $22,994 |
| 3 | East Salinas (Del Monte Ave.) | Block Group 1, Census Tract 7.01 | $23,250 |
| 4 | Downtown Monterey | Block Group 1, Census Tract 127 | $24,911 |
| 5 | Central Marina (Del Monte Blvd.) | Block Group 3, Census Tract 142.01 | $25,464 |
| 6 | Hebbron Heights, East Salinas | Block Group 2, Census Tract 5.01 | $26,211 |
| 7 | East Salinas (Del Monte Ave.) | Block Group 3, Census Tract 7.01 | $26,771 |
| 8 | East Salinas (Del Monte Ave.) | Block Group 2, Census Tract 7.02 | $26,875 |
| 9 | Hebbron Heights, East Salinas | Block Group 1, Census Tract 5.01 | $28,750 |
| 10 | Downtown Monterey | Block Group 2, Census Tract 127 | $29,070 |
| 11 | West Santa Rita, Salinas | Block Group 1, Census Tract 105.06 | $30,250 |
| 12 | North-Central Salinas/Chinatown | Block Group 2, Census Tract 18.02 | $30,625 |
| 13 | Central King City | Block Group 2, Census Tract 113.02 | $31,579 |
| 14 | Central King City | Block Group 1, Census Tract 113.02 | $33,043 |
| 15 | Central Soledad | Block Group 3, Census Tract 111.01 | $33,110 |
| 16 | East Seaside | Block Group 1, Census Tract 135 | $33,242 |
| 17 | East Salinas (Del Monte Ave.) | Block Group 3, Census Tract 7.02 | $33,244 |
| 18 | East Soledad | Block Group 1, Census Tract 111.02 | $33,616 |
| 19 | East Salinas | Block Group 3, Census Tract 8 | $33,938 |
| 20 | North Salinas (E. Bernal Drive./Natividad Rd.) | Block Group 3, Census Tract 4 | $34,057 |
| 86* | United States | N/A | $53,046 |
| 118* | California | N/A | $61,094 |
| 73* | City of Salinas | N/A | $49,264 |
* Asterisk denotes a hypothetical rank among Monterey County's 226 Census Block Groups (e.g. if the U.S. overall was a Census Block Group in Monterey County, it would be the 86th poorest of 226).
2011
[edit]
| Population, race, and income | |||||
|---|---|---|---|---|---|
| Total population[30] | 411,385 | ||||
| White[30] | 296,264 | 72.0% | |||
| Black or African American[30] | 12,848 | 3.1% | |||
| American Indian or Alaska Native[30] | 3,826 | 0.9% | |||
| Asian[30] | 25,419 | 6.2% | |||
| Native Hawaiian or other Pacific Islander[30] | 1,941 | 0.5% | |||
| Some other race[30] | 56,356 | 13.7% | |||
| Two or more races[30] | 14,731 | 3.6% | |||
| Hispanic or Latino (of any race)[31] | 224,435 | 54.6% | |||
| Per capita income[32] | $25,508 | ||||
| Median household income[33] | $59,737 | ||||
| Median family income[34] | $63,523 | ||||
Places by population, race, and income
[edit]| Place | Type[35] | Population[30] | White[30] | Other[30] [note 1] |
Asian[30] | Black or African American[30] |
Native American[30] [note 2] |
Hispanic or Latino (of any race)[31] |
|---|---|---|---|---|---|---|---|---|
| Aromas ‡ | CDP | 1,357 | 87.0% | 3.9% | 9.1% | 0.0% | 0.0% | 28.2% |
| Boronda | CDP | 1,606 | 58.0% | 31.2% | 9.9% | 0.0% | 0.9% | 82.6% |
| Bradley | CDP | 75 | 74.7% | 20.0% | 0.0% | 5.3% | 0.0% | 2.7% |
| Carmel-by-the-Sea | City | 3,728 | 90.0% | 3.6% | 6.4% | 0.0% | 0.0% | 8.1% |
| Carmel Valley | CDP | 6,189 | 80.8% | 9.2% | 2.2% | 0.0% | 0.0% | 6.8% |
| Carmel Valley Village | CDP | 4,676 | 88.6% | 9.2% | 2.2% | 0.0% | 0.0% | 6.8% |
| Castroville | CDP | 5,809 | 61.9% | 31.0% | 2.5% | 0.0% | 4.6% | 94.5% |
| Chualar | CDP | 1,182 | 83.0% | 13.4% | 1.6% | 0.9% | 1.1% | 92.0% |
| Del Monte Forest | CDP | 4,312 | 82.1% | 1.9% | 15.2% | 0.0% | 0.7% | 2.7% |
| Del Rey Oaks | City | 1,734 | 87.1% | 8.2% | 3.4% | 1.3% | 0.0% | 16.3% |
| Elkhorn | CDP | 1,828 | 90.9% | 7.1% | 2.0% | 0.0% | 0.0% | 30.1% |
| Gonzales | City | 8,074 | 79.9% | 17.9% | 0.8% | 1.4% | 0.0% | 89.4% |
| Greenfield | City | 15,864 | 66.4% | 21.3% | 4.2% | 1.0% | 7.1% | 87.9% |
| King City | City | 12,629 | 74.6% | 22.8% | 1.5% | 0.8% | 0.3% | 87.2% |
| Las Lomas | CDP | 2,820 | 84.8% | 15.2% | 0.0% | 0.0% | 0.0% | 89.3% |
| Lockwood | CDP | 255 | 96.1% | 0.0% | 0.0% | 3.9% | 0.0% | 14.1% |
| Marina | City | 19,636 | 44.8% | 17.9% | 5.5% | 28.6% | 3.2% | 29.5% |
| Monterey | City | 27,861 | 76.4% | 10.5% | 10.0% | 2.6% | 0.6% | 14.7% |
| Moss Landing | CDP | 232 | 95.3% | 4.7% | 0.0% | 0.0% | 0.0% | 52.6% |
| Pacific Grove | City | 14,995 | 85.7% | 5.3% | 6.5% | 1.7% | 0.8% | 7.9% |
| Pajaro | CDP | 2,939 | 88.5% | 8.4% | 2.4% | 0.5% | 0.1% | 95.1% |
| Pine Canyon | CDP | 2,235 | 70.8% | 18.8% | 0.0% | 0.0% | 10.3% | 50.5% |
| Prunedale | CDP | 18,938 | 80.0% | 11.7% | 5.5% | 1.3% | 1.4% | 41.4% |
| Salinas | City | 148,780 | 68.6% | 22.7% | 6.4% | 1.7% | 0.6% | 75.1% |
| San Ardo | CDP | 591 | 66.7% | 32.5% | 0.0% | 0.0% | 0.8% | 85.3% |
| Sand City | City | 292 | 75.7% | 19.5% | 2.4% | 2.4% | 0.0% | 38.4% |
| San Lucas | CDP | 242 | 69.4% | 26.4% | 0.0% | 4.1% | 0.0% | 96.3% |
| Seaside | City | 32,735 | 58.9% | 20.8% | 8.5% | 9.1% | 2.7% | 40.3% |
| Soledad | City | 25,548 | 66.6% | 17.0% | 2.7% | 12.0% | 1.7% | 69.4% |
| Spreckels | CDP | 803 | 87.9% | 9.7% | 0.0% | 1.5% | 0.9% | 14.3% |
| ‡ Data for Monterey County area of this CDP | ||||||||
| Place | Type[35] | Population[36] | Per capita income[32] | Median household income[33] | Median family income[34] |
|---|---|---|---|---|---|
| Aromas ‡ | CDP | 1,357 | $28,115 | $75,750 | $90,729 |
| Boronda | CDP | 1,606 | $12,288 | $39,899 | $49,405 |
| Bradley | CDP | 75 | $29,332 | $75,625 | $75,625 |
| Carmel-by-the-Sea | City | 3,728 | $56,172 | $76,463 | $98,889 |
| Carmel Valley | CDP | 6,189 | $93,346 | $128,083 | $106,545 |
| Carmel Valley Village | CDP | 4,676 | $48,272 | $82,566 | $106,545 |
| Castroville | CDP | 5,809 | $12,836 | $46,795 | $41,250 |
| Chualar | CDP | 1,182 | $13,492 | $48,654 | $48,269 |
| Del Monte Forest | CDP | 4,312 | $79,282 | $119,663 | $133,103 |
| Del Rey Oaks | City | 1,734 | $37,814 | $76,923 | $101,087 |
| Elkhorn | CDP | 1,828 | $26,959 | $78,750 | $75,288 |
| Gonzales | City | 8,074 | $17,545 | $52,928 | $50,324 |
| Greenfield | City | 15,864 | $14,921 | $56,011 | $51,250 |
| King City | City | 16,360 | $14,337 | $52,634 | $49,735 |
| Las Lomas | CDP | 2,820 | $11,861 | $49,750 | $49,208 |
| Lockwood | CDP | 255 | $51,739 | $91,316 | $76,923 |
| Marina | City | 19,636 | $23,976 | $51,817 | $63,778 |
| Monterey | City | 27,861 | $36,148 | $62,720 | $73,685 |
| Moss Landing | CDP | 232 | $25,884 | $80,385 | $81,635 |
| Pacific Grove | City | 14,995 | $43,319 | $70,211 | $89,708 |
| Pajaro | CDP | 2,939 | $10,873 | $38,542 | $41,313 |
| Pine Canyon | CDP | 2,235 | $20,909 | $61,514 | $62,163 |
| Prunedale | CDP | 18,938 | $29,157 | $76,431 | $80,208 |
| Salinas | City | 148,780 | $18,060 | $50,568 | $50,945 |
| San Ardo | CDP | 591 | $11,615 | $49,063 | $50,313 |
| Sand City | City | 292 | $30,061 | $39,500 | $78,750 |
| San Lucas | CDP | 242 | $12,548 | $49,250 | $51,250 |
| Seaside | City | 32,735 | $22,262 | $58,403 | $62,520 |
| Soledad | City | 25,548 | $9,971 | $53,140 | $53,660 |
| Spreckels | CDP | 803 | $32,730 | $73,287 | $96,250 |
| ‡ Data for Monterey County area of this CDP | |||||
2010
[edit]The 2010 United States census reported that Monterey County had a population of 415,057. The racial makeup of Monterey County was 230,717 (55.6%) White, 12,785 (3.1%) African American, 5,464 (1.3%) Native American, 25,258 (6.1%) Asian (2.8% Filipino, 0.7% Korean, 0.6% Chinese, 0.6% Japanese, 0.4% Vietnamese, 0.4% Indian), 2,071 (0.5%) Pacific Islander, 117,405 (28.3%) from other races, and 21,357 (5.1%) from two or more races. Hispanic or Latino of any race were 230,003 persons (55.4%); 50.2% of Monterey County is Mexican, 0.8% Salvadoran, and 0.5% Puerto Rican.[37]
| Population reported at 2010 United States census | |||||||||
|---|---|---|---|---|---|---|---|---|---|
| The County | Total Population |
White | African American |
Native American |
Asian | Pacific Islander |
other races |
two or more races |
Hispanic or Latino (of any race) |
| Monterey County | 415,057 | 230,717 | 12,785 | 5,464 | 25,258 | 2,071 | 117,405 | 21,357 | 230,003 |
| Incorporated city |
Total Population |
White | African American |
Native American |
Asian | Pacific Islander |
other races |
two or more races |
Hispanic or Latino (of any race) |
| Carmel-by-the-Sea | 3,722 | 3,464 | 11 | 8 | 111 | 6 | 45 | 77 | 174 |
| Del Rey Oaks | 1,624 | 1,326 | 16 | 12 | 128 | 4 | 52 | 86 | 169 |
| Gonzales | 8,187 | 3,464 | 81 | 124 | 190 | 14 | 3,958 | 356 | 7,276 |
| Greenfield | 16,330 | 5,976 | 183 | 878 | 179 | 13 | 8,453 | 648 | 14,917 |
| King City | 12,874 | 6,173 | 150 | 347 | 172 | 8 | 5,451 | 573 | 11,266 |
| Marina | 19,718 | 8,904 | 1,487 | 140 | 3,931 | 544 | 2,738 | 1,974 | 5,372 |
| Monterey | 27,810 | 21,788 | 777 | 149 | 2,204 | 91 | 1,382 | 1,419 | 3,817 |
| Pacific Grove | 15,041 | 12,710 | 199 | 78 | 872 | 49 | 469 | 664 | 1,615 |
| Salinas | 150,441 | 68,973 | 2,993 | 1,888 | 9,438 | 478 | 59,041 | 7,630 | 112,799 |
| Sand City | 334 | 223 | 13 | 3 | 16 | 1 | 61 | 17 | 123 |
| Seaside | 33,025 | 15,978 | 2,783 | 347 | 3,206 | 529 | 7,579 | 2,603 | 14,347 |
| Soledad | 25,738 | 12,625 | 2,945 | 367 | 757 | 103 | 8,189 | 752 | 18,308 |
| Census-designated place |
Total Population |
White | African American |
Native American |
Asian | Pacific Islander |
other races |
two or more races |
Hispanic or Latino (of any race) |
| Aromas‡ | 1,358 | 1,026 | 7 | 24 | 35 | 1 | 194 | 71 | 511 |
| Boronda | 1,710 | 661 | 10 | 26 | 116 | 7 | 774 | 116 | 1,457 |
| Bradley | 93 | 85 | 0 | 2 | 0 | 0 | 5 | 1 | 11 |
| Carmel Valley | 4,407 | 6,189 | 21 | 22 | 70 | 11 | 120 | 119 | 328 |
| Carmel Valley Village | 4,407 | 4,044 | 21 | 22 | 70 | 11 | 120 | 119 | 328 |
| Castroville | 6,481 | 2,807 | 96 | 96 | 169 | 9 | 2,955 | 349 | 5,841 |
| Chualar | 1,190 | 337 | 1 | 2 | 11 | 0 | 827 | 12 | 1,151 |
| Del Monte Forest | 4,514 | 3,922 | 43 | 10 | 388 | 3 | 57 | 91 | 167 |
| Elkhorn | 1,565 | 1,122 | 9 | 7 | 63 | 3 | 286 | 75 | 588 |
| Las Lomas | 3,024 | 1,167 | 37 | 93 | 53 | 24 | 1,490 | 160 | 2,696 |
| Lockwood | 379 | 297 | 4 | 6 | 2 | 0 | 56 | 14 | 100 |
| Moss Landing | 204 | 149 | 7 | 1 | 2 | 1 | 30 | 14 | 46 |
| Pajaro | 3,070 | 1,451 | 15 | 78 | 53 | 0 | 1,281 | 192 | 2,889 |
| Pine Canyon | 1,822 | 1,173 | 29 | 15 | 18 | 0 | 490 | 97 | 984 |
| Prunedale | 17,560 | 11,771 | 177 | 199 | 672 | 58 | 3,639 | 1,044 | 7,322 |
| San Ardo | 517 | 252 | 1 | 3 | 5 | 0 | 245 | 11 | 363 |
| San Lucas | 269 | 113 | 0 | 4 | 6 | 0 | 127 | 19 | 224 |
| Spreckels | 673 | 483 | 0 | 13 | 26 | 0 | 130 | 21 | 193 |
| Other unincorporated areas |
Total Population |
White | African American |
Native American |
Asian | Pacific Islander |
other races |
two or more races |
Hispanic or Latino (of any race) |
| All others not CDPs (combined) | 51,377 | 38,253 | 690 | 522 | 2,365 | 114 | 7,281 | 2,152 | 14,949 |
| ‡ Note: these numbers reflect only the portion of this CDP in Monterey County | |||||||||
2000
[edit]As of the census[38] of 2000, there were 401,762 people, 121,236 households, and 87,896 families residing in the county. The population density was 121 people per square mile (47 people/km2). There were 131,708 housing units at an average density of 40 units per square mile (15 units/km2). The racial makeup of the county was 55.9% White, 3.8% Black or African American, 1.1% Native American, 6.0% Asian, 0.5% Pacific Islander, 27.8% from other races, and 5.0% from two or more races. 46.79% of the population were Hispanic or Latino of any race. 6.3% were of German and 5.4% English ancestry according to Census 2000. 52.9% spoke English, 39.6% Spanish and 1.6% Tagalog as their first language.
There were 121,236 households, out of which 39.1% had children under the age of 18 living with them, 56.0% were married couples living together, 11.6% had a female householder with no husband present, and 27.5% were non-families. 21.2% of all households were made up of individuals, and 8.2% had someone living alone who was 65 years of age or older. The average household size was 3.14 and the average family size was 3.65.
In the county, the population was spread out, with 28.4% under the age of 18, 10.9% from 18 to 24, 31.4% from 25 to 44, 19.3% from 45 to 64, and 10.0% who were 65 years of age or older. The median age was 32 years. For every 100 female residents there were 107.3 male residents. For every 100 female residents age 18 and over, there were 107.7 male residents.
The median income for a household in the county was $48,305, and the median income for a family was $51,169. Men had a median income of $38,444 versus $30,036 for the women. The per capita income for the county was $20,165. About 9.7% of families and 13.5% of the population were below the poverty line, including 17.4% of those under age 18 and 6.8% of those age 65 or over.
Government
[edit]At the local level, Monterey County is governed by the Monterey County Board of Supervisors. Like all governing bodies in California, the Monterey County Board of Supervisors is empowered with both legislative and executive authority over the entirety of Monterey County and is the primary governing body for all unincorporated areas within the County boundaries. The Board has five elected members, each of whom represents one of five districts. Taken together, the five districts comprise the entirety of the county.[39]
Current board members:
- Luis Alejo - 1st District
- Glenn Church - 2nd District
- Chris Lopez - 3rd District
- Wendy Root Askew - 4th District
- Mary Adams - 5th District
The Board conducts its meetings in the county seat, Salinas, and is a member of the regional governmental agency, the Association of Monterey Bay Area Governments.[40][41]
Supervisorial districts
[edit]Supervisorial district boundaries are divided roughly equally according to population, using data from the most recent census.[42] In addition, any redistricting changes should approximately comply with both California law as well as the federal Voting Rights Act.[42] Boundaries are adjusted decennially based on data reported by the United States Census Bureau for the most recent census.[42] The next supervisorial election will be held on March 8, 2022.[43]
District 1
[edit]The 1st District is geographically the smallest supervisorial district in Monterey County and is entirely within the city limits of the city of Salinas.[39][44]
Luis Alejo represents the 1st District on the Board of Supervisors.[45] His current term expires in December 2024.[46]
District 2
[edit]As the northernmost supervisorial district in Monterey County, the 2nd District includes the communities of Boronda, Castroville, Las Lomas, Moss Landing, Pajaro, Prunedale, Royal Oaks, the northern neighborhoods of the city of Salinas, and those portions of the community of Aromas that are located within Monterey County.[39][47]
John Phillips is currently the Supervisor for the 2nd District.[48] His current term expires in December 2026.[46]
District 3
[edit]The 3rd District covers the majority of the Salinas Valley and southern Monterey County, extending to its border with San Luis Obispo County. The district includes the unincorporated communities of Spreckels, Chualar, and Jolon; the eastern portion of the city of Salinas; the cities of Gonzales, Greenfield, Soledad, and King City; the military installations at Fort Hunter Liggett and Camp Roberts; and portions of the Los Padres National Forest.[39][49]
The 3rd District is represented by Chris Lopez.[50] His current term expires in December 2026.[46]
District 4
[edit]The 4th District includes the southwest portion of the city of Salinas, the cities of Del Rey Oaks, Marina, Seaside, Sand City, and the former military installation at Fort Ord.[39][51]
Wendy Root Askew currently holds the seat for 4th District Supervisor.[52] Her current term expires in December 2024.[46]
District 5
[edit]The 5th District is geographically the largest of the five supervisorial districts, and covers most of the Monterey Peninsula and southern coastline of Monterey County down to the southern county border with San Luis Obispo County. The 5th District includes the cities of Carmel-by-the-Sea, Monterey, and Pacific Grove; the unincorporated communities of Carmel Valley, Big Sur, Pebble Beach, San Benancio, Corral de Tierra, and Jamesburg; military installations at the Presidio of Monterey, the Defense Language Institute, and the Naval Postgraduate School; and the Ventana Wilderness area of the Los Padres National Forest.[39][53][54]
Mary L. Adams is currently the 5th District Supervisor.[39] Her current term expires in December 2024.[46]
State and federal representatives
[edit]In the United States House of Representatives, Monterey County is split between two districts:
- California's 18th congressional district, represented by Democrat Zoe Lofgren, and
- California's 19th congressional district, represented by Democrat Jimmy Panetta.
In the California State Assembly, Monterey County is split between the 29th Assembly district, represented by Democrat Robert Rivas, and the 30th Assembly district, represented by Democrat Dawn Addis.[55]
In the California State Senate, Monterey County in the 17th senatorial district, represented by Democrat John Laird.[55]
Policing
[edit]The Monterey County Sheriff provides court protection, jail management, and coroner service for the entire county, in addition to patrol and detective services for the unincorporated areas of the county. Incorporated municipalities within the county that have their own municipal police departments are: Monterey, Pacific Grove, Salinas, King City, Marina, Seaside, Sand City, and Gonzales.
Politics
[edit]Voter registration
[edit]| Population and registered voters | ||
|---|---|---|
| Total population[30] | 411,385 | |
| Registered voters[56][note 3] | 168,245 | 40.9% |
| Democratic[56] | 87,040 | 51.7% |
| Republican[56] | 40,721 | 24.2% |
| Democratic–Republican spread[56] | +46,319 | +27.5% |
| American Independent[56] | 3,927 | 2.3% |
| Green[56] | 1,129 | 0.7% |
| Libertarian[56] | 852 | 0.5% |
| Peace and Freedom[56] | 392 | 0.2% |
| Americans Elect[56] | 12 | 0.0% |
| Other[56] | 241 | 0.1% |
| No party preference[56] | 33,931 | 20.2% |
Cities by population and voter registration
[edit]| Cities by population and voter registration | |||||||
|---|---|---|---|---|---|---|---|
| City | Population[30] | Registered voters[56] [note 3] |
Democratic[56] | Republican[56] | D–R spread[56] | Other[56] | No party preference[56] |
| Carmel-by-the-Sea | 3,728 | 74.8% | 40.5% | 33.6% | +6.9% | 8.8% | 20.4% |
| Del Rey Oaks | 1,734 | 65.1% | 47.9% | 26.4% | +21.5% | 6.6% | 21.8% |
| Gonzales | 8,074 | 34.6% | 66.8% | 14.0% | +52.8% | 5.4% | 15.9% |
| Greenfield | 15,864 | 26.3% | 70.3% | 11.6% | +58.7% | 3.3% | 16.0% |
| King City | 12,629 | 21.6% | 58.7% | 22.6% | +36.1% | 4.1% | 16.2% |
| Marina | 19,636 | 46.4% | 48.2% | 21.8% | +26.4% | 7.9% | 25.1% |
| Monterey | 27,861 | 49.8% | 47.4% | 24.6% | +22.8% | 7.1% | 23.4% |
| Pacific Grove | 14,995 | 64.0% | 49.1% | 23.6% | +25.5% | 7.6% | 22.3% |
| Salinas | 148,780 | 34.1% | 60.2% | 18.8% | +41.4% | 4.6% | 18.2% |
| Sand City | 292 | 51.0% | 37.6% | 24.8% | +12.8% | 14.1% | 29.5% |
| Seaside | 32,735 | 35.6% | 54.1% | 18.9% | +35.2% | 6.7% | 22.9% |
| Soledad | 25,548 | 19.5% | 67.9% | 11.4% | +56.5% | 4.0% | 18.1% |
Overview
[edit]For most of the 20th century, Monterey County was a Republican stronghold in presidential elections. From 1900 until 1992, the only Democrats to carry the county were Woodrow Wilson, Franklin Roosevelt, and Lyndon Johnson. Since 1992, the county has become a Democratic stronghold in Presidential and congressional elections, with George H. W. Bush in 1988 being the last Republican to win Monterey County.
| Year | Republican | Democratic | Third party(ies) | |||
|---|---|---|---|---|---|---|
| No. | % | No. | % | No. | % | |
| 2024 | 49,226 | 33.54% | 93,060 | 63.41% | 4,468 | 3.04% |
| 2020 | 46,299 | 28.24% | 113,953 | 69.52% | 3,671 | 2.24% |
| 2016 | 34,895 | 26.16% | 89,088 | 66.78% | 9,425 | 7.06% |
| 2012 | 37,390 | 30.27% | 82,920 | 67.13% | 3,208 | 2.60% |
| 2008 | 38,797 | 29.89% | 88,453 | 68.15% | 2,533 | 1.95% |
| 2004 | 47,838 | 38.38% | 75,241 | 60.36% | 1,574 | 1.26% |
| 2000 | 43,761 | 37.23% | 67,618 | 57.53% | 6,155 | 5.24% |
| 1996 | 39,794 | 36.66% | 57,700 | 53.15% | 11,064 | 10.19% |
| 1992 | 36,461 | 31.25% | 54,861 | 47.01% | 25,367 | 21.74% |
| 1988 | 50,022 | 49.83% | 48,998 | 48.81% | 1,361 | 1.36% |
| 1984 | 55,710 | 57.16% | 40,733 | 41.79% | 1,027 | 1.05% |
| 1980 | 47,452 | 54.67% | 29,086 | 33.51% | 10,256 | 11.82% |
| 1976 | 40,896 | 51.02% | 36,849 | 45.97% | 2,408 | 3.00% |
| 1972 | 47,004 | 57.04% | 32,545 | 39.49% | 2,859 | 3.47% |
| 1968 | 33,670 | 50.16% | 28,261 | 42.10% | 5,193 | 7.74% |
| 1964 | 24,579 | 37.90% | 40,093 | 61.83% | 172 | 0.27% |
| 1960 | 33,428 | 56.26% | 25,805 | 43.43% | 180 | 0.30% |
| 1956 | 29,514 | 59.54% | 19,932 | 40.21% | 127 | 0.26% |
| 1952 | 30,578 | 62.51% | 18,051 | 36.90% | 286 | 0.58% |
| 1948 | 17,233 | 50.59% | 15,704 | 46.10% | 1,126 | 3.31% |
| 1944 | 12,246 | 45.82% | 14,342 | 53.66% | 140 | 0.52% |
| 1940 | 11,810 | 44.01% | 14,758 | 55.00% | 265 | 0.99% |
| 1936 | 7,565 | 37.70% | 12,267 | 61.13% | 235 | 1.17% |
| 1932 | 6,200 | 39.37% | 8,942 | 56.77% | 608 | 3.86% |
| 1928 | 7,228 | 63.12% | 4,138 | 36.13% | 86 | 0.75% |
| 1924 | 4,744 | 61.07% | 886 | 11.41% | 2,138 | 27.52% |
| 1920 | 4,817 | 67.76% | 1,771 | 24.91% | 521 | 7.33% |
| 1916 | 3,599 | 44.81% | 3,878 | 48.28% | 555 | 6.91% |
| 1912 | 1 | 0.01% | 3,392 | 46.26% | 3,939 | 53.72% |
| 1908 | 2,486 | 53.64% | 1,616 | 34.87% | 533 | 11.50% |
| 1904 | 2,453 | 59.17% | 1,415 | 34.13% | 278 | 6.71% |
| 1900 | 1,964 | 50.10% | 1,825 | 46.56% | 131 | 3.34% |
| 1896 | 1,878 | 45.82% | 2,149 | 52.43% | 72 | 1.76% |
| 1892 | 1,709 | 41.65% | 1,606 | 39.14% | 788 | 19.21% |
| 1888 | 1,875 | 48.55% | 1,866 | 48.32% | 121 | 3.13% |
| 1884 | 1,476 | 50.72% | 1,381 | 47.46% | 53 | 1.82% |
| 1880 | 1,260 | 50.36% | 1,205 | 48.16% | 37 | 1.48% |
According to the California Secretary of State, as of April 2008, Monterey County has 147,066 registered voters.[citation needed] Of those voters, 72,550 (49.3%) are registered Democratic, 42,744 (29.1%) are registered Republican, 5,488 (3.7%) are registered with other political parties, and 26,284 (17.9%) declined to state a political party. Except for Sand City, all of the other cities, towns, and the unincorporated area of Monterey County have more individuals registered with the Democratic Party than the Republican Party. In Sand City, the Republicans have the advantage by 1 voter.
In August 2018, it adopted a flag designed by a Watsonville resident.[58]
Crime
[edit]The following table includes the number of incidents reported and the rate per 1,000 persons for each type of offense.
| Population and crime rates | ||
|---|---|---|
| Population[30] | 411,385 | |
| Violent crime[59] | 2,118 | 5.15 |
| Homicide[59] | 51 | 0.12 |
| Forcible rape[59] | 125 | 0.30 |
| Robbery[59] | 657 | 1.60 |
| Aggravated assault[59] | 1,285 | 3.12 |
| Property crime[59] | 6,885 | 16.74 |
| Burglary[59] | 3,151 | 7.66 |
| Larceny-theft[59][60] | 6,245 | 15.18 |
| Motor vehicle theft[59] | 1,808 | 4.39 |
| Arson[59] | 90 | 0.22 |
Cities by population and crime rates
[edit]| Cities by population and crime rates | ||||||||
|---|---|---|---|---|---|---|---|---|
| City | Population[61] | Violent crimes[61] | Violent crime rate per 1,000 persons |
Property crimes[61] | Property crime rate per 1,000 persons | |||
| Carmel | 3,822 | 7 | 1.83 | 99 | 25.90 | |||
| Del Rey Oaks | 1,668 | 2 | 1.20 | 37 | 22.18 | |||
| Gonzales | 8,404 | 36 | 4.28 | 102 | 12.14 | |||
| Greenfield | 16,765 | 120 | 7.16 | 306 | 18.25 | |||
| King City | 13,214 | 54 | 4.09 | 332 | 25.12 | |||
| Marina | 30,227 | 191 | 6.03 | 1,347 | 24.62 | |||
| Monterey | 28,508 | 153 | 5.37 | 1,016 | 35.64 | |||
| Pacific Grove | 15,437 | 27 | 1.75 | 249 | 16.13 | |||
| Salinas | 154,413 | 1,027 | 6.65 | 4,906 | 31.77 | |||
| Sand City | 343 | 7 | 20.41 | 76 | 221.57 | |||
| Seaside | 33,887 | 109 | 3.22 | 499 | 14.73 | |||
| Soledad | 26,253 | 80 | 3.05 | 284 | 10.82 | |||
Media
[edit]Television service for the community comes from the Monterey-Salinas-Santa Cruz designated market area (DMA). Radio stations Monterey-Salinas-Santa Cruz area of dominant influence (ADI) or continuous measurement market (CMM). Local newspapers include the Monterey County Herald, Monterey County Weekly, Salinas Californian and the Carmel Pine Cone.
Home prices
[edit]As of December 2005, Monterey County ranked among America's ten most expensive counties, with Santa Barbara County topping the list with a median home price of $753,790. In Monterey County, the median home price was $699,900. In the northern, more densely populated part in the county, the median home price was even higher, at $712,500, making it the fourth most expensive housing market in California. The disparity between the median household income of roughly $48,305 and the median home price of $700k has been cause for recent concern over excluding potential home buyers from the market. The end of the United States housing bubble has caused prices to drop substantially, with median home prices having fallen to $280,000 as at September 2008.[62]
Transportation
[edit]Major highways
[edit] U.S. Route 101
 State Route 1
 State Route 25
 State Route 68
 State Route 146
 State Route 156
 State Route 183
 State Route 198
 State Route 218
Public transportation
[edit]Monterey County is served by Amtrak trains and Greyhound Lines buses. Monterey-Salinas Transit provides transit service throughout most of Monterey County, with buses to Big Sur and King City as well as in Monterey, Salinas and Carmel. MST also runs service to San Jose, California in Santa Clara County.
Airports
[edit]- Monterey Regional Airport is located just east of the city of Monterey, California. Commercial flights are available.
- Marina Municipal Airport is located in the city of Marina, California.
- Salinas Municipal Airport is located in the southeast part of Salinas, California.
- Mesa Del Rey Airport is located in the city of King City, California.
Communities
[edit]Cities
[edit]Census-designated places
[edit]- Aromas
- Boronda
- Bradley
- Carmel Valley Village
- Castroville
- Chualar
- Del Monte Forest, includes the well-known community of Pebble Beach
- Elkhorn
- Fort Hunter Liggett
- Las Lomas
- Lockwood
- Moss Landing
- Pajaro
- Pine Canyon
- Prunedale
- San Ardo
- San Lucas
- Spreckels
Unincorporated communities
[edit]- Ambler Park
- Big Sur Village
- Bryson
- Cachagua
- Carmel Highlands
- Carmel Valley
- Corral de Tierra
- Gorda
- Jamesburg
- Jolon
- Notleys Landing
- Old Hilltown
- Pacific Grove Acres
- Parkfield
- Plaskett
- Posts
- Robles del Rio
- San Benancio
- Santa Lucia Preserve
- Slates Hot Springs
- Springtown
- Sycamore Flat
- Tassajara Hot Springs
- White Rock
Other places
[edit]- Big Sur
- Laguna Seca Ranch
- Fort Ord Military Base decommissioned in the 1990s, some of it was converted to California State University, Monterey Bay
- Naval Postgraduate School
- Fort Hunter Liggett
- Presidio of Monterey, home to the Defense Language Institute and one of three presidios in California
- Jacks Peak Park, including the highest point on the Monterey Peninsula
Population ranking
[edit]The population ranking of the following table is based on the 2020 census of Monterey County.[63]
† county seat
| Rank | City/Town/etc. | Municipal type | Population (2020 Census) |
|---|---|---|---|
| 1 | † Salinas | City | 163,542 |
| 2 | Seaside | City | 32,366 |
| 3 | Monterey | City | 30,218 |
| 4 | Soledad | City | 24,925 |
| 5 | Marina | City | 22,359 |
| 6 | Greenfield | City | 18,937 |
| 7 | Prunedale | CDP | 18,885 |
| 8 | Pacific Grove | City | 15,090 |
| 9 | King City | City | 13,332 |
| 10 | Gonzales | City | 8,647 |
| 11 | Castroville | CDP | 7,515 |
| 12 | Carmel Valley | CDP | 6,189 |
| 13 | Del Monte Forest | CDP | 4,204 |
| 14 | Carmel-by-the-Sea | City | 3,220 |
| 15 | Las Lomas | CDP | 3,046 |
| 16 | Pajaro | CDP | 2,882 |
| 17 | Aromas (partially in San Benito County) | CDP | 2,708 |
| 18 | Pine Canyon | CDP | 1,871 |
| 19 | Boronda | CDP | 1,760 |
| 20 | Del Rey Oaks | City | 1,592 |
| 21 | Elkhorn | CDP | 1,588 |
| 22 | Chualar | CDP | 1,185 |
| 23 | Spreckels | CDP | 692 |
| 24 | San Ardo | CDP | 392 |
| 25 | Lockwood | CDP | 368 |
| 26 | Sand City | City | 325 |
| 27 | San Lucas | CDP | 324 |
| 28 | Moss Landing | CDP | 237 |
| 29 | Bradley | CDP | 69 |
Education
[edit]School districts include:[64]
Unified:
- Aromas-San Juan Unified School District
- Big Sur Unified School District
- Gonzales Unified School District - It serves grades PK-12 in some sections and grades 9–12 only in other sections
- Carmel Unified School District
- Coalinga-Huron Unified School District
- Monterey Peninsula Unified School District
- North Monterey County Unified School District
- Pacific Grove Unified School District
- Pajaro Valley Joint Unified School District
- Shandon Joint Unified School District
- Soledad Unified School District
Secondary:
- Paso Robles Joint Unified School District (While it is a K-12 unified school district, it only serves grades 9–12 in its section of this county)
- Salinas Union High School District
- South Monterey County Joint Union High School District
Elementary:
- Alisal Union Elementary School District
- Bradley Union Elementary School District
- Chualar Union Elementary School District
- Graves Elementary School District
- Greenfield Union Elementary School District
- King City Union Elementary School District
- Lagunita Elementary School District
- Mission Union Elementary School District
- Pleasant Valley Joint Union Elementary School District
- Salinas City Elementary School District
- San Antonio Union Elementary School District
- San Ardo Union Elementary School District
- San Lucas Union Elementary School District
- San Miguel Joint Union Elementary School District
- Santa Rita Union Elementary School District
- Spreckels Union Elementary School District
- Washington Union Elementary School District
Gallery
[edit]-
 Big Sur - Midcounty coastline with the McWay Rocks in foreground
 -

-
 Carmel-by-the-Sea - Beach scene
 -
-

-
 Castroville - Main entrance to the city
 -
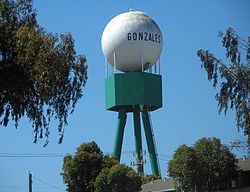 Gonzales - Water tower
 -
 Gorda, California - A view of the Pacific Ocean
 -
 Marina neighborhood
 -
 Main Street - Salinas
 -

-
 Monterey - Cannery Row
 -
 Monterey - Fisherman's Wharf
 -
 Monterey - Commercial Wharf
 -
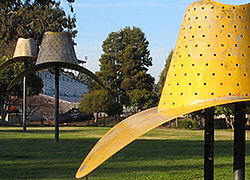 Hat in three stages of landing by Claes Oldemburg - Salinas
 -
 Monterey - Beachside recreational trail
 -
 Monterey - Scuba diving lessons in Monterey Bay
 -

-
 Monterey County - Strawberry fields in rural area
 -
 Lapis Road looking south
 -
 Junipero Serra Peak, highest point in the county
 -
 Salinas - John Steinbeck's former home
 -
 Marina Sunset
 -
-
 Salinas - Newer Spanish-Revival style house in Harden Ranch
 -
 Salinas - An average 1,400 sq ft (130 m2) home in North Salinas
 -
 Salinas - Residential neighborhood at Harden Ranch, Salinas
 -
 Salinas - Downtown
 -

-
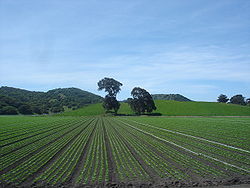 Agricultural fields in the Salinas Valley
 -
Steinbeck House - Salinas
-


See also
[edit]- Coastal California
- List of museums in the California Central Coast
- List of school districts in Monterey County, California
- Monterey County reforestation
- National Register of Historic Places listings in Monterey County, California
- List of tourist attractions in Monterey County, California
- Fort Hunter Liggett
Notes
[edit]- ^ Other = Some other race + Two or more races
- ^ Native American = Native Hawaiian or other Pacific Islander + American Indian or Alaska Native
- ^ a b Percentage of registered voters with respect to total population. Percentages of party members with respect to registered voters follow.
- ^ This total comprised 3,081 votes for Progressive Theodore Roosevelt (who was official Republican nominee in California), 557 votes for Socialist Eugene V. Debs and 301 votes for Prohibition Party nominee Eugene W. Chafin.
References
[edit]- ^ "Chronology". California State Association of Counties. Retrieved February 6, 2015.
- ^ "Board of Supervisors | Monterey County, CA".
- ^ "Junipero Serra Peak". Peakbagger.com. Retrieved March 16, 2015.
- ^ "Gross Domestic Product: All Industries in Monterey County, CA". Federal Reserve Economic Data. Federal Reserve Bank of St. Louis.
- ^ "Monterey County, California". United States Census Bureau. Retrieved January 30, 2022.
- ^ "Find a County". National Association of Counties. Retrieved June 7, 2011.
- ^ Gudde, Erwin G. (1949). California Place Names. Berkeley, Calif.: University of California Press. p. 222. ASIN B000FMOPP4.
- ^ "2010 Census Gazetteer Files". United States Census Bureau. August 22, 2012. Retrieved September 28, 2015.
- ^ Jake Johnson (October 5, 2019), "Merging 'Loyalty to the Oil Industry' and 'Grudge Against California,' Trump Opens 725,000 Acres to Fossil Fuel Drilling", Common Dreams, retrieved October 5, 2019
- ^ "Annual Estimates of the Resident Population for Counties: April 1, 2020 to July 1, 2024". United States Census Bureau. Retrieved May 10, 2025.
- ^ "Census of Population and Housing from 1790-2000". US Census Bureau. Retrieved January 24, 2022.
- ^ "Historical Census Browser". University of Virginia Library. Retrieved September 28, 2015.
- ^ Forstall, Richard L., ed. (March 27, 1995). "Population of Counties by Decennial Census: 1900 to 1990". United States Census Bureau. Archived from the original on September 24, 2015. Retrieved September 28, 2015.
- ^ "Census 2000 PHC-T-4. Ranking Tables for Counties: 1990 and 2000" (PDF). United States Census Bureau. April 2, 2001. Retrieved September 28, 2015.
- ^ a b "P2: Hispanic or Latino, and Not Hispanic or Latino by Race – 2010: DEC Redistricting Data (PL 94-171) – Monterey County, California". United States Census Bureau.
- ^ a b "P2: Hispanic or Latino, and Not Hispanic or Latino by Race – 2020: DEC Redistricting Data (PL 94-171) – Monterey County, California". United States Census Bureau.
- ^ "California: 1980, General Social and Economic Characteristics, Part 1 - Table 59: Persons by Race, Hispanic Origin, and Sex" (PDF). United States Census Bureau.
- ^ "California: 1990, Part 1 - Table 5: Race and Hispanic Origin" (PDF). United States Census Bureau. Retrieved July 14, 2024.
- ^ "P004: Hispanic or Latino, and Not Hispanic or Latino by Race – 2000: DEC Summary File 1 – Monterey County, California". United States Census Bureau.
- ^ included in the Asian category in the 1980 Census
- ^ included in the Asian category in the 1990 Census
- ^ not an option in the 1980 Census
- ^ not an option in the 1990 Census
- ^ "American FactFinder - Results". factfinder.census.gov. U.S. Census Bureau. Archived from the original on February 14, 2020. Retrieved June 14, 2016.
- ^ a b c "MEDIAN HOUSEHOLD INCOME IN THE PAST 12 MONTHS (IN 2013 INFLATION-ADJUSTED DOLLARS)". American Fact Finder. U.S. Census Bureau. Archived from the original on December 26, 2014. Retrieved December 27, 2014.
- ^ a b c d e "MEDIAN HOUSEHOLD INCOME IN THE PAST 12 MONTHS (IN 2013 INFLATION-ADJUSTED DOLLARS)". American Fact Finder. U.S. Census Bureau. Archived from the original on December 26, 2014. Retrieved December 26, 2014.
- ^ a b "EDUCATIONAL ATTAINMENT FOR THE POPULATION 25 YEARS AND OVER". American Fact Finder. U.S. Census Bureau. Archived from the original on December 26, 2014. Retrieved December 26, 2014.
- ^ a b "POVERTY STATUS IN THE PAST 12 MONTHS BY HOUSEHOLD TYPE BY AGE OF HOUSEHOLDER". American Fact Finder. U.S. Census Bureau. Archived from the original on December 26, 2014. Retrieved December 26, 2014.
- ^ a b "Map Index". American Fact Finder. U.S. Census Bureau. Retrieved December 26, 2014.
- ^ a b c d e f g h i j k l m n o p q U.S. Census Bureau. American Community Survey, 2011 American Community Survey 5-Year Estimates, Table B02001. U.S. Census website. Retrieved October 26, 2013.
- ^ a b U.S. Census Bureau. American Community Survey, 2011 American Community Survey 5-Year Estimates, Table B03003. U.S. Census website. Retrieved October 26, 2013.
- ^ a b U.S. Census Bureau. American Community Survey, 2011 American Community Survey 5-Year Estimates, Table B19301. U.S. Census website. Retrieved October 21, 2013.
- ^ a b U.S. Census Bureau. American Community Survey, 2011 American Community Survey 5-Year Estimates, Table B19013. U.S. Census website. Retrieved October 21, 2013.
- ^ a b U.S. Census Bureau. American Community Survey, 2011 American Community Survey 5-Year Estimates, Table B19113. U.S. Census website. Retrieved October 21, 2013.
- ^ a b U.S. Census Bureau. American Community Survey, 2011 American Community Survey 5-Year Estimates. U.S. Census website. Retrieved October 21, 2013.
- ^ U.S. Census Bureau. American Community Survey, 2011 American Community Survey 5-Year Estimates, Table B01003. U.S. Census website. Retrieved October 21, 2013.
- ^ "2010 Census P.L. 94-171 Summary File Data". United States Census Bureau.
- ^ "U.S. Census website". United States Census Bureau. Retrieved May 14, 2011.
- ^ a b c d e f g "Monterey County Supervisors and Their Districts". Board of Supervisors, County of Monterey. Retrieved December 26, 2018.
- ^ "Attend a Board Meeting". Board of Supervisors, County of Monterey. Archived from the original on August 13, 2012. Retrieved September 21, 2012.
- ^ "AMBAG Board of Directors". Association of Monterey Bay Area Governments. Archived from the original on November 10, 2012. Retrieved September 20, 2012.
- ^ a b c "Districts and Redistricting, Monterey County Elections". Monterey County Elections Department. Archived from the original on April 29, 2014. Retrieved September 21, 2012.
- ^ "Elected Officials County Offices". Retrieved April 13, 2020.
- ^ "Monterey County Supervisorial District 1 Map" (PDF). County of Monterey. Archived from the original (PDF) on October 1, 2012. Retrieved September 21, 2012.
- ^ "Monterey County 1st District Supervisor Luis Alejo". Board of Supervisors, County of Monterey. Retrieved December 26, 2018.
- ^ a b c d e "Board of Supervisors". County of Monterey. Retrieved July 24, 2023.
- ^ "Monterey County Supervisorial District 2 Map" (PDF). County of Monterey. Archived from the original (PDF) on October 1, 2012. Retrieved September 21, 2012.
- ^ "District 2 - Supervisor John M. Phillips". Retrieved April 13, 2020.
- ^ "Monterey County Supervisorial District 3 Map" (PDF). County of Monterey. Archived from the original (PDF) on October 1, 2012. Retrieved September 21, 2012.
- ^ "District 3 - Supervisor Chris Lopez". County of Monterey. Retrieved April 13, 2020.
- ^ "Monterey County Supervisorial District 4 Map" (PDF). County of Monterey. Archived from the original (PDF) on October 1, 2012. Retrieved September 21, 2012.
- ^ "Jane Parker, Supervisor Fourth District". Board of Supervisors, County of Monterey. Retrieved September 21, 2012.
- ^ "Monterey County Supervisorial District 5 Map (North District 5)" (PDF). County of Monterey. Archived from the original (PDF) on July 1, 2012. Retrieved September 21, 2012.
- ^ "Monterey County Supervisorial District 5 Map (South District 5)" (PDF). County of Monterey. Archived from the original (PDF) on July 1, 2012. Retrieved September 21, 2012.
- ^ a b "Final Maps | California Citizens Redistricting Commission". Retrieved November 4, 2025.
- ^ a b c d e f g h i j k l m n o p q California Secretary of State. February 10, 2013 - Report of Registration Archived July 27, 2013, at the Wayback Machine. Retrieved October 31, 2013.
- ^ Leip, David. "Dave Leip's Atlas of U.S. Presidential Elections". uselectionatlas.org. Retrieved September 1, 2018.
- ^ Johnson, Jim (September 8, 2018). "Monterey County gets first-ever flag as final design chosen". Monterey Herald. Retrieved September 8, 2018.
- ^ a b c d e f g h i j Office of the Attorney General, Department of Justice, State of California. Table 11: Crimes – 2009 Archived December 2, 2013, at the Wayback Machine. Retrieved November 14, 2013.
- ^ Only larceny-theft cases involving property over $400 in value are reported as property crimes.
- ^ a b c United States Department of Justice, Federal Bureau of Investigation. Crime in the United States, 2012, Table 8 (California). Retrieved November 14, 2013.
- ^ "Mish's Global Economic Trend Analysis: C.A.R. Median Home Prices Down 47% From Peak". globaleconomicanalysis.blogspot.com.
- ^ "Explore Census Data". United States Census Bureau. Retrieved October 3, 2021.
- ^ "2020 CENSUS - SCHOOL DISTRICT REFERENCE MAP: Monterey County, CA" (PDF). U.S. Census Bureau. Retrieved July 25, 2022. - Text list
External links
[edit]- Official website

- Monterey County Convention & Visitors Bureau
- Carmel Magazine: The Lifestyle Magazine of the Monterey Peninsula
- Finding Aid to the Monterey County Miscellany, 1844-1850 at The Bancroft Library
- Arts Council for Monterey County
| Bodies of water & submarine features |  | |
|---|---|---|
| Counties | ||
| Major cities | ||
| Cities and towns 50k-100k | ||
| Cities and towns 25k-50k | ||
| Cities, towns, and census-designated places <25k | ||
| Ghost towns | ||
Municipalities and communities of Monterey County, California, United States | ||
|---|---|---|
| Cities |  | |
| CDPs | ||
| Unincorporated communities |
| |
| CCDs | ||
| Ghost towns | ||
| Footnotes | ‡This populated place also has portions in an adjacent county | |
| International | |
|---|---|
| National | |
| Geographic | |
| Other | |
Monterey County, California
View on GrokipediaMonterey County is a coastal county in central California, situated along the Pacific Ocean with the Salinas Valley to the east and the Santa Lucia Mountains rising sharply from the shoreline. It spans approximately 3,281 square miles of land, including nearly 100 miles of coastline—the longest of any county in the state—and had an estimated population of 439,035 as of 2023.[1][2]
The county's economy centers on agriculture, which employs the majority of workers and ranks third in California by production value, with the Salinas Valley—dubbed the "Salad Bowl of the World"—supplying a substantial share of the nation's lettuce, strawberries, and other fresh vegetables through intensive year-round cultivation enabled by the region's Mediterranean climate.[2][3] Tourism drives coastal development, drawing millions annually to attractions like the Monterey Bay Aquarium, Pebble Beach Golf Links, and the dramatic Big Sur wilderness, while the area's historical missions and literary ties to John Steinbeck add cultural depth.[4][2]
History
Indigenous Peoples and Early European Contact
The region encompassing modern Monterey County was inhabited by indigenous groups for millennia prior to European arrival, primarily the Esselen in the interior Santa Lucia Mountains and upper Carmel Valley, and the Rumsien band of the Ohlone (also known as Costanoan) along the Monterey Peninsula and coastal bays.[5][6] The Esselen, speaking a language isolate unrelated to neighboring tongues, maintained small, semi-permanent villages focused on hunting, gathering, and seasonal resource exploitation in a rugged terrain of oak woodlands and streams, with evidence of their presence dating back approximately 6,000 years through archaeological sites including rock art and middens.[7][8] The Rumsien Ohlone occupied villages such as Tamo near present-day Monterey, relying on marine resources like shellfish, fish, and seals from the abundant bays, supplemented by terrestrial game and acorns; their society featured flexible band structures, shell bead currency, and basketry technologies adapted to the coastal ecology.[9][10] The first recorded European sighting of Monterey Bay occurred on November 17, 1542, when Portuguese explorer Juan Rodríguez Cabrillo, sailing for Spain, approached the coastline and named it La Bahía de los Pinos (Bay of the Pines) but did not land, continuing northward amid harsh conditions that led to his death soon after.[9] More substantive contact followed on December 16, 1602, when Spanish explorer Sebastián Vizcaíno anchored his fleet—including the ships San Diego, Santo Tomás, and frigate Tres Reyes—in the bay, which he rechristened Puerto de Monterrey in honor of the Viceroy of New Spain.[11] Vizcaíno's party went ashore the next day, celebrated Mass under an oak tree on December 17, and interacted briefly with local Rumsien villagers, noting their hospitality, nudity, and use of reed boats, while claiming the land for Spain; however, no permanent settlement ensued due to logistical challenges and Vizcaíno's prioritization of mapping for future colonization.[11][12] Overland European exploration reached the area during the Portolá expedition of 1769–1770, dispatched by Spain to secure Alta California against Russian and British advances. Led by Governor Gaspar de Portolá with Franciscan missionaries including Juan Crespí, the party departed Baja California in July 1769, traversed deserts and coastal ranges, and first sighted Monterey Bay on October 1, 1769, but fog and unfamiliarity caused them to bypass it and proceed north to discover San Francisco Bay.[13] Returning southward in late 1769, they camped near Monterey on October 30 without establishing a presence, driven by supply shortages and the need to relieve the San Diego contingent.[13] A follow-up push in spring 1770 culminated in Portolá's arrival at Monterey on May 24, 1770, where initial native encounters involved cautious exchanges of food and goods with Rumsien groups, marking the prelude to presidio construction and mission founding later that year.[13] These contacts introduced Old World diseases, trade items, and cultural disruptions, though immediate demographic collapse accelerated with subsequent mission systems.[6]Spanish and Mexican Eras
The Spanish colonization of the Monterey region began with the Portolá expedition, which arrived at Monterey Bay in May 1770 under the command of Governor Gaspar de Portolá. On June 3, 1770, the expedition established the Presidio of Monterey, the second military fort in Alta California, intended to secure Spanish claims against Russian and British encroachment while supporting the mission system.[14] Simultaneously, Franciscan friar Junípero Serra dedicated Mission San Carlos Borromeo de Carmelo at the presidio site, though it was relocated to nearby Carmel in 1771 to separate religious and military activities amid tensions over neophyte labor and discipline.[15] These foundations introduced European agriculture, livestock, and architecture to the area, transforming the landscape through mission-managed herds that numbered thousands of cattle by the 1790s.[16] Monterey quickly became the political and administrative center of Alta California, designated as the provincial capital in 1777, a role it held for nearly seven decades.[9] The presidio garrison, initially comprising about 40 soldiers, enforced Spanish policies, including the encomienda-like labor system at missions that converted and employed indigenous Esselen, Salinan, and Ohlone populations. Further inland, Mission Nuestra Señora de la Soledad was founded on September 9, 1791, in the Salinas Valley, extending Spanish influence and facilitating overland communication via El Camino Real.[17] By the early 19th century, the Spanish era had established a fragile colonial economy reliant on mission productivity, with Monterey's presidio chapel—completed in 1794—serving as the oldest continuously used stone church in California.[16] Following Mexico's independence from Spain in 1821, the Monterey region transitioned to Mexican rule, retaining Monterey as the capital of Alta California until 1846.[18] In 1827, Mexican authorities formally recognized Monterey as a pueblo, encouraging civilian settlement beyond the presidio walls and fostering trade with foreign vessels.[19] The pivotal shift occurred with the Mexican Secularization Act of 1833, which dismantled the missions between 1834 and 1836 by confiscating their lands—totaling over 400,000 acres in the Monterey vicinity—and redistributing them primarily as large ranchos to Californio elites, military officers, and a few indigenous individuals, though the latter often received inadequate portions and faced displacement.[20] This policy, aimed at promoting private agriculture and reducing Franciscan control, instead concentrated wealth in haciendas focused on cattle ranching for the hide-and-tallow export trade to Boston merchants.[21] In Monterey County, over two dozen ranchos were granted during the Mexican era, including Rancho Tembladero in 1834 and Rancho Buena Vista in 1839, spanning tens of thousands of acres along the Salinas River and coastal ranges for grazing vast herds that peaked at 100,000 head regionally by the 1840s.[21] This rancho system entrenched a pastoral economy dependent on indigenous and mestizo vaquero labor, while secularized missions like Carmel and Soledad devolved into adobes housing ranch hands, marking the decline of centralized mission authority and the rise of individualized land tenure that persisted until American land claims validations post-1848.[22] Mexican governance introduced liberal reforms, such as expanded trade and immigration, but internal instability and external pressures foreshadowed the Bear Flag Revolt and U.S. conquest in 1846.American Statehood and 19th-Century Development
Following the Mexican-American War, U.S. naval forces under Commodore John D. Sloat seized Monterey on July 7, 1846, raising the American flag and claiming Alta California for the United States.[9] The Treaty of Guadalupe Hidalgo, ratified in 1848, formally ceded the territory to the U.S., ending Mexican control.[9] In 1849, delegates from ten districts convened at Colton Hall in Monterey from September 1 to October 13 to draft California's first constitution, paving the way for statehood application.[9] On September 9, 1850, Congress admitted California as the 31st state, and Monterey County was formed as one of the original 27 counties by the new state legislature.[23][9] Although Monterey had served as the capital under Spanish and Mexican rule, the state legislature selected San Jose as the initial seat of government in 1850, with subsequent moves to Vallejo in 1852 and Sacramento in 1854, diminishing the city's political centrality.[9] Colton Hall functioned as the Monterey County seat from 1850 until 1873, when it shifted to Salinas amid growing inland populations.[9] The California Land Act of 1851 facilitated American and European investors in purchasing former Mexican ranchos through legal confirmation processes, leading to widespread subdivision of large land grants in the 1860s and 1870s.[24] Economic activity transitioned from coastal trade and ranching toward inland agriculture, with cattle ranching dominant in the 1860s, producing hides and dairy products shipped from ports like Monterey.[25] Dairying expanded notably from 1862, with a herd of 500 cows established near Spreckels, while grain crops such as barley and wheat became staples in the Salinas Valley.[25] The arrival of the Southern Pacific Railroad in Soledad by 1874 spurred settlement and transport, fostering towns like Gonzales (laid out in 1874) and Chualar (founded 1875), and enabling Salinas's incorporation in 1874 as an agricultural processing center.[24][26] Population growth in the 1860s–1890s drew diverse settlers, including Danes, French, and Basques, to valley areas like Jolon, where the Dutton Hotel opened in 1876 to serve travelers and farmers.[24] By the late 1890s, early irrigation canals supported diversification, including sugar beets processed from 1893 at the Spreckels factory.[24][27]20th-Century Expansion and Key Events
The establishment of Fort Ord in 1917 marked a significant military expansion in Monterey County, as the U.S. Army acquired land along Monterey Bay for artillery and cavalry training, transforming former ranchlands into a key installation that would later support infantry operations.[28] This development coincided with agricultural intensification in the Salinas Valley, where wheat cultivation from the 1850s evolved into row crop dominance by the early 1900s, driven by irrigation advancements and market demands; lettuce acreage, for instance, expanded from 175 acres in 1922 to substantial commercial scales, earning the region its "Salad Bowl" moniker through refrigerated rail shipping that enabled nationwide distribution.[29] [30] The 1920s and 1930s saw the rise of the sardine canning industry along Monterey's Cannery Row, initiated in 1902 but peaking with multiple factories processing millions of tons annually by the 1940s, fueled by abundant fisheries and immigrant labor from Chinese, Japanese, and later Filipino and Mexican workers.[31] Labor tensions erupted in Salinas during the 1930s, with strikes by Filipino and Mexican fieldworkers demanding better wages amid the Great Depression, reflecting broader migrant labor dynamics in California's agribusiness without resolving underlying wage disparities.[32] World War II accelerated Fort Ord's role as a primary infantry training center, housing up to 60,000 troops and contributing to population influxes, while John Steinbeck's 1945 novel Cannery Row immortalized the area's industrial grit, though overfishing soon precipitated the industry's collapse, with sardine stocks plummeting and the last cannery closing in 1973.[33] [34] Postwar decades brought sustained agricultural output, with Salinas' population reaching 10,263 by 1930 and continuing to grow through diversified vegetable production, alongside tourism spurred by the Monterey Peninsula's natural allure and cultural sites.[30] Fort Ord remained a basic training hub until the 1970s, bolstering local employment until its 1994 closure under base realignment, which shifted economic reliance toward agriculture and emerging sectors like defense language training at the Presidio of Monterey.[35] The 1989 Loma Prieta earthquake caused structural damage in coastal areas, including Monterey, underscoring vulnerabilities in the region's seismically active terrain, though recovery efforts highlighted resilient infrastructure adaptations.Geography
Physical Landscape and Topography
Monterey County spans approximately 3,324 square miles along California's central coast, featuring a varied topography shaped by tectonic uplift, faulting, and coastal erosion. The landscape includes low-lying coastal areas, steep mountainous terrain, and broad alluvial valleys, with elevations ranging from sea level along the Pacific Ocean to peaks exceeding 5,800 feet.[36][37] The Santa Lucia Range dominates the county's southern and coastal regions, forming a rugged barrier parallel to the Pacific where peaks rise abruptly from the shoreline. This range extends southeast from near Carmel for over 140 miles, with slopes often exceeding 3,000 feet in elevation within three miles of the coast, creating dramatic cliffs and narrow canyons prone to landslides due to active tectonics.[37][38] The highest point, Junipero Serra Peak, reaches 5,862 feet in the northern portion of the range within the county.[39] Inland, the Salinas Valley forms a 90-mile-long, northwest-southeast trending alluvial plain bounded by the Santa Lucia Range to the west and the Gabilan Range to the east, with widths varying from 5 to 20 miles and elevations generally below 500 feet. This valley, carved by the Salinas River, contrasts sharply with the surrounding uplands and supports intensive agriculture due to its flat, sediment-filled floor.[40][26] The northern coastal zone encompasses Monterey Bay and the Monterey Peninsula, characterized by sandy beaches, dunes, and submerged canyons like the Monterey Canyon, which extends over 6,000 feet deep offshore. The peninsula itself features low-relief headlands, pocket beaches, and forested hills rising to about 500 feet, influenced by marine terraces and fault scarps.[41][42] The Big Sur region exemplifies the county's extreme topographic relief, where the Santa Lucia Mountains plunge directly into the ocean, forming sheer sea cliffs, sea stacks, and incised river valleys along California State Route 1. This coastal stretch, from Carmel to San Simeon, averages 3.5 miles from ocean to range crest, with ongoing uplift rates contributing to its steep gradients and erosion patterns.[43][38]Climate Patterns
Monterey County's climate is classified as Mediterranean, featuring mild winters, cool summers, and low annual precipitation, with significant variations due to topography, ocean currents, and the Monterey Bay's influence. Coastal regions benefit from the cool California Current, which promotes upwelling and persistent marine fog, maintaining moderate temperatures year-round. Inland valleys and mountainous areas experience greater diurnal and seasonal temperature swings, with hotter summers and occasional frost in higher elevations.[44][45] In coastal Monterey, average annual temperatures range from lows of 44°F in winter to highs of 68°F in summer, rarely exceeding 77°F or dropping below 37°F, reflecting oceanic moderation that suppresses extreme heat. Precipitation averages 18-21 inches annually, concentrated between October and March, with January typically the wettest month at about 4.5 inches. Inland at Salinas, summer highs average 74°F but can reach 90°F or more during heat waves, while winter lows dip to 35-40°F, with less fog but similar rainfall patterns of around 13-15 inches yearly. The Santa Lucia Mountains receive higher precipitation, up to 30-40 inches in some locales, due to orographic lift, occasionally producing snow above 3,000 feet.[46][47][44] Extreme events underscore the region's variability: the wettest calendar year on record for Monterey was 1998 with 41 inches of precipitation, while droughts, such as those in the 2010s, reduced annual totals below 10 inches in coastal areas. Summer fog, known locally as "May Gray" and "June Gloom," can persist into afternoon, reducing visibility and temperatures by 10-20°F compared to inland sites just a few miles away. These microclimates arise from coastal-inland contrasts, where marine layers trap heat inland while cooling the coast, influencing agriculture and ecology across the county.[48][49][50]Natural Resources and Protected Areas
Monterey County features substantial hydrocarbon resources, primarily oil and natural gas extracted from the organic-rich siliceous shales of the Miocene Monterey Formation, which extends across the subsurface of the region and has historically supplied a significant portion of California's offshore petroleum production.[51] The formation's diatomaceous and phosphatic deposits also yield industrial minerals like diatomite, used in filtration and abrasives, alongside bituminous sandstone and specialty sands quarried for construction.[52] Inland forested expanses, dominated by redwoods, oaks, and pines within the Santa Lucia Mountains, support limited timber harvesting, though much is constrained by conservation designations.[53] Marine fisheries in Monterey Bay provide sardines, anchovies, squid, and groundfish, sustaining commercial operations despite regulatory limits to prevent overexploitation.[54] The county hosts extensive protected areas emphasizing habitat preservation and public access. The Monterey Bay National Marine Sanctuary, designated in 1992 under the National Oceanic and Atmospheric Administration, encompasses approximately 6,662 square miles of coastal waters, safeguarding kelp forests, submarine canyons, and migratory species while permitting regulated fishing and research.[55] Fort Ord National Monument, proclaimed in 2012 by the Bureau of Land Management, spans 28,000 acres of decommissioned military terrain, restoring oak woodlands and dunes for biodiversity and trails.[33] Eastern portions of Pinnacles National Park, established in 2013, protect volcanic rock formations and condor habitat across 26,000 acres shared with adjacent counties.[53] State-managed lands include Fort Ord Dunes State Park, opened in 2009 with 1,000 acres of beachfront dunes and coastal scrub, and Point Lobos State Natural Reserve, renowned for endemic Monterey cypress groves and intertidal zones supporting sea otters and harbor seals.[56] Big Sur coastal parks—such as Andrew Molera, Pfeiffer Big Sur, Julia Pfeiffer Burns, Garrapata, and Limekiln—collectively preserve over 20,000 acres of rugged shoreline, redwood forests, and waterfalls, designated since the mid-20th century to mitigate development pressures.[57] Inland, the Los Padres National Forest covers roughly 1.5 million acres in the county, incorporating the 98,000-acre Ventana Wilderness and Silver Peak Wilderness for old-growth conifers and watershed protection.[53] Smaller sites like the Salinas River National Wildlife Refuge focus on riparian corridors for endangered species such as the California tiger salamander.[53] Complementary marine protected areas, including Lovers Point State Marine Reserve and Asilomar State Marine Reserve, enforce no-take zones to bolster fish stocks and ecosystem resilience.[58]Demographics
Population Growth and Trends
Monterey County's population has expanded substantially over the past century and a half, transitioning from a sparsely populated rural area to a mid-sized coastal county shaped by agriculture, military presence, and tourism. The 1850 U.S. Census recorded 1,083 residents, primarily engaged in ranching and early farming following California statehood.[59] Growth remained modest through the late 19th century but accelerated in the 20th century due to irrigated agriculture in the Salinas Valley, which drew migrant labor, and federal investments in defense facilities like Fort Ord during World War II. By 1970, the population reached 247,388, reflecting postwar economic booms.[60] Decennial census data illustrate steady increases through the late 20th and early 21st centuries, fueled by natural increase—particularly higher fertility rates among Hispanic residents—and net immigration tied to seasonal agricultural employment and military-related jobs. The population rose to 305,852 in 1980, 355,660 in 1990, 401,762 in 2000, 416,681 in 2010, and peaked at 439,035 in the 2020 Census, representing a compound annual growth rate of about 0.6% from 2010 to 2020.[60]| Census Year | Population |
|---|---|
| 1970 | 247,388 |
| 1980 | 305,852 |
| 1990 | 355,660 |
| 2000 | 401,762 |
| 2010 | 416,681 |
| 2020 | 439,035 |
Ethnic and Racial Composition
As of the 2022 American Community Survey estimates, 61% of Monterey County's population of approximately 436,000 residents identified as Hispanic or Latino of any race, making it the predominant ethnic group.[61] This proportion has grown from 51% in 2004, driven primarily by migration tied to the county's agriculture-dependent economy, which relies heavily on seasonal and permanent farm labor from Mexico and Central America.[66] [61] Non-Hispanic Whites accounted for 27.5% of the population in the same estimates, concentrated in coastal urban areas like Monterey and Carmel, while comprising a smaller share in inland agricultural zones such as Salinas.[61] Asians, primarily of Filipino, Chinese, and Japanese descent, represented about 7% of residents, with higher concentrations near military installations like Naval Postgraduate School and in fishing communities. Black or African Americans formed 2.3%, American Indians and Alaska Natives 1.2%, and Native Hawaiians or Pacific Islanders 0.5%, with the remainder in two or more races or other categories.[67] These minority non-Hispanic groups total under 12% combined, reflecting limited historical settlement patterns outside agriculture and defense sectors.[64] The 2020 decennial Census confirmed a similar distribution, with 60.4% Hispanic or Latino and 27.4% non-Hispanic White among 439,035 residents, underscoring stability amid population fluctuations from economic cycles in lettuce, strawberry, and wine production.[67] Within the Hispanic population, over 90% trace origins to Mexico, correlating with the county's status as a top U.S. agricultural producer where farmworkers, often undocumented or on temporary visas, sustain output valued at $4.6 billion annually.[68] [61]| Racial/Ethnic Group (2022 ACS) | Percentage of Population |
|---|---|
| Hispanic or Latino (any race) | 61% |
| White (non-Hispanic) | 27.5% |
| Asian | 7% |
| Black or African American | 2.3% |
| American Indian/Alaska Native | 1.2% |
| Other/multiple races | 1% |
Socioeconomic Indicators
Monterey County's socioeconomic profile reflects a bimodal distribution, with affluent coastal enclaves contrasting against lower-income inland areas dominated by seasonal agricultural labor. The median household income was $94,486 in 2023, per American Community Survey data, though alternative estimates accounting for underreported earnings among migrant workers place it lower at $58,136.[61][69] Per capita personal income, which captures individual earnings more broadly, reached $68,943 in 2023, exceeding the national average but trailing wealthier California counties due to reliance on low-skill sectors.[70] The poverty rate stood at 14.0% in 2023, higher than the statewide figure of approximately 12%, driven primarily by concentrations of Hispanic farmworkers in the Salinas Valley whose incomes fall below federal thresholds despite essential contributions to food production.[69] Unemployment averaged 6.3% in mid-2024, above California's rate, with vulnerabilities in agriculture tied to crop cycles and labor market fluctuations.[71] Educational attainment lags behind state and national benchmarks, with 73.3% of adults aged 25 and older holding a high school diploma or higher in recent estimates, reflecting barriers including language proficiency among immigrant populations and limited access to higher education in rural zones.[72] Bachelor's degree attainment hovers around 22-23%, constraining upward mobility in non-manual occupations. Income inequality is pronounced, with a Gini coefficient of 0.4627 indicating moderate-to-high disparity, exacerbated by juxtaposed high-end tourism wages and subsistence-level field labor.[73] Housing affordability poses acute challenges, as coastal desirability inflates prices; 18.5% of households spend 50% or more of income on shelter, surpassing national norms and fueling displacement of working-class residents.[74] Median home values and rents require hourly wages of $57.35 for a two-bedroom apartment, underscoring causal links between restricted supply, regulatory hurdles, and speculative investment rather than inherent market failure.[75]| Key Socioeconomic Indicator | Value | Period |
|---|---|---|
| Median Household Income | $94,486 | 2023 |
| Per Capita Income | $68,943 | 2023 |
| Poverty Rate | 14.0% | 2023 |
| Unemployment Rate | 6.3% | Jul 2024 |
| High School or Higher | 73.3% | 2023 |
| Gini Coefficient | 0.4627 | Recent |
| Severe Housing Cost Burden | 18.5% | Recent |
Economy
Agricultural Sector Dominance
Agriculture constitutes the largest sector of Monterey County's economy, contributing approximately 18.7% to the county's gross domestic product and supporting over 57,000 direct jobs, or about 23% of total employment, as of recent analyses.[76][77] The sector's dominance stems from the unique microclimate of the Salinas Valley, where fog and cool ocean breezes enable year-round production of high-value cool-season crops, positioning the county as California's third-largest agricultural producer by output value.[78] In 2024, the gross value of crop and livestock production reached $4.99 billion, marking a 14.7% increase from $4.35 billion in 2023 and underscoring agriculture's resilience amid fluctuating markets.[79] Vegetable crops, particularly lettuce, broccoli, and celery, dominate output, accounting for $3.45 billion in 2024 value and comprising over two-thirds of total agricultural revenue.[80] Monterey County supplies a substantial share of U.S. lettuce—historically up to 70% during peak seasons—earning the Salinas Valley its moniker as the "Salad Bowl of the World" due to intensive irrigated farming on fertile alluvial soils.[81] Fruit and nut crops, led by strawberries which surpassed $1 billion in value for the first time in 2024, added $1.27 billion, with wine grapes and other berries contributing significantly to diversification.[80][82] The sector's economic multiplier effect amplifies its impact, generating an estimated $11.7 billion in total activity through supply chains, processing, and related services, though it faces pressures from water scarcity, labor shortages, and rising regulatory costs exceeding $1,600 per acre for lettuce compliance as of 2025.[83][84] Despite these challenges, agriculture's foundational role persists, driven by export-oriented production that leverages proximity to ports and advanced irrigation technologies to sustain high yields on roughly 250,000 acres of cropland.[81]Tourism and Hospitality Industry
Tourism represents a vital economic pillar in Monterey County, generating substantial visitor spending that supports local businesses and infrastructure. In 2024, visitors expended $3.1 billion in the county, marking a 5.7% rise from $2.963 billion in 2023 and surpassing pre-pandemic levels observed in 2019.[85][86] This influx stems primarily from the county's coastal allure, including beaches, marine life viewing, and scenic drives, drawing approximately 4.6 million visitors annually in peak pre-2020 years.[87] The hospitality sector, encompassing lodging, dining, and related services, benefits directly from this activity, achieving record employment of 27,596 jobs in 2024.[88] Visitor expenditures supported 26,799 jobs in 2023 alone, while contributing $307 million in state and local taxes that year, underscoring tourism's role in fiscal stability amid agricultural fluctuations.[86] Seasonal peaks, driven by events such as the Pebble Beach Concours d'Elegance during Monterey Car Week, amplify impacts; in August 2025, this event alone generated $50 million in hotel revenue.[89] Prominent attractions fuel sustained interest, with the Monterey Bay Aquarium attracting over 2 million annual visitors through exhibits on local marine ecosystems, bolstering adjacent Cannery Row's retail and dining.[90] Iconic sites like the 17-Mile Drive in Pebble Beach, renowned for golf courses and ocean vistas, and the dramatic Big Sur coastline along Highway 1, draw affluent leisure travelers, while Carmel Valley's wineries support agritourism.[85] These natural and recreational assets, preserved through state parks and private conservancies, account for tourism's outsized economic multiplier effect, where each dollar spent circulates through supply chains.[87] Hospitality infrastructure, including over 10,000 hotel rooms countywide, caters to diverse demographics, from families to high-end golfers, though occupancy varies with weather and economic cycles.[91] Post-2020 recovery has been robust, with 2024 metrics exceeding 2019 baselines in employment and taxes, yet reliance on discretionary travel exposes the sector to external shocks like fuel prices or recessions.[92] Local policies emphasizing sustainable practices aim to mitigate environmental strains from high visitation.[93]Military and Defense Contributions
Monterey County's military presence dates to the establishment of the Presidio of Monterey in 1770 by Spanish colonial forces, which transitioned to U.S. Army control on July 7, 1846, following the American conquest of California, making it one of the oldest continuously operating U.S. military installations.[94] The Presidio has since served as a garrison and training hub, particularly for language instruction through the Defense Language Institute Foreign Language Center (DLIFLC), which relocated there in 1946 and expanded post-World War II to train service members in foreign languages critical for intelligence, diplomacy, and combat operations.[95] DLIFLC's programs have produced linguists supporting U.S. deployments, with adaptations for needs like post-9/11 surges in Arabic and Dari training, contributing to operational effectiveness in asymmetric warfare environments.[96] Fort Ord, activated in 1917 as Camp Gigling during World War I, became a primary infantry training and staging center, expanding significantly in World War II to prepare over 1.5 million troops and serving as a basic training site from 1947 to 1975, including for Vietnam War draftees.[35] Its closure in 1994 under the Base Realignment and Closure Act marked the end of large-scale ground training there, but its legacy includes pioneering integrated units as the first racially desegregated Army post after 1948 and hosting advanced maneuvers that influenced modern infantry tactics.[97] The site's conversion to civilian uses, including California State University Monterey Bay and a national monument, preserved its environmental and historical assets while ending direct military operations.[98] The Naval Postgraduate School (NPS), relocated to Monterey in December 1951 on the former Hotel Del Monte site, provides graduate-level education and research in defense sciences, engineering, and policy to naval officers and interservice personnel, with over 100 years of operation since its founding in 1909.[99] NPS contributes to technological innovation, including cybersecurity, autonomous systems, and undersea warfare modeling, directly supporting U.S. naval superiority through theses and projects applied in real-world deployments.[100] Collectively, these installations have sustained Monterey County's economy, ranking it seventh among California's 58 counties in total military employment and sixth in the percentage of county jobs tied to defense activities as of recent assessments, with activities like DLIFLC and NPS evaluated for resilience during base realignment reviews.[101] This enduring role underscores the county's strategic value in human capital development for national security, from historical troop mobilization to contemporary specialized training amid evolving global threats.[101]Emerging and Support Sectors
Efforts to diversify Monterey County's economy beyond agriculture, tourism, and military bases have emphasized emerging sectors like agricultural technology (AgTech) and advanced air mobility (AAM). In 2025, the Monterey Bay Economic Partnership secured over $45.9 million in state funding through the California Jobs First Initiative to advance AgTech innovation, including $15.1 million for University of California Agriculture and Natural Resources projects focused on AI, robotics, and drones to enhance precision agriculture.[102] This funding also supports workforce development programs, such as drone pilot training and AgTech certificates at institutions like Hartnell College, aiming to create higher-wage jobs in a region where nearly half of private-sector employment remains in agriculture and hospitality.[103][102] The Monterey Bay Tech Hub, a coalition promoting technology-driven growth, targets AAM infrastructure, including clean energy-powered drones and electric vertical takeoff and landing (eVTOL) aircraft.[104] In August 2025, it received a $7.45 million state grant for the California Advanced Air Mobility Corridor Initiative (CAAMCI), establishing the state's first FAA-compliant multi-airport flight corridor network across Monterey, San Benito, and Santa Cruz counties, involving partnerships with UC Santa Cruz and regional airports like Marina and Salinas.[105] This initiative seeks to position the area as a hub for aerospace and defense technologies, fostering job growth in R&D and operations tied to the projected $50 billion global drone industry.[105][102] Support sectors such as education, healthcare, and professional services provide foundational stability and growth potential. The education and health services sector is forecasted to lead job creation through 2024, driven by private education and healthcare expansions amid an aging population and institutional needs.[106] Healthcare employment is projected to expand significantly for the decade, supported by workforce programs addressing shortages in the county's mixed economy of high- and low-wage industries.[107] Professional and business services grew by 1.6% in 2022, adding 250 jobs, with accelerated gains expected at 2.9% annually thereafter, aiding broader economic resilience.[62] These sectors, while not dominant, contribute to diversification by offering higher average wages compared to traditional industries.[103]Government and Administration
County Structure and Officials
Monterey County operates under a charter form of government typical of California counties, with primary authority vested in a five-member Board of Supervisors. Each supervisor represents one of five geographic districts and is elected to a four-year term, with elections staggered such that two or three seats are contested in even-numbered years. The Board holds legislative, executive, and quasi-judicial powers, including adopting ordinances, approving the annual budget exceeding $1.5 billion as of fiscal year 2024-2025, appointing department heads and the County Administrative Officer, and overseeing public services such as health, public works, and social services.[108][109] The Board appoints Sonia M. De La Rosa as County Administrative Officer, who manages daily operations, implements Board policies, and coordinates among 25 departments and agencies employing over 5,000 staff. As of October 2025, the Board members are:| District | Supervisor | Term Expires |
|---|---|---|
| 1 | Luis Alejo | December 2028[109] |
| 2 | Glenn Church | December 2026[109] |
| 3 | Chris Lopez | December 2028[109] |
| 4 | Wendy Root Askew | December 2028[109] |
| 5 | Kate Daniels | December 2026[109] |
Supervisorial Districts
Monterey County is divided into five supervisorial districts, each electing one member to the Board of Supervisors for a four-year staggered term, with elections held in even-numbered years.[114] The districts ensure approximately equal population distribution as mandated by the California Constitution and federal Voting Rights Act, with boundaries last adjusted on December 14, 2021, following the 2020 U.S. Census to account for population shifts, including growth in coastal and inland agricultural areas.[115][116] This redistricting incorporated public input and aimed to maintain contiguity while balancing urban, rural, and coastal interests, resulting in shifts of over 25,000 residents to new districts.[117] The current Board, as of January 2025, includes supervisors sworn into office after the March 2024 primary and November 2024 general elections, where District 1 incumbent Luis Alejo secured a third term unopposed in the primary.[118][119] Chris Lopez serves as 2025 Chair, with Wendy Root Askew as Vice Chair. The districts reflect the county's diversity, spanning densely populated urban zones in Salinas, agricultural expanses in the Salinas Valley, and affluent coastal communities.[114]| District | Supervisor | Primary Areas Covered |
|---|---|---|
| 1 | Luis Alejo | Most of urban Salinas[114] |
| 2 | Glenn Church | Aromas, Boronda, Castroville, Las Lomas, Moss Landing, North Salinas, Pajaro, Prunedale, Royal Oaks[114] |
| 3 | Chris Lopez | East Salinas, Spreckels, Chualar, Greenfield, Gonzales, Fort Hunter Liggett, King City, Soledad, Lake San Antonio, Lockwood, Bradley, San Lucas, San Ardo, Parkfield, Bryson-Hesperia, Mission-Soledad, Arroyo Seco[114] |
| 4 | Wendy Root Askew | Del Rey Oaks, Marina, Sand City, Seaside, Southwest Salinas[114] |
| 5 | Kate Daniels | Carmel, Carmel Valley, Big Sur, Pacific Grove, Pebble Beach, Monterey, Highway 68 corridor, Las Palmas[114] |
State and Federal Representation
Monterey County is represented in the United States Congress by the state's two senators and one representative from California's 19th congressional district. The senators, serving the entire state, are Democrats Alex Padilla, elected in a 2024 special election and serving through January 3, 2025 before beginning a full term, and Adam Schiff, elected in the November 5, 2024 general election for a six-year term beginning January 3, 2025.[121] [122] The 19th congressional district encompasses all of Monterey County along with portions of Santa Clara, Santa Cruz, and San Luis Obispo counties, and is represented by Democrat Jimmy Panetta, who was reelected on November 5, 2024, for a term beginning January 3, 2025.[123] [124] [125] At the state level, Monterey County lies entirely within California's 17th State Senate district, represented by Democrat John Laird since 2024, following his election in a special election on March 5, 2024, to fill a vacancy and subsequent general election victory.[126] [127] The county is divided between two State Assembly districts: the 29th district, covering southern portions including Salinas and represented by Democrat Robert Rivas, Speaker of the Assembly; and the 30th district, covering northern coastal areas and represented by Democrat Dawn Addis.[128] [129] [130] These districts were redrawn following the 2020 census, with Monterey County's population of 439,268 residents distributed accordingly to ensure equal representation.[131]Politics
Voter Registration and Demographics
As of July 1, 2023, Monterey County's population was estimated at 430,264, with a median age of 35.9 years. The racial and ethnic composition includes 62% Hispanic or Latino residents of any race, 30% non-Hispanic White, 7% Asian, 2% Black or African American, and smaller percentages for other groups, reflecting a significant immigrant and farm labor population tied to the county's agricultural economy.[132] This demographic profile features a higher-than-average household size of 3.16 persons and a poverty rate of 14.3%, concentrated among Hispanic communities in rural and agricultural areas. Voter registration in Monterey County stands at 83.4% of eligible adults as of September 6, 2024, with 213,603 total registered voters out of 256,058 eligible.[133] Democratic Party registration dominates at 109,932 (51.5%), followed by No Party Preference at 44,816 (21.0%) and Republican at 44,357 (20.8%), while minor parties and independents account for the remainder.[133]| Party Affiliation | Registered Voters | Percentage |
|---|---|---|
| Democratic | 109,932 | 51.5% |
| Republican | 44,357 | 20.8% |
| No Party Preference | 44,816 | 21.0% |
| American Independent | 7,630 | 3.6% |
| Other Parties/Decline | 6,868 | 3.2% |
Electoral Outcomes and Trends
Monterey County has demonstrated a strong and consistent preference for Democratic candidates in presidential elections since at least 2008, with margins exceeding 40 percentage points in favor of the Democratic nominee. Voter turnout in these elections typically surpasses 75%, reflecting high engagement driven by the county's diverse demographics, including coastal urban voters and inland agricultural communities.[134][135] In the 2016 presidential election, Hillary Clinton received 66.8% of the vote (89,088 votes), while Donald Trump obtained 26.2% (34,895 votes).[136] This pattern intensified in 2020, when Joe Biden secured 72.3% against Donald Trump's 25.1%, a margin of 47.2 percentage points, attributable in part to increased mobilization among independent and younger voters in areas like Monterey and Carmel.[137] Earlier cycles showed similar trends: Barack Obama won 64.5% in 2008 and 67.8% in 2012, indicating a gradual widening of Democratic dominance despite stable Republican support in rural Salinas Valley precincts.[138][139] Voter registration underscores this partisan imbalance, with Democrats comprising a plurality. As of September 6, 2024, of approximately 206,000 registered voters, Democrats accounted for 44.5%, Republicans 23.9%, no party preference 25.5%, and other parties the remainder, trends stable over the past decade amid overall registration growth.[133][140] Turnout disparities exist regionally, with higher participation in coastal areas compared to the Salinas Valley, where socioeconomic factors and farmworker populations contribute to lower engagement.[141] Local elections for the nonpartisan Board of Supervisors reflect moderated partisanship, prioritizing issues like agriculture, housing, and coastal preservation over national divides. Incumbents frequently prevail, as seen in the March 2024 primary for District 5, where Kate Daniels captured 59.7% of the vote to advance without a runoff.[142] Recent cycles (2020–2024) have favored candidates emphasizing practical governance, with board composition leaning toward Democratic-aligned figures, though Republican-leaning challengers occasionally gain traction in inland districts amid concerns over water rights and labor policies.[143] This contrasts with statewide trends, where the county's outcomes align more closely with California's Democratic supermajority but exhibit pockets of conservatism influenced by military and farming interests.[144]Public Safety and Crime
Law Enforcement Agencies
The Monterey County Sheriff's Office (MCSO) functions as the principal law enforcement agency for the county's unincorporated regions, delivering patrol services, crime investigation, and public safety operations.[145] It manages county correctional facilities, provides security for the Superior Court, oversees countywide emergency communications, and processes records, warrants, and civil enforcement actions.[145] The office employs 324 sworn deputies and 165 civilian personnel, operating on an annual budget of $166 million under Sheriff Tina M. Nieto.[145] MCSO is structured into three primary bureaus: Administrative Operations for policy, recruitment, and compliance; Corrections Operations for jail management; and Enforcement Operations for patrol, investigations, and specialized units addressing issues like gun violence and synthetic drugs.[145] Incorporated cities within Monterey County maintain independent municipal police departments responsible for law enforcement within their jurisdictions, often contracting with MCSO for supplemental services in smaller communities.[146] The Salinas Police Department, serving the county's largest city with a population exceeding 160,000, emphasizes community-oriented policing through programs like the Salinas Police Outreach Team (SPOT) for gang intervention and youth education, alongside a Youth Diversion program launched in 2024 to reduce juvenile recidivism.[147] Led by Chief Carlos Acosta, it handles emergency response via 911 and non-emergencies through dedicated lines, with recruitment incentives including $20,000 for new hires and $40,000 for lateral transfers.[147] Other notable municipal agencies include the Monterey Police Department, which oversees public safety in the coastal city of Monterey with a focus on tourism-related enforcement and annual reporting on crime trends; the Seaside Police Department; Marina Police Department; Pacific Grove Police Department; and smaller departments in Carmel-by-the-Sea, Gonzales, Greenfield, King City, and Soledad.[148][149][146] The California Highway Patrol maintains a presence through its Monterey Area office, primarily enforcing traffic laws on state highways like U.S. Route 101 and State Route 1 traversing the county.[149] Inter-agency collaboration occurs via task forces for regional threats, such as narcotics and gang activity prevalent in agricultural and urban zones.[145]Crime Rates and Patterns
Monterey County's violent crime rate stood at 424.6 per 100,000 residents in 2022, slightly below the statewide average of 440.5 and marginally above the national figure of 416.0.[150] This encompasses offenses such as homicide, rape, robbery, and aggravated assault, with data reported through the California Department of Justice's criminal justice statistics. Property crime rates, including burglary, larceny-theft, and motor vehicle theft, have followed statewide patterns of modest decline, though specific county figures for 2023 indicate continued challenges in urban centers. In 2023, the county recorded 8 homicides as of mid-year data, reflecting a stabilization after higher peaks in prior decades.[151] Crime patterns in Monterey County are markedly uneven, with violent incidents concentrated in inland cities like Salinas and Seaside, where socioeconomic pressures in agricultural communities contribute to elevated risks. Salinas, the county's largest city with a population of approximately 160,000, reported 796 violent crimes in recent FBI-derived data, yielding a rate of about 497 per 100,000—substantially higher than more affluent coastal areas such as Monterey or Carmel-by-the-Sea. Gang-related violence, particularly between Norteño and Sureño factions, accounts for a significant share of homicides and assaults, often tied to territorial disputes and youth involvement in these groups.[152][153] Interventions like the California Violence Intervention and Prevention (CalVIP) program have targeted high-risk individuals, contributing to a historic reduction in overall violence over the past decade, including fewer fatal shootings compared to the 26 recorded in Salinas alone in 2013.[154][155] Property crimes, while more dispersed, show patterns linked to tourism and transient populations along the coast, with larceny-theft comprising the majority of incidents. Clearance rates for violent crimes remain below national averages in affected areas, with Salinas's homicide solve rate historically around 24%, hampered by witness reluctance and resource constraints in gang-impacted neighborhoods.[156] Statewide trends of rising aggravated assaults post-2020 have influenced the county, though property offenses decreased by 1.8% in California overall in 2023, suggesting parallel dynamics in Monterey amid improved policing and community programs.Education
Primary and Secondary Schools
Public primary and secondary education in Monterey County is provided by 24 school districts, which operate 126 public schools and 8 charter schools serving approximately 78,000 students.[157] The Monterey County Office of Education oversees coordination, special education, and alternative programs but does not directly manage most instructional services, which are handled by local districts.[158] These districts vary in size and focus, with larger ones concentrated in urban areas like Salinas and coastal communities, reflecting the county's economic divide between affluent tourism zones and agricultural valleys employing many low-wage migrant workers.[159] Prominent districts include Carmel Unified School District, serving about 2,100 students across a 600-square-mile area including Carmel-by-the-Sea and known for high academic standards; Monterey Peninsula Unified School District, with 9,257 students in K-12 programs near the peninsula's military and tourism hubs; Pacific Grove Unified; Pajaro Valley Unified; and Salinas-area districts such as Alisal Union Elementary and Salinas Union High, which educate large numbers of children from farmworking families.[160][161][162] North Monterey County Unified and South Monterey County Joint Union High serve rural inland areas.[163] Charter options include Monterey County Home Charter School and Oasis Charter Public School, emphasizing flexible or specialized curricula.[158] Student demographics feature a high proportion of Hispanic or Latino enrollment, often exceeding 80% in valley districts, alongside elevated rates of English learners at 33.8% county-wide and socioeconomic disadvantage, with many qualifying for free or reduced-price meals due to parental employment in seasonal agriculture.[164][157] Approximately 22 private schools operate in the county, providing alternatives but enrolling a smaller share of students overall.[157] Academic performance shows significant variation, with coastal districts like Carmel Unified ranking among California's top performers on metrics such as test proficiency and college readiness, while inland districts lag, reflecting demographic and funding pressures from high English learner needs and poverty.[162] The county's four-year high school graduation rate stands at 88.7% as of recent data, exceeding the state average of 86.4%.[165] State assessments via the California School Dashboard highlight disparities, with lower proficiency in English language arts and mathematics in districts serving transient agricultural populations compared to more stable, higher-income areas.[166]Higher Education Institutions
California State University, Monterey Bay (CSUMB), located in Seaside, is a public university established in 1994 on the former Fort Ord military base, with classes commencing on August 28, 1995.[167] It enrolls approximately 7,102 students and offers bachelor's and master's degrees in fields such as marine science, business administration, and social work, emphasizing experiential learning tied to the coastal environment.[168] Monterey Peninsula College (MPC), a public community college in Monterey founded in 1947, maintains an open admissions policy and serves over 7,000 students through associate degrees, certificates, and transfer programs in areas including nursing, computer science, and environmental horticulture.[169][170] The institution operates campuses in Monterey, Marina, and Seaside, focusing on workforce preparation and university transfer pathways.[171] Hartnell College, headquartered in Salinas since its founding as Salinas Junior College in 1920, is a public community college with additional sites in King City and Soledad, enrolling about 8,673 students.[172][173] It specializes in agriculture-related programs, STEM, and general education tailored to the Salinas Valley's economy, including partnerships with local agribusiness for hands-on training.[174] The Naval Postgraduate School (NPS), a graduate-level institution in Monterey established in 1909 under the U.S. Department of the Navy, provides master's and doctoral degrees exclusively to military officers, Department of Defense civilians, and select international partners in disciplines like engineering, national security, and applied sciences.[100] Enrollment stands at roughly 2,737 graduate students, with curricula integrating classified research and defense-focused interdisciplinary studies.[175] The Middlebury Institute of International Studies at Monterey, a graduate school affiliated with Middlebury College, offers professional master's degrees in international policy, nonproliferation, and language teaching, drawing on Monterey's linguistic resources; it enrolls around 500 students but announced plans for closure by summer 2027 amid persistent deficits and post-pandemic enrollment declines.[176][177][178] Monterey College of Law, a California-accredited institution with a campus in Monterey, delivers Juris Doctor programs through hybrid and in-person formats, emphasizing practical legal training for diverse applicants including non-traditional students.[179]Housing and Development
Residential Market Dynamics
The residential real estate market in Monterey County features persistently high median home prices, driven by limited supply and strong demand from affluent buyers seeking coastal lifestyles. In September 2025, the median sales price for single-family homes reached $1,019,500, reflecting a 7% year-over-year increase, though broader metrics including condos showed variability with Redfin reporting a median of $875,000, down 8.4% from the prior year.[180][181] Listing prices trended upward, with a median of $1.2 million in August 2025, up 1.4% annually.[182] Inventory remains constrained, contributing to competitive conditions where homes typically sell after 28 days on market in September 2025, faster than the 48 days recorded the previous year.[181] Active listings stood at 591 in August 2025, a modest increase from 510 in May, but overall supply lags behind demand, with sales volume down to 164 homes in September from higher prior-year levels.[183][181] This scarcity stems from geographic limitations—much land is preserved for agriculture or protected coastlines—and regulatory hurdles, including stringent California Coastal Commission oversight that restricts development in scenic areas like Big Sur and Pebble Beach.[184] Demand is bolstered by the county's economic anchors, including tourism, agriculture, and proximity to Silicon Valley, attracting high-income commuters and retirees, though local wages in farming and service sectors exacerbate affordability gaps.[185] Military presence, such as at the Naval Postgraduate School in Monterey, adds stable buyer interest from defense personnel.[186] Market resilience persisted into 2025 despite national interest rate pressures, with quarterly sales up 14.6% in early 2024 comparisons, though luxury segments near Carmel and Pacific Grove saw slower activity due to elevated prices exceeding $2 million for ocean-view properties.[187][188]Affordability Challenges and Policies
Monterey County's housing affordability is strained by elevated costs relative to local incomes, with median property values at $723,100 in 2023, more than double the national average of $303,400.[61] Median household income was $94,500 from 2019 to 2023, yielding a payment-to-income ratio that burdens many residents, particularly in coastal and agricultural zones where demand from tourism, military personnel, and high-wage sectors outstrips supply.[189] Approximately 30.6% of households face severe housing problems, including cost burdens exceeding 30% of income and overcrowding in 14% of family units.[190] Rental pressures exacerbate the crisis, as 14,038 low-income renters lacked affordable options in recent analyses, with 73% of extremely low-income households spending over 50% of earnings on rent.[191] A two-bedroom apartment averaged $2,093 monthly, requiring renters to earn $40.25 per hour—far above the county's typical wages in agriculture and service industries—to avoid burden without subsidies.[191] Median gross rent reached $1,658 as of 2019 Census data, but inflation and shortages have driven increases, forcing workforce displacement to inland areas or reliance on extended family housing.[192] Supply constraints, rooted in decades of restrictive zoning, environmental regulations, and limited developable land amid coastal protections, perpetuate shortages despite population stability around 430,000.[193] [194] High demand from affluent buyers and second-home investors further inflates prices, sidelining moderate-income workers like educators and farm laborers essential to the local economy.[193] The county's Inclusionary Housing Program mandates that developers in qualifying projects reserve units for very low-, low-, and moderate-income households, promoting mixed-income developments to integrate affordable options.[195] The Housing Authority of Monterey County oversees Section 8 Housing Choice Vouchers, managing waitlists and properties to serve eligible residents, with recent expansions targeting family and senior needs.[196] The 2023-2031 Housing Element commits to addressing needs through zoning reforms, density bonuses, and partnerships for 5,000+ affordable units, including preservation of at-risk rentals and incentives for workforce housing near employment hubs.[193] Community Development Block Grants fund rehabilitation and new construction, as in United Way initiatives for infill projects.[197] However, funding shortfalls and regulatory hurdles delay progress, exemplified by a 2025 Monterey project stalled despite planning 41 units for households at or below 60% of area median income.[198] State mandates under SB 9 and ADU laws aim to boost supply, but local implementation varies, with critics noting insufficient deregulation to match demand.[199]Transportation
Road and Highway Infrastructure
Monterey County's road and highway infrastructure centers on U.S. Route 101 and California State Route 1 as primary arterials, with State Route 68 serving as a key east-west connector. U.S. 101 functions as the main north-south corridor through the county's inland valleys, facilitating commuter, freight, and agricultural transport from the San Benito County line northward through Prunedale and Salinas toward Carmel.[200] The route includes an eight-mile expressway segment south of Salinas to Chualar featuring 11 at-grade intersections and two signalized railroad crossings, which pose safety risks addressed by ongoing corridor improvement projects aimed at enhancing traffic flow and reducing collision hazards, with phased construction slated to begin in 2031.[201][202] Additional efforts include drainage upgrades along Monterey-area sections, involving replacement of 34 culverts and installation of new structures to mitigate flooding vulnerabilities.[203] California State Route 1 parallels the Pacific coastline, providing access to the Monterey Peninsula, Carmel, and Big Sur while designated as a National Scenic Byway for its dramatic vistas. The highway experiences frequent disruptions from landslides and erosion, notably at sites like Regent's Slide south of Big Sur, where full reopening to through traffic is projected for March 2026 following stabilization work initiated after a 2023 collapse.[204] Resiliency projects in the Elkhorn Slough corridor and drainage improvements between Moss Landing and Monterey address coastal hazards, including periodic lane closures for culvert repairs and bridge maintenance, such as at Rocky Creek Bridge.[205][206] These interventions reflect the route's exposure to seismic and climatic stresses, with Caltrans implementing overnight closures and phased reopenings to balance safety and accessibility.[207] State Route 68 links Salinas to Monterey and Pacific Grove over approximately 20 miles, acting as a scenic gateway through Steinbeck Country with enhancements focused on corridor preservation and traffic management.[208] County-maintained roads, numbering over 1,000 miles under Public Works oversight, support rural and unincorporated areas but face chronic underfunding and deterioration from storms, with Monterey County identified as having the state's highest local road repair backlog estimated in the hundreds of millions as of 2018.[209] Funding from Measure X, approved in 2022, allocates $360 million regionally for pothole repairs and resurfacing, prioritizing high-traffic routes like Carmel Valley Road.[210] Bridge replacements, such as at Chualar Canyon and Davis Road, underscore efforts to upgrade aging structures vulnerable to seismic events and flooding.[211] Overall, the network contends with high traffic volumes—exacerbated by tourism and agriculture—and climate-induced vulnerabilities, prompting regional assessments for adaptive infrastructure planning.[212]Public Transit Systems
Monterey-Salinas Transit (MST) operates as the primary public bus system serving Monterey County, providing fixed-route services across the greater Monterey and Salinas areas, with extensions into parts of San Benito, San Luis Obispo, Santa Clara, and Santa Cruz counties.[213] The system includes 37 routes covering approximately 482 miles, with 915 stops and a focus on connecting urban centers like Salinas, Monterey, and Carmel with suburban and rural destinations such as King City and Paso Robles.[214] MST's fixed-route ridership reached 2,887,300 passengers in 2024, averaging about 9,400 weekday boardings in the second quarter of 2025, reflecting a rebound exceeding pre-COVID levels in Salinas following network improvements implemented in December 2022.[215] MST also offers RIDES, a paratransit service for individuals with disabilities unable to use fixed routes, complementing the main network with demand-response operations.[216] The Transportation Agency for Monterey County (TAMC) oversees funding and planning for MST, ensuring alignment with regional transportation needs amid a service area population of around 352,000 residents.[217] Farebox recovery stands at approximately 30%, supported by local taxes and state grants, with connections to adjacent systems like Santa Cruz METRO and Santa Clara Valley Transportation Authority (VTA) honoring select MST fares.[218] Local circulator routes, such as Line 34 in King City, provide intra-community service within southern county areas.[219] Rail options are limited, with no active commuter or intercity passenger rail within Monterey County; however, Amtrak Thruway buses connect from the Salinas Amtrak station—serving Coast Starlight and Capitol Corridor trains—to Monterey destinations including the Transit Plaza, Monterey Bay Aquarium, and hotels along the coast.[220] This service facilitates regional travel without direct track access in the county, where the Monterey Branch Line remains a freight corridor with no current passenger operations.[221] Greyhound intercity buses offer additional links from Salinas, though ridership data specific to Monterey County stops is not separately tracked.[222] Overall, public transit usage remains modest relative to the county's reliance on personal vehicles, constrained by rural geography and limited high-frequency service outside core corridors.[223]Airports and Maritime Facilities
Monterey Regional Airport (MRY), located three miles southeast of downtown Monterey, serves as the county's primary commercial aviation hub, accommodating over 600,000 passengers annually as of recent records.[224] The airport features two runways, with the longest measuring 7,175 feet, and supports nonstop flights to destinations including Denver, Los Angeles, Phoenix, Portland, San Diego, San Francisco, and Seattle via airlines such as Alaska, Allegiant, American, United, and Sun Country, alongside semi-private service from JSX.[225] Passenger traffic has surged 31% since 2019, outpacing declines at nearby San Jose and San Francisco airports, driven by tourism to coastal attractions.[226] Smaller general aviation facilities include Salinas Municipal Airport, which handles limited commercial charters and private flights, Marina Municipal Airport for local operations, and Mesa del Rey Airport near Greenfield for agricultural and recreational use.[227] Military aviation is supported by Roberts Army Heliport at Fort Ord, primarily for training and logistics.[227] Maritime facilities in Monterey County emphasize commercial fishing, recreation, and research rather than large-scale cargo handling, with Moss Landing Harbor District operating the region's leading commercial fishing port.[228] Moss Landing provides over 600 slips for a mix of vessels, including approximately 350 fishing boats, 200 recreational craft, and 30 research ships, alongside amenities such as a fuel dock, boatyard, four-lane launch ramp, public wharf, and fish processing facilities.[229] It supports Monterey Bay's fishing industry, which unloads daily catches of squid, salmon, and Dungeness crab, while also hosting tour charters and scientific expeditions tied to nearby marine labs.[230] Monterey Harbor, managed by the City of Monterey, offers recreational berthing at Breakwater Cove Marina with full-service repairs, fuel, and dive operations, complemented by Fisherman's Wharf facilities including four wholesale fish buyers, a commercial abalone farm, and boat hoists.[231] The harbor facilitates whale-watching tours, kayaking, and small commercial fishing, with public access via restrooms, showers, and restaurants, though it lacks deep-water capabilities for ocean-going freighters.[232] The county hosts 23 total boating facilities, including launches and dry storage in areas like Carmel and Seaside, regulated under the Monterey Bay National Marine Sanctuary to balance usage with environmental protection.[233]Communities
Incorporated Cities
Monterey County encompasses twelve incorporated cities that function as key population centers, economic drivers, and administrative hubs within the region. These municipalities handle local governance, including zoning, public services, and development, distinct from the unincorporated areas governed directly by the county. The cities collectively house a significant portion of the county's residents, with diverse economies rooted in agriculture, tourism, military legacy, and small-scale commerce.[234] Salinas, the county seat and largest city, anchors the northern Salinas Valley with its emphasis on industrial agriculture, particularly lettuce and other row crops, supporting processing facilities and distribution networks. Incorporated in 1874, it processes much of the nation's fresh produce and hosts administrative offices for Monterey County government.[235] Seaside, adjacent to the north, developed around the former Fort Ord military base, now repurposed for California State University, Monterey Bay, and features residential neighborhoods with proximity to Monterey Bay beaches. Marina, to the south of Monterey, includes expansive sand dunes managed for recreation and conservation, alongside housing developments tied to the base's economic transition.[236] Coastal cities like Monterey, Pacific Grove, Carmel-by-the-Sea, and Sand City form the Monterey Peninsula cluster, drawing visitors for natural attractions, historic sites, and marine activities. Monterey, incorporated in 1850 as one of California's earliest municipalities, preserves landmarks from its Spanish and Mexican eras, including the Custom House and Colton Hall, while hosting the Monterey Bay Aquarium and serving as a tourism gateway. Pacific Grove, known for its Victorian architecture and monarch butterfly sanctuary, maintains strict preservation ordinances to protect its residential character. Carmel-by-the-Sea, a small artistic enclave incorporated in 1916, prohibits chain stores and emphasizes single-story cottages, fostering a bohemian vibe centered on galleries and beaches. Sand City and Del Rey Oaks, both small and incorporated in the mid-20th century (1954 and 1958, respectively), provide suburban support with light industry and residential growth near the peninsula's core.[237][238] In the southern and eastern valleys, agricultural cities predominate: Gonzales (incorporated 1947), Soledad (1926), Greenfield (1952), and King City (1913). These communities rely on farming of strawberries, wine grapes, and vegetables, with proximity to state prisons in Soledad and processing infrastructure in others contributing to employment. They face challenges from water scarcity and labor-intensive operations but sustain the county's role as a national produce supplier.[239][240]Census-Designated Places
Monterey County encompasses multiple census-designated places (CDPs), which the U.S. Census Bureau delineates as statistical entities comprising closely settled, unincorporated populations lacking municipal incorporation but exhibiting urban characteristics for data collection purposes. These CDPs vary in size, with larger ones serving as significant residential and economic hubs in rural or semi-rural settings, often tied to agriculture, tourism, or proximity to coastal or valley resources. The 2020 Decennial Census captured the following populations for key CDPs, reflecting demographic concentrations outside incorporated cities:| CDP | 2020 Population |
|---|---|
| Prunedale | 18,885 |
| Castroville | 7,515 |
| Carmel Valley Village | 4,524 |
| Del Monte Forest | 4,206 |
| Elkhorn | 1,647 |
| Chualar | 1,554 |
| Pine Canyon | 1,850 |
| Boronda | 1,419 |
| Moss Landing | 1,016 |
| Aromas | 2,468 (shared boundary with Santa Cruz County) |