
Community hub
Recent from talks
Contribute something
Nothing was collected or created yet.
P-value
View on WikipediaIn null-hypothesis significance testing, the p-value[note 1] is the probability of obtaining test results at least as extreme as the result actually observed, under the assumption that the null hypothesis is correct.[2][3] A very small p-value means that such an extreme observed outcome would be very unlikely under the null hypothesis. Even though reporting p-values of statistical tests is common practice in academic publications of many quantitative fields, misinterpretation and misuse of p-values is widespread and has been a major topic in mathematics and metascience.[4][5]
In 2016, the American Statistical Association (ASA) made a formal statement that "p-values do not measure the probability that the studied hypothesis is true, or the probability that the data were produced by random chance alone" and that "a p-value, or statistical significance, does not measure the size of an effect or the importance of a result" or "evidence regarding a model or hypothesis".[6] That said, a 2019 task force by ASA has issued a statement on statistical significance and replicability, concluding with: "p-values and significance tests, when properly applied and interpreted, increase the rigor of the conclusions drawn from data".[7]
Basic concepts
[edit]In statistics, every conjecture concerning the unknown probability distribution of a collection of random variables representing the observed data in some study is called a statistical hypothesis. If we state one hypothesis only and the aim of the statistical test is to see whether this hypothesis is tenable, but not to investigate other specific hypotheses, then such a test is called a null hypothesis test.

As our statistical hypothesis will, by definition, state some property of the distribution, the null hypothesis is the default hypothesis under which that property does not exist. The null hypothesis is typically that some parameter (such as a correlation or a difference between means) in the populations of interest is zero. Our hypothesis might specify the probability distribution of precisely, or it might only specify that it belongs to some class of distributions. Often, we reduce the data to a single numerical statistic, e.g., , whose marginal probability distribution is closely connected to a main question of interest in the study.

The p-value is used in the context of null hypothesis testing in order to quantify the statistical significance of a result, the result being the observed value of the chosen statistic .[note 2] The lower the p-value is, the lower the probability of getting that result if the null hypothesis were true. A result is said to be statistically significant if it allows us to reject the null hypothesis. All other things being equal, smaller p-values are taken as stronger evidence against the null hypothesis.
Loosely speaking, rejection of the null hypothesis implies that there is sufficient evidence against it.
As a particular example, if a null hypothesis states that a certain summary statistic follows the standard normal distribution then the rejection of this null hypothesis could mean that (i) the mean of is not 0, or (ii) the variance of is not 1, or (iii) is not normally distributed. Different tests of the same null hypothesis would be more or less sensitive to different alternatives. However, even if we do manage to reject the null hypothesis for all 3 alternatives, and even if we know that the distribution is normal and variance is 1, the null hypothesis test does not tell us which non-zero values of the mean are now most plausible. The more independent observations from the same probability distribution one has, the more accurate the test will be, and the higher the precision with which one will be able to determine the mean value and show that it is not equal to zero; but this will also increase the importance of evaluating the real-world or scientific relevance of this deviation.

Definition and interpretation
[edit]Definition
[edit]The p-value is the probability under the null hypothesis of obtaining a real-valued test statistic at least as extreme as the one obtained. Consider an observed test-statistic from unknown distribution . Then the p-value is what the prior probability would be of observing a test-statistic value at least as "extreme" as if null hypothesis were true. That is:


- for a one-sided right-tail test-statistic distribution.
- for a one-sided left-tail test-statistic distribution.
- for a two-sided test-statistic distribution. If the distribution of is symmetric about zero, then


Interpretations
[edit]The error that a practising statistician would consider the more important to avoid (which is a subjective judgment) is called the error of the first kind. The first demand of the mathematical theory is to deduce such test criteria as would ensure that the probability of committing an error of the first kind would equal (or approximately equal, or not exceed) a preassigned number α, such as α = 0.05 or 0.01, etc. This number is called the level of significance.
— Jerzy Neyman, "The Emergence of Mathematical Statistics"[8]
In a significance test, the null hypothesis is rejected if the p-value is less than or equal to a predefined threshold value , which is referred to as the alpha level or significance level. is not derived from the data, but rather is set by the researcher before examining the data. is commonly set to 0.05, though lower alpha levels are sometimes used. The 0.05 value (equivalent to 1/20 chances) was originally proposed by Ronald Fisher in 1925 in his famous book entitled "Statistical Methods for Research Workers".[9]

Different p-values based on independent sets of data can be combined, for instance using Fisher's combined probability test.
Distribution
[edit]The p-value is a function of the chosen test statistic and is therefore a random variable. If the null hypothesis fixes the probability distribution of precisely (e.g. where is the only parameter), and if that distribution is continuous, then when the null-hypothesis is true, the p-value is uniformly distributed between 0 and 1. Regardless of the truth of the , the p-value is not fixed; if the same test is repeated independently with fresh data, one will typically obtain a different p-value in each iteration.


Usually only a single p-value relating to a hypothesis is observed, so the p-value is interpreted by a significance test, and no effort is made to estimate the distribution it was drawn from. When a collection of p-values are available (e.g. when considering a group of studies on the same subject), the distribution of significant p-values is sometimes called a p-curve.[10] A p-curve can be used to assess the reliability of scientific literature, such as by detecting publication bias or p-hacking. [10][11]
Distribution for composite hypothesis
[edit]In parametric hypothesis testing problems, a simple or point hypothesis refers to a hypothesis where the parameter's value is assumed to be a single number. In contrast, in a composite hypothesis the parameter's value is given by a set of numbers. When the null-hypothesis is composite (or the distribution of the statistic is discrete), then when the null-hypothesis is true the probability of obtaining a p-value less than or equal to any number between 0 and 1 is still less than or equal to that number. In other words, it remains the case that very small values are relatively unlikely if the null-hypothesis is true, and that a significance test at level is obtained by rejecting the null-hypothesis if the p-value is less than or equal to .[12][13]
For example, when testing the null hypothesis that a distribution is normal with a mean less than or equal to zero against the alternative that the mean is greater than zero (, variance known), the null hypothesis does not specify the exact probability distribution of the appropriate test statistic. In this example that would be the Z-statistic belonging to the one-sided one-sample Z-test. For each possible value of the theoretical mean, the Z-test statistic has a different probability distribution. In these circumstances the p-value is defined by taking the least favorable null-hypothesis case, which is typically on the border between null and alternative. This definition ensures the complementarity of p-values and alpha-levels: means one only rejects the null hypothesis if the p-value is less than or equal to , and the hypothesis test will indeed have a maximum type-1 error rate of .


Usage
[edit]The p-value is widely used in statistical hypothesis testing, specifically in null hypothesis significance testing. In this method, before conducting the study, one first chooses a model (the null hypothesis) and the alpha level α (most commonly 0.05). After analyzing the data, if the p-value is less than α, that is taken to mean that the observed data is sufficiently inconsistent with the null hypothesis for the null hypothesis to be rejected. However, that does not prove that the null hypothesis is false. The p-value does not, in itself, establish probabilities of hypotheses. Rather, it is a tool for deciding whether to reject the null hypothesis.[14]
Misuse
[edit]According to the ASA, there is widespread agreement that p-values are often misused and misinterpreted.[3] One practice that has been particularly criticized is accepting the alternative hypothesis for any p-value nominally less than 0.05 without other supporting evidence. Although p-values are helpful in assessing how incompatible the data are with a specified statistical model, contextual factors must also be considered, such as "the design of a study, the quality of the measurements, the external evidence for the phenomenon under study, and the validity of assumptions that underlie the data analysis".[3] Another concern is that the p-value is often misunderstood as being the probability that the null hypothesis is true.[3][15] p-values and significance tests also say nothing about the possibility of drawing conclusions from a sample to a population.
Some statisticians have proposed abandoning p-values and focusing more on other inferential statistics,[3] such as confidence intervals,[16][17] likelihood ratios,[18][19] or Bayes factors,[20][21][22] but there is heated debate on the feasibility of these alternatives.[23][24] Others have suggested to remove fixed significance thresholds and to interpret p-values as continuous indices of the strength of evidence against the null hypothesis.[25][26] Yet others suggested to report alongside p-values the prior probability of a real effect that would be required to obtain a false positive risk (i.e. the probability that there is no real effect) below a pre-specified threshold (e.g. 5%).[27]
That said, in 2019 a task force by ASA had convened to consider the use of statistical methods in scientific studies, specifically hypothesis tests and p-values, and their connection to replicability.[7] It states that "Different measures of uncertainty can complement one another; no single measure serves all purposes", citing p-value as one of these measures. They also stress that p-values can provide valuable information when considering the specific value as well as when compared to some threshold. In general, it stresses that "p-values and significance tests, when properly applied and interpreted, increase the rigor of the conclusions drawn from data".
Calculation
[edit]Usually, is a test statistic. A test statistic is the output of a scalar function of all the observations. This statistic provides a single number, such as a t-statistic or an F-statistic. As such, the test statistic follows a distribution determined by the function used to define that test statistic and the distribution of the input observational data.
For the important case in which the data are hypothesized to be a random sample from a normal distribution, depending on the nature of the test statistic and the hypotheses of interest about its distribution, different null hypothesis tests have been developed. Some such tests are the z-test for hypotheses concerning the mean of a normal distribution with known variance, the t-test based on Student's t-distribution of a suitable statistic for hypotheses concerning the mean of a normal distribution when the variance is unknown, the F-test based on the F-distribution of yet another statistic for hypotheses concerning the variance. For data of other nature, for instance, categorical (discrete) data, test statistics might be constructed whose null hypothesis distribution is based on normal approximations to appropriate statistics obtained by invoking the central limit theorem for large samples, as in the case of Pearson's chi-squared test.
Thus computing a p-value requires a null hypothesis, a test statistic (together with deciding whether the researcher is performing a one-tailed test or a two-tailed test), and data. Even though computing the test statistic on given data may be easy, computing the sampling distribution under the null hypothesis, and then computing its cumulative distribution function (CDF) is often a difficult problem. Today, this computation is done using statistical software, often via numeric methods (rather than exact formulae), but, in the early and mid 20th century, this was instead done via tables of values, and one interpolated or extrapolated p-values from these discrete values[citation needed]. Rather than using a table of p-values, Fisher instead inverted the CDF, publishing a list of values of the test statistic for given fixed p-values; this corresponds to computing the quantile function (inverse CDF).
Example
[edit]Testing the fairness of a coin
[edit]As an example of a statistical test, an experiment is performed to determine whether a coin flip is fair (equal chance of landing heads or tails) or unfairly biased (one outcome being more likely than the other).
Suppose that the experimental results show the coin turning up heads 14 times out of 20 total flips. The full data would be a sequence of twenty times the symbol "H" or "T". The statistic on which one might focus could be the total number of heads. The null hypothesis is that the coin is fair, and coin tosses are independent of one another. If a right-tailed test is considered, which would be the case if one is actually interested in the possibility that the coin is biased towards falling heads, then the p-value of this result is the chance of a fair coin landing on heads at least 14 times out of 20 flips. That probability can be computed from binomial coefficients as
![{\displaystyle {\begin{aligned}&\Pr(14{\text{ heads}})+\Pr(15{\text{ heads}})+\cdots +\Pr(20{\text{ heads}})\\&={\frac {1}{2^{20}}}\left[{\binom {20}{14}}+{\binom {20}{15}}+\cdots +{\binom {20}{20}}\right]={\frac {60\,460}{1\,048\,576}}\approx 0.058.\end{aligned}}}](https://wikimedia.org/api/rest_v1/media/math/render/svg/1f2eebd3ba4473859aaacc3235a3929b3bf3b2bb)
This probability is the p-value, considering only extreme results that favor heads. This is called a one-tailed test. However, one might be interested in deviations in either direction, favoring either heads or tails. The two-tailed p-value, which considers deviations favoring either heads or tails, may instead be calculated. As the binomial distribution is symmetrical for a fair coin, the two-sided p-value is simply twice the above calculated single-sided p-value: the two-sided p-value is 0.115.
In the above example:
- Null hypothesis (H0): The coin is fair, with Pr(heads) = 0.5.
- Test statistic: Number of heads.
- Alpha level (designated threshold of significance): 0.05.
- Observation O: 14 heads out of 20 flips.
- Two-tailed p-value of observation O given H0 = 2 × min(Pr(no. of heads ≥ 14 heads), Pr(no. of heads ≤ 14 heads)) = 2 × min(0.058, 0.978) = 2 × 0.058 = 0.115.
The Pr(no. of heads ≤ 14 heads) = 1 − Pr(no. of heads ≥ 14 heads) + Pr(no. of head = 14) = 1 − 0.058 + 0.036 = 0.978; however, the symmetry of this binomial distribution makes it an unnecessary computation to find the smaller of the two probabilities. Here, the calculated p-value exceeds 0.05, meaning that the data falls within the range of what would happen 95% of the time, if the coin were fair. Hence, the null hypothesis is not rejected at the 0.05 level.
However, had one more head been obtained, the resulting p-value (two-tailed) would have been 0.0414 (4.14%), in which case the null hypothesis would be rejected at the 0.05 level.
Optional stopping
[edit]
The difference between the two meanings of "extreme" appear when we consider a sequential hypothesis testing, or optional stopping, for the fairness of the coin. In general, optional stopping changes how p-value is calculated.[28][29] Suppose we design the experiment as follows:
- Flip the coin twice. If both comes up heads or tails, end the experiment.
- Else, flip the coin 4 more times.
This experiment has 7 types of outcomes: 2 heads, 2 tails, 5 heads 1 tail, ..., 1 head 5 tails. We now calculate the p-value of the "3 heads 3 tails" outcome.
If we use the test statistic #, then under the null hypothesis (i.e. #) the two-sided p-value is exactly equal to 1, and both the one-sided left-tail p-value and the one-sided right-tail p-value are exactly equal to .


If we consider every outcome that has equal or lower probability than "3 heads 3 tails" as "at least as extreme", then the p-value is exactly

However, suppose we have planned to simply flip the coin 6 times no matter what happens, then the second definition of p-value would mean that the p-value of "3 heads 3 tails" is exactly 1.
Thus, the "at least as extreme" definition of p-value is deeply contextual and depends on what the experimenter planned to do even in situations that did not occur.
History
[edit]
.jpg)


P-value computations date back to the 1700s, where they were computed for the human sex ratio at birth, and used to compute statistical significance compared to the null hypothesis of equal probability of male and female births.[30] John Arbuthnot studied this question in 1710,[31][32][33][34] and examined birth records in London for each of the 82 years from 1629 to 1710. In every year, the number of males born in London exceeded the number of females. Considering more male or more female births as equally likely, the probability of the observed outcome is 1/282, or about 1 in 4,836,000,000,000,000,000,000,000; in modern terms, the p-value. This is vanishingly small, leading Arbuthnot to conclude that this was not due to chance, but to divine providence: "From whence it follows, that it is Art, not Chance, that governs." In modern terms, he rejected the null hypothesis of equally likely male and female births at the p = 1/282 significance level. This and other work by Arbuthnot is credited as "… the first use of significance tests …"[35] the first example of reasoning about statistical significance,[36] and "… perhaps the first published report of a nonparametric test …",[32] specifically the sign test; see details at Sign test § History.
The same question was later addressed by Pierre-Simon Laplace, who instead used a parametric test, modeling the number of male births with a binomial distribution:[37]
In the 1770s Laplace considered the statistics of almost half a million births. The statistics showed an excess of boys compared to girls. He concluded by calculation of a p-value that the excess was a real, but unexplained, effect.
The p-value was first formally introduced by Karl Pearson, in his Pearson's chi-squared test,[38] using the chi-squared distribution and notated as capital P.[38] The p-values for the chi-squared distribution (for various values of χ2 and degrees of freedom), now notated as P, were calculated in (Elderton 1902), collected in (Pearson 1914, pp. xxxi–xxxiii, 26–28, Table XII).
Ronald Fisher formalized and popularized the use of the p-value in statistics,[39][40] with it playing a central role in his approach to the subject.[41] In his highly influential book Statistical Methods for Research Workers (1925), Fisher proposed the level p = 0.05, or a 1 in 20 chance of being exceeded by chance, as a limit for statistical significance, and applied this to a normal distribution (as a two-tailed test), thus yielding the rule of two standard deviations (on a normal distribution) for statistical significance (see 68–95–99.7 rule).[42][note 3][43]
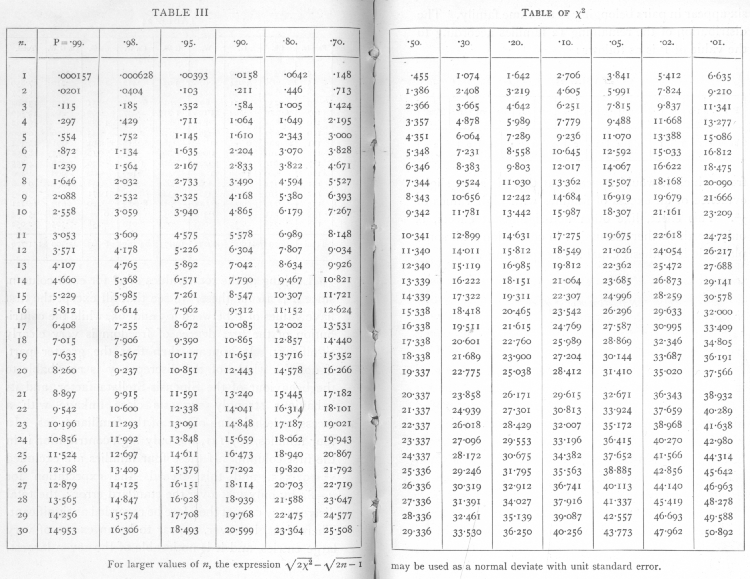
He then computed a table of values, similar to Elderton but, importantly, reversed the roles of χ2 and p. That is, rather than computing p for different values of χ2 (and degrees of freedom n), he computed values of χ2 that yield specified p-values, specifically 0.99, 0.98, 0.95, 0,90, 0.80, 0.70, 0.50, 0.30, 0.20, 0.10, 0.05, 0.02, and 0.01.[44] That allowed computed values of χ2 to be compared against cutoffs and encouraged the use of p-values (especially 0.05, 0.02, and 0.01) as cutoffs, instead of computing and reporting p-values themselves. The same type of tables were then compiled in (Fisher & Yates 1938), which cemented the approach.[43]
As an illustration of the application of p-values to the design and interpretation of experiments, in his following book The Design of Experiments (1935), Fisher presented the lady tasting tea experiment,[45] which is the archetypal example of the p-value.
To evaluate a lady's claim that she (Muriel Bristol) could distinguish by taste how tea is prepared (first adding the milk to the cup, then the tea, or first tea, then milk), she was sequentially presented with 8 cups: 4 prepared one way, 4 prepared the other, and asked to determine the preparation of each cup (knowing that there were 4 of each). In that case, the null hypothesis was that she had no special ability, the test was Fisher's exact test, and the p-value was so Fisher was willing to reject the null hypothesis (consider the outcome highly unlikely to be due to chance) if all were classified correctly. (In the actual experiment, Bristol correctly classified all 8 cups.)

Fisher reiterated the p = 0.05 threshold and explained its rationale, stating:[46]
It is usual and convenient for experimenters to take 5 per cent as a standard level of significance, in the sense that they are prepared to ignore all results which fail to reach this standard, and, by this means, to eliminate from further discussion the greater part of the fluctuations which chance causes have introduced into their experimental results.
He also applies this threshold to the design of experiments, noting that had only 6 cups been presented (3 of each), a perfect classification would have only yielded a p-value of which would not have met this level of significance.[46] Fisher also underlined the interpretation of p, as the long-run proportion of values at least as extreme as the data, assuming the null hypothesis is true.

In later editions, Fisher explicitly contrasted the use of the p-value for statistical inference in science with the Neyman–Pearson method, which he terms "Acceptance Procedures".[47] Fisher emphasizes that while fixed levels such as 5%, 2%, and 1% are convenient, the exact p-value can be used, and the strength of evidence can and will be revised with further experimentation. In contrast, decision procedures require a clear-cut decision, yielding an irreversible action, and the procedure is based on costs of error, which, he argues, are inapplicable to scientific research.
Related indices
[edit]The E-value can refer to two concepts, both of which are related to the p-value and both of which play a role in multiple testing. First, it corresponds to a generic, more robust alternative to the p-value that can deal with optional continuation of experiments. Second, it is also used to abbreviate "expect value", which is the expected number of times that one expects to obtain a test statistic at least as extreme as the one that was actually observed if one assumes that the null hypothesis is true.[48] This expect-value is the product of the number of tests and the p-value.
The q-value is the analog of the p-value with respect to the positive false discovery rate.[49] It is used in multiple hypothesis testing to maintain statistical power while minimizing the false positive rate.[50]
The Probability of Direction (pd) is the Bayesian numerical equivalent of the p-value.[51] It corresponds to the proportion of the posterior distribution that is of the median's sign, typically varying between 50% and 100%, and representing the certainty with which an effect is positive or negative.
Second-generation p-values extend the concept of p-values by not considering extremely small, practically irrelevant effect sizes as significant.[52]
See also
[edit]Notes
[edit]- ^ Italicisation, capitalisation and hyphenation of the term vary. For example, AMA style uses "P value", APA style uses "p value", and the American Statistical Association uses "p-value". In all cases, the "p" stands for probability.[1]
- ^ The statistical significance of a result does not imply that the result also has real-world relevance. For instance, a medication might have a statistically significant effect that is too small to be interesting.
- ^ To be more specific, the p = 0.05 corresponds to about 1.96 standard deviations for a normal distribution (two-tailed test), and 2 standard deviations corresponds to about a 1 in 22 chance of being exceeded by chance, or p ≈ 0.045; Fisher notes these approximations.
References
[edit]- ^ "ASA House Style" (PDF). Amstat News. American Statistical Association.
- ^ Aschwanden C (2015-11-24). "Not Even Scientists Can Easily Explain P-values". FiveThirtyEight. Archived from the original on 25 September 2019. Retrieved 11 October 2019.
- ^ a b c d e Wasserstein RL, Lazar NA (7 March 2016). "The ASA's Statement on p-Values: Context, Process, and Purpose". The American Statistician. 70 (2): 129–133. doi:10.1080/00031305.2016.1154108.
- ^ Hubbard R, Lindsay RM (2008). "Why P Values Are Not a Useful Measure of Evidence in Statistical Significance Testing". Theory & Psychology. 18 (1): 69–88. doi:10.1177/0959354307086923. S2CID 143487211.
- ^ Munafò MR, Nosek BA, Bishop DV, Button KS, Chambers CD, du Sert NP, et al. (January 2017). "A manifesto for reproducible science". Nature Human Behaviour. 1 (1): 0021. doi:10.1038/s41562-016-0021. PMC 7610724. PMID 33954258. S2CID 6326747.
- ^ Wasserstein, Ronald L.; Lazar, Nicole A. (2016-04-02). "The ASA Statement on p -Values: Context, Process, and Purpose". The American Statistician. 70 (2): 129–133. doi:10.1080/00031305.2016.1154108. ISSN 0003-1305. S2CID 124084622.
- ^ a b Benjamini, Yoav; De Veaux, Richard D.; Efron, Bradley; Evans, Scott; Glickman, Mark; Graubard, Barry I.; He, Xuming; Meng, Xiao-Li; Reid, Nancy M.; Stigler, Stephen M.; Vardeman, Stephen B.; Wikle, Christopher K.; Wright, Tommy; Young, Linda J.; Kafadar, Karen (2021-10-02). "ASA President's Task Force Statement on Statistical Significance and Replicability". Chance. 34 (4). Informa UK Limited: 10–11. doi:10.1080/09332480.2021.2003631. ISSN 0933-2480.
- ^ Neyman, Jerzy (1976). "The Emergence of Mathematical Statistics: A Historical Sketch with Particular Reference to the United States". In Owen, D.B. (ed.). On the History of Statistics and Probability. Textbooks and Monographs. New York: Marcel Dekker Inc. p. 161.
- ^ Fisher, R. A. (1992), Kotz, Samuel; Johnson, Norman L. (eds.), "Statistical Methods for Research Workers", Breakthroughs in Statistics: Methodology and Distribution, Springer Series in Statistics, New York, NY: Springer, pp. 66–70, doi:10.1007/978-1-4612-4380-9_6, ISBN 978-1-4612-4380-9
- ^ a b Head ML, Holman L, Lanfear R, Kahn AT, Jennions MD (March 2015). "The extent and consequences of p-hacking in science". PLOS Biology. 13 (3) e1002106. doi:10.1371/journal.pbio.1002106. PMC 4359000. PMID 25768323.
- ^ Simonsohn U, Nelson LD, Simmons JP (November 2014). "p-Curve and Effect Size: Correcting for Publication Bias Using Only Significant Results". Perspectives on Psychological Science. 9 (6): 666–681. doi:10.1177/1745691614553988. PMID 26186117. S2CID 39975518.
- ^ Bhattacharya B, Habtzghi D (2002). "Median of the p value under the alternative hypothesis". The American Statistician. 56 (3): 202–6. doi:10.1198/000313002146. S2CID 33812107.
- ^ Hung HM, O'Neill RT, Bauer P, Köhne K (March 1997). "The behavior of the P-value when the alternative hypothesis is true". Biometrics (Submitted manuscript). 53 (1): 11–22. doi:10.2307/2533093. JSTOR 2533093. PMID 9147587.
- ^ Nuzzo R (February 2014). "Scientific method: statistical errors". Nature. 506 (7487): 150–152. Bibcode:2014Natur.506..150N. doi:10.1038/506150a. hdl:11573/685222. PMID 24522584.
- ^ Colquhoun D (November 2014). "An investigation of the false discovery rate and the misinterpretation of p-values". Royal Society Open Science. 1 (3) 140216. arXiv:1407.5296. Bibcode:2014RSOS....140216C. doi:10.1098/rsos.140216. PMC 4448847. PMID 26064558.
- ^ Lee DK (December 2016). "Alternatives to P value: confidence interval and effect size". Korean Journal of Anesthesiology. 69 (6): 555–562. doi:10.4097/kjae.2016.69.6.555. PMC 5133225. PMID 27924194.
- ^ Ranstam J (August 2012). "Why the P-value culture is bad and confidence intervals a better alternative". Osteoarthritis and Cartilage. 20 (8): 805–808. doi:10.1016/j.joca.2012.04.001. PMID 22503814.
- ^ Perneger TV (May 2001). "Sifting the evidence. Likelihood ratios are alternatives to P values". BMJ. 322 (7295): 1184–1185. doi:10.1136/bmj.322.7295.1184. PMC 1120301. PMID 11379590.
- ^ Royall R (2004). "The Likelihood Paradigm for Statistical Evidence". The Nature of Scientific Evidence. pp. 119–152. doi:10.7208/chicago/9780226789583.003.0005. ISBN 978-0-226-78957-6.
- ^ Schimmack U (30 April 2015). "Replacing p-values with Bayes-Factors: A Miracle Cure for the Replicability Crisis in Psychological Science". Replicability-Index. Retrieved 7 March 2017.
- ^ Marden JI (December 2000). "Hypothesis Testing: From p Values to Bayes Factors". Journal of the American Statistical Association. 95 (452): 1316–1320. doi:10.2307/2669779. JSTOR 2669779.
- ^ Stern HS (16 February 2016). "A Test by Any Other Name: P Values, Bayes Factors, and Statistical Inference". Multivariate Behavioral Research. 51 (1): 23–29. doi:10.1080/00273171.2015.1099032. PMC 4809350. PMID 26881954.
- ^ Murtaugh PA (March 2014). "In defense of P values". Ecology. 95 (3): 611–617. Bibcode:2014Ecol...95..611M. doi:10.1890/13-0590.1. PMID 24804441.
- ^ Aschwanden C (7 March 2016). "Statisticians Found One Thing They Can Agree On: It's Time To Stop Misusing P-Values". FiveThirtyEight.
- ^ Amrhein V, Korner-Nievergelt F, Roth T (2017). "The earth is flat (p > 0.05): significance thresholds and the crisis of unreplicable research". PeerJ. 5 e3544. doi:10.7717/peerj.3544. PMC 5502092. PMID 28698825.
- ^ Amrhein V, Greenland S (January 2018). "Remove, rather than redefine, statistical significance". Nature Human Behaviour. 2 (1): 4. doi:10.1038/s41562-017-0224-0. PMID 30980046. S2CID 46814177.
- ^ Colquhoun D (December 2017). "The reproducibility of research and the misinterpretation of p-values". Royal Society Open Science. 4 (12) 171085. doi:10.1098/rsos.171085. PMC 5750014. PMID 29308247.
- ^ Goodman, Steven (2008-07-01). "A Dirty Dozen: Twelve P-Value Misconceptions". Seminars in Hematology. Interpretation of Quantitative Research. 45 (3): 135–140. doi:10.1053/j.seminhematol.2008.04.003. ISSN 0037-1963. PMID 18582619.
- ^ Wagenmakers, Eric-Jan (October 2007). "A practical solution to the pervasive problems of p values". Psychonomic Bulletin & Review. 14 (5): 779–804. doi:10.3758/BF03194105. ISSN 1069-9384. PMID 18087943.
- ^ Brian E, Jaisson M (2007). "Physico-Theology and Mathematics (1710–1794)". The Descent of Human Sex Ratio at Birth. Springer Science & Business Media. pp. 1–25. ISBN 978-1-4020-6036-6.
- ^ Arbuthnot J (1710). "An argument for Divine Providence, taken from the constant regularity observed in the births of both sexes" (PDF). Philosophical Transactions of the Royal Society of London. 27 (325–336): 186–190. doi:10.1098/rstl.1710.0011. S2CID 186209819.
- ^ a b Conover WJ (1999). "Chapter 3.4: The Sign Test". Practical Nonparametric Statistics (Third ed.). Wiley. pp. 157–176. ISBN 978-0-471-16068-7.
- ^ Sprent P (1989). Applied Nonparametric Statistical Methods (Second ed.). Chapman & Hall. ISBN 978-0-412-44980-2.
- ^ Stigler SM (1986). The History of Statistics: The Measurement of Uncertainty Before 1900. Harvard University Press. pp. 225–226. ISBN 978-0-67440341-3.
- ^ Bellhouse P (2001). "John Arbuthnot". In Heyde CC, Seneta E (eds.). Statisticians of the Centuries. Springer. pp. 39–42. ISBN 978-0-387-95329-8.
- ^ Hald A (1998). "Chapter 4. Chance or Design: Tests of Significance". A History of Mathematical Statistics from 1750 to 1930. Wiley. p. 65.
- ^ Stigler SM (1986). The History of Statistics: The Measurement of Uncertainty Before 1900. Harvard University Press. p. 134. ISBN 978-0-67440341-3.
- ^ a b Pearson K (1900). "On the criterion that a given system of deviations from the probable in the case of a correlated system of variables is such that it can be reasonably supposed to have arisen from random sampling" (PDF). Philosophical Magazine. Series 5. 50 (302): 157–175. doi:10.1080/14786440009463897.
- ^ Biau, David Jean; Jolles, Brigitte M.; Porcher, Raphaël (2010). "P Value and the Theory of Hypothesis Testing: An Explanation for New Researchers". Clinical Orthopaedics and Related Research. 468 (3): 885–892. doi:10.1007/s11999-009-1164-4. ISSN 0009-921X. PMC 2816758. PMID 19921345.
- ^ Brereton, Richard G. (2021). "P values and multivariate distributions: Non-orthogonal terms in regression models". Chemometrics and Intelligent Laboratory Systems. 210 104264. doi:10.1016/j.chemolab.2021.104264.
- ^ Hubbard R, Bayarri MJ (2003), "Confusion Over Measures of Evidence (p′s) Versus Errors (α′s) in Classical Statistical Testing", The American Statistician, 57 (3): 171–178 [p. 171], doi:10.1198/0003130031856, S2CID 55671953
- ^ Fisher 1925, p. 47, Chapter III. Distributions.
- ^ a b Dallal 2012, Note 31: Why P=0.05?.
- ^ Fisher 1925, pp. 78–79, 98, Chapter IV. Tests of Goodness of Fit, Independence and Homogeneity; with Table of χ2, Table III. Table of χ2.
- ^ Fisher 1971, II. The Principles of Experimentation, Illustrated by a Psycho-physical Experiment.
- ^ a b Fisher 1971, Section 7. The Test of Significance.
- ^ Fisher 1971, Section 12.1 Scientific Inference and Acceptance Procedures.
- ^ "Definition of E-value". National Institutes of Health.
- ^ Storey JD (2003). "The positive false discovery rate: a Bayesian interpretation and the q-value". The Annals of Statistics. 31 (6): 2013–2035. doi:10.1214/aos/1074290335.
- ^ Storey JD, Tibshirani R (August 2003). "Statistical significance for genomewide studies". Proceedings of the National Academy of Sciences of the United States of America. 100 (16): 9440–9445. Bibcode:2003PNAS..100.9440S. doi:10.1073/pnas.1530509100. PMC 170937. PMID 12883005.
- ^ Makowski D, Ben-Shachar MS, Chen SH, Lüdecke D (10 December 2019). "Indices of Effect Existence and Significance in the Bayesian Framework". Frontiers in Psychology. 10: 2767. doi:10.3389/fpsyg.2019.02767. PMC 6914840. PMID 31920819.
- ^ An Introduction to Second-Generation p-Values Jeffrey D. Blume, Robert A. Greevy, Valerie F. Welty, Jeffrey R. Smith &William D. Dupont https://www.tandfonline.com/doi/full/10.1080/00031305.2018.1537893
Further reading
[edit]- Denworth L (October 2019). "A Significant Problem: Standard scientific methods are under fire. Will anything change?". Scientific American. 321 (4): 62–67 (63).
The use of p values for nearly a century [since 1925] to determine statistical significance of experimental results has contributed to an illusion of certainty and [to] reproducibility crises in many scientific fields. There is growing determination to reform statistical analysis... Some [researchers] suggest changing statistical methods, whereas others would do away with a threshold for defining "significant" results.
- Elderton WP (1902). "Tables for Testing the Goodness of Fit of Theory to Observation". Biometrika. 1 (2): 155–163. doi:10.1093/biomet/1.2.155.
- Pearson, Karl (1914). "On the probability that two independent distributions of frequency are really samples of the same population, with special reference to recent work on the identity of Trypanosome strains". Biometrika. 10: 85–154. doi:10.1093/biomet/10.1.85.
- Fisher RA (1925). Statistical Methods for Research Workers. Edinburgh, Scotland: Oliver & Boyd. ISBN 978-0-05-002170-5.
{{cite book}}: ISBN / Date incompatibility (help) - Fisher RA (1971) [1935]. The Design of Experiments (9th ed.). Macmillan. ISBN 978-0-02-844690-5.
- Fisher RA, Yates F (1938). Statistical tables for biological, agricultural and medical research. London, England.
{{cite book}}: CS1 maint: location missing publisher (link) - Stigler SM (1986). The history of statistics: the measurement of uncertainty before 1900. Cambridge, Mass: Belknap Press of Harvard University Press. ISBN 978-0-674-40340-6.
- Hubbard R, Armstrong JS (2006). "Why We Don't Really Know What Statistical Significance Means: Implications for Educators" (PDF). Journal of Marketing Education. 28 (2): 114–120. doi:10.1177/0273475306288399. hdl:2092/413. S2CID 34729227. Archived from the original (PDF) on May 18, 2006.
- Hubbard R, Lindsay RM (2008). "Why P Values Are Not a Useful Measure of Evidence in Statistical Significance Testing" (PDF). Theory & Psychology. 18 (1): 69–88. doi:10.1177/0959354307086923. S2CID 143487211. Archived from the original (PDF) on 2016-10-21. Retrieved 2015-08-28.
- Stigler S (December 2008). "Fisher and the 5% level". Chance. 21 (4): 12. doi:10.1007/s00144-008-0033-3.
- Dallal GE (2012). The Little Handbook of Statistical Practice.
- Biau DJ, Jolles BM, Porcher R (March 2010). "P value and the theory of hypothesis testing: an explanation for new researchers". Clinical Orthopaedics and Related Research. 468 (3): 885–892. doi:10.1007/s11999-009-1164-4. PMC 2816758. PMID 19921345.
- Reinhart A (2015). Statistics Done Wrong: The Woefully Complete Guide. No Starch Press. p. 176. ISBN 978-1-59327-620-1.
- Benjamini, Yoav; De Veaux, Richard D.; Efron, Bradley; Evans, Scott; Glickman, Mark; Graubard, Barry I.; He, Xuming; Meng, Xiao-Li; Reid, Nancy; Stigler, Stephen M.; Vardeman, Stephen B.; Wikle, Christopher K.; Wright, Tommy; Young, Linda J.; Kafadar, Karen (2021). "The ASA President's Task Force Statement on Statistical Significance and Replicability". Annals of Applied Statistics. 15 (3): 1084–1085. doi:10.1214/21-AOAS1501.
- Benjamin, Daniel J.; Berger, James O.; Johannesson, Magnus; Nosek, Brian A.; Wagenmakers, E.-J.; Berk, Richard; Bollen, Kenneth A.; Brembs, Björn; Brown, Lawrence; Camerer, Colin; Cesarini, David; Chambers, Christopher D.; Clyde, Merlise; Cook, Thomas D.; De Boeck, Paul; Dienes, Zoltan; Dreber, Anna; Easwaran, Kenny; Efferson, Charles; Fehr, Ernst; Fidler, Fiona; Field, Andy P.; Forster, Malcolm; George, Edward I.; Gonzalez, Richard; Goodman, Steven; Green, Edwin; Green, Donald P.; Greenwald, Anthony G.; Hadfield, Jarrod D.; Hedges, Larry V.; Held, Leonhard; Hua Ho, Teck; Hoijtink, Herbert; Hruschka, Daniel J.; Imai, Kosuke; Imbens, Guido; Ioannidis, John P. A.; Jeon, Minjeong; Jones, James Holland; Kirchler, Michael; Laibson, David; List, John; Little, Roderick; Lupia, Arthur; Machery, Edouard; Maxwell, Scott E.; McCarthy, Michael; Moore, Don A.; Morgan, Stephen L.; Munafó, Marcus; Nakagawa, Shinichi; Nyhan, Brendan; Parker, Timothy H.; Pericchi, Luis; Perugini, Marco; Rouder, Jeff; Rousseau, Judith; Savalei, Victoria; Schönbrodt, Felix D.; Sellke, Thomas; Sinclair, Betsy; Tingley, Dustin; Van Zandt, Trisha; Vazire, Simine; Watts, Duncan J.; Winship, Christopher; Wolpert, Robert L.; Xie, Yu; Young, Cristobal; Zinman, Jonathan; Johnson, Valen E. (1 September 2017). "Redefine statistical significance". Nature Human Behaviour. 2 (1): 6–10. doi:10.1038/s41562-017-0189-z. eISSN 2397-3374. hdl:10281/184094. PMID 30980045. S2CID 256726352.
External links
[edit]- Free online p-values calculators for various specific tests (chi-square, Fisher's F-test, etc.).
- Understanding p-values, including a Java applet that illustrates how the numerical values of p-values can give quite misleading impressions about the truth or falsity of the hypothesis under test.
- StatQuest: P Values, clearly explained on YouTube
- StatQuest: P-value pitfalls and power calculations on YouTube
- Science Isn't Broken - Article on how p-values can be manipulated and an interactive tool to visualize it.
P-value
View on GrokipediaFundamentals
Definition
In statistical hypothesis testing, the p-value is defined in relation to a null hypothesis , which posits a specific condition such as no effect or no difference in the population parameter, and a test statistic , which summarizes the observed data to assess compatibility with .[7] The formal definition of the p-value is the probability of obtaining a test statistic at least as extreme as the observed value , calculated under the assumption that is true; mathematically, this is expressed as for a one-sided test or for a two-sided test.[7] The notion of "extreme" refers to values of the test statistic that are further from the null hypothesis in the direction specified by the alternative hypothesis; in one-tailed tests, extremity is measured in a single direction (e.g., greater than or less than the null expectation), whereas two-tailed tests consider deviations in both directions to capture any significant difference regardless of sign.[8] For a simple null hypothesis where the parameter under is fully specified, the p-value is directly computed from the sampling distribution of under . For a composite null hypothesis, where the null parameter space includes multiple values, the p-value is generalized as the supremum over of the probability of observing data at least as extreme as the observed data under each possible null parameter: .[9]Interpretation
The p-value represents the probability of obtaining observed data, or more extreme data, assuming the null hypothesis is true, thereby serving as a measure of the compatibility of the data with .[2] In the frequentist framework, a small p-value indicates evidence against , suggesting that the observed results are unlikely under this assumption, but it does not quantify the probability that is true, the probability that the alternative hypothesis is true, or the likelihood of the data given the alternative.[2] Nor does it measure the size of an effect or the importance of a result, as a small p-value can arise from small effects with large sample sizes or large effects with small samples.[2] This interpretation is strictly conditional on being true; thus, a small p-value does not imply that the effect is large or that is false, only that the data are surprising if holds.[2] In contrast to Bayesian approaches, where posterior probabilities update beliefs about hypotheses by incorporating prior information and directly estimating the probability that or the alternative is true, the frequentist p-value does not provide such a belief update or a direct probability for the hypotheses themselves.[10] Frequentist inference treats parameters as fixed unknowns and focuses on long-run error rates over repeated sampling, whereas Bayesian methods yield interpretable probabilities about parameters via the posterior distribution derived from Bayes' theorem.[10] The American Statistical Association emphasizes that p-values alone do not measure evidence for or against a specific model or hypothesis in the Bayesian sense, highlighting the distinct philosophical foundations of the two paradigms.[2] Significance thresholds, such as , are arbitrary conventions introduced by Ronald Fisher to guide decisions on whether to consider deviations significant, rather than providing definitive proof of rejection or acceptance of .[4] Fisher described the 0.05 level as a convenient limit corresponding roughly to twice the standard deviation, but noted flexibility for stricter levels like 0.01 if preferred, underscoring that such cutoffs should not mechanistically dictate conclusions.[4] The ASA further warns against relying solely on whether a p-value crosses these thresholds, as this can mislead inference and ignores the broader context of study design and data quality.[2]Statistical Foundations
Sampling Distribution Under the Null Hypothesis
Under the null hypothesis , the p-value for a continuous test statistic follows a uniform distribution on the interval [0, 1].[11] This property arises because the p-value is constructed as the probability of observing a test statistic at least as extreme as the observed value, assuming is true. For a one-sided right-tailed test, let denote the test statistic with cumulative distribution function (CDF) under . The p-value is then given by , where is the observed value.[11] To see why is uniformly distributed, consider the random variable . By the probability integral transform theorem, if is continuous, then , and thus also follows .[11] A sketch of the proof involves computing the CDF of : for , confirming uniformity.[11] For two-sided tests, common in practice (e.g., for symmetric distributions like the normal or t-distribution), the p-value is typically defined as . Under , this construction also results in a uniform distribution on [0, 1] for continuous test statistics, as the folding of the distribution preserves the uniformity property via the probability integral transform applied to the absolute value or equivalent transformations.[11] In practice, simulations under generate many p-values, and their histogram appears flat across [0, 1], visually demonstrating the uniform density.[12] For discrete test statistics, the p-value distribution is not exactly uniform but stochastically greater than or equal to the uniform distribution on [0, 1].[13] Specifically, for any significance level , ensuring the test remains conservative and controls the Type I error rate at or below .[13] With large sample sizes, the discreteness diminishes, and the distribution approaches uniformity.[11]Behavior Under Alternative Hypotheses
Under the alternative hypothesis , the distribution of the p-value deviates markedly from the uniformity under the null hypothesis , becoming skewed toward zero with increased density near 0 as the true effect size grows or sample size increases. This skewness arises because the test statistic under tends to produce more extreme values, making small p-values more probable and reflecting stronger evidence against .[14] For a one-sided standardized normal test statistic, the probability density function of the p-value under is where is the -quantile of the standard normal distribution, is the standard normal density function, is the sample size, and is the standardized effect size under . The corresponding cumulative distribution function is , which is stochastically smaller than the uniform, confirming the leftward shift. For two-sided tests, the distribution under is more complex, often involving the distribution of the minimum of two tail probabilities, but still concentrates toward zero with increasing power. Smaller observed p-values under thus provide stronger evidence against , with the overall distribution's concentration near 0 directly tied to the test's power, defined as at significance level for the one-sided case. As power increases, the density near 0 rises, enhancing the test's ability to detect deviations from .[15][14] The expected value of the p-value under , , is strictly less than 0.5 and decreases toward 0 for larger effects or sample sizes; for instance, with and , it equals approximately 0.181. The median p-value under is also less than 0.5 and typically smaller than the expected value, further emphasizing the downward bias. For composite null hypotheses, the p-value is conservatively defined as the supremum of the tail probabilities over the null parameter space, , which can inflate p-values under by considering the least favorable null scenario, potentially reducing power.[15][16][17] This behavior stems from the test statistic following a non-central distribution under , such as the non-central normal, t, or chi-squared, which shifts the tails and compresses the p-value distribution toward lower values compared to the central distribution under .[14]Computation
Exact Calculation Methods
Exact calculation methods for p-values involve directly computing the probability of observing data as extreme as or more extreme than the sample under the null hypothesis, using the precise sampling distribution or exhaustive enumeration, without relying on large-sample approximations. These methods are particularly valuable for small or discrete samples where asymptotic approaches may lead to inaccuracies.[18] In discrete tests, such as the binomial test, the exact p-value is obtained by summing the probabilities of all outcomes under the null hypothesis that are as extreme as or more extreme than the observed outcome. For a two-sided test of a fair coin (null probability ), if the observed number of heads is in flips, the p-value is calculated as where . This ensures the p-value reflects the exact tail probabilities from the binomial distribution.[18] For tests based on continuous reference distributions, such as the one-sample t-test assuming normality, the exact p-value uses the cumulative distribution function (CDF) of the Student's t-distribution with degrees of freedom. The two-sided p-value is , where is the CDF and is the observed t-statistic.[19] Permutation tests provide an exact method for comparing groups or assessing associations by enumerating or sampling from the reference distribution under the null hypothesis of exchangeability. The p-value is the proportion of permuted datasets (out of all possible rearrangements) where the test statistic is greater than or equal to the observed statistic: , where is the number of permutations (often all for complete exactness) and is the statistic from a permuted sample. This approach is distribution-free and exact when all permutations are enumerated.[20] Exact p-values maintain the nominal type I error rate precisely in small samples, avoiding inflation or deflation that can occur with approximate methods.[21]Asymptotic Approximations
Asymptotic approximations provide efficient methods for computing p-values when exact distributions are difficult or computationally intensive to obtain, particularly in large-sample settings. These techniques rely on the central limit theorem (CLT), which posits that under certain conditions, the distribution of a test statistic converges to a known limiting distribution—such as the standard normal or chi-squared—as the sample size increases.[22] For instance, in the z-test for a population mean, the test statistic is asymptotically standard normal under the null hypothesis, allowing the two-sided p-value to be approximated as where denotes the cumulative distribution function of the standard normal distribution.[23] Similarly, for the chi-square goodness-of-fit test under the multinomial model, the p-value is approximated as , where is the CDF of the chi-square distribution with appropriate degrees of freedom; this approximation is reliable when expected frequencies are sufficiently large (e.g., all at least 1, with no more than 20% less than 5).[24] Bootstrap methods offer a nonparametric alternative for estimating the p-value distribution empirically through resampling. Introduced by Efron, the bootstrap involves repeatedly drawing samples with replacement from the observed data to generate an empirical distribution of the test statistic, from which the p-value is computed as the proportion of bootstrap statistics at least as extreme as the observed one.[25] This approach is particularly useful for complex statistics where asymptotic normality may not hold exactly, providing a flexible approximation without strong parametric assumptions. Monte Carlo simulations extend these ideas to cases with intractable distributions by generating random samples from the null hypothesis to approximate the sampling distribution of the test statistic. The p-value is then estimated as the fraction of simulated statistics that are more extreme than the observed value, offering a practical solution for non-standard tests where closed-form approximations are unavailable.[26] The validity of these asymptotic approximations hinges on verifying underlying conditions, such as independence of observations, finite variance, and sufficiently large sample sizes, to ensure the limiting distributions are reliable.[22] While exact methods serve as a precise baseline for small samples, asymptotic and simulation-based approaches scale better for large or intricate models.[23]Applications in Hypothesis Testing
Role in Decision-Making
In the hypothesis testing framework, the p-value facilitates decision-making by quantifying the compatibility of observed data with the null hypothesis . The process begins with the computation of a test statistic from the sample data, followed by derivation of the p-value as the probability of obtaining a result at least as extreme as observed, assuming is true. This p-value is then compared to a pre-specified significance level (commonly 0.05); if , is rejected in favor of the alternative hypothesis , indicating that the data provide sufficient evidence against to warrant the decision.[3][27] The significance level serves as a control for Type I errors, defined as the long-run proportion of false rejections of a true across repeated tests, ensuring that the decision rule limits the risk of erroneous conclusions to at most .[27][28] In the Neyman-Pearson framework, these decisions are framed as optimal rules that balance Type I error () and Type II error () rates by defining critical regions where the likelihood ratio favors over , with the p-value determining entry into such regions.[29][3] The nature of the decision also depends on whether the test is one-sided or two-sided, aligned with the directional specificity of the research question encoded in . One-sided tests compute the p-value by considering extremity in only the predicted direction (e.g., greater than a value), yielding a more sensitive threshold for rejection when directionality is theoretically justified, whereas two-sided tests account for deviations in either direction, doubling the one-sided p-value to reflect bidirectional uncertainty.[30][31] Unlike the binary outcome of rejection or failure to reject, the p-value offers a continuous measure of evidential strength against , allowing nuanced interpretation where values closer to zero suggest progressively stronger incompatibility with the null, though the formal decision remains dichotomous based on .[28][3] This gradation supports the Neyman-Pearson emphasis on error-controlled actions rather than probabilistic beliefs about hypotheses.[27]Practical Examples
A classic example of p-value application is the binomial test for assessing coin fairness. Suppose a coin is flipped 10 times, resulting in 8 heads observed. The null hypothesis states that the probability of heads is (fair coin), while the alternative posits (biased coin). The test statistic is the number of heads, and under , it follows a binomial distribution with parameters and . The two-sided p-value is calculated as .[32] Since 0.109 > 0.05, the null hypothesis is not rejected at the 5% significance level, indicating insufficient evidence of bias. To contextualize, the effect size can be measured using Cohen's h, approximately 0.63 here, suggesting a moderate deviation from fairness despite the non-significant p-value.[33] Another common scenario involves the independent samples t-test for comparing means between two groups, such as petal lengths from two iris species. Sample data yield a mean of 1.46 cm (SD = 0.206, n=25) for species 1 and 5.54 cm (SD = 0.569, n=25) for species 2. The null hypothesis is that the population means are equal (), against . The t-statistic is computed as , where is the pooled variance, yielding t ≈ -33.719 with df ≈ 30.196. The two-sided p-value from the t-distribution is approximately 2.2 × 10^{-16}.[34] As p < 0.001, is rejected, supporting a difference in means. The effect size, Cohen's d ≈ 9.53, indicates a very large practical difference, far beyond statistical significance alone.[33] For multi-group comparisons, one-way ANOVA tests the equality of means across three or more groups, exemplified by sprint times differing by smoking status. Data include means of 6.411 seconds (n=261) for nonsmokers, 6.835 seconds (n=33) for past smokers, and 7.121 seconds (n=59) for current smokers. The null hypothesis assumes equal population means across groups (), versus that at least one differs. The F-statistic is the ratio of between-group to within-group mean square, F(2, 350) = 9.209. The p-value is the probability under the F-distribution, p < 0.001.[35] Thus, is rejected, indicating significant differences. The effect size, partial eta-squared ≈ 0.05, reflects a small to moderate overall impact of smoking status on sprint time.[33]Pitfalls and Misuses
Common Interpretive Errors
One of the most prevalent interpretive errors surrounding p-values is the misconception that a p-value represents the probability that the null hypothesis is true, denoted as . In reality, the p-value is the probability of observing data at least as extreme as the actual data assuming the null hypothesis is true, , and it provides no direct measure of the posterior probability of the null. This confusion leads researchers to erroneously conclude that a small p-value, such as 0.05, implies only a 5% chance the null is correct, thereby overstating the evidence against it. Such misinterpretation is widespread across disciplines, including psychology and medicine, where it undermines proper Bayesian updating and evidence assessment.[36][37] Another common error is the dichotomization of p-values, where results are rigidly classified as "statistically significant" if and dismissed otherwise, ignoring the continuous nature of evidence and the magnitude of effects. This binary threshold, arbitrarily set at 0.05, fosters a false sense of certainty and discourages nuanced evaluation of practical importance or effect sizes. Applied researchers, including statisticians, frequently misuse p-values in this way, leading to distorted inferences and reduced reproducibility in fields like social sciences and biomedicine. The practice amplifies selective reporting, as borderline p-values near 0.05 are more likely to be highlighted or manipulated than those slightly above the threshold.[38][7] This dichotomization contributes to the replication crisis, as studies with p-values just below 0.05 often reflect low statistical power, particularly for small effect sizes common in behavioral and neuroscience research. For instance, meta-analyses reveal that typical neuroscience studies have median power around 21%, meaning even a significant p-value of 0.05 provides only weak evidence against the null and has roughly a 50% chance of replicating under similar conditions for modest effects. Low power inflates false positives and overestimates effect sizes, explaining why large-scale replication efforts, such as those in psychology, succeed in only about 36% of cases at the 0.05 level. These issues highlight how interpretive reliance on threshold p-values exacerbates non-replicability across sciences.[39] P-hacking represents a deliberate interpretive and methodological error, involving the manipulation of data collection, analysis choices, or reporting to achieve a p-value below 0.05, often through practices like optional stopping, selective outcome variables, or covariate inclusion. This abuse creates illusory significance, publishing false positives that mislead meta-analyses and waste resources on non-replicable findings. Simulations and empirical surveys indicate p-hacking substantially inflates the rate of significant results in fields prone to flexibility in analysis, further eroding trust in published research.[40] Prior to the 2016 American Statistical Association (ASA) statement, scientific journals heavily overemphasized p-values as the primary criterion for publication, treating as definitive proof of importance and sidelining effect sizes or study context. This gatekeeping role encouraged p-hacking and the file-drawer problem, where non-significant results were suppressed, skewing the literature toward inflated effects. The ASA statement explicitly warned against such overreliance, noting that p-values alone cannot substantiate claims and should be supplemented with broader evidence assessment to restore scientific integrity. A follow-up 2021 ASA President's Task Force statement reinforced these principles, emphasizing that p-values and significance tests are valid but should not be the sole basis for inference, and advocating for estimation, replication, and full contextual reporting to mitigate misuses.[2][41]Issues with Multiple Comparisons
When conducting multiple hypothesis tests in a single study, the probability of encountering at least one false positive—known as the family-wise error rate (FWER)—increases substantially without appropriate adjustments.[42] For independent tests each conducted at significance level , the FWER approximates , which approaches 1 as grows large even for modest .[43] One straightforward method to control the FWER is the Bonferroni correction, which adjusts each p-value by multiplying it by the number of tests and capping at 1, yielding the adjusted p-value ; a hypothesis is rejected if .[44] This procedure ensures the overall FWER does not exceed under the assumption of independence or positive dependence among tests.[45] A less conservative alternative to the single-step Bonferroni method is the Holm-Bonferroni procedure, a stepwise approach that orders p-values from smallest to largest and applies sequentially decreasing thresholds for the -th smallest p-value, stopping when a p-value exceeds its threshold.[46] This method maintains FWER control at level while being uniformly more powerful than Bonferroni, as it avoids overly penalizing early significant results.[47] In scenarios involving many tests, such as large-scale genomics studies, controlling the FWER can be overly stringent, leading to low power; instead, the false discovery rate (FDR)—the expected proportion of false positives among all rejected hypotheses—offers a more flexible alternative.[48] The Benjamini-Hochberg procedure controls the FDR by sorting p-values and rejecting all hypotheses up to the largest where , providing less conservative control suitable for high-dimensional data like genome-wide association studies.[45] These corrections involve trade-offs: FWER methods like Bonferroni and Holm-Bonferroni are conservative, ensuring strict control over any false positives but reducing statistical power, whereas FDR approaches like Benjamini-Hochberg enhance power at the cost of allowing some false discoveries, which is preferable when many true effects are anticipated.[49]Historical Context
Origins and Early Development
The concept of the p-value has roots in pre-20th-century statistical practices, particularly in the framework of inverse probability, where early probabilists like Pierre-Simon Laplace (1774–1829) sought to infer causes from observed effects by calculating probabilities of data under assumed hypotheses.[50] This approach laid groundwork for assessing the improbability of observations under a null model, though it lacked formalization as a tail probability. In the late 19th century, Francis Galton popularized the "probable error" (PE)—a measure equivalent to about 0.6745 standard deviations—as a way to quantify variability in anthropometric data, using multiples of PE (e.g., 3PE) to gauge unlikely deviations and foreshadowing significance thresholds.[4] The p-value was formally introduced by Karl Pearson in 1900 within the context of his chi-square goodness-of-fit test, published in The London, Edinburgh, and Dublin Philosophical Magazine and Journal of Science. Pearson described the p-value as the probability of observing data at least as extreme as that obtained, assuming the fitted model holds, thereby providing a criterion to judge whether deviations from expected frequencies could reasonably arise by random sampling.[50] This innovation, detailed in his seminal paper "X. On the Criterion that a Given System of Deviations from the Probable in the Case of a Correlated System of Variables is Such that it Can Be Reasonably Supposed to Have Arisen from Random Sampling," marked the p-value's entry into statistical practice for testing distributional assumptions. Early adoption expanded in the 1900s and 1920s through contributions from William Sealy Gosset and Ronald A. Fisher. In 1908, Gosset, writing as "Student," developed the t-distribution for small-sample inference on means, incorporating p-value-like probabilities to assess the "probable error" of estimates in agricultural experiments at Guinness Brewery. Fisher advanced the p-value in the 1920s, notably through his exact test for 2x2 contingency tables—illustrated in a famous 1920s thought experiment involving a lady tasting tea to distinguish milk-first versus tea-first preparation—and formalized in his 1925 book Statistical Methods for Research Workers. There, Fisher proposed the p-value as a measure of evidential weight against the null hypothesis, suggesting a 0.05 threshold for practical convenience while emphasizing its continuous nature over rigid cutoffs.[51] In the 1930s, Jerzy Neyman and Egon Pearson built on these foundations with their likelihood ratio framework for hypothesis testing, introduced in their 1933 paper "On the Problem of the Most Efficient Tests of Statistical Hypotheses."[29] Unlike Fisher's focus on p-values as degrees of evidence, the Neyman-Pearson approach treated them within a decision-theoretic paradigm, emphasizing control of error rates (Type I at α=0.05) and power against alternatives, which contrasted sharply with Fisher's inductive, non-decisionistic interpretation.[50] This duality shaped the p-value's dual roles in evidential assessment and formal testing during its early development.Modern Debates and Reforms
In the 2010s, concerns over the reproducibility of scientific findings intensified, with studies attributing low replication rates to an over-reliance on the conventional p < 0.05 threshold. The Open Science Collaboration's large-scale replication attempt in psychology, for instance, successfully reproduced only 36% of original effects from 100 studies, highlighting how dichotomous significance testing often leads to inflated false positives and fragile results. This reproducibility crisis prompted widespread debate, as similar patterns emerged across fields like economics and medicine, where selective reporting of significant p-values contributed to non-replicable claims. In response, the American Statistical Association (ASA) issued a landmark statement in 2016, clarifying key misconceptions and advocating for reformed practices. The statement emphasized that a p-value is not the probability that the null hypothesis is true given the data—P(H_0|data)—but rather the probability of observing data at least as extreme as those obtained, assuming the null is true. It urged researchers to avoid treating p < 0.05 as a bright-line rule for dichotomizing results, instead prioritizing estimation of effect sizes, uncertainty via confidence intervals, and contextual interpretation over rigid significance testing. This guidance influenced statistical education and policy, promoting a shift toward more nuanced inference. Several reform proposals emerged to address these issues, including outright bans on p-values and stricter thresholds. David Trafimow, as editor of Basic and Applied Social Psychology, announced in 2015 a policy prohibiting the publication of p-values, arguing they encourage mechanical hypothesis testing without substantive insight and recommending alternatives like Bayesian methods or confidence intervals.[52] Conversely, Daniel Benjamin and colleagues proposed in 2018 redefining statistical significance at p < 0.005 for novel findings, aiming to reduce false positives while maintaining computational feasibility, though this sparked debate over increased false negatives. These ideas underscore ongoing tensions between tradition and innovation in statistical practice. By 2025, major journals had incorporated these debates into updated reporting guidelines, mandating effect sizes alongside p-values to ensure comprehensive evaluation of results. For example, the Journal of Marketing revised its policy effective March 2025, requiring authors to report exact p-values (to three decimal places) without significance asterisks, paired with domain-appropriate effect sizes like Cohen's d or elasticities, to highlight practical importance beyond statistical significance.[53] In high-dimensional big data settings, such as genomics or machine learning, p-values face additional challenges, including exacerbated multiple testing problems where the sheer volume of tests inflates Type I error rates despite corrections like Bonferroni, often rendering traditional thresholds unreliable without dimensionality reduction or alternative metrics.[54]Related Statistical Measures
Connection to Confidence Intervals
In frequentist statistical inference, p-values and confidence intervals exhibit a duality, where a confidence interval for a parameter comprises all null values for which the p-value of testing exceeds .[55] This means the interval excludes precisely those values that would lead to rejection of the null hypothesis at significance level .[56] Formally, for a test of , the condition holds if and only if lies outside the confidence interval for . For instance, when , this equivalence states that if and only if is not contained in the 95% confidence interval.[57] This correspondence arises because confidence intervals are constructed by inverting hypothesis tests, collecting all non-rejected null values.[56] Confidence intervals thus offer a range of plausible values for consistent with the data at the chosen confidence level, whereas p-values evaluate evidence against a single point hypothesis.[58] For invertible tests—those where the test statistic is monotone in the parameter, such as the t-test—this duality yields an exact one-to-one relationship, enabling straightforward derivation of intervals from test procedures.[57] A key advantage of confidence intervals over p-values alone is their emphasis on the magnitude and precision of estimates, promoting interpretation of effect sizes and uncertainty ranges rather than reliance on arbitrary significance thresholds.[59]Distinction from Effect Sizes
Effect size quantifies the magnitude of a phenomenon or the strength of a relationship between variables, providing a measure of practical or substantive importance that remains independent of sample size.[33] For instance, Cohen's d is a widely used standardized effect size for comparing means, calculated as the difference between two group means divided by the pooled standard deviation:where and are the population means of the two groups, and is the standard deviation.[60] This metric focuses on the scale of the difference relative to variability, offering insight into whether the effect is meaningful in real-world terms, regardless of how many observations were collected.[61] In contrast, the p-value indicates the probability of observing data as extreme as that obtained, assuming the null hypothesis is true, and is highly sensitive to sample size. Even trivial effect sizes can yield statistically significant p-values (e.g., p < 0.05) when the sample is large enough, as increased n reduces the standard error and boosts the test statistic, such as in a t-test where p derives from the t-statistic: t = ( \bar{x}_1 - \bar{x}_2 ) / (s \sqrt{2/n}).[33] Thus, a small effect might appear "significant" solely due to a large dataset, misleading interpretations if magnitude is ignored. Effect sizes, being invariant to sample size, complement p-values by revealing whether the detected effect warrants attention beyond mere statistical detection.[62] Jacob Cohen provided interpretive guidelines for effect sizes in behavioral sciences, classifying Cohen's d as small (0.2), medium (0.5), or large (0.8), emphasizing that these are conventional benchmarks rather than universal thresholds.[63] Relying solely on p-values can be misleading, as it conflates evidence against the null with the effect's practical relevance; for example, a highly significant p-value from a large study might correspond to a negligible d < 0.2, indicating minimal real-world impact.[64] Professional standards, such as those from the American Psychological Association (APA), advocate reporting both p-values and effect sizes for comprehensive inference, ensuring results convey not only statistical reliability but also substantive meaning.[65] This dual reporting promotes better evaluation of findings across studies, avoiding overemphasis on arbitrary significance thresholds.[66]