

Community hub
Recent from talks
Contribute something
Nothing was collected or created yet.
Oil refinery
View on Wikipedia


.jpg)
An oil refinery or petroleum refinery is an industrial process plant where petroleum (crude oil) is transformed and refined into products such as gasoline (petrol), diesel fuel, asphalt base, fuel oils, heating oil, kerosene, liquefied petroleum gas and petroleum naphtha.[1][2][3] Petrochemical feedstock like ethylene and propylene can also be produced directly by cracking crude oil without the need of using refined products of crude oil such as naphtha.[4][5] The crude oil feedstock has typically been processed by an oil production plant. There is usually an oil depot at or near an oil refinery for the storage of incoming crude oil feedstock as well as bulk liquid products. In 2020, the total capacity of global refineries for crude oil was about 101.2 million barrels per day.[6]
Oil refineries are typically large, sprawling industrial complexes with extensive piping running throughout, carrying streams of fluids between large chemical processing units, such as distillation columns. In many ways, oil refineries use many different technologies and can be thought of as types of chemical plants. Since December 2008, the world's largest oil refinery has been the Jamnagar Refinery owned by Reliance Industries, located in Gujarat, India, with a processing capacity of 1.24 million barrels (197,000 m3) per day.
Oil refineries are an essential part of the petroleum industry's downstream sector.[7]
History
[edit]The Chinese were among the first civilizations to refine oil.[8] As early as the first century, the Chinese were refining crude oil for use as an energy source.[9][8] Between 512 and 518, in the late Northern Wei dynasty, the Chinese geographer, writer and politician Li Daoyuan introduced the process of refining oil into various lubricants in his famous work Commentary on the Water Classic.[10][9][8]
Crude oil was often distilled by Persian chemists, with clear descriptions given in handbooks such as those of Muhammad ibn Zakarīya Rāzi (c. 865–925).[11] The streets of Baghdad were paved with tar, derived from petroleum that became accessible from natural fields in the region. In the 9th century, oil fields were exploited in the area around modern Baku, Azerbaijan. These fields were described by the Arab geographer Abu al-Hasan 'Alī al-Mas'ūdī in the 10th century, and by Marco Polo in the 13th century, who described the output of those wells as hundreds of shiploads.[12] Arab and Persian chemists also distilled crude oil in order to produce flammable products for military purposes. Through Islamic Spain, distillation became available in Western Europe by the 12th century.[13]
In the Northern Song dynasty (960–1127), a workshop called the "Fierce Oil Workshop", was established in the city of Kaifeng to produce refined oil for the Song military as a weapon. The troops would then fill iron cans with refined oil and throw them toward the enemy troops, causing a fire – effectively the world's first "fire bomb". The workshop was one of the world's earliest oil refining factories where thousands of people worked to produce Chinese oil-powered weaponry.[14]
Prior to the nineteenth century, petroleum was known and utilized in various fashions in Babylon, Egypt, China, Philippines, Rome and Azerbaijan. However, the modern history of the petroleum industry is said to have begun in 1846 when Abraham Gessner of Nova Scotia, Canada devised a process to produce kerosene from coal. Shortly thereafter, in 1854, Ignacy Łukasiewicz began producing kerosene from hand-dug oil wells near the town of Krosno, Poland.
Romania was registered as the first country in world oil production statistics, according to the Academy Of World Records.[15][16]
In North America, the first oil well was drilled in 1858 by James Miller Williams in Oil Springs, Ontario, Canada.[17] In the United States, the petroleum industry began in 1859 when Edwin Drake found oil near Titusville, Pennsylvania.[18] The industry grew slowly in the 1800s, primarily producing kerosene for oil lamps. In the early twentieth century, the introduction of the internal combustion engine and its use in automobiles created a market for gasoline that was the impetus for fairly rapid growth of the petroleum industry. The early finds of petroleum like those in Ontario and Pennsylvania were soon outstripped by large oil "booms" in Oklahoma, Texas and California.[19]
Samuel Kier established America's first oil refinery in Pittsburgh on Seventh Avenue near Grant Street, in 1853.[20] Polish pharmacist and inventor Ignacy Łukasiewicz established an oil refinery in Jasło, then part of the Austro-Hungarian Empire (now in Poland) in 1854.
The first large refinery opened at Ploiești, Romania, in 1856–1857.[15] It was in Ploiesti that, 51 years later, in 1908, Lazăr Edeleanu, a Romanian chemist of Jewish origin who got his PhD in 1887 by discovering amphetamine, invented, patented and tested on industrial scale the first modern method of liquid extraction for refining crude oil, the Edeleanu process. This increased the refining efficiency compared to pure fractional distillation and allowed a massive development of the refining plants. Successively, the process was implemented in France, Germany, U.S. and in a few decades became worldwide spread. In 1910 Edeleanu founded "Allgemeine Gesellschaft für Chemische Industrie" in Germany, which, given the success of the name, changed to Edeleanu GmbH, in 1930. During Nazi's time, the company was bought by the Deutsche Erdöl-AG and Edeleanu, being of Jewish origin, moved back to Romania. After the war, the trademark was used by the successor company EDELEANU Gesellschaft mbH Alzenau (RWE) for many petroleum products, while the company was lately integrated as EDL in the Pörner Group. The Ploiești refineries, after being taken over by Nazi Germany, were bombed in the 1943 Operation Tidal Wave by the Allies, during the Oil Campaign of World War II.
Another close contender for the title of hosting the world's oldest oil refinery is Salzbergen in Lower Saxony, Germany. Salzbergen's refinery was opened in 1860.
At one point, the refinery in Ras Tanura, Saudi Arabia owned by Saudi Aramco was claimed to be the largest oil refinery in the world. For most of the 20th century, the largest refinery was the Abadan Refinery in Iran. This refinery suffered extensive damage during the Iran–Iraq War. Since 25 December 2008, the world's largest refinery complex is the Jamnagar Refinery Complex, consisting of two refineries side by side operated by Reliance Industries Limited in Jamnagar, India with a combined production capacity of 1,240,000 barrels per day (197,000 m3/d), and SK Energy's Ulsan in South Korea with 840,000 bbl/d (134,000 m3/d). PDVSA's Paraguaná Refinery Complex in Paraguaná Peninsula, Venezuela, with a theoretical refining capacity of 940,000 bbl/d (149,000 m3/d) could be into the second place, but its effective run rates have been dramatically lower and publicly unaccounted, after Chavismo nationalized Venezuelan oil production, significantly decreasing its productivity.
Prior to World War II in the early 1940s, most petroleum refineries in the United States consisted simply of crude oil distillation units (often referred to as atmospheric crude oil distillation units). Some refineries also had vacuum distillation units as well as thermal cracking units such as visbreakers (viscosity breakers, units to lower the viscosity of the oil). All of the many other refining processes discussed below were developed during the war or within a few years after the war. They became commercially available within 5 to 10 years after the war ended and the worldwide petroleum industry experienced very rapid growth. The driving force for that growth in technology and in the number and size of refineries worldwide was the growing demand for automotive gasoline and aircraft fuel.
In the United States, for various complex economic and political reasons, the construction of new refineries came to a virtual stop in about the 1980s. However, many of the existing refineries in the United States have revamped many of their units and/or constructed add-on units in order to: increase their crude oil processing capacity, increase the octane rating of their product gasoline, lower the sulfur content of their diesel fuel and home heating fuels to comply with environmental regulations and comply with environmental air pollution and water pollution requirements.

United States
[edit]
In the 19th century, refineries in the U.S. processed crude oil primarily to recover the kerosene. There was no market for the more volatile fraction, including gasoline, which was considered waste and was often dumped directly into the nearest river. The invention of the automobile shifted demand to gasoline and diesel, which remain the primary refined products today.[22]
Today, national and state legislation require refineries to meet stringent air and water cleanliness standards. In fact, oil companies in the U.S. perceive obtaining a permit to build a modern refinery to be so difficult and costly that no new refineries were built (though many have been expanded) in the U.S. from 1976 until 2014 when the small Dakota Prairie Refinery in North Dakota began operation.[23] More than half the refineries that existed in 1981 are now closed due to low utilization rates and accelerating mergers.[24] As a result of these closures total US refinery capacity fell between 1981 and 1995, though the operating capacity stayed fairly constant in that time period at around 15,000,000 barrels per day (2,400,000 m3/d).[25] Increases in facility size and improvements in efficiencies have offset much of the lost physical capacity of the industry. In 1982 (the earliest data provided), the United States operated 301 refineries with a combined capacity of 17.9 million barrels (2,850,000 m3) of crude oil each calendar day. In 2010, there were 149 operable U.S. refineries with a combined capacity of 17.6 million barrels (2,800,000 m3) per calendar day.[26] By 2014 the number of refinery had reduced to 140 but the total capacity increased to 18.02 million barrels (2,865,000 m3) per calendar day. Indeed, in order to reduce operating costs and depreciation, refining is operated in fewer sites but of bigger capacity.
In 2009 through 2010, as revenue streams in the oil business dried up and profitability of oil refineries fell due to lower demand for product and high reserves of supply preceding the economic recession, oil companies began to close or sell the less profitable refineries.[27]
Operation
[edit]
Raw or unprocessed crude oil is not generally useful in industrial applications, although "light, sweet" (low viscosity, low sulfur) crude oil has been used directly as a burner fuel to produce steam for the propulsion of seagoing vessels. The lighter elements, however, form explosive vapors in the fuel tanks and are therefore hazardous, especially in warships. Instead, the hundreds of different hydrocarbon molecules in crude oil are separated in a refinery into components that can be used as fuels, lubricants, and feedstocks in petrochemical processes that manufacture such products as plastics, detergents, solvents, elastomers, and fibers such as nylon and polyesters.
Petroleum fossil fuels are burned in internal combustion engines to provide power for ships, automobiles, aircraft engines, lawn mowers, dirt bikes, and other machines. Different boiling points allow the hydrocarbons to be separated by distillation. Since the lighter liquid products are in great demand for use in internal combustion engines, a modern refinery will convert heavy hydrocarbons and lighter gaseous elements into these higher-value products.[28]

Oil can be used in a variety of ways because it contains hydrocarbons of varying molecular masses, forms and lengths such as paraffins, aromatics, naphthenes (or cycloalkanes), alkenes, dienes, and alkynes.[29] While the molecules in crude oil include different atoms such as sulfur and nitrogen, the hydrocarbons are the most common form of molecules, which are molecules of varying lengths and complexity made of hydrogen and carbon atoms, and a small number of oxygen atoms. The differences in the structure of these molecules account for their varying physical and chemical properties, and it is this variety that makes crude oil useful in a broad range of several applications.
Once separated and purified of any contaminants and impurities, the fuel or lubricant can be sold without further processing. Smaller molecules such as isobutane and propylene or butylenes can be recombined to meet specific octane requirements by processes such as alkylation, or more commonly, dimerization. The octane grade of gasoline can also be improved by catalytic reforming, which involves removing hydrogen from hydrocarbons producing compounds with higher octane ratings such as aromatics. Intermediate products such as gasoils can even be reprocessed to break a heavy, long-chained oil into a lighter short-chained one, by various forms of cracking such as fluid catalytic cracking, thermal cracking, and hydrocracking. The final step in gasoline production is the blending of fuels with different octane ratings, vapor pressures, and other properties to meet product specifications. Another method for reprocessing and upgrading these intermediate products (residual oils) uses a devolatilization process to separate usable oil from the waste asphaltene material. Certain cracked streams are particularly suitable to produce petrochemicals includes polypropylene, heavier polymers, and block polymers based on the molecular weight and the characteristics of the olefin specie that is cracked from the source feedstock.[30]
Oil refineries are large-scale plants, processing about a hundred thousand to several hundred thousand barrels of crude oil a day. Because of the high capacity, many of the units operate continuously, as opposed to processing in batches, at steady state or nearly steady state for months to years. The high capacity also makes process optimization and advanced process control very desirable.
Major products
[edit]

Petroleum products are materials derived from crude oil (petroleum) as it is processed in oil refineries. The majority of petroleum is converted to petroleum products, which includes several classes of fuels.[32]
Oil refineries also produce various intermediate products such as hydrogen, light hydrocarbons, reformate and pyrolysis gasoline. These are not usually transported but instead are blended or processed further on-site. Chemical plants are thus often adjacent to oil refineries or a number of further chemical processes are integrated into it. For example, light hydrocarbons are steam-cracked in an ethylene plant, and the produced ethylene is polymerized to produce polyethene.
To ensure both proper separation and environmental protection, a very low sulfur content is necessary in all but the heaviest products. The crude sulfur contaminant is transformed to hydrogen sulfide via catalytic hydrodesulfurization and removed from the product stream via amine gas treating. Using the Claus process, hydrogen sulfide is afterward transformed to elementary sulfur to be sold to the chemical industry. The rather large heat energy freed by this process is directly used in the other parts of the refinery. Often an electrical power plant is combined into the whole refinery process to take up the excess heat.
According to the composition of the crude oil and depending on the demands of the market, refineries can produce different shares of petroleum products. The largest share of oil products is used as "energy carriers", i.e. various grades of fuel oil and gasoline. These fuels include or can be blended to give gasoline, jet fuel, diesel fuel, heating oil, and heavier fuel oils. Heavier (less volatile) fractions can also be used to produce asphalt, tar, paraffin wax, lubricating and other heavy oils. Refineries also produce other chemicals, some of which are used in chemical processes to produce plastics and other useful materials. Since petroleum often contains a few percent sulfur-containing molecules, elemental sulfur is also often produced as a petroleum product. Carbon, in the form of petroleum coke, and hydrogen may also be produced as petroleum products. The hydrogen produced is often used as an intermediate product for other oil refinery processes such as hydrocracking and hydrodesulfurization.[33]
Petroleum products are usually grouped into four categories: light distillates (LPG, gasoline, naphtha), middle distillates (kerosene, jet fuel, diesel), heavy distillates, and residuum (heavy fuel oil, lubricating oils, wax, asphalt). These require blending various feedstocks, mixing appropriate additives, providing short-term storage, and preparation for bulk loading to trucks, barges, product ships, and railcars. This classification is based on the way crude oil is distilled and separated into fractions.[2]
- Gaseous fuel such as liquified petroleum gas and propane, stored and shipped in liquid form under pressure.
- Lubricants (produces light machine oils, motor oils, and greases, adding viscosity stabilizers as required), usually shipped in bulk to an offsite packaging plant.
- Paraffin wax, used in the candle industry, among others. May be shipped in bulk to a site to prepare as packaged blocks. Used for wax emulsions, candles, matches, rust protection, vapor barriers, construction board, and packaging of frozen foods.
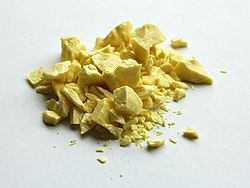
- Sulfur (or sulfuric acid), byproducts of sulfur removal from petroleum which may have up to a couple of percent sulfur as organic sulfur-containing compounds. Sulfur and sulfuric acid are useful industrial materials. Sulfuric acid is usually prepared and shipped as the acid precursor oleum.
- Bulk tar shipping for offsite unit packaging for use in tar-and-gravel roofing.
- Asphalt used as a binder for gravel to form asphalt concrete, which is used for paving roads, lots, etc. An asphalt unit prepares bulk asphalt for shipment.
- Petroleum coke, used in specialty carbon products like electrodes or as solid fuel.
- Petrochemicals are organic compounds that are the ingredients for the chemical industry, ranging from polymers and pharmaceuticals, including ethylene and benzene-toluene-xylenes ("BTX") which are often sent to petrochemical plants for further processing in a variety of ways. The petrochemicals may be olefins or their precursors, or various types of aromatic petrochemicals.
- Gasoline
- Naphtha
- Kerosene and related jet aircraft fuels
- Diesel fuel and fuel oils
- Heat
- Electricity
Over 6,000 items are made from petroleum waste by-products, including fertilizer, floor coverings, perfume, insecticide, petroleum jelly, soap, and vitamin capsules.[34]
-
 Sample of crude oil (petroleum)
 -

-
 Sample of gasoline
 -
 Sample of kerosene
 -
 Sample of diesel fuel
 -

-
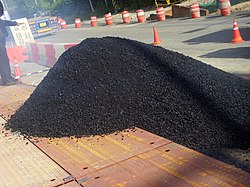 Pile of asphalt-covered aggregate for formation into asphalt concrete
 -


Chemical processes
[edit]
- Desalter unit washes out salt, and other water soluble contaminants, from the crude oil before it enters the atmospheric distillation unit.[35][36][37]
- Pre-flash and/or pre-distillation which is found in most atmospheric crude oil units of more than 100,000 bpsd in capacity.[38]
- Crude oil distillation unit distills the incoming crude oil into various fractions for further processing in other units. See continuous distillation.[39][40][41][42][43]
- Vacuum distillation further distills the residue oil from the bottom of the crude oil distillation unit. The vacuum distillation is performed at a pressure well below atmospheric pressure.[39][40][41][42][43]
- Naphtha hydrotreater unit uses hydrogen to desulfurize naphtha from atmospheric distillation. Naphtha must be desulfurized before sending it to a catalytic reformer unit.[1][44]
- Catalytic reformer converts the desulfurized naphtha molecules into higher-octane molecules to produce reformate (reformer product). The reformate has higher content of aromatics and cyclic hydrocarbons which is a component of the end-product gasoline or petrol. An important byproduct of a reformer is hydrogen released during the catalyst reaction. The hydrogen is used either in the hydrotreaters or the hydrocracker.[45][46]
- Distillate hydrotreater desulfurizes distillates (such as diesel) after atmospheric distillation. Uses hydrogen to desulfurize the naphtha fraction from the crude oil distillation or other units within the refinery.[1][44] Distillate hydrotreaters that operate above 700 psi are also capable of removing nitrogen contaminants from feedstocks if given adequate liquid hourly space velocity.[47]
- Fluid catalytic cracker (FCC) upgrades the heavier, higher-boiling fractions from the crude oil distillation by converting them into lighter and lower boiling, more valuable products.[48][3][49]
- Hydrocracker uses hydrogen to upgrade heavy residual oils from the vacuum distillation unit by thermally cracking them into lighter, more valuable reduced viscosity products.[50][51]
- Merox desulfurize LPG, kerosene or jet fuel by oxidizing mercaptans to organic disulfides.
- Alternative processes for removing mercaptans are known, e.g. doctor sweetening process and caustic washing.
- Coking units (delayed coker, fluid coker, and flexicoker) process very heavy residual oils into gasoline and diesel fuel, leaving petroleum coke as a residual product.
- Alkylation unit uses sulfuric acid or hydrofluoric acid to produce high-octane components for gasoline blending. The "alky" unit converts light end isobutane and butylenes from the FCC process into alkylate, a very high-octane component of the end-product gasoline or petrol.[52]
- Dimerization unit converts olefins into higher-octane gasoline blending components. For example, butenes can be dimerized into isooctene which may subsequently be hydrogenated to form isooctane. There are also other uses for dimerization. Gasoline produced through dimerization is highly unsaturated and very reactive. It tends spontaneously to form gums. For this reason, the effluent from the dimerization needs to be blended into the finished gasoline pool immediately or hydrogenated.
- Isomerization converts linear molecules such as normal pentane to higher-octane branched molecules for blending into gasoline or feed to alkylation units. Also used to convert linear normal butane into isobutane for use in the alkylation unit.
- Steam reforming converts natural gas into hydrogen for the hydrotreaters and/or the hydrocracker.
- Liquified gas storage vessels store propane and similar gaseous fuels at pressure sufficient to maintain them in liquid form. These are usually spherical vessels or "bullets" (i.e., horizontal vessels with rounded ends).
- Amine gas treater, Claus unit, and tail gas treatment convert hydrogen sulfide from hydrodesulfurization into elemental sulfur. The large majority of the 64,000,000 metric tons of sulfur produced worldwide in 2005 was byproduct sulfur from petroleum refining and natural gas processing plants.[53][54]
- Sour water stripper uses steam to remove hydrogen sulfide gas from various wastewater streams for subsequent conversion into end-product sulfur in the Claus unit.[37]
- Cooling towers circulate cooling water, boiler plants generates steam for steam generators, and instrument air systems include pneumatically operated control valves and an electrical substation.
- Wastewater collection and treating systems consist of API separators, dissolved air flotation (DAF) units and further treatment units such as an activated sludge biotreater to make water suitable for reuse or for disposal.[55]
- Solvent refining uses solvent such as cresol or furfural to remove unwanted, mainly aromatics from lubricating oil stock or diesel stock.
- Solvent dewaxing removes the heavy waxy constituents petrolatum from vacuum distillation products.
- Storage tanks for storing crude oil and finished products, usually vertical, cylindrical vessels with some sort of vapor emission control and surrounded by an earthen berm to contain spills.
Flow diagram of typical refinery
[edit]The image below is a schematic flow diagram of a typical oil refinery that depicts the various unit processes and the flow of intermediate product streams that occurs between the inlet crude oil feedstock and the final end products. The diagram depicts only one of the literally hundreds of different oil refinery configurations. The diagram also does not include any of the usual refinery facilities providing utilities such as steam, cooling water, and electric power as well as storage tanks for crude oil feedstock and for intermediate products and end products.[1][56][57][58]

There are many process configurations other than that depicted above. For example, the vacuum distillation unit may also produce fractions that can be refined into end products such as spindle oil used in the textile industry, light machine oil, motor oil, and various waxes.
Crude oil distillation unit
[edit]The crude oil distillation unit (CDU) is the first processing unit in virtually all petroleum refineries. The CDU distills the incoming crude oil into various fractions of different boiling ranges, each of which is then processed further in the other refinery processing units. The CDU is often referred to as the atmospheric distillation unit because it operates at slightly above atmospheric pressure.[1][2][41] Below is a schematic flow diagram of a typical crude oil distillation unit. The incoming crude oil is preheated by exchanging heat with some of the hot, distilled fractions and other streams. It is then desalted to remove inorganic salts (primarily sodium chloride).
Following the desalter, the crude oil is further heated by exchanging heat with some of the hot, distilled fractions and other streams. It is then heated in a fuel-fired furnace (fired heater) to a temperature of about 398 °C and routed into the bottom of the distillation unit.
The cooling and condensing of the distillation tower overhead is provided partially by exchanging heat with the incoming crude oil and partially by either an air-cooled or water-cooled condenser. Additional heat is removed from the distillation column by a pumparound system as shown in the diagram below.
As shown in the flow diagram, the overhead distillate fraction from the distillation column is naphtha. The fractions removed from the side of the distillation column at various points between the column top and bottom are called sidecuts. Each of the sidecuts (i.e., the kerosene, light gas oil, and heavy gas oil) is cooled by exchanging heat with the incoming crude oil. All of the fractions (i.e., the overhead naphtha, the sidecuts, and the bottom residue) are sent to intermediate storage tanks before being processed further.

Location of refineries
[edit]A party searching for a site to construct a refinery or a chemical plant needs to consider the following issues:
- The site has to be reasonably far from residential areas.
- Infrastructure should be available for the supply of raw materials and shipment of products to markets.
- Energy to operate the plant should be available.
- Facilities should be available for waste disposal.
Factors affecting site selection for oil refinery:
- Availability of land
- Conditions of traffic and transportation
- Conditions of utilities – power supply, water supply
- Availability of labours and resources
Refineries that use a large amount of steam and cooling water need to have an abundant source of water. Oil refineries, therefore, are often located nearby navigable rivers or on a seashore, nearby a port. Such location also gives access to transportation by river or by sea. The advantages of transporting crude oil by pipeline are evident, and oil companies often transport a large volume of fuel to distribution terminals by pipeline. A pipeline may not be practical for products with small output, and railcars, road tankers, and barges are used.
Petrochemical plants and solvent manufacturing (fine fractionating) plants need spaces for further processing of a large volume of refinery products, or to mix chemical additives with a product at source rather than at blending terminals.
Safety and environment
[edit]
The refining process releases a number of different chemicals into the atmosphere (see AP 42 Compilation of Air Pollutant Emission Factors) and a notable odor normally accompanies the presence of a refinery. Aside from air pollution impacts there are also wastewater concerns,[55] risks of industrial accidents such as fire and explosion, and noise health effects due to industrial noise.[59]
Many governments worldwide have mandated restrictions on contaminants that refineries release, and most refineries have installed the equipment needed to comply with the requirements of the pertinent environmental protection regulatory agencies. In the United States, there is strong pressure to prevent the development of new refineries, and no major refinery has been built in the country since Marathon's Garyville, Louisiana facility in 1976. However, many existing refineries have been expanded during that time. Environmental restrictions and pressure to prevent the construction of new refineries may have also contributed to rising fuel prices in the United States.[60] Additionally, many refineries (more than 100 since the 1980s) have closed due to obsolescence and/or merger activity within the industry itself.[61]
Environmental and safety concerns mean that oil refineries are sometimes located some distance away from major urban areas. Nevertheless, there are many instances where refinery operations are close to populated areas and pose health risks.[62][63] In California's Contra Costa County and Solano County, a shoreline necklace of refineries, built in the early 20th century before this area was populated, and associated chemical plants are adjacent to urban areas in Richmond, Martinez, Pacheco, Concord, Pittsburg, Vallejo and Benicia, with occasional accidental events that require "shelter in place" orders to the adjacent populations. A number of refineries are located in Sherwood Park, Alberta, directly adjacent to the City of Edmonton, which has a population of over 1,000,000 residents.[64]
NIOSH criteria for occupational exposure to refined petroleum solvents have been available since 1977.[65]
Worker health
[edit]Background
[edit]Modern petroleum refining involves a complicated system of interrelated chemical reactions that produce a wide variety of petroleum-based products.[66][67] Many of these reactions require precise temperature and pressure parameters.[68] The equipment and monitoring required to ensure the proper progression of these processes is complex, and has evolved through the advancement of the scientific field of petroleum engineering.[69][70]
The wide array of high pressure and/or high temperature reactions, along with the necessary chemical additives or extracted contaminants, produces an astonishing number of potential health hazards to the oil refinery worker.[71][72] Through the advancement of technical chemical and petroleum engineering, the vast majority of these processes are automated and enclosed, thus greatly reducing the potential health impact to workers.[73] However, depending on the specific process in which a worker is engaged, as well as the particular method employed by the refinery in which he/she works, significant health hazards remain.[74]
Although occupational injuries in the United States were not routinely tracked and reported at the time, reports of the health impacts of working in an oil refinery can be found as early as the 1800s. For instance, an explosion in a Chicago refinery killed 20 workers in 1890.[75] Since then, numerous fires, explosions, and other significant events have from time to time drawn the public's attention to the health of oil refinery workers.[76] Such events continue in the 21st century, with explosions reported in refineries in Wisconsin and Germany in 2018.[77]
However, there are many less visible hazards that endanger oil refinery workers.
Chemical exposures
[edit]Given the highly automated and technically advanced nature of modern petroleum refineries, nearly all processes are contained within engineering controls and represent a substantially decreased risk of exposure to workers compared to earlier times.[73] However, certain situations or work tasks may subvert these safety mechanisms, and expose workers to a number of chemical (see table above) or physical (described below) hazards.[78][79] Examples of these scenarios include:
- System failures (leaks, explosions, etc.).[80][81]
- Standard inspection, product sampling, process turnaround, or equipment maintenance/cleaning activities.[78][79]
A 2021 systematic review associated working in the petrochemical industry with increased risk of various cancers, such as mesothelioma. It also found reduced risks of other cancers, such as stomach and rectal. The systematic review did mention that several of the associations were not due to factors directly related to the petroleum industry, rather were related to lifestyle factors such as smoking. Evidence for adverse health effects for nearby residents was also weak, with the evidence primarily centering around neighborhoods in developed countries.[82]
BTX stands for benzene, toluene, xylene. This is a group of common volatile organic compounds (VOCs) that are found in the oil refinery environment, and serve as a paradigm for more in depth discussion of occupational exposure limits, chemical exposure and surveillance among refinery workers.[83][84]
The most important route of exposure for BTX chemicals is inhalation due to the low boiling point of these chemicals. The majority of the gaseous production of BTX occurs during tank cleaning and fuel transfer, which causes offgassing of these chemicals into the air.[85] Exposure can also occur through ingestion via contaminated water, but this is unlikely in an occupational setting.[86] Dermal exposure and absorption is also possible, but is again less likely in an occupational setting where appropriate personal protective equipment is in place.[86]
In the United States, the Occupational Safety and Health Administration (OSHA), National Institute for Occupational Safety and Health (NIOSH), and American Conference of Governmental Industrial Hygienists (ACGIH) have all established occupational exposure limits (OELs) for many of the chemicals above that workers may be exposed to in petroleum refineries.[87][88][89]
| OSHA PEL (8-hour TWA) | CalOSHA PEL (8-hour TWA) | NIOSH REL (10-hour TWA) | ACGIH TLV (8-hour TWA) | |
|---|---|---|---|---|
| Benzene | 10 ppm | 1 ppm | 0.1 ppm | 0.5 ppm |
| Toluene | 200 ppm | 10 ppm | 100 ppm | 20 ppm |
| Xylene | 100 ppmx | 100 ppm | 100 ppm | 100 ppm |
| Sources:[90][91][92][87][93] | ||||
Benzene, in particular, has multiple biomarkers that can be measured to determine exposure. Benzene itself can be measured in the breath, blood, and urine, and metabolites such as phenol, t,t-muconic acid (t,tMA) and S-phenylmercapturic acid (sPMA) can be measured in urine.[94] In addition to monitoring the exposure levels via these biomarkers, employers are required by OSHA to perform regular blood tests on workers to test for early signs of some of the feared hematologic outcomes, of which the most widely recognized is leukemia. Required testing includes complete blood count with cell differentials and peripheral blood smear "on a regular basis".[95] The utility of these tests is supported by formal scientific studies.[96]
Potential chemical exposure by process
[edit]| Process | Potential chemical exposure[97] | Common health concerns[98] |
| Solvent extraction and dewaxing | Phenol[99] | Neurologic symptoms, muscle weakness, skin irritation. |
| Furfural[100] | Skin irritation | |
| Glycols | Central nervous system depression, weakness, irritation of the eyes, skin, nose, throat. | |
| Methyl ethyl ketone[101] | Airway irritation, cough, dyspnea, pulmonary edema. | |
| Thermal cracking | Hydrogen sulfide[102] | Irritation of the respiratory tract, headache, visual disturbances, eye pain. |
| Carbon monoxide[103] | Electrocardiogram changes, cyanosis, headache, weakness. | |
| Ammonia[104] | Respiratory tract irritation, dyspnea, pulmonary edema, skin burns. | |
| Catalytic cracking | Hydrogen sulfide[102] | Irritation of the respiratory tract, headache, visual disturbances, eye pain. |
| Carbon monoxide[103] | Electrocardiogram changes, cyanosis, headache, weakness. | |
| Phenol[99] | Neurologic symptoms, muscle weakness, skin irritation. | |
| Ammonia[104] | Respiratory tract irritation, dyspnea, pulmonary edema, skin burns. | |
| Mercaptan[105][106] | Cyanosis and narcosis, irritation of the respiratory tract, skin, and eyes. | |
| Nickel carbonyl[107] | Headache, teratogen, weakness, chest/abdominal pain, lung and nasal cancer. | |
| Catalytic reforming | Hydrogen sulfide[102] | Irritation of the respiratory tract, headache, visual disturbances, eye pain. |
| Benzene[108] | Leukemia, nervous system effects, respiratory symptoms. | |
| Isomerization | Hydrochloric acid | Skin damage, respiratory tract irritation, eye burns. |
| Hydrogen chloride | Respiratory tract irritation, skin irritation, eye burns. | |
| Polymerization | Sodium hydroxide[109] | Irritation of the mucous membranes, skin, pneumonitis. |
| Phosphoric acid | Skin, eye, respiratory irritation. | |
| Alkylation | Sulfuric acid | Eye and skin burns, pulmonary edema. |
| Hydrofluoric acid | Bone changes, skin burns, respiratory tract damage. | |
| Sweetening and treating | Hydrogen sulfide[102] | Irritation of the respiratory tract, headache, visual disturbances, eye pain. |
| Sodium hydroxide[109] | Irritation of the mucous membranes, skin, pneumonitis. | |
| Unsaturated gas recovery | Monoethanolamine (MEA) | Drowsiness, irritation of the eyes, skin, and respiratory tract. |
| Diethanolamine (DEA) | Corneal necrosis, skin burns, irritation of the eyes, nose, throat. | |
| Amine treatment | Monoethanolamine (MEA) | Drowsiness, irritation of the eyes, skin, and respiratory tract. |
| Diethanolamine (DEA) | Corneal necrosis, skin burns, irritation of the eyes, nose, throat. | |
| Hydrogen sulfide[102] | Irritation of the respiratory tract, headache, visual disturbances, eye pain. | |
| Carbon dioxide | Headache, dizziness, paresthesia, malaise, tachycardia. | |
| Saturated gas extraction | Hydrogen sulfide[102] | Irritation of the respiratory tract, headache, visual disturbances, eye pain. |
| Carbon dioxide[110] | Headache, dizziness, paresthesia, malaise, tachycardia. | |
| Diethanolamine | Corneal necrosis, skin burns, irritation of the eyes, nose, throat. | |
| Sodium hydroxide[109] | Irritation of the mucous membranes, skin, pneumonitis. | |
| Hydrogen production | Carbon monoxide[103] | Electrocardiogram changes, cyanosis, headache, weakness. |
| Carbon dioxide[110] | Headache, dizziness, paresthesia, malaise, tachycardia. |
Physical hazards
[edit]Workers are at risk of physical injuries due to a large number of high-powered machines in the relatively close proximity of the oil refinery. The high pressure required for many of the chemical reactions also presents the possibility of localized system failures resulting in blunt or penetrating trauma from exploding system components.[111]
Heat is also a hazard. The temperature required for the proper progression of certain reactions in the refining process can reach 1,600 °F (870 °C).[73] As with chemicals, the operating system is designed to safely contain this hazard without injury to the worker. However, in system failures, this is a potent threat to workers' health. Concerns include both direct injury through a heat illness or injury, as well as the potential for devastating burns should the worker come in contact with super-heated reagents/equipment.[73]
Noise is another hazard. Refineries can be very loud environments, and have previously been shown to be associated with hearing loss among workers.[112] The interior environment of an oil refinery can reach levels in excess of 90 dB.[113][59] In the United States, an average of 90 dB is the permissible exposure limit (PEL) for an 8-hour work-day.[114] Noise exposures that average greater than 85 dB over an 8-hour require a hearing conservation program to regularly evaluate workers' hearing and to promote its protection.[115] Regular evaluation of workers' auditory capacity and faithful use of properly vetted hearing protection are essential parts of such programs.[116]
While not specific to the industry, oil refinery workers may also be at risk for hazards such as vehicle-related accidents, machinery-associated injuries, work in a confined space, explosions/fires, ergonomic hazards, shift-work related sleep disorders, and falls.[117]
Hazard controls
[edit]The theory of hierarchy of controls can be applied to petroleum refineries and their efforts to ensure worker safety.
Elimination and substitution are unlikely in petroleum refineries, as many of the raw materials, waste products, and finished products are hazardous in one form or another (e.g. flammable, carcinogenic).[97][118]
Examples of engineering controls include a fire detection/extinguishing system, pressure/chemical sensors to detect/predict loss of structural integrity,[119] and adequate maintenance of piping to prevent hydrocarbon-induced corrosion (leading to structural failure).[80][81][120][121] Other examples employed in petroleum refineries include the post-construction protection of steel components with vermiculite to improve heat/fire resistance.[122] Compartmentalization can help to prevent a fire or other systems failure from spreading to affect other areas of the structure, and may help prevent dangerous reactions by keeping different chemicals separate from one another until they can be safely combined in the proper environment.[119]
Administrative controls include careful planning and oversight of the refinery cleaning, maintenance, and turnaround processes. These occur when many of the engineering controls are shut down or suppressed and may be especially dangerous to workers. Detailed coordination is necessary to ensure that maintenance of one part of the facility will not cause dangerous exposures to those performing the maintenance, or to workers in other areas of the plant. Due to the highly flammable nature of many of the involved chemicals, smoking areas are tightly controlled and carefully placed.[78]
Personal protective equipment (PPE) may be necessary depending on the specific chemical being processed or produced. Particular care is needed during sampling of the partially completed product, tank cleaning, and other high-risk tasks as mentioned above. Such activities may require the use of impervious outerwear, acid hood, disposable coveralls, etc.[78] More generally, all personnel in operating areas should use appropriate hearing and vision protection, avoid clothes made of flammable material (nylon, Dacron, acrylic, or blends), and full-length pants and sleeves.[78]
Regulations
[edit]United States
[edit]Worker health and safety in oil refineries is closely monitored at a national level by both the Occupational Safety and Health Administration (OSHA) and National Institute for Occupational Safety and Health (NIOSH).[123][124] In addition to federal monitoring, California's CalOSHA has been particularly active in protecting worker health in the industry, and adopted a policy in 2017 that requires petroleum refineries to perform a "Hierarchy of Hazard Controls Analysis" (see above "Hazard controls" section) for each process safety hazard.[125] Safety regulations have resulted in a below-average injury rate for refining industry workers. In a 2018 report by the US Bureau of Labor Statistics, they indicate that petroleum refinery workers have a significantly lower rate of occupational injury (0.4 OSHA-recordable cases per 100 full-time workers) than all industries (3.1 cases), oil and gas extraction (0.8 cases), and petroleum manufacturing in general (1.3 cases).[126]
Below is a list of the most common regulations referenced in petroleum refinery safety citations issued by OSHA:[127]
- Flammable and Combustible Liquids (29 CFR 1910.106)
- The Hazard Communication (HazCom) standard (29 CFR 1910.1200)
- Permit-Required Confined Spaces (29 CFR 1910.146)
- Hazardous (Classified) Locations (29 CFR 1910.307)
- The Personal Protective Equipment (PPE) standard (29 CFR 1910.132)
- The Control of Hazardous Energy (Lockout/Tagout) standard (29 CFR 1910.147)
Corrosion
[edit]

Corrosion of metallic components is a major factor of inefficiency in the refining process. Because it leads to equipment failure, it is a primary driver for the refinery maintenance schedule. Corrosion-related direct costs in the U.S. petroleum industry as of 1996 were estimated at US$3.7 billion.[121][128]
Corrosion occurs in various forms in the refining process, such as pitting corrosion from water droplets, embrittlement from hydrogen, and stress corrosion cracking from sulfide attack.[129] From a materials standpoint, carbon steel is used for upwards of 80 percent of refinery components, which is beneficial due to its low cost. Carbon steel is resistant to the most common forms of corrosion, particularly from hydrocarbon impurities at temperatures below 205 °C, but other corrosive chemicals and environments prevent its use everywhere. Common replacement materials are low alloy steels containing chromium and molybdenum, with stainless steels containing more chromium dealing with more corrosive environments. More expensive materials commonly used are nickel, titanium, and copper alloys. These are primarily saved for the most problematic areas where extremely high temperatures and/or very corrosive chemicals are present.[130]
Corrosion is fought by a complex system of monitoring, preventative repairs, and careful use of materials. Monitoring methods include both offline checks taken during maintenance and online monitoring. Offline checks measure corrosion after it has occurred, telling the engineer when equipment must be replaced based on the historical information they have collected. This is referred to as preventative management.
Online systems are a more modern development and are revolutionizing the way corrosion is approached. There are several types of online corrosion monitoring technologies such as linear polarization resistance, electrochemical noise and electrical resistance. Online monitoring has generally had slow reporting rates in the past (minutes or hours) and been limited by process conditions and sources of error but newer technologies can report rates up to twice per minute with much higher accuracy (referred to as real-time monitoring). This allows process engineers to treat corrosion as another process variable that can be optimized in the system. Immediate responses to process changes allow the control of corrosion mechanisms, so they can be minimized while also maximizing production output.[120] In an ideal situation having on-line corrosion information that is accurate and real-time will allow conditions that cause high corrosion rates to be identified and reduced. This is known as predictive management.
Materials methods include selecting the proper material for the application. In areas of minimal corrosion, cheap materials are preferable, but when bad corrosion can occur, more expensive but longer-lasting materials should be used. Other materials methods come in the form of protective barriers between corrosive substances and the equipment metals. These can be either a lining of refractory material such as standard Portland cement or other special acid-resistant cement that is shot onto the inner surface of the vessel. Also available are thin overlays of more expensive metals that protect cheaper metal against corrosion without requiring much material.[131]
See also
[edit]- Acid gas
- AP 42 Compilation of Air Pollutant Emission Factors
- API oil-water separator
- Biorefinery
- Ethanol fuel
- Butanol fuel
- Gas flare
- H-Bio
- Industrial wastewater treatment
- K factor crude oil refining
- List of oil refineries
- Natural-gas processing
- Nelson complexity index
- Sour gas
- Atmospheric distillation of crude oil
- List of countries by oil production
References
[edit]- ^ a b c d e Gary, James H & Handwerk, Glenn E (1984). Petroleum Refining Technology and Economics (2nd ed.). Marcel Dekker. ISBN 978-0-8247-7150-8.
- ^ a b c Leffler, William L (1985). Petroleum refining for the nontechnical person (2nd ed.). PennWell. ISBN 978-0-87814-280-4.
- ^ a b Speight, James G (2006). The Chemistry and Technology of Petroleum (4th ed.). CRC Press. ISBN 0-8493-9067-2.
- ^ "Exxon starts world's 1st crude-cracking petrochemical unit". Reuters. January 8, 2014. Archived from the original on June 17, 2018. Retrieved April 13, 2018.
- ^ "Converting Crude to Ethylene Technology Breakthrough". August 2, 2016. Archived from the original on January 12, 2018. Retrieved April 13, 2018.
- ^ "Global oil refinery capacity by country 2020". Statista. Archived from the original on December 27, 2021. Retrieved December 27, 2021.
- ^ Cheary, Michael (March 19, 2015). "Oil & Gas: What is the downstream process?". Reed. Retrieved August 22, 2022.
- ^ a b c Deng & Wang 2011, p. 40.
- ^ a b Spataru, Catalina (2017). Whole Energy System Dynamics: Theory, Modelling and Policy. Routledge. ISBN 978-1-138-79990-5.
- ^ Feng, Lianyong; Hu, Yan; Hall, Charles A. S; Wang, Jianliang (2013). The Chinese Oil Industry: History and Future. Springer (published November 28, 2012). p. 2. ISBN 978-1-4419-9409-7.
- ^ Forbes, Robert James (1958). Studies in Early Petroleum History. Brill Publishers. p. 149. Archived from the original on March 15, 2020. Retrieved April 25, 2019.
- ^ Al-Hassani, Salim (2008). "1000 Years of Missing Industrial History". In Emilia Calvo Labarta; Mercè Comes Maymo; Roser Puig Aguilar; Mònica Rius Pinies (eds.). A shared legacy: Islamic science East and West. Edicions Universitat Barcelona. pp. 57–82 [63]. ISBN 978-84-475-3285-8.
- ^ Joseph P. Riva Jr.; Gordon I. Atwater. "petroleum". Encyclopædia Britannica. Archived from the original on June 19, 2008. Retrieved June 30, 2008.
- ^ Deng & Wang 2011, p. 41.
- ^ a b Holsten, Glenn; Danner, Blythe; Zielinski, William; Davidson, Tina (2002). Scenes from Modern Life: World Events: 1844–1856. PBS. ISBN 0-9718412-0-9. Archived from the original on July 5, 2017. Retrieved April 22, 2009.
- ^ Ion, Iulian; Mihalcea, Alexandru; Näffureanu, Sabin D. (April 3, 2019). "Beyond the Looking Glass: A YP's Guide to the Romanian Petroleum Industry". The Way Ahead. Archived from the original on August 22, 2022. Retrieved August 21, 2022.
- ^ Habashi, Fathi (2000). "The First Oil Well in the World" (PDF). Bulletin for the History of Chemistry. 25: 64–66. doi:10.70359/bhc2000v025p064. Archived (PDF) from the original on November 5, 2018. Retrieved November 4, 2018.
- ^ Fowler, T. M.; Moyer, James B. (1896). "Titusville, Pennsylvania 1896". Library of Congress. Archived from the original on August 22, 2022. Retrieved July 16, 2017.
- ^ Black, Brian (2000). Petrolia: the landscape of America's first oil boom. Johns Hopkins University Press. ISBN 978-0-8018-6317-2.
- ^ American Manufacturer and Iron World (1901). Greater Pittsburgh and Allegheny County, past, present, future. Pittsburgh. OCLC 665191640.
- ^ "Refining crude oil – refinery rankings". United States Energy Information Administration. January 1, 2022. Archived from the original on July 11, 2022. Retrieved August 17, 2022.
- ^ Blazev, Anco S. (July 6, 2016). Global Energy Market Trends. The Fairmont Press, Inc. ISBN 978-0-88173-755-4. Archived from the original on April 14, 2021. Retrieved December 1, 2020.
- ^ "North Dakota Builds A Refinery, First In The U.S. Since '76". Investor's Business Daily. April 11, 2013. Archived from the original on May 15, 2013. Retrieved August 24, 2014.
- ^ "White Paper on Refining Capacity" (PDF). Federal Trade Commission. April 2007. Archived from the original (PDF) on May 27, 2010.
- ^ "U. S. Operating Crude Oil Distillation Capacity". United States Energy Information Administration. July 29, 2022. Archived from the original on August 18, 2015. Retrieved November 5, 2011.
- ^ "2011 The U.S. Petroleum Industry: Statistics & Definitions" (PDF). Archived from the original (PDF) on September 27, 2011. Retrieved November 5, 2011.
- ^ White, Ronald D. (March 11, 2010). "Oil companies look at permanent refinery cutbacks". Los Angeles Times. Archived from the original on April 22, 2022. Retrieved April 22, 2022.
- ^ Álvarez, Eloy; Bravo, Manuel; Jiménez, Borja; Mourão, Ana; Schultes, Robert (November 2018). "The Oil and Gas value chain: a focus on oil refining" (PDF). Orkestra-Instituto Vasco de Competitividad. ISSN 2340-7638. Archived (PDF) from the original on March 19, 2022. Retrieved August 19, 2022.
- ^ International, Petrogav. Production Course for Hiring on Offshore Oil and Gas Rigs. Petrogav International. Archived from the original on April 14, 2021. Retrieved December 1, 2020.
- ^ Xu, Youhao; Zuo, Yanfen; Yang, Wenjie; Shu, Xingtian; Chen, Wei; Zheng, Anmin (November 1, 2023). "Targeted Catalytic Cracking to Olefins (TCO): Reaction Mechanism, Production Scheme, and Process Perspectives". Engineering. 30: 100–109. Bibcode:2023Engin..30..100X. doi:10.1016/j.eng.2023.02.018. ISSN 2095-8099.
- ^ "U.S. Energy Information Administration > Petroleum > Navigator > Refinery Yield". Archived from the original on March 6, 2011. Retrieved March 4, 2018.
- ^ Walther W. Irion, Otto S. Neuwirth, "Oil Refining" in Ullmann's Encyclopedia of Industrial Chemistry 2005, Wiley-VCH, Weinheim. doi:10.1002/14356007.a18_051
- ^ Shafiq, Iqrash; Shafique, Sumeer; Akhter, Parveen; Yang, Wenshu; Hussain, Murid (June 23, 2020). "Recent developments in alumina supported hydrodesulfurization catalysts for the production of sulfur-free refinery products: A technical review". Catalysis Reviews. 64: 1–86. doi:10.1080/01614940.2020.1780824. ISSN 0161-4940.
- ^ "Products made from petroleum". Ranken Energy Corporation. Archived from the original on April 16, 2021. Retrieved August 20, 2022.
- ^ Jean-Pierre Wauquier, ed. (2000). Petroleum Refining, Volume 2, Separation Processes. Paris: Editions Technip. ISBN 2-7108-0761-0. Archived from the original on April 14, 2021. Retrieved April 9, 2020.
- ^ Manning, Francis S.; Thompson, Richard E. (1995). Oilfield Processing, Volume 2: Crude oil. Tulsa, Oklahoma: Pennwell Books. ISBN 0-87814-354-8. Archived from the original on April 14, 2021. Retrieved April 9, 2020.
- ^ a b Beychok, Milton R. (1967). Aqueous Wastes from Petroleum and Petrochemical Plants (1st ed.). Wiley. LCCN 67019834.
- ^ "BEYOND BACK-TO-BASICS: PROCESS PRINCIPLES AND CONCEPTS-2: Understanding reflux in distillation towers". Oil & Gas Journal. July 3, 2017. Retrieved November 3, 2024.
- ^ a b Kroschwitz, Jacqueline I.; Seidel, Arza (2004). Kirk-Othmer Encyclopedia of Chemical Technology (5th ed.). Hoboken, New Jersey: Wiley. ISBN 0-471-48810-0.
- ^ a b McCabe, Warren L; Smith, Julian C; Harriott, Peter (2005). Unit Operations of Chemical Engineering (7th ed.). McGraw Hill. ISBN 0-07-284823-5. OCLC 300281532.
- ^ a b c Kister, Henry Z (1992). Distillation Design (1st ed.). McGraw-Hill. ISBN 0-07-034909-6.
- ^ a b King, Cary Judson (1980). Separation Processes (2nd ed.). McGraw Hill. ISBN 0-07-034612-7.
- ^ a b Perry, Robert H.; Green, Don W. (1984). Perry's Chemical Engineers' Handbook (6th ed.). McGraw-Hill. ISBN 0-07-049479-7.
- ^ a b Yamaguchi, Nancy (May 29, 2003). "Hydrodesulfurization Technologies and Costs" (PDF). Trans-Energy Research Associates. Archived from the original (PDF) on October 13, 2006. Retrieved August 21, 2022.
- ^ Dessau, Ralph (April 30, 1991). "Dehydrogenation, dehydrocyclization and reforming catalyst". Mobil Oil Corporation (Assignee). Archived from the original on September 27, 2020. Retrieved April 8, 2020.
- ^ "CCR Platforming" (PDF). uop.com. 2004. Archived from the original (PDF) on November 9, 2006.
- ^ "Study identifies optimum operating conditions for ULSD hydrotreaters". Oil & Gas Journal. August 4, 2003. Retrieved November 3, 2024.
- ^ James H. Gary; Glenn E. Handwerk (2001). Petroleum Refining: Technology and Economics (4th ed.). CRC Press. ISBN 0-8247-0482-7.
- ^ Reza Sadeghbeigi (2000). Fluid Catalytic Cracking Handbook (2nd ed.). Gulf Publishing. ISBN 0-88415-289-8.
- ^ Alfke, Gunter; Irion, Walther W.; Neuwirth, Otto S. Neuwirth (2007). "Oil Refining". Ullmann's Encyclopedia of Industrial Chemistry. doi:10.1002/14356007.a18_051.pub2. ISBN 978-3-527-30673-2.
- ^ Kraus, Richard S., ed. (2011). "Petroleum Refining Process". ILO Encyclopedia of Occupational Health and Safety. Geneva, Switzerland: International Labor Organization. Archived from the original on July 24, 2013.
- ^ Stefanidakis, G.; Gwyn, J.E. (1993). "Alkylation". In John J. McKetta (ed.). Chemical Processing Handbook. CRC Press. pp. 80–138. ISBN 0-8247-8701-3.
- ^ "Sulfur" (PDF). United States Geological Survey. January 2005. Archived (PDF) from the original on August 22, 2022. Retrieved August 22, 2022.
- ^ "Mineral Resource of the Month: Sulfur". American Geological Institute. July 2003. Archived from the original on May 27, 2012. Retrieved August 22, 2022.
- ^ a b Beychok, Milton R. (1967). Aqueous Wastes from Petroleum and Petrochemical Plants (1st ed.). John Wiley & Sons. LCCN 67019834.
- ^ "Gasoline Refining and Testing". Chevron Corporation. Archived from the original on August 8, 2006. Retrieved August 22, 2022.
- ^ "An example flowchart". cheresources.com. Archived from the original on June 22, 2001.
- ^ "Crude Oil Solids Removal". suez. Archived from the original on March 20, 2019. Retrieved August 19, 2022.
- ^ a b Morata, Thais C; Engel, Terry; Durão, Alvaro; Costa, Thelma RS; Krieg, Edward F; Dunn, Derek E; Lozano, Maria Angelica (January 1997). "Hearing Loss from Combined Exposures among Petroleum Refinery Workers". Scandinavian Audiology. 26 (3): 141–149. doi:10.3109/01050399709074987. ISSN 0105-0397. PMID 9309809.
- ^ Hargreaves, Steve (April 17, 2007). "Behind high gas prices: The refinery crunch". CNN Money. Archived from the original on December 25, 2011. Retrieved November 5, 2011.
- ^ "U.S. Number of Operable Refiniries as of January 1". United States Energy Information Administration. June 21, 2022. Archived from the original on August 20, 2022. Retrieved August 19, 2022.
- ^ Flower, Patrick; Ragas, Wade (1994). "The Effects of Refineries on Neighborhood Property Values". Journal of Real Estate Research. 9 (3): 319–338. doi:10.1080/10835547.1994.12090756. ISSN 0896-5803. Archived from the original on August 22, 2022. Retrieved August 19, 2022.
- ^ Smargiassi, Audrey; Kosatsky, Tom; Hicks, John; Plante, Céline; Armstrong, Ben; Villeneuve, Paul J.; Goudreau, Sophie (April 1, 2009). "Risk of Asthmatic Episodes in Children Exposed to Sulfur Dioxide Stack Emissions from a Refinery Point Source in Montreal, Canada". Environmental Health Perspectives. 117 (4): 653–659. Bibcode:2009EnvHP.117..653S. doi:10.1289/ehp.0800010. PMC 2679612. PMID 19440507.
- ^ Dion, Andrea (February 10, 2022). "Edmonton surpasses 1M residents in latest census". CFRN-DT. Archived from the original on March 9, 2022. Retrieved August 19, 2022.
- ^ "Criteria for a Recommended Standard: Occupational Exposure to Refined Petroleum Solvents (77–192)". National Institute for Occupational Safety and Health. June 6, 2014. Archived from the original on July 9, 2022. Retrieved August 19, 2022.
- ^ Gudde, Nicholas J (February 20, 2017). "Adaptation of oil refineries to make modern fuels". Proceedings of the Institution of Mechanical Engineers, Part D: Journal of Automobile Engineering. 232 (1): 5–21. doi:10.1177/0954407016680522. ISSN 0954-4070.
- ^ Oil Refining and Products. Vol. 4. December 31, 2004. pp. 715–729. Retrieved November 17, 2018.
- ^ Gary, James (2001). Petroleum Refining: Technology and Economics. New York, NY: Marcel Dekker. ISBN 978-0-8247-0482-7.
- ^ Mohaghegh, Shahab D. (April 1, 2005). "Recent Developments in Application of Artificial Intelligence in Petroleum Engineering". Journal of Petroleum Technology. 57 (4): 86–91. doi:10.2118/89033-JPT. ISSN 0149-2136. Archived from the original on November 25, 2018. Retrieved November 25, 2018.
- ^ Hsu, Chang Samuel (2017). Handbook of Petroleum Technology. Springer. ISBN 978-3-319-49347-3.
- ^ "Refinery Safety at a Glance". www.afpm.org. Archived from the original on November 25, 2018. Retrieved November 17, 2018.
- ^ DIR. "Process Safety Management for Petroleum Refineries". www.dir.ca.gov. Archived from the original on November 25, 2018. Retrieved November 17, 2018.
- ^ a b c d "Process Safety Management for Petroleum Refineries" (PDF). Occupational Safety and Health Administration. Archived (PDF) from the original on April 29, 2018. Retrieved November 25, 2018.
- ^ Witter, Roxana Z.; Tenney, Liliana; Clark, Suzanne; Newman, Lee S. (July 2014). "Occupational Exposures in the Oil and Gas Extraction Industry: State of the Science and Research Recommendations". American Journal of Industrial Medicine. 57 (7): 847–856. doi:10.1002/ajim.22316. ISSN 0271-3586. PMC 4469339. PMID 24634090.
- ^ "Total safety: how safety has evolved in the oil and gas industry" (PDF). www.totalsafety.com. Archived (PDF) from the original on December 15, 2018. Retrieved December 11, 2018.
- ^ "33 accidents happened at oil refineries as EPA delayed updating disaster rule, says environmentalist group". Daily Breeze. April 4, 2018. Archived from the original on June 15, 2018. Retrieved December 11, 2018.
- ^ "German refinery explosion: Eight injured and 1,800 evacuated". BBC. September 1, 2018. Archived from the original on January 15, 2021. Retrieved August 22, 2022.
- ^ a b c d e "Oil Refineries and Petrochemical Plants" (PDF). Infrastructure Health & Safety Association. Archived (PDF) from the original on November 25, 2018. Retrieved November 25, 2018.
- ^ a b "Environmental, Health and Safety Guidelines for Petroleum Refining" (PDF). World Bank Group. November 17, 2016. Archived (PDF) from the original on November 25, 2018. Retrieved November 25, 2018.
- ^ a b Gyoung Taek Kim; Hyun Sik Hwang; Sung Lyong Oh; Byong Mu Kim (January 1, 2010). Case Studies Of Corrosion Failures In Oil Refineries. NACE Corrosion. Archived from the original on November 25, 2018. Retrieved November 25, 2018.
- ^ a b Heraty, Maureen (2013). "Corrosion-Related Accidents in Petroleum Refineries" (PDF). European Commission Joint Research Centre. Archived (PDF) from the original on October 13, 2017. Retrieved November 25, 2018.
- ^ Onyije FM, Hosseini B, Togawa K, et al. (April 2021). "Cancer Incidence and Mortality among Petroleum Industry Workers and Residents Living in Oil Producing Communities: A Systematic Review and Meta-Analysis". International Journal of Environmental Research and Public Health. 18 (8): 4343. doi:10.3390/ijerph18084343. PMC 8073871. PMID 33923944.
- ^ Baltrėnas, Pranas; Baltrėnaitė, Edita; Serevičienė, Vaida; Pereira, Paulo (November 2011). "Atmospheric BTEX concentrations in the vicinity of the crude oil refinery of the Baltic region". Environmental Monitoring and Assessment. 182 (1–4): 115–127. Bibcode:2011EMnAs.182..115B. doi:10.1007/s10661-010-1862-0. ISSN 1573-2959. PMID 21243423. S2CID 37042955.
- ^ "Estimation of VOC Emission in Petroleum Refinery ETP and Comparative Analysis with Measured VOC Emission Rate" (PDF). www.theijes.com. ISSN 2319-1813. Archived (PDF) from the original on August 9, 2017. Retrieved December 11, 2018.
- ^ Heibati, Behzad; Godri Pollitt, Krystal J.; Charati, Jamshid Yazdani; Ducatman, Alan; Shokrzadeh, Mohammad; Karimi, Ali; Mohammadyan, Mahmoud (2018). "Biomonitoring-based exposure assessment of benzene, toluene, ethylbenzene and xylene among workers at petroleum distribution facilities". Ecotoxicology and Environmental Safety. 149: 19–25. Bibcode:2018EcoES.149...19H. doi:10.1016/j.ecoenv.2017.10.070. PMID 29145162. Retrieved December 11, 2018.
- ^ a b Domingo, José L.; Schuhmacher, Marta; López, Eva (May 1, 2008). "Human health risks of petroleum-contaminated groundwater". Environmental Science and Pollution Research. 15 (3): 278–288. Bibcode:2008ESPR...15..278L. doi:10.1065/espr2007.02.390. ISSN 1614-7499. PMID 18504848. S2CID 28907459.
- ^ a b "Annotated PELs Table Z-1". Occupational Safety and Health Administration. Archived from the original on June 19, 2018. Retrieved December 10, 2018.
- ^ "Annotated PELs Table Z-2". Occupational Safety and Health Administration. Archived from the original on December 10, 2018. Retrieved December 10, 2018.
- ^ "Annotated PELs Table Z-3". Occupational Safety and Health Administration. Archived from the original on December 10, 2018. Retrieved December 10, 2018.
- ^ "Immediately Dangerous to Life or Health Concentrations (IDLH): Benzene". Centers for Disease Control and Prevention. December 4, 2014. Archived from the original on May 13, 2022. Retrieved August 18, 2022.
- ^ "California Code of Regulatoins, Title 8, Section 5218. Benzene". California Department of Industrial Relations. Archived from the original on April 1, 2022. Retrieved August 18, 2022.
- ^ Dinuoscio, Connie (January 15, 2022). "Xylene (All Isomers)". American Conference of Governmental Industrial Hygienists. Archived from the original on August 22, 2022. Retrieved August 22, 2022.
- ^ "Benzene". National Institute for Occupational Safety and Health. December 4, 2014. Archived from the original on May 13, 2022. Retrieved August 22, 2022.
- ^ Weisel, Clifford P. (March 19, 2010). "Benzene exposure: An overview of monitoring methods and their findings". Chemico-Biological Interactions. 184 (1–2): 58–66. Bibcode:2010CBI...184...58W. doi:10.1016/j.cbi.2009.12.030. ISSN 0009-2797. PMC 4009073. PMID 20056112.
- ^ "Medical surveillance guidelines for Benzene – 1910.1028 App C". Occupational Safety and Health Administration. Archived from the original on December 15, 2018. Retrieved December 12, 2018.
- ^ Turk, Rajka; Zavalić, Marija; Bogadi-Šare, Ana (November 1, 2003). "Utility of a routine medical surveillance program with benzene exposed workers". American Journal of Industrial Medicine. 44 (5): 467–473. doi:10.1002/ajim.10296. ISSN 1097-0274. PMID 14571510.
- ^ a b "OSHA Technical Manual (OTM) | Section IV: Chapter 2 – Petroleum Refining Process". Occupational Safety and Health Administration. Archived from the original on November 25, 2018. Retrieved November 17, 2018.
- ^ "CDC – NIOSH Pocket Guide to Chemical Hazards (NPG) Search". Centers for Disease Control and Prevention. October 18, 2018. Archived from the original on November 25, 2018. Retrieved November 17, 2018.
- ^ a b Sittert, N. J. van; Boogaard, P. J. (September 1, 1995). "Biological monitoring of exposure to benzene: a comparison between S-phenylmercapturic acid, trans,trans-muconic acid, and phenol". Occupational and Environmental Medicine. 52 (9): 611–620. doi:10.1136/oem.52.9.611. ISSN 1470-7926. PMC 1128315. PMID 7550802.
- ^ McClellan, William A.; Wong, Otto; Gibson, Roy L.; Weiss, Nancy S.; Tsai, Shan P.; Wen, C. P. (January 1, 1985). "Long-Term Mortality Study of Oil Refinery Workers. IV. Exposure to the Lubricating-Dewaxing Process". Journal of the National Cancer Institute. 74 (1): 11–18. doi:10.1093/jnci/74.1.11. ISSN 0027-8874. PMID 3855471.
- ^ Ikeda, M.; Higashikawa, K.; Sakamoto, K.; Miyama, Y.; Takeuchi, A.; Zhang, Z.-W.; Kawai, T. (January 1, 2003). "Methyl isobutyl ketone and methyl ethyl ketone in urine as biological markers of occupational exposure to these solvents at low levels". International Archives of Occupational and Environmental Health. 76 (1): 17–23. Bibcode:2003IAOEH..76...17K. doi:10.1007/s00420-002-0374-9. ISSN 1432-1246. PMID 12592578. S2CID 26371461.
- ^ a b c d e f Hessel, Patrick A.; Herbert, F. Alex; Melenka, Lyle S.; Yoshida, Ken; Nakaza, Mahashiro (May 1, 1997). "Lung health in relation to hydrogen sulfide exposure in oil and gas workers in Alberta, Canada". American Journal of Industrial Medicine. 31 (5): 554–557. doi:10.1002/(SICI)1097-0274(199705)31:5<554::AID-AJIM9>3.0.CO;2-T. ISSN 1097-0274. PMID 9099357.
- ^ a b c Madani, Ismail M.; Khalfan, Sameer; Khalfan, Hussain; Jidah, Jasim; Nabeel Aladin, M. (April 1, 1992). "Occupational exposure to carbon monoxide during charcoal meat grilling". Science of the Total Environment. 114: 141–147. Bibcode:1992ScTEn.114..141M. doi:10.1016/0048-9697(92)90420-W. ISSN 0048-9697. PMID 1594919.
- ^ a b Thurston, Sally W.; Ryan, Louise; Christiani, David C.; Snow, Rachel; Carlson, Jerold; You, Liangya; Cui, Shangcong; Ma, Guohong; Wang, Lihua (November 1, 2000). "Petrochemical exposure and menstrual disturbances". American Journal of Industrial Medicine. 38 (5): 555–564. doi:10.1002/1097-0274(200011)38:5<555::AID-AJIM8>3.0.CO;2-E. ISSN 1097-0274. PMID 11025497.
- ^ Tjalvin, Gro (February 2, 2018). Health in the aftermath of a malodorous chemical explosion: Subjective health complaints and post-traumatic stress symptoms among workers. The University of Bergen. ISBN 978-82-308-3848-8. Archived from the original on December 15, 2018. Retrieved December 11, 2018.
- ^ Bråtveit, M.; Moen, B. E.; Hollund, B. E.; Lygre, S. H. L.; Tjalvin, G. (April 1, 2015). "Health complaints after a malodorous chemical explosion: a longitudinal study". Occupational Medicine. 65 (3): 202–209. doi:10.1093/occmed/kqu203. hdl:1956/17384. ISSN 0962-7480. PMID 25638209. Archived from the original on December 16, 2018. Retrieved December 11, 2018.
- ^ Kincaid, John F.; Sunderman, F. William (July 3, 1954). "Nickel Poisoning". Journal of the American Medical Association. 155 (10): 889–894. doi:10.1001/jama.1954.03690280013003. ISSN 0002-9955. PMID 13162820.
- ^ Wong, Otto; Raabe, Gerhard K. (May 2000). "Non-Hodgkin's Lymphoma and Exposure to Benzene in a Multinational Cohort of More Than 308,000 Petroleum Workers, 1937 to 1996". Journal of Occupational and Environmental Medicine. 42 (5): 554–68. doi:10.1097/00043764-200005000-00016. ISSN 1076-2752. PMID 10824308.
- ^ a b c Toxicology, National Research Council (US) Committee on (1984). SODIUM HYDROXIDE. National Academies Press (US). Archived from the original on February 9, 2021. Retrieved December 11, 2018.
- ^ a b Langford, Nigel J. (December 1, 2005). "Carbon Dioxide Poisoning". Toxicological Reviews. 24 (4): 229–235. doi:10.2165/00139709-200524040-00003. ISSN 1176-2551. PMID 16499405. S2CID 22508841.
- ^ "OSHA Technical Manual (OTM) | Section IV: Chapter 5 – Pressure Vessel Guidelines | Occupational Safety and Health Administration". Occupational Safety and Health Administration. Archived from the original on November 25, 2018. Retrieved November 24, 2018.
- ^ Chen, Jong-Dar; Tsai, Jui-Yuan (2003). "Hearing Loss among Workers at an Oil Refinery in Taiwan". Archives of Environmental Health. 58 (1): 55–58. doi:10.3200/aeoh.58.1.55-58. PMID 12747520. S2CID 26224860.
- ^ WACHASUNDER, SUDHEER (August 2004). "Assesment [sic] of refinery noise impact on workers – a case study". International Journal of Environmental Studies. 61 (4): 459–470. doi:10.1080/0020723032000163146. ISSN 0020-7233. S2CID 111340306.
- ^ "OSHA PEL Noise". Archived from the original on November 25, 2018. Retrieved November 25, 2018.
- ^ "1910.95 – Occupational noise exposure. | Occupational Safety and Health Administration". Occupational Safety and Health Administration. Archived from the original on November 11, 2018. Retrieved November 18, 2018.
- ^ "Safety and Health Topics | Occupational Noise Exposure | Occupational Safety and Health Administration". Occupational Safety and Health Administration. Archived from the original on November 25, 2018. Retrieved November 18, 2018.
- ^ "Safety and Health Topics | Oil and Gas Extraction – Safety Hazards Associated with Oil and Gas Extraction Activities | Occupational Safety and Health Administration". Occupational Safety and Health Administration. Archived from the original on December 10, 2018. Retrieved December 10, 2018.
- ^ "Petrochemical hazard control". www.hsmemagazine.com. Archived from the original on December 10, 2018. Retrieved December 10, 2018.
- ^ a b "Safety and Health Topics | Oil and Gas Extraction – Safety Hazards Associated with Oil and Gas Extraction Activities | Occupational Safety and Health Administration". Occupational Safety and Health Administration. Archived from the original on December 10, 2018. Retrieved December 10, 2018.
- ^ a b R.D. Kane, D.C. Eden, and D.A. Eden, Innovative Solutions Integrate Corrosion Monitoring with Process Control, Mater. Perform., Feb 2005, p 36–41.
- ^ a b Corrosion Costs and Preventive Strategies in the United States Archived 2012-11-13 at the Wayback Machine, a publication of NACE International.
- ^ Amin, M. S.; Hashem, F. S.; El-Gamal, S. M. A. (July 1, 2012). "Thermal resistance of hardened cement pastes containing vermiculite and expanded vermiculite". Journal of Thermal Analysis and Calorimetry. 109 (1): 217–226. doi:10.1007/s10973-011-1680-9. ISSN 1572-8943. S2CID 137153346.
- ^ "CDC – NIOSH Program Portfolio : Oil and Gas Extraction: Economics". www.cdc.gov. Archived from the original on June 23, 2017. Retrieved December 11, 2018.
- ^ "Safety and Health Topics | Oil and Gas Extraction | Occupational Safety and Health Administration". Occupational Safety and Health Administration. Archived from the original on December 11, 2018. Retrieved December 11, 2018.
- ^ "NOTICE PUBLICATION/REGULATIONS SUBMISSION" (PDF). www.dir.ca.gov. Archived (PDF) from the original on January 10, 2019. Retrieved December 10, 2018.
- ^ "TABLE 1. Incidence rates of nonfatal occupational injuries and illnesses by industry and case types, 2017". www.bls.gov. Archived from the original on December 10, 2018. Retrieved June 21, 2020.
- ^ "Process safety management for petroleum refineries" (PDF). Occupational Safety and Health Administration. Archived (PDF) from the original on April 29, 2018. Retrieved December 10, 2018.
- ^ Kane, Russell D. (2006). "Corrosion in Petroleum Refining and Petrochemical Operations". In Cramer, Stephen D.; Covino Bernard S. Jr, Bernard S. (eds.). Corrosion: Environments and Industries. Vol. 13C. ASM International. pp. 967–1014. doi:10.31399/asm.hb.v13c.a0004211. ISBN 978-1-62708-184-9.
- ^ Skinner, E N; Mason, J F; Moran, J J (December 1, 1960). "High Temperature Corrosion in Refinery and Petrochemical Service". Corrosion. 16 (12): 593–600. doi:10.5006/0010-9312-16.12.85. Retrieved August 22, 2022.
- ^ Hildebrand, E L (1972). "Materials Selection for Petroleum Refineries and Petrochemical Plants". Material Protection Performance. 11 (7): 19–22. Retrieved August 22, 2022.
- ^ McGill, W A; Weinbaum, M J (October 9, 1972). "Aluminum-diffused steel lasts longer". Oil & Gas Journal. 70 (41): 66–69. ISSN 0030-1388. Retrieved August 22, 2022.
Bibliography
[edit]- Deng, Yinke; Wang, Pinxing (2011). Ancient Chinese Inventions. Cambridge University Press. ISBN 978-0-521-18692-6. OCLC 671710733.
External links
[edit]- Interactive map of UK refineries
- Searchable United States Refinery Map
- Complete, detailed refinery description
- Ecomuseum Bergslagen – history of Oljeön, Sweden
- Fueling Profits: Report on Industry Consolidation (publication of the Consumer Federation of America)
- Price Spikes, Excess Profits and Excuses (publication of the Consumer Federation of America)
- 2022 AFPM Refinery Listing (free) with Detailed Unit Information (note the data is collected annually by the US Dept. of Energy)
- National Occupational Research Agenda Oil and gas Extraction Council