
Community hub
Recent from talks
Contribute something
Nothing was collected or created yet.
Atlantic meridional overturning circulation
View on Wikipedia

The Atlantic meridional overturning circulation (AMOC) is the main ocean current system in the Atlantic Ocean.[1]: 2238 It is a component of Earth's ocean circulation system and plays an important role in the climate system. The AMOC includes Atlantic currents at the surface and at great depths that are driven by changes in weather, temperature and salinity. Those currents comprise half of the global thermohaline circulation that includes the flow of major ocean currents, the other half being the Southern Ocean overturning circulation.[2]
The AMOC is composed of a northward flow of warm, more saline water in the Atlantic's upper layers and a southward, return flow of cold, less salty, deep water. Warm water from the south is more saline ('halocline') because of the higher evaporation rate in the tropical zone. The warm saline water forms the upper layer of the ocean ('thermocline'), but when this layer cools down, the density of the salty water increases, making it sink into the deep. This is an important part of the motor of the AMOC system. The limbs are linked by regions of overturning in the Nordic Seas and the Southern Ocean. Overturning sites are associated with intense exchanges of heat, dissolved oxygen, carbon and other nutrients, and very important for the ocean's ecosystems and its function as a carbon sink.[3][4] Changes in the strength of the AMOC can affect multiple elements of the climate system.[1]: 2238
Climate change may weaken the AMOC through increases in ocean heat content and elevated flows of freshwater from melting ice sheets.[5] Studies using oceanographic reconstructions suggest that as of 2015[update], the AMOC was weaker than before the Industrial Revolution.[6][7] There is debate over the relative contributions of different factors and it is unclear how much of this weakening is due to climate change or the circulation's natural variability over millennia.[8][9] Climate models predict the AMOC will further weaken during the 21st century.[10]: 19 This weakening would reduce average air temperatures over Scandinavia, Great Britain, and Ireland, because these regions are warmed by the North Atlantic Current.[11] Weakening of the AMOC would also accelerate sea level rise around North America and reduce primary production in the North Atlantic.[12]
Severe weakening of the AMOC may lead to a collapse of the circulation, which would not be easily reversible and thus constitutes one of the tipping points in the climate system.[13] A collapse would substantially lower the average temperature and amount of rain and snowfall in Europe.[14][15] It may also raise the frequency of extreme weather events and have other severe effects.[16][17]
Overall structure
[edit]
The Atlantic meridional overturning circulation (AMOC) is the main current system in the Atlantic Ocean[1]: 2238 and is also part of the global thermohaline circulation, which connects the world's oceans with a single "conveyor belt" of continuous water exchange.[18] Normally, relatively warm, less-saline water stays on the ocean's surface while deep layers are colder, denser and more-saline, in what is known as ocean stratification.[19] Deep water eventually gains heat and/or loses salinity in an exchange with the mixed ocean layer, and becomes less dense and rises towards the surface. Differences in temperature and salinity exist between ocean layers and between parts of the World Ocean, and together they drive the thermohaline circulation.[18] The Pacific Ocean is less saline than the other oceans because it receives large quantities of fresh rainfall.[20] Its surface water is insufficiently saline to sink lower than several hundred meters, meaning deep ocean water must come from elsewhere.[18]
Ocean water in the North Atlantic is more saline than that in the Pacific, partly because extensive evaporation on the surface concentrates salt within the remaining water and partly because sea ice near the Arctic Circle expels salt as it freezes during winter.[21] Even more importantly, evaporated moisture in the Atlantic is swiftly carried away by atmospheric circulation before it can fall back as rain. Trade winds move this moisture across Central America and to the eastern North Pacific, where it falls as rain.[22] Major mountain ranges such as the Tibetan Plateau, the Rocky Mountains and the Andes prevent any equivalent moisture transport back to the Atlantic.[23]
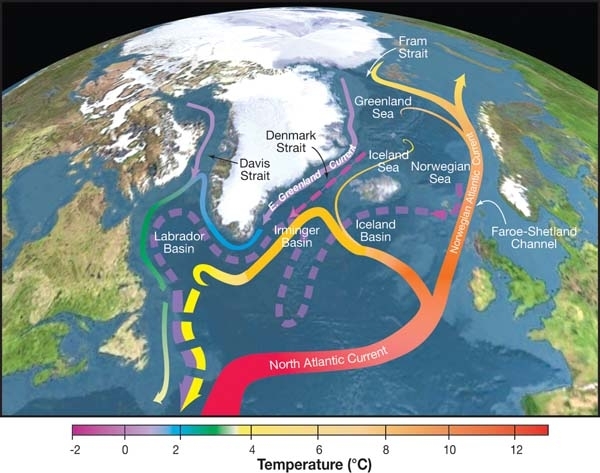
Due to this process, Atlantic surface water becomes salty and therefore dense, eventually downwelling to form the North Atlantic Deep Water (NADW).[24] NADW formation primarily occurs in the Nordic Seas and involves a complex interplay of regional water masses such as the Denmark Strait Overflow Water (DSOW), Iceland-Scotland Overflow Water (ISOW) and Nordic Seas Overflow Water.[25] Labrador Sea Water may play an important role as well but increasing evidence suggests water in Labrador and Irminger Seas primarily recirculates through the North Atlantic Gyre and has little connection with the rest of the AMOC.[4][26][14]

The NADW is not the deepest water layer in the Atlantic Ocean; the Antarctic bottom water (AABW) is always the densest, deepest ocean layer in any basin deeper than 4,000 metres (2.5 mi).[27] As the upper reaches of the AABW flow upwells, it melds into and reinforces the NADW. The formation of the NADW is also the beginning of the lower cell of the circulation.[18][3] The downwelling that forms the NADW is balanced by an equal amount of upwelling. In the western Atlantic, Ekman transport, the increase in ocean-layer mixing caused by wind activity, results in strong upwelling in the Canary Current and the Benguela Current, which are located on the northwest and southwest coasts of Africa. As of 2014[update], upwelling is substantially stronger around the Canary Current than the Benguela Current, though an opposite pattern existed until the closure of the Central American Seaway during the late Pliocene.[28] In the Eastern Atlantic, significant upwelling occurs only during certain months of the year because this region's deep thermocline means it is more dependent on the state of sea surface temperature than on wind activity. There is also a multi-year upwelling cycle that occurs in synchronization with the El Niño/La Niña cycle.[29]
At the same time, the NADW moves southward and at the southern end of the Atlantic transect, around 80% of it upwells in the Southern Ocean,[24][30] connecting it with the Southern Ocean overturning circulation (SOOC).[31] After upwelling, the water is understood to take one of two pathways. Water surfacing close to Antarctica will likely be cooled by Antarctic sea ice and sink back into the lower cell of the circulation. Some of this water will rejoin the AABW but the rest of the lower-cell flow will eventually reach the depths of the Pacific and Indian oceans.[18] Water that upwells at lower, ice-free latitudes moves further northward due to Ekman transport and is committed to the upper cell. The warm water in the upper cell is responsible for the return flow to the North Atlantic, which occurs mainly around the coast of Africa[clarification needed] and through the Indonesian archipelago. Once this water returns to the North Atlantic, it becomes cooler and denser, and sinks, feeding back into the NADW.[31][24]
Role in the climate system
[edit]
Equatorial areas are the hottest part of the globe; due to thermodynamics, this heat moves towards the poles. Most of this heat is transported by atmospheric circulation but warm, surface ocean currents play an important role. Heat from the equator moves either northward or southward; the Atlantic Ocean is the only ocean in which the heat flow is northward.[33] Much of the heat transfer in the Atlantic occurs due to the Gulf Stream, a surface current that carries warm water northward from the Caribbean. While the Gulf Stream as a whole is driven by winds alone, its northern-most segment, the North Atlantic Current, obtains much of its heat from thermohaline exchange in the AMOC.[3] Thus, the AMOC carries up to 25% of the total heat toward the northern hemisphere,[33] and plays an important role in the climate around northwest Europe.[34]
Because atmospheric patterns also play a large role in heat transfer, the idea the climate in northern Europe would be as cold as that in northern North America without heat transport via ocean currents (i.e. up to 15–20 °C (27–36 °F) colder) is generally considered incorrect.[35][36] While one modeling study suggested collapse of the AMOC could result in Ice Age-like cooling, including sea-ice expansion and mass glacier formation, within a century,[37][38] the accuracy of those results is questionable.[39] There is a consensus the AMOC keeps northern and western Europe warmer than it would be otherwise,[16] with the difference of 4 °C (7.2 °F) and 10 °C (18 °F) depending on the area.[14] For instance, studies of the Florida Current suggest the Gulf Stream was around 10% weaker from around 1200 to 1850 due to increased surface salinity, and this likely contributed to the conditions known as Little Ice Age.[40]
The AMOC makes the Atlantic Ocean into a more-effective carbon sink in two major ways. Firstly, the upwelling that takes place supplies large quantities of nutrients to the surface waters, supporting the growth of phytoplankton and therefore increasing marine primary production and the overall amount of photosynthesis in the surface waters. Secondly, upwelled water has low concentrations of dissolved carbon because the water is typically 1,000 years old and has not been exposed to anthropogenic CO2 increases in the atmosphere. This water absorbs larger quantities of carbon than the more-saturated surface waters and is prevented from releasing carbon back into the atmosphere when it is downwelled.[41] While Southern Ocean is by far the strongest ocean carbon sink,[42] The North Atlantic is the largest single carbon sink in the northern hemisphere.[43]
Abrupt changes during the Late Pleistocene
[edit]
Because the Atlantic meridional overturning circulation (AMOC) is dependent on a series of interactions between layers of ocean water of varying temperature and salinity, it is not static but experiences small, cyclical changes[45][8] and larger, long-term shifts in response to external forcings.[46] Many of those shifts occurred during the Late Pleistocene (126,000 to 11,700 years ago), which was the final geological epoch before the current Holocene.[47] It also includes the Last Glacial Period, which is colloquially known as the "last ice age".[48] Twenty-five abrupt temperature oscillations between the hemispheres occurred during this period; these oscillations are known as Dansgaard–Oeschger events (D-O events) after Willi Dansgaard and Hans Oeschger, who discovered them by analyzing Greenland ice cores in the 1980s.[49][50]
D-O events are best known for the rapid warming of between 8 °C (15 °F) and 15 °C (27 °F) that occurred in Greenland over several decades.[48] Warming also occurred over the entire North Atlantic region but equivalent cooling over the Southern Ocean also occurred during these events. This is consistent with the strengthened AMOC transporting more heat from one hemisphere to another.[51] The warming of the northern hemisphere would have caused ice-sheet melting and many D-O events appear to have been ended by Heinrich events, in which massive streams of icebergs broke off from the then-present Laurentide ice sheet. As the icebergs melted in the ocean, the ocean water would have become fresher, weakening the circulation and stopping the D-O warming.[44]
There is not yet a consensus explanation for why AMOC would have fluctuated so much, and only during this glacial period.[52][53] Common hypotheses include cyclical patterns of salinity change in the North Atlantic or a wind-pattern cycle due to the growth and decline of the region's ice sheets, which are large enough to affect wind patterns.[48] As of late 2010s, some research suggests the AMOC is most-sensitive to change during periods of extensive ice sheets and low CO2,[54] making the Last Glacial Period a "sweet spot" for such oscillations.[53] It has been suggested the warming of the southern hemisphere would have initiated the pattern as warmer waters spread north through the overall thermohaline circulation.[52][51] The paleoclimate evidence is not currently strong enough to say whether the D-O events started with changes in the AMOC or whether the AMOC changed in response to another trigger.[55] For instance, some research suggests changes in sea-ice cover initiated the D-O events because they would have affected water temperature and circulation through Ice–albedo feedback.[52][56]

D-O events are numbered in reverse order; the largest numbers are assigned to the oldest events.[52] The penultimate event, Dansgaard–Oeschger event 1, occurred some 14,690 years ago and marks the transition from the Oldest Dryas period to the Bølling–Allerød Interstadial (Danish: [ˈpøle̝ŋ ˈæləˌʁœðˀ]), which lasted until 12,890 years Before Present.[58][59] It was named after the two sites in Denmark with vegetation fossils that could only have survived during a comparatively warm period in the northern hemisphere.[58] The major warming in the northern hemisphere was offset by southern-hemisphere cooling and little net change in global temperature, which is consistent with changes in the AMOC.[57][60] The onset of the interstadial also caused a period of sea level rise from ice-sheet collapse that is designated Meltwater pulse 1A.[61]
The Bølling and Allerød stages of the interglacial were separated by two centuries of the opposite pattern – northern-hemisphere cooling, southern-hemisphere warming – which is known as the Older Dryas because the Arctic flower Dryas octopetala became dominant where forests were able to grow during the interglacial.[58] The interglacial ended with the onset of the Younger Dryas (YD) period (12,800–11,700 years ago), when northern-hemisphere temperatures returned to near-glacial levels, possibly within a decade.[62] This happened due to an abrupt slowing of the AMOC,[63] which, in a similar manner to Heinrich events, was caused by freshening due to ice loss from the Laurentide ice sheet. Unlike true Heinrich events, there was an enormous flow of meltwater through the Mackenzie River in what is now Canada rather than a mass iceberg loss.[64] Major changes in the precipitation regime, such as the shift of the Intertropical Convergence Zone to the south, increased rainfall in North America, and the drying of South America and Europe, occurred.[63]: 1148 Global temperatures again barely changed during the Younger Dryas and long-term, post-glacial warming resumed after it ended.[60]
Stability and vulnerability
[edit]
The AMOC has not always existed; for much of Earth's history, overturning circulation in the northern hemisphere occurred in the North Pacific. Paleoclimate evidence shows the shift of overturning circulation from the Pacific to the Atlantic occurred 34 million years ago at the Eocene-Oligocene transition, when the Arctic-Atlantic gateway had closed.[66] This closure fundamentally changed the thermohaline circulation structure; some researchers have suggested climate change may eventually reverse this shift and re-establish the Pacific circulation after the AMOC shuts down.[67][38] Climate change affects the AMOC by making surface water warmer as a consequence of Earth's energy imbalance and by making surface water less saline due to the addition of large quantities of fresh water from melting ice – mainly from Greenland – and through increasing precipitation over the North Atlantic. Both of these causes would increase the difference between the surface and deep layers, thus making the upwelling and downwelling that drives the circulation more difficult.[68]
In the 1960s, Henry Stommel did much of the research into the AMOC with what later became known as the Stommel Box model, which introduced the idea of Stommel Bifurcation in which the AMOC could exist either in a strong state like the one throughout recorded history or effectively collapse to a much weaker state and not recover unless the increased warming and/or freshening that caused the collapse is reduced.[69] The warming and freshening could directly cause the collapse or weaken the circulation to a state in which its ordinary fluctuations (noise) could push it past the tipping point.[65] The possibility the AMOC is a bistable system that is either "on" or "off" and could suddenly collapse has been a topic of scientific discussion ever since.[70][71] In 2004, The Guardian published the findings of a report commissioned by Pentagon defense adviser Andrew Marshall that suggests the average annual temperature in Europe would drop by 6 °F (3.3 °C) between 2010 and 2020 as the result of an abrupt AMOC shutdown.[72]
Modeling AMOC collapse
[edit]
Some of the models developed after Stommel's work suggest the AMOC could have one or more intermediate stable states between full strength and full collapse.[75] This is more-commonly seen in Earth Models of Intermediate Complexity (EMICs), which focus on certain parts of the climate system like AMOC and disregard others, rather than in the more-comprehensive general circulation models (GCMs) that represent the "gold standard" for simulating the entire climate but often have to simplify certain interactions.[76] GCMs typically show the AMOC has a single equilibrium state and that it is difficult or impossible for it to collapse.[77][73] Researchers have raised concerns this modeled resistance to collapse only occurs because GCM simulations tend to redirect large quantities of freshwater toward the North Pole, where it would no longer affect the circulation, a movement that does not occur in nature.[45][78]

In 2024, three researchers performed a simulation with one of the Community Earth System Models (CIMP) in which a classic AMOC collapse had occurred, much like it does in intermediate-complexity models.[37] Unlike some other simulations, they did not immediately subject the model to unrealistic meltwater levels but gradually increased the input. Their simulation had run for over 1,700 years before the collapse occurred and they had also eventually reached meltwater levels equivalent to a sea level rise of 6 cm (2.4 in) per year,[39] about 20 times larger than the 2.9 mm (0.11 in)/year sea level rise between 1993 and 2017,[79] and well above any level considered plausible. According to the researchers, those unrealistic conditions were intended to counterbalance the model's unrealistic stability and the model's output should not be regarded as a prediction but rather as a high-resolution representation of the way currents would start changing before a collapse.[37] Other scientists agreed this study's findings would mainly help with calibrating more-realistic studies, particularly once better observational data becomes available.[39][38]
Some research indicates classic EMIC projections are biased toward AMOC collapse because they subject the circulation toward an unrealistically constant flow of freshwater. In one study, the difference between constant and variable freshwater flux delayed collapse of the circulation in a typical Stommel's Bifurcation EMIC by over 1,000 years. The researchers said this simulation is more consistent with reconstructions of the AMOC's response to Meltwater pulse 1A 13,500–14,700 years ago and indicates a similarly long delay.[65] In 2022, a paleoceanographic reconstruction found a limited effect from massive freshwater forcing of the final Holocene deglaciation ~11,700–6,000 years ago, when the sea level rise was around 50 m (160 ft). It suggested most models overestimate the effects of freshwater forcing on the AMOC.[80] If the AMOC is more dependent on wind strength – which changes relatively little with warming – than is commonly understood, then it would be more resistant to collapse.[81] According to some researchers, the less-studied Southern Ocean overturning circulation (SOOC) may be more vulnerable to collapse than the AMOC.[82]
High-quality Earth system models indicate a collapse is unlikely and would only become probable if high levels of warming (≥4 °C (7.2 °F))[14] are sustained long after 2100.[78][83][84] Some paleoceanographic research seems to support this idea.[80][65] Some researchers fear the complex models are too stable[74] and that lower-complexity projections pointing to an earlier collapse are more accurate.[85][86] One of those projections suggests AMOC collapse could happen around 2065 (updated from 2057 in August 2025)[87] but many scientists are skeptical of the projection.[88] Some research also suggests the Southern Ocean overturning circulation may be more prone to collapse than the AMOC.[82][16] In October 2024, 44 climate scientists published an open letter, claiming that according to scientific studies in the past few years, the risk of AMOC collapse has been greatly underestimated, it can occur in the next few decades, with devastating impacts especially for Nordic countries. They called on Nordic countries to ensure the implementation of the Paris Agreement to prevent it.[89][90]
Trends
[edit]Until 2024 there was a disagreement between observations showing a slowdown of the circulation and climate models showing a stable circulation. In November 2024, Nature Geoscience published a study which tried to solve the problem. The scientists used "Earth system and eddy-permitting coupled ocean–sea-ice models". Then observations and models corresponded to each other much better. The study found a slowdown of 0.46 sverdrups per decade since 1950.[91]
Observations
[edit]

Direct observations of the strength of the AMOC have been available since 2004 from RAPID, an in situ mooring array at 26°N in the Atlantic.[93][92] Observational data needs to be collected for a prolonged period to be of use. Thus, some researchers have attempted to make predictions from smaller-scale observations; for instance, in May 2005, submarine-based research from Peter Wadhams indicated downwelling in the Greenland Sea – a small part of the AMOC system – which was measured using giant water columns nicknamed chimneys, transferring water downwards was at less than a quarter of its normal strength.[94][95] In 2000, other researchers focused on trends in the North Atlantic Gyre (NAG), which is also known as the Northern Subpolar Gyre (SPG).[96] Measurements taken in 2004 found a 30% decline in the NAG relative to the measurement in 1992; some interpreted this measurement as a sign of AMOC collapse.[97] RAPID data have since shown this to be a statistical anomaly,[98] and observations from 2007 and 2008 have shown a recovery of the NAG.[99] It is now known the NAG is largely separate from the rest of the AMOC and could collapse independently of it.[14][100][16]
By 2014, there was enough processed RAPID data up until the end of 2012; these data appeared to show a decline in circulation which was 10 times greater than that which was predicted by the most-advanced models of the time. Scientific debate about whether it indicated a strong impact of climate change or a large interdecadal variability of the circulation began.[45][101] Data up until 2017 showed the decline in 2008 and 2009 was anomalously large but the circulation after 2008 was weaker than it was in 2004–2008.[92]
The AMOC is also measured by tracking changes in heat transport that would be correlated with overall current flows. In 2017 and 2019, estimates derived from heat observations made by NASA's CERES satellites and international Argo floats suggested 15–20% less heat transport was occurring than was implied by the RAPID, and indicated a fairly stable flow with a limited indication of decadal variability.[102][103]
The strength of Florida Current has been measured as stable over the last four decades after correction for changes in Earth's magnetic field.[104]
Reconstructions
[edit]Recent past
[edit]
Climate reconstructions allow research to assemble hints about the past state of the AMOC, though these techniques are necessarily less reliable than direct observations. In February 2021, RAPID data was combined with reconstructed trends from data that were recorded 25 years before RAPID. This study showed no evidence of an overall decline in the AMOC over the past 30 years.[105] A Science Advances study published in 2020 found no significant change in the AMOC circulation compared to that in the 1990s, although substantial changes have occurred across the North Atlantic in the same period.[106] A March 2022 review article concluded while global warming may cause a long-term weakening of the AMOC, it remains difficult to detect when analyzing changes since 1980, including both direct – as that time frame presents both periods of weakening and strengthening – and the magnitude of either change is uncertain, ranging between 5% and 25%. The review concluded with a call for more-sensitive and longer-term research.[107]
20th century
[edit]
Some reconstructions have attempted to compare the current state of the AMOC with that from a century or so earlier. For instance, a 2010 statistical analysis found a weakening of the AMOC has been continuing since the late 1930s with an abrupt shift of a North-Atlantic overturning cell around 1970.[108] In 2015, a different statistical analysis interpreted a cold pattern in some years of temperature records as a sign of AMOC weakening. It concluded the AMOC has weakened by 15–20% in 200 years and that the circulation slowed during most of the 20th century. Between 1975 and 1995, the circulation was weaker than at any time over the past millennium. This analysis had also shown a limited recovery after 1990 but the authors cautioned another decline is likely to occur in the future.[6]
In 2018, another reconstruction suggested a weakening of around 15% has occurred since the mid-twentieth century.[109] A 2021 reconstruction used over a century of ocean-temperature-and-salinity data, which appeared to show significant changes in eight independent AMOC indices that could indicate "an almost complete loss of stability". This reconstruction was forced to omit all data from 35 years before 1900 and after 1980 to maintain consistent records of all eight indicators.[86] These findings were challenged by 2022 research that used data recorded between 1900 and 2019, and found no change in the AMOC between 1900 and 1980, and a single-sverdrup reduction in AMOC strength did not occur until 1980, a variation that remains within range of natural variability.[8]
Sediment analyses shows a weakening of the AMOC by 20% from the middle of the 20th century.[110]
Millennial scale
[edit]
According to a 2018 study, in the last 150 years, the AMOC has demonstrated exceptional weakness when compared to the previous 1,500 years and indicated a discrepancy in the modeled timing of AMOC decline after the Little Ice Age.[112] A 2017 review concluded there is strong evidence for past changes in the strength and structure of the AMOC during abrupt climate events, such as the Younger Dryas and many of the Heinrich events.[113] In 2022, another millennial-scale reconstruction found the Atlantic multidecadal variability strongly displayed increasing "memory", meaning it is now less likely to return to the mean state and instead would proceed in the direction of past variation. Because this pattern is likely connected to the AMOC, it could indicate a "quiet" loss of stability that is not seen in most models.[111]
In February 2021, a major study in Nature Geoscience reported the preceding millennium saw an unprecedented weakening of the AMOC, an indication the change was caused by human actions.[7][114] The study's co-author said the AMOC had already slowed by about 15% and effects now being seen; according to them: "In 20 to 30 years it is likely to weaken further, and that will inevitably influence our weather, so we would see an increase in storms and heatwaves in Europe, and sea level rises on the east coast of the US."[114] In February 2022, Nature Geoscience published a "Matters Arising" commentary article co-authored by 17 scientists that disputed those findings and said the long-term AMOC trend remains uncertain.[9] The journal also published a response from the authors of 2021 study, who defended their findings.[115]
Possible indirect signs
[edit]
Some researchers have interpreted a range of recently observed climatic changes and trends as being connected to a decline in the AMOC; for instance, a large area of the North Atlantic Gyre[117] near Greenland has cooled by 0.39 °C (0.70 °F) between 1900 and 2020, in contrast to substantial ocean warming elsewhere.[118] This cooling is normally seasonal; it is most-pronounced in February, when cooling reaches 0.9 °C (1.6 °F) at the area's epicenter but it still experiences warming relative to pre-industrial levels during warm months, particularly in August.[117] Between 2014 and 2016, waters in the area stayed cool for 19 months before warming,[119] and media described this phenomenon as the cold blob.[120]
The cold-blob pattern occurs because sufficiently fresh, cool water avoids sinking into deeper layers. This freshening was immediately described as evidence of a slowing of the AMOC slowdown.[120] Later research found atmospheric changes, such as an increase in low cloud cover[121] and a strengthening of the North Atlantic oscillation (NAO) have also played a major role in this local cooling.[118] The overall importance of the NAO in the phenomenon is disputed[119] but cold-blob trends alone cannot be used to analyze the strength of the AMOC.[121]
Another possible early indication of a slowing of the AMOC is the relative reduction in the North Atlantic's potential to act as a carbon sink. Between 2004 and 2014, the amount of carbon sequestered in the North Atlantic declined by 20% relative to 1994–2004, which the researchers considered evidence of AMOC slowing. This decline was offset by a comparable increase in the South Atlantic, which is considered part of the Southern Ocean.[122] While the total amount of carbon absorption by all carbon sinks is generally projected to increase throughout the 21st century, a continuing decline in the North Atlantic sink would have important implications.[123] Other processes that were attributed in some studies to AMOC slowing include increasing salinity in the South Atlantic,[124] rapid deoxygenation in the Gulf of St. Lawrence,[125][126] and an approximately 10% decline in phytoplankton productivity across the North Atlantic over the past 200 years[127], although this evidence is contested[128][129].
Projections
[edit]Individual models
[edit]
Historically, CMIP models, the gold standard in climate science, show the AMOC is very stable; although it may weaken, it will always recover rather than permanently collapse – for example, in a 2014 idealized experiment in which CO2 concentrations abruptly double from 1990 levels and do not change afterward, the circulation declines by around 25% but does not collapse, although it recovers by only 6% over the next 1,000 years.[131] In 2020, research estimated if warming stabilizes at 1.5 °C (2.7 °F), 2 °C (3.6 °F) or 3 °C (5.4 °F) by 2100; in all three cases, the AMOC declines for an additional 5–10 years after the temperature rise ceases but does not approach collapse, and partially recovers after about 150 years.[84] Many researchers have said collapse is only avoided due to biases that persist across the large-scale models.[77][74]
While models have improved over time, the sixth and as of 2020[update] current generation CMIP6 retains some inaccuracies. On average, those models simulate much greater AMOC weakening in response to greenhouse warming than the previous generation;[130] when four CMIP6 models simulated the AMOC under the SSP3-7 scenario in which CO2 levels more than double from 2015 values by 2100 from around 400 parts per million (ppm) to over 850 ppm,[132]: 14 they found it declined by over 50% by 2100.[133] The CMIP6 models are not yet capable of simulating North Atlantic Deep Water (NADW) without errors in its depth, area or both, reducing confidence in their projections.[134]

To address these problems, some scientists experimented with bias correction. In another idealized CO2 doubling experiment, the AMOC collapsed after 300 years when bias correction was applied to the model.[78] One 2016 experiment combined projections from eight then-state-of-the-art CMIP5 climate models with the improved Greenland ice-sheet melt estimates. It found by 2090–2100, the AMOC would weaken by around 18% (3%–34%) under the intermediate Representative Concentration Pathway 4.5, and by 37% (15%–65%) under the very high Representative Concentration Pathway 8.5, in which greenhouse gas emissions increase continuously. When the two scenarios were extended past 2100, the AMOC stabilized under RCP 4.5 but continued to decline under RCP 8.5, leading to an average decline of 74% by 2290–2300 and a 44% likelihood of a complete collapse.[83] In 2020, another team of researchers simulated RCP 4.5 and RCP 8.5 between 2005 and 2250 in a Community Earth System Model that was integrated with an advanced ocean physics module. Due to the module, the AMOC was subjected to four-to-ten times more freshwater when compared to the standard run. It simulated for RCP 4.5 very similar results to those of the 2016 study while below RCP 8.5, the circulation declines by two-thirds soon after 2100 but does not collapse past that level.[135]
In 2023, a statistical analysis of output from multiple intermediate-complexity models suggested an AMOC collapse would most likely happen around 2065 (updated from 2057 in August 2025) with 95% confidence of a collapse between 2037 and 2109.[87] This study received a lot of attention and criticism because intermediate-complexity models are considered less reliable in general and may confuse a major slowing of the circulation with its complete collapse. The study relied on proxy temperature data from the Northern Subpolar Gyre region, which other scientists do not consider representative of the entire circulation, believing it may be subject to a separate tipping point. Some scientists have described this research as "worrisome" and noted it can provide a "valuable contribution" once better observational data is available but there was widespread agreement among experts the paper's proxy record was "insufficient".[88]
- New long-duration CMIP6 projections
A 2025 multi-model analysis extended CMIP6 simulations beyond 2100 and explicitly tracked the fate of the *deep* northern overturning cell (the part of the AMOC linked to NADW formation). Under the high-emissions scenario SSP5-8.5, all nine models that were run past 2100 progressed from late-20th-century overturning transports of about 14–26 Sv over ~1,000 m at 26°N to just ~1–6 Sv, accompanied by an abrupt shoaling and a shift of the depth of maximum overturning from a NADW-dominated state to one linked to subtropical downwelling.[136] In these runs, a collapse of deep winter convection across subpolar basins preceded the northern overturning shutdown by roughly three decades on average, consistent with a sequence in which the breakdown of deep mixing destabilizes the overturning via Welander (mixing) and Stommel (salt-advection) feedbacks.[136] The models also retained a shallow, wind-driven, subtropical overturning cell, so the post-2
Major review studies
[edit]
Large review papers and reports are capable of evaluating model output, direct observations and historical reconstructions to make expert judgements beyond what models alone can show. Around 2001, the IPCC Third Assessment Report projected high confidence the AMOC thermohaline circulation would weaken rather than stop and that warming effects would outweigh cooling, even over Europe.[138] When the IPCC Fifth Assessment Report was published in 2014, a rapid transition of the AMOC was considered "very unlikely" and this assessment was offered at a high level of confidence.[139]
In 2021, the IPCC Sixth Assessment Report again said the AMOC is "very likely" to decline within the 21st century and that there was a "high confidence" changes to it would be reversible within centuries if warming was reversed.[10]: 19 Unlike the Fifth Assessment Report, it had only "medium confidence" rather than "high confidence" in the AMOC avoiding a collapse before the end of the 21st century. This reduction in confidence was likely influenced by several review studies that draw attention to the circulation stability bias within general circulation models,[140][141] and simplified ocean-modelling studies suggesting the AMOC may be more vulnerable to abrupt change than larger-scale models suggest.[85]
The synthesis report of the IPCC Sixth Assessment Report summarized the scientific consensus as follows: "The Atlantic Meridional Overturning Circulation is very likely to weaken over the 21st century for all considered scenarios (high confidence), however an abrupt collapse is not expected before 2100 (medium confidence). If such a low probability event were to occur, it would very likely cause abrupt shifts in regional weather patterns and water cycle, such as a southward shift in the tropical rain belt, and large impacts on ecosystems and human activities."[142]
In 2022, an extensive assessment of all potential climate tipping points identified 16 plausible climate tipping points, including a collapse of the AMOC. It said a collapse would most likely be triggered by 4 °C (7.2 °F) of global warming but that there is enough uncertainty to suggest it could be triggered at warming levels of between 1.4 °C (2.5 °F) and 8 °C (14 °F). The assessment estimates once AMOC collapse is triggered, it would occur between 15 and 300 years, and most likely at around 50 years.[14][100] The assessment also treated the collapse of the Northern Subpolar Gyre as a separate tipping point that could tip at between 1.1 °C (2.0 °F) degrees and 3.8 °C (6.8 °F), although this is only simulated by a fraction of climate models. The most likely tipping point for the collapse of Northern Subpolar Gyre is 1.8 °C (3.2 °F) and once triggered, the collapse of the gyre would occur between 5 and 50 years, and most likely at 10 years. The loss of this convection is estimated to lower the global temperature by 0.5 °C (0.90 °F) while the average temperature in Europe would decrease by around 3 °C (5.4 °F). There would also be substantial effects on regional precipitation levels.[14][100]
The "State of the cryosphere" report, dedicates significant space to AMOC, saying it may be enroute to collapse because of ice melt and water warming. Impacts will include cooling of Northern Europe faster than 3°C per decade, "with no realistic means of adaptation". At the same time, the Antarctic Circumpolar Current (ACC) is also slowing down and the Weddell Sea Bottom Water is losing volume, what can impact global ocean circulation and climate.[143] UNESCO mentions that the report in the first time "notes a growing scientific consensus that melting Greenland and Antarctic ice sheets, among other factors, may be slowing important ocean currents at both poles, with potentially dire consequences for a much colder northern Europe and greater sea-level rise along the U.S. East Coast."[144]
In February 2025, a study published in Nature concluded that the AMOC is resilient to extreme greenhouse gas and North Atlantic freshwater forcings across 34 climate models, suggesting that an AMOC collapse is unlikely in the 21st century.[145]
Effects of AMOC slowdown
[edit]
As of 2024[update], there is no consensus on whether a consistent slowing of the AMOC circulation has occurred but there is little doubt it will occur in the event of continued climate change.[26] According to the IPCC, the most-likely effects of future AMOC decline are reduced precipitation in mid-latitudes, changing patterns of strong precipitation in the tropics and Europe, and strengthening storms that follow the North Atlantic track.[26] In 2020, research found a weakened AMOC would slow the decline in Arctic sea ice.[147] and result in atmospheric trends similar to those that likely occurred during the Younger Dryas,[63] such as a southward displacement of Intertropical Convergence Zone. Changes in precipitation under high-emissions scenarios would be far larger.[147]
A decline in the AMOC would be accompanied by an acceleration of sea level rise along the U.S. East Coast;[26] at least one such event has been connected to a temporary slowing of the AMOC.[148] This effect would be caused by increased warming and thermal expansion of coastal waters, which would transfer less of their heat toward Europe; it is one of the reasons sea level rise along the U.S. East Coast is estimated to be three-to-four times higher than the global average.[149][150][151]

Some scientists believe a partial slowing of the AMOC would result in limited cooling of around 1 °C (1.8 °F) in Europe.[152][153][146] Other regions would be differently affected; according to 2022 research, 20th-century winter-weather extremes in Siberia were milder when the AMOC was weakened.[32] According to one assessment, a slowing of the AMOC is one of the few climate tipping points that are likely to reduce the social cost of carbon, a common measure of economic impacts of climate change, by −1.4% rather than increasing it, because Europe represents a larger fraction of global GDP than the regions that will be negatively affected by the slowing.[154] This study's methods have been said to have underestimating climate impacts in general.[155][156] According to some research, the dominant effect on an AMOC slowdown would be a reduction in oceanic heat uptake, leading to increased global warming,[157] but this is a minority opinion.[14][158]
A 2021 study said other well-known tipping points, such as the Greenland ice sheet, the West Antarctic Ice Sheet and the Amazon rainforest would all be connected to the AMOC. According to this study, changes to the AMOC alone are unlikely to trigger tipping elsewhere but an AMOC slowdown would provide a connection between these elements and reduce the global-warming threshold beyond which any of those four elements – including the AMOC itself – could be expected to tip, rather than the thresholds that have been established from studying those elements in isolation. This connection could cause a cascade of tipping over several centuries.[159]
Effects of an AMOC shutdown
[edit]Cooling
[edit]
A complete collapse of the AMOC will be largely irreversible[26] and recovery would likely take thousands of years.[160] A shutting down of the AMOC is expected to trigger substantial cooling in Europe,[161][13] particularly in Britain and Ireland, France and the Nordic countries.[162][163] In 2002, research compared AMOC shutdown to Dansgaard–Oeschger events – abrupt temperature shifts that occurred during the Last Glacial Period. According to that paper, local cooling of up to 8 °C (14 °F) would occur in Europe.[164] In 2022, a major review of tipping points concluded an AMOC collapse would lower global temperatures by around 0.5 °C (0.90 °F) while regional temperatures in Europe would fall by between 4 °C (7.2 °F) and 10 °C (18 °F).[14][100]
A 2020 study assessed the effects of an AMOC collapse on farming and food production in Great Britain.[165] It found within Great Britain an average temperature drop of 3.4 °C (6.1 °F) after the effect of warming was subtracted from collapse-induced cooling. A collapse of the AMOC would also lower rainfall during the growing season by around 123 mm (4.8 in), which would in turn reduce the area of land suitable for arable farming from 32% to 7%. The net value of British farming would decline by around £346 million per year – over 10% of its value in 2020.[15]
In 2024, one study that modeled the effect of an AMOC collapse on a pre-industrial world, predicted a more severe cooling in Europe. It predicted the average sea surface temperatures in northwest Europe falling 10 °C (18 °F) and the average February temperatures on land falling between 10 °C (18 °F) and 30 °C (54 °F) within a century in northern and western Europe. This change would result in sea ice reaching into the territorial waters of the British Isles and Denmark during winter while Antarctic sea ice would diminish.[37][38][166] These findings do not include the counteracting warming from climate change, and the modeling approach used by the paper is controversial.[39]
A 2015 study led by James Hansen found a shutdown or substantial slowing of the AMOC will intensify severe weather because it increases baroclinicity and accelerates northeasterly winds up to 10–20% throughout the mid-latitude troposphere. This could boost winter and near-winter cyclonic "superstorms" that are associated with near-hurricane-force winds and intense snowfall.[17] This paper has also been controversial.[167]
Other
[edit]

Several studies have investigated the effect of a collapse of the AMOC on the El Niño–Southern Oscillation (ENSO); results have ranged from no overall impact[169] to an increase in ENSO strength,[67] and a shift to a dominant La Niña conditions with an about 95% reduction in El Niño extremes but more-frequent extreme rainfall in eastern Australia, and intensified droughts and wildfire seasons in the southwestern U.S.[170][171][172]
A 2021 study used a simplified modeling approach to evaluate the effects of an AMOC collapse on the Amazon rainforest, and its hypothesized dieback and transition to a savanna state in some climate-change scenarios. This study found an AMOC collapse would increase rainfall in the southern Amazon due to the shift of an Intertropical Convergence Zone, and this would help to counter the dieback and potentially stabilize the southern part of the rainforest.[173] A 2024 study found the seasonal cycle of the Amazon could reverse with dry seasons becoming wet and vice versa.[37][38][39]
A 2005 paper said severe disruption of the AMOC would collapse North Atlantic plankton counts to less than half of their normal biomass due to increased stratification and the large decline in nutrient exchange among ocean layers.[12] A 2015 study simulated global ocean changes under AMOC slowing and collapse scenarios, and found these events would greatly decrease dissolved oxygen content in the North Atlantic, although dissolved oxygen would slightly increase globally due to greater increases across other oceans.[174]
See also
[edit]References
[edit]- ^ a b c IPCC, 2021: Annex VII: Glossary Archived 5 June 2022 at the Wayback Machine [Matthews, J.B.R., V. Möller, R. van Diemen, J.S. Fuglestvedt, V. Masson-Delmotte, C. Méndez, S. Semenov, A. Reisinger (eds.)]. In Climate Change 2021: The Physical Science Basis. Contribution of Working Group I to the Sixth Assessment Report of the Intergovernmental Panel on Climate Change Archived 26 May 2023 at the Wayback Machine [Masson-Delmotte, V., P. Zhai, A. Pirani, S.L. Connors, C. Péan, S. Berger, N. Caud, Y. Chen, L. Goldfarb, M.I. Gomis, M. Huang, K. Leitzell, E. Lonnoy, J.B.R. Matthews, T.K. Maycock, T. Waterfield, O. Yelekçi, R. Yu, and B. Zhou (eds.)]. Cambridge University Press, Cambridge, United Kingdom and New York, NY, USA, pp. 2215–2256, doi:10.1017/9781009157896.022.
- ^ "NOAA Scientists Detect a Reshaping of the Meridional Overturning Circulation in the Southern Ocean". NOAA. 29 March 2023. Archived from the original on 28 January 2024. Retrieved 28 January 2024.
- ^ a b c Buckley, Martha W.; Marshall, John (2016). "Observations, inferences, and mechanisms of the Atlantic Meridional Overturning Circulation: A review". Reviews of Geophysics. 54 (1): 5–63. Bibcode:2016RvGeo..54....5B. doi:10.1002/2015RG000493. hdl:1721.1/108249. ISSN 8755-1209. S2CID 54013534.
- ^ a b c Lozier, M. S.; Li, F.; Bacon, S.; Bahr, F.; Bower, A. S.; Cunningham, S. A.; de Jong, M. F.; de Steur, L.; deYoung, B.; Fischer, J.; Gary, S. F. (2019). "A sea change in our view of overturning in the subpolar North Atlantic". Science. 363 (6426): 516–521. Bibcode:2019Sci...363..516L. doi:10.1126/science.aau6592. ISSN 0036-8075. PMID 30705189. S2CID 59567598.
- ^ "Historic iceberg surges offer insights on modern climate change". The Current. 30 May 2024. Archived from the original on 30 May 2024. Retrieved 30 May 2024.
- ^ a b Rahmstorf, Stefan; Box, Jason E.; Feulner, Georg; Mann, Michael E.; Robinson, Alexander; Rutherford, Scott; Schaffernicht, Erik J. (2015). "Exceptional twentieth-century slowdown in Atlantic Ocean overturning circulation" (PDF). Nature Climate Change. 5 (5): 475–480. Bibcode:2015NatCC...5..475R. doi:10.1038/nclimate2554. ISSN 1758-678X. Archived (PDF) from the original on 9 September 2016. Retrieved 12 April 2022.
 PDF in UNEP Document Repository Archived 12 July 2019 at the Wayback Machine
- ^ a b Caesar, L.; McCarthy, G.D.; Thornalley, D. J. R.; Cahill, N.; Rahmstorf, S. (25 February 2021). "Current Atlantic Meridional Overturning Circulation weakest in last millennium" (PDF). Nature Geoscience. 14 (3): 118–120. Bibcode:2021NatGe..14..118C. doi:10.1038/s41561-021-00699-z. S2CID 232052381.
- ^ a b c d Latif, Mojib; Sun, Jing; Visbeck, Martin; Bordbar (25 April 2022). "Natural variability has dominated Atlantic Meridional Overturning Circulation since 1900". Nature Climate Change. 12 (5): 455–460. Bibcode:2022NatCC..12..455L. doi:10.1038/s41558-022-01342-4. S2CID 248385988.
- ^ a b Kilbourne, Kelly Halimeda; et, al. (17 February 2022). "Atlantic circulation change still uncertain". Nature Geoscience. 15 (3): 165–167. Bibcode:2022NatGe..15..165K. doi:10.1038/s41561-022-00896-4. hdl:2117/363518. S2CID 246901665.
- ^ a b IPCC, 2019: Summary for Policymakers Archived 18 October 2022 at the Wayback Machine. In: IPCC Special Report on the Ocean and Cryosphere in a Changing Climate Archived 12 July 2021 at the Wayback Machine [H.-O. Pörtner, D.C. Roberts, V. Masson-Delmotte, P. Zhai, M. Tignor, E. Poloczanska, K. Mintenbeck, A. Alegría, M. Nicolai, A. Okem, J. Petzold, B. Rama, N.M. Weyer (eds.)]. Cambridge University Press, Cambridge, UK and New York, NY, USA. doi:10.1017/9781009157964.001.
- ^ Lenton, T. M.; Held, H.; Kriegler, E.; Hall, J. W.; Lucht, W.; Rahmstorf, S.; Schellnhuber, H. J. (2008). "Inaugural Article: Tipping elements in the Earth's climate system". Proceedings of the National Academy of Sciences. 105 (6): 1786–1793. Bibcode:2008PNAS..105.1786L. doi:10.1073/pnas.0705414105. PMC 2538841. PMID 18258748.
- ^ a b Schmittner, Andreas (31 March 2005). "Decline of the marine ecosystem caused by a reduction in the Atlantic overturning circulation". Nature. 434 (7033): 628–633. Bibcode:2005Natur.434..628S. doi:10.1038/nature03476. PMID 15800620. S2CID 2751408.
- ^ a b "Explainer: Nine 'tipping points' that could be triggered by climate change". Carbon Brief. 10 February 2020. Archived from the original on 11 February 2020. Retrieved 4 September 2021.
- ^ a b c d e f g h i j Armstrong McKay, David; Abrams, Jesse; Winkelmann, Ricarda; Sakschewski, Boris; Loriani, Sina; Fetzer, Ingo; Cornell, Sarah; Rockström, Johan; Staal, Arie; Lenton, Timothy (9 September 2022). "Exceeding 1.5°C global warming could trigger multiple climate tipping points". Science. 377 (6611) eabn7950. doi:10.1126/science.abn7950. hdl:10871/131584. ISSN 0036-8075. PMID 36074831. S2CID 252161375. Archived from the original on 14 November 2022. Retrieved 3 October 2022.
- ^ a b "Atlantic circulation collapse could cut British crop farming". Phys.org. 13 January 2020. Archived from the original on 29 April 2023. Retrieved 3 October 2022.
- ^ a b c d Lenton, T. M.; Armstrong McKay, D.I.; Loriani, S.; Abrams, J.F.; Lade, S.J.; Donges, J.F.; Milkoreit, M.; Powell, T.; Smith, S.R.; Zimm, C.; Buxton, J.E.; Daube, Bruce C.; Krummel, Paul B.; Loh, Zoë; Luijkx, Ingrid T. (2023). The Global Tipping Points Report 2023 (Report). University of Exeter.
- ^ a b Hansen, J.; Sato, M.; Hearty, P.; Ruedy, R.; Kelley, M.; et al. (23 July 2015). "Ice melt, sea level rise and superstorms: evidence from paleoclimate data, climate modeling, and modern observations that 2 °C global warming is highly dangerous" (PDF). Atmospheric Chemistry and Physics Discussions. 15 (14): 20059–20179. Bibcode:2015ACPD...1520059H. doi:10.5194/acpd-15-20059-2015. Archived (PDF) from the original on 15 March 2023. Retrieved 15 May 2022.
- ^ a b c d e Broecker, Wallace (1991). "The great ocean conveyor" (PDF). Oceanography. 4 (2): 79–89. Bibcode:1991Ocgpy...4b..79B. doi:10.5670/oceanog.1991.07.
- ^ Yamaguchi, Ryohei; Suga, Toshio (12 December 2019). "Trend and Variability in Global Upper-Ocean Stratification Since the 1960s". Journal of Geophysical Research: Oceans. 124 (12): 8933–8948. Bibcode:2019JGRC..124.8933Y. doi:10.1029/2019JC015439.
- ^ Craig, Philip M.; Ferreira, David; Methven, John (8 June 2017). "The contrast between Atlantic and Pacific surface water fluxes". Tellus A: Dynamic Meteorology and Oceanography. 69 (1) 1330454. Bibcode:2017TellA..6930454C. doi:10.1080/16000870.2017.1330454.
- ^ "Salinity and Brine". NSIDC. Archived from the original on 18 December 2009. Retrieved 12 April 2022.
- ^ Wang, Chunzai; Zhang, Liping; Lee, Sang-Ki (15 February 2013). "Response of Freshwater Flux and Sea Surface Salinity to Variability of the Atlantic Warm Pool". Journal of Climate. 26 (4): 1249–1267. Bibcode:2013JCli...26.1249W. doi:10.1175/JCLI-D-12-00284.1.
- ^ Yang, Haijun; Jiang, Rui; Wen, Qin; Liu, Yimin; Wu, Guoxiong; Huang, Jiangping (23 March 2024). "The role of mountains in shaping the global meridional overturning circulation". Nature Communications. 15 (1): 2602. Bibcode:2024NatCo..15.2602Y. doi:10.1038/s41467-024-46856-x. PMC 10960852. PMID 38521775.
- ^ a b c Marshall, John; Speer, Kevin (26 February 2012). "Closure of the meridional overturning circulation through Southern Ocean upwelling". Nature Geoscience. 5 (3): 171–180. Bibcode:2012NatGe...5..171M. doi:10.1038/ngeo1391.
- ^ Rhein, Monika; Kieke, Dagmar; Hüttl-Kabus, Sabine; Roessler, Achim; Mertens, Christian; Meissner, Robert; Klein, Birgit; Böning, Claus W.; Yashayaev, Igor (10 January 2009). "Deep water formation, the subpolar gyre, and the meridional overturning circulation in the subpolar North Atlantic". Deep Sea Research Part II: Topical Studies in Oceanography. 58 (17–18): 1819–1832. Bibcode:2009GeoRL..36.1606Y. doi:10.1029/2008GL036162. S2CID 56353963.
- ^ a b c d e Fox-Kemper, B., H.T. Hewitt, C. Xiao, G. Aðalgeirsdóttir, S.S. Drijfhout, T.L. Edwards, N.R. Golledge, M. Hemer, R.E. Kopp, G. Krinner, A. Mix, D. Notz, S. Nowicki, I.S. Nurhati, L. Ruiz, J.-B. Sallée, A.B.A. Slangen, and Y. Yu, 2021: Chapter 9: Ocean, Cryosphere and Sea Level Change Archived 24 October 2022 at the Wayback Machine. In Climate Change 2021: The Physical Science Basis. Contribution of Working Group I to the Sixth Assessment Report of the Intergovernmental Panel on Climate Change Archived 26 May 2023 at the Wayback Machine [Masson-Delmotte, V., P. Zhai, A. Pirani, S.L. Connors, C. Péan, S. Berger, N. Caud, Y. Chen, L. Goldfarb, M.I. Gomis, M. Huang, K. Leitzell, E. Lonnoy, J.B.R. Matthews, T.K. Maycock, T. Waterfield, O. Yelekçi, R. Yu, and B. Zhou (eds.)]. Cambridge University Press, Cambridge, United Kingdom and New York, NY, USA, pp. 1211–1362, doi:10.1017/9781009157896.011
- ^ "AMS Glossary of Meteorology, Antarctic Bottom Water". American Meteorological Society. Retrieved 29 June 2023.
- ^ Prange, M.; Schulz, M. (3 September 2004). "A coastal upwelling seesaw in the Atlantic Ocean as a result of the closure of the Central American Seaway". Geophysical Research Letters. 31 (17). Bibcode:2007GeoRL..3413614B. doi:10.1029/2007GL030285. S2CID 13857911.
- ^ Wang, Li-Chiao; Fei-Fei, Jing; Wu, Chau-Ron; Hsu, Huang-Hsiung (2 March 2017). "Dynamics of upwelling annual cycle in the equatorial Atlantic Ocean". Geophysical Research Letters. 44 (8): 3737–3743. Bibcode:2017GeoRL..44.3737W. doi:10.1002/2017GL072588. S2CID 132601314.
- ^ Talley, Lynne D. (2 October 2015). "Closure of the global overturning circulation through the Indian, Pacific, and Southern Oceans: Schematics and transports". Oceanography. 26 (1): 80–97. doi:10.5670/oceanog.2013.07.
- ^ a b Morrison, Adele K.; Frölicher, Thomas L.; Sarmiento, Jorge L. (January 2015). "Upwelling in the Southern Ocean". Physics Today. 68 (1): 27. Bibcode:2015PhT....68a..27M. doi:10.1063/PT.3.2654.
- ^ a b Wang, Huan; Zuo, Zhiyan; Qiao, Liang; Zhang, Kaiwen; Sun, Cheng; Xiao, Dong; Lin, Zouxing; Bu, Lulei; Zhang, Ruonan (4 November 2022). "Frequency of the winter temperature extremes over Siberia dominated by the Atlantic Meridional Overturning Circulation". npj Climate and Atmospheric Science. 5 (1): 84. Bibcode:2022npCAS...5...84W. doi:10.1038/s41612-022-00307-w.
- ^ a b Bryden, Harry L.; Imawaki, Shiro (2001). "Ocean heat transport". International Geophysics. 77: 455–474. doi:10.1016/S0074-6142(01)80134-0.
- ^ Rhines, Peter; Häkkinen, Sirpa; Josey, Simon A. (2008). "Is Oceanic Heat Transport Significant in the Climate System?". Arctic–Subarctic Ocean Fluxes. pp. 87–109. doi:10.1007/978-1-4020-6774-7_5. ISBN 978-1-4020-6773-0. Archived from the original on 8 October 2022. Retrieved 3 October 2022.
- ^ Seager, R.; Battisti, D. S.; Yin, J.; Gordon, N.; Naik, N.; Clement, A. C.; Cane, M. A. (2002). "Is the Gulf Stream responsible for Europe's mild winters?" (PDF). Quarterly Journal of the Royal Meteorological Society. 128 (586): 2563–2586. Bibcode:2002QJRMS.128.2563S. doi:10.1256/qj.01.128. S2CID 8558921. Archived (PDF) from the original on 5 March 2012. Retrieved 25 October 2010.
- ^ Seager, Richard (2006). "The Source of Europe's Mild Climate: The notion that the Gulf Stream is responsible for keeping Europe anomalously warm turns out to be a myth". American Scientist. 94 (4): 334–341. doi:10.1511/2006.60.999. JSTOR 27858802.
- ^ a b c d e f van Westen, René M.; Kliphuis, Michael; Dijkstra, Henk A. (9 February 2024). "Physics-based early warning signal shows that AMOC is on tipping course". Science Advances. 10 (6) eadk1189. arXiv:2308.01688. Bibcode:2024SciA...10K1189V. doi:10.1126/sciadv.adk1189. PMC 10857529. PMID 38335283.
- ^ a b c d e Rahmstorf, Stefan (9 February 2024). "New study suggests the Atlantic overturning circulation AMOC "is on tipping course"". RealClimate.
- ^ a b c d e f "expert reaction to modelling study suggesting Atlantic Ocean circulation (AMOC) could be on course to collapse". Science Media Centre. 9 February 2024. Archived from the original on 20 April 2024. Retrieved 12 April 2024.
- ^ Lund, DC; Lynch-Stieglitz, J; Curry, WB (November 2006). "Gulf Stream density structure and transport during the past millennium" (PDF). Nature. 444 (7119): 601–4. Bibcode:2006Natur.444..601L. doi:10.1038/nature05277. PMID 17136090. S2CID 4431695. Archived (PDF) from the original on 23 January 2023. Retrieved 12 April 2022.
- ^ DeVries, Tim; Primeau, François (1 December 2011). "Dynamically and observationally constrained estimates of water-mass distributions and ages in the global ocean". Journal of Physical Oceanography. 41 (12): 2381–2401. Bibcode:2011JPO....41.2381D. doi:10.1175/JPO-D-10-05011.1. S2CID 42020235.
- ^ Long, Matthew C.; Stephens, Britton B.; McKain, Kathryn; Sweeney, Colm; Keeling, Ralph F.; Kort, Eric A.; Morgan, Eric J.; Bent, Jonathan D.; Chandra, Naveen; Chevallier, Frederic; Commane, Róisín; Daube, Bruce C.; Krummel, Paul B.; Loh, Zoë; Luijkx, Ingrid T.; Munro, David; Patra, Prabir; Peters, Wouter; Ramonet, Michel; Rödenbeck, Christian; Stavert, Ann; Tans, Pieter; Wofsy, Steven C. (2 December 2021). "Strong Southern Ocean carbon uptake evident in airborne observations". Science. 374 (6572): 1275–1280. Bibcode:2021Sci...374.1275L. doi:10.1126/science.abi4355. PMID 34855495. S2CID 244841359.
- ^ Gruber, Nicolas; Keeling, Charles D.; Bates, Nicholas R. (20 December 2002). "Interannual variability in the North Atlantic Ocean carbon sink". Science. 298 (5602): 2374–2378. Bibcode:2002Sci...298.2374G. doi:10.1126/science.1077077. PMID 12493911. S2CID 6469504.
- ^ a b Schannwell, Clemens; Mikolajewicz, Uwe; Kapsch, Marie-Luise; Ziemen, Florian (5 April 2024). "A mechanism for reconciling the synchronisation of Heinrich events and Dansgaard-Oeschger cycles". Nature Communications. 15 (1): 2961. Bibcode:2024NatCo..15.2961S. doi:10.1038/s41467-024-47141-7. PMC 10997585. PMID 38580634.
- ^ a b c Srokosz, M. A.; Bryden, H. L. (19 June 2015). "Observing the Atlantic Meridional Overturning Circulation yields a decade of inevitable surprises". Science. 348 (6241): 3737–3743. doi:10.1126/science.1255575. PMID 26089521. S2CID 22060669.
- ^ dos Santos, Raquel A. Lopes; et al. (15 November 2001). "Glacial–interglacial variability in Atlantic meridional overturning circulation and thermocline adjustments in the tropical North Atlantic". Earth and Planetary Science Letters. 300 (3–4): 407–414. doi:10.1016/j.epsl.2010.10.030.
- ^ Pester, Patrick; Zimmermann, Kim Ann (28 February 2022). "Pleistocene epoch: The last ice age". LiveScience. Archived from the original on 13 April 2020. Retrieved 19 May 2024.
- ^ a b c Schmidt, Matthew W.; Hertzberg, Jennifer E. (28 February 2022). "Abrupt Climate Change During the Last Ice Age". Nature Education Knowledge. Archived from the original on 19 May 2024. Retrieved 19 May 2024.
- ^ JOHNSEN, S. J.; DANSGAARD, W.; CLAUSEN, H. B.; LANGWAY, C. C. (February 1972). "Oxygen Isotope Profiles through the Antarctic and Greenland Ice Sheets". Nature. 235 (5339): 429–434. Bibcode:1972Natur.235..429J. doi:10.1038/235429a0. ISSN 0028-0836. S2CID 4210144.
- ^ Stauffer, B.; Hofer, H.; Oeschger, H.; Schwander, J.; Siegenthaler, U. (1984). "Atmospheric CO2 Concentration During the Last Glaciation". Annals of Glaciology. 5: 160–164. Bibcode:1984AnGla...5..160S. doi:10.3189/1984aog5-1-160-164. ISSN 0260-3055.
- ^ a b Oka, Akira; Abe-Ouchi, Ayako; Sherriff-Tadano, Sam; Yokoyama, Yusuke; Kawamura, Kenji; Hasumi, Hiroyasu (20 August 2021). "Glacial mode shift of the Atlantic meridional overturning circulation by warming over the Southern Ocean". Communications Earth & Environment. 2 (1): 169. Bibcode:2021ComEE...2..169O. doi:10.1038/s43247-021-00226-3.
- ^ a b c d Dima, M.; Lohmann, G.; Knorr, G. (21 November 2018). "North Atlantic Versus Global Control on Dansgaard-Oeschger Events". Geophysical Research Letters. 45 (23): 12, 991–12, 998. Bibcode:2018GeoRL..4512991D. doi:10.1029/2018GL080035.
- ^ a b Li, Camille; Born, Andreas (10 November 2018). "Coupled atmosphere-ice-ocean dynamics in Dansgaard-Oeschger events". Quaternary Science Reviews. 203: 1–20. Bibcode:2019QSRv..203....1L. doi:10.1016/j.quascirev.2018.10.031. hdl:1956/19927. ISSN 0277-3791. S2CID 134877256.
- ^ Sun, Yuchen; Knorr, Gregor; Zhang, Xu; Tarasov, Lev; Barker, Stephen; Werner, Martin; Lohmann, Gerrit (21 February 2022). "Ice sheet decline and rising atmospheric CO2 control AMOC sensitivity to deglacial meltwater discharge". Global and Planetary Change. 210 103755. doi:10.1016/j.gloplacha.2022.103755.
- ^ Lynch-Stieglitz, Jean (28 October 2016). "The Atlantic Meridional Overturning Circulation and Abrupt Climate Change". Annual Review of Marine Science. 9: 83–104. Bibcode:2017ARMS....9...83L. doi:10.1146/annurev-marine-010816-060415. PMID 27814029.
- ^ Petersen, S. V.; Schrag, D. P.; Clark, P. U. (5 March 2013). "A new mechanism for Dansgaard-Oeschger cycles". Paleoceanography and Paleoclimatology. 28 (1): 24–30. Bibcode:2013PalOc..28...24P. doi:10.1029/2012PA002364.
- ^ a b Obase, Takashi; Abe-Ouchi, Ayako; Saito, Fuyuki (25 November 2021). "Abrupt climate changes in the last two deglaciations simulated with different Northern ice sheet discharge and insolation". Scientific Reports. 11 (1): 22359. Bibcode:2021NatSR..1122359O. doi:10.1038/s41598-021-01651-2. PMC 8616927. PMID 34824287.
- ^ a b c Naughton, Filipa; Sánchez-Goñi, María F.; Landais, Amaelle; Rodrigues, Teresa; Riveiros, Natalia Vazquez; Toucanne, Samuel (2022). "The Bølling–Allerød Interstadial". In Palacios, David; Hughes, Philip D.; García-Ruiz, José M.; Andrés, Nuria (eds.). European Glacial Landscapes: The Last Deglaciation. Elsevier. pp. 45–50. doi:10.1016/C2021-0-00331-X. ISBN 978-0-323-91899-2.
- ^ Rasmussen, S. O.; Andersen, K. K.; Svensson, A. M.; Steffensen, J. P.; Vinther, B. M.; Clausen, H. B.; Siggaard-Andersen, M.-L.; Johnsen, S. J.; Larsen, L. B.; Dahl-Jensen, D.; Bigler, M. (2006). "A new Greenland ice core chronology for the last glacial termination". Journal of Geophysical Research. 111 (D6): D06102. Bibcode:2006JGRD..111.6102R. doi:10.1029/2005JD006079. ISSN 0148-0227.
- ^ a b Shakun, Jeremy D.; Clark, Peter U.; He, Feng; Marcott, Shaun A.; Mix, Alan C.; Liu, Zhenyu; Oto-Bliesner, Bette; Schmittner, Andreas; Bard, Edouard (4 April 2012). "Global warming preceded by increasing carbon dioxide concentrations during the last deglaciation". Nature. 484 (7392): 49–54. Bibcode:2012Natur.484...49S. doi:10.1038/nature10915. hdl:2027.42/147130. PMID 22481357. S2CID 2152480. Archived from the original on 18 January 2023. Retrieved 17 January 2023.
- ^ Brendryen, J.; Haflidason, H.; Yokoyama, Y.; Haaga, K. A.; Hannisdal, B. (20 April 2020). "Eurasian Ice Sheet collapse was a major source of Meltwater Pulse 1A 14,600 years ago". Nature Geoscience. 13 (5): 363–368. Bibcode:2020NatGe..13..363B. doi:10.1038/s41561-020-0567-4. hdl:11250/2755925. S2CID 216031874. Retrieved 26 December 2023.
- ^ Wade, Nicholas (2006). Before the Dawn. New York: Penguin Press. p. 123. ISBN 978-1-59420-079-3.
- ^ a b c Douville, H.; Raghavan, K.; Renwick, J.; Allan, R. P.; Arias, P. A.; Barlow, M.; Cerezo-Mota, R.; Cherchi, A.; Gan, T.Y.; Gergis, J.; Jiang, D.; Khan, A.; Pokam Mba, W.; Rosenfeld, D.; Tierney, J.; Zolina, O. (2021). Masson-Delmotte, V.; Zhai, P.; Pirani, A.; Connors, S. L.; Péan, C.; Berger, S.; Caud, N.; Chen, Y.; Goldfarb, L. (eds.). "Chapter 8: Water Cycle Changes" (PDF). Climate Change 2021: The Physical Science Basis. Contribution of Working Group I to the Sixth Assessment Report of the Intergovernmental Panel on Climate Change. Cambridge University Press, Cambridge, UK and New York, NY, US: 1055–1210. doi:10.1017/9781009157896.010. Archived (PDF) from the original on 29 September 2022. Retrieved 19 May 2024.
- ^ Keigwin, L. D.; Klotsko, S.; Zhao, N.; Reilly, B.; Giosan, L.; Driscoll, N. W. (9 July 2018). "Deglacial floods in the Beaufort Sea preceded Younger Dryas cooling". Nature Geoscience. 11 (8): 599–604. Bibcode:2018NatGe..11..599K. doi:10.1038/s41561-018-0169-6.
- ^ a b c d Kim, Soong-Ki; Kim, Hyo-Jeong; Dijkstra, Henk A.; An, Soon-Il (11 February 2022). "Slow and soft passage through tipping point of the Atlantic Meridional Overturning Circulation in a changing climate". npj Climate and Atmospheric Science. 5 (13) 13. Bibcode:2022npCAS...5...13K. doi:10.1038/s41612-022-00236-8. S2CID 246705201.
- ^ Hutchinson, David; Coxall, Helen; O'Regan, Matt; Nilsson, Johan; Caballero, Rodrigo; de Boer, Agatha (23 March 2020). "Arctic closure as a trigger for Atlantic overturning at the Eocene-Oligocene Transition". EGU General Assembly Conference Abstracts: 7493. Bibcode:2020EGUGA..22.7493H. doi:10.5194/egusphere-egu2020-7493. S2CID 225974919.
- ^ a b Molina, Maria J.; Hu, Aixue; Meehl, Gerald A. (22 November 2021). "Response of Global SSTs and ENSO to the Atlantic and Pacific Meridional Overturning Circulations". Journal of Climate. 35 (1): 49–72. doi:10.1175/JCLI-D-21-0172.1. OSTI 1845078. S2CID 244228477.
- ^ Gierz, Paul (31 August 2015). "Response of Atlantic Overturning to future warming in a coupled atmosphere-ocean-ice sheet model". Geophysical Research Letters. 42 (16): 6811–6818. Bibcode:2015GeoRL..42.6811G. doi:10.1002/2015GL065276.
- ^ Stommel, Henry (May 1961). "Thermohaline convection with two stable regimes of flow". Tellus. 13 (2): 224–230. Bibcode:1961Tell...13..224S. doi:10.1111/j.2153-3490.1961.tb00079.x (inactive 20 October 2025).
{{cite journal}}: CS1 maint: DOI inactive as of October 2025 (link) - ^ Hawkins, E.; Smith, R. S.; Allison, L. C.; Gregory, J. M.; Woollings, T. J.; Pohlmann, H.; De Cuevas, B. (2011). "Bistability of the Atlantic overturning circulation in a global climate model and links to ocean freshwater transport". Geophysical Research Letters. 38 (10): n/a. Bibcode:2011GeoRL..3810605H. doi:10.1029/2011GL047208. S2CID 970991.
- ^ Knutti, Reto; Stocker, Thomas F. (15 January 2002). "Limited predictability of the future thermohaline circulation close to an instability threshold". Journal of Climate. 15 (2): 179–186. Bibcode:2002JCli...15..179K. doi:10.1175/1520-0442(2002)015<0179:LPOTFT>2.0.CO;2. S2CID 7353330. Archived from the original on 30 May 2024. Retrieved 15 April 2024.
- ^ "Key findings of the Pentagon". The Guardian. 22 February 2004. Archived from the original on 20 March 2023. Retrieved 2 October 2022.
- ^ a b Nobre, Paulo; Veiga, Sandro F.; Giarolla, Emanuel; Marquez, André L.; da Silva Jr., Manoel B.; Capistrano, Vinícius B.; Malagutti, Marta; Fernandez, Julio P. R.; Soares, Helena C.; Bottino, Marcus J.; Kubota, Paulo Y.; Figueroa, Silvio N.; Bonatti, José P.; Sampaio, Gilvan; Casagrande, Fernanda; Costa, Mabel C.; Nobre, Carlos A. (23 September 2023). "AMOC decline and recovery in a warmer climate". Scientific Reports. 13 (1): 15928. Bibcode:2023NatSR..1315928N. doi:10.1038/s41598-023-43143-5. PMC 10517999. PMID 37741891.
- ^ a b c Valdes, Paul (2011). "Built for stability". Nature Geoscience. 4 (7): 414–416. Bibcode:2011NatGe...4..414V. doi:10.1038/ngeo1200. ISSN 1752-0908.
- ^ Rahmstorf, Stefan (12 September 2002). "Ocean circulation and climate during the past 120,000 years". Nature. 419 (6903): 207–214. Bibcode:2002Natur.419..207R. doi:10.1038/nature01090. PMID 12226675. S2CID 3136307.
- ^ Dijkstra, Henk A. (28 June 2008). "Characterization of the multiple equilibria regime in a global ocean model". Tellus A. 59 (5): 695–705. doi:10.1111/j.1600-0870.2007.00267.x. S2CID 94737971.
- ^ a b Drijfhout, Sybren S.; Weber, Susanne L.; van der Swaluw, Eric (26 October 2010). "The stability of the MOC as diagnosed from model projections for pre-industrial, present and future climates". Climate Dynamics. 37 (7–8): 1575–1586. doi:10.1007/s00382-010-0930-z. S2CID 17003970.
- ^ a b c Liu, Wei; Xie, Shang-Ping; Liu, Zhengyu; Zhu, Jiang (4 January 2017). "Overlooked possibility of a collapsed Atlantic Meridional Overturning Circulation in warming climate". Science Advances. 3 (1) e1601666. Bibcode:2017SciA....3E1666L. doi:10.1126/sciadv.1601666. PMC 5217057. PMID 28070560.
- ^ WCRP Global Sea Level Budget Group (2018). "Global sea-level budget 1993–present". Earth System Science Data. 10 (3): 1551–1590. Bibcode:2018ESSD...10.1551W. doi:10.5194/essd-10-1551-2018. hdl:20.500.11850/287786.
- ^ a b He, Feng; Clark, Peter U. (7 April 2022). "Freshwater forcing of the Atlantic Meridional Overturning Circulation revisited". Nature Climate Change. 12 (5): 449–454. Bibcode:2022NatCC..12..449H. doi:10.1038/s41558-022-01328-2. S2CID 248004571. Archived from the original on 14 April 2023. Retrieved 3 October 2022.
- ^ Hofmann, Matthias; Rahmstorf, Stefan (8 December 2009). "On the stability of the Atlantic meridional overturning circulation". Proceedings of the National Academy of Sciences. 106 (49): 20584–20589. doi:10.1073/pnas.0909146106. PMC 2791639. PMID 19897722.
- ^ a b Liu, Y.; Moore, J. K.; Primeau, F.; Wang, W. L. (22 December 2022). "Reduced CO2 uptake and growing nutrient sequestration from slowing overturning circulation". Nature Climate Change. 13: 83–90. doi:10.1038/s41558-022-01555-7. OSTI 2242376. S2CID 255028552.
- ^ a b Bakker, P; Schmittner, A; Lenaerts, JT; Abe-Ouchi, A; Bi, D; van den Broeke, MR; Chan, WL; Hu, A; Beadling, RL; Marsland, SJ; Mernild, SH; Saenko, OA; Swingedouw, D; Sullivan, A; Yin, J (11 November 2016). "Fate of the Atlantic Meridional Overturning Circulation: Strong decline under continued warming and Greenland melting". Geophysical Research Letters. 43 (23): 12, 252–12, 260. Bibcode:2016GeoRL..4312252B. doi:10.1002/2016GL070457. hdl:10150/622754. S2CID 133069692.
- ^ a b Sigmond, Michael; Fyfe, John C.; Saenko, Oleg A.; Swart, Neil C. (1 June 2020). "Ongoing AMOC and related sea-level and temperature changes after achieving the Paris targets". Nature Climate Change. 10 (7): 672–677. Bibcode:2020NatCC..10..672S. doi:10.1038/s41558-020-0786-0. S2CID 219175812.
- ^ a b Lohmann, Johannes; Ditlevsen, Peter D. (2 March 2021). "Risk of tipping the overturning circulation due to increasing rates of ice melt". Proceedings of the National Academy of Sciences. 118 (9) e2017989118. Bibcode:2021PNAS..11817989L. doi:10.1073/pnas.2017989118. ISSN 0027-8424. PMC 7936283. PMID 33619095.
- ^ a b Boers, Niklas (August 2021). "Observation-based early-warning signals for a collapse of the Atlantic Meridional Overturning Circulation" (PDF). Nature Climate Change. 11 (8): 680–688. Bibcode:2021NatCC..11..680B. doi:10.1038/s41558-021-01097-4. S2CID 236930519.
- ^ a b Ditlevsen, Peter; Ditlevsen, Susanne (25 July 2023). "Warning of a forthcoming collapse of the Atlantic meridional overturning circulation". Nature Communications. 14 (1): 4254. arXiv:2304.09160. Bibcode:2023NatCo..14.4254D. doi:10.1038/s41467-023-39810-w. ISSN 2041-1723. PMC 10368695. PMID 37491344.
- ^ a b "expert reaction to paper warning of a collapse of the Atlantic meridional overturning circulation". Science Media Centre. 25 July 2023. Archived from the original on 12 October 2023. Retrieved 11 August 2023.
- ^ "Open Letter by Climate Scientists to the Nordic Council of Ministers" (PDF). Archived (PDF) from the original on 30 October 2024. Retrieved 31 October 2024.
- ^ Pare, Sascha (22 October 2024). "Key Atlantic current could collapse soon, 'impacting the entire world for centuries to come,' leading climate scientists war". Live Science. Retrieved 31 October 2024.
- ^ M. Pontes, Gabriel; Menviel, Laurie (18 November 2024). "Weakening of the Atlantic Meridional Overturning Circulation driven by subarctic freshening since the mid-twentieth century". Nature Geoscience. 17 (12): 1291–1298. Bibcode:2024NatGe..17.1291P. doi:10.1038/s41561-024-01568-1. Archived from the original on 18 November 2024. Retrieved 20 November 2024.
- ^ a b c Smeed, D.A.; et al. (29 January 2018). "The North Atlantic Ocean Is in a State of Reduced Overturning". Geophysical Research Letters. 45 (3): 1527–1533. Bibcode:2018GeoRL..45.1527S. doi:10.1002/2017GL076350. S2CID 52088897.
- ^ Schiermeier, Quirin (2007). "Climate change: A sea change". Nature. 439 (7074): 256–60. Bibcode:2006Natur.439..256S. doi:10.1038/439256a. PMID 16421539. S2CID 4431161.
- ^ Leake, Jonathan (8 May 2005). "Britain faces big chill as ocean current slows". The Sunday Times. Archived from the original on 12 January 2006.
- ^ Schmidt, Gavin (26 May 2005). "Gulf Stream slowdown?". RealClimate.
- ^ "Satellites record weakening North Atlantic Current". ScienceDaily. 16 April 2004. Archived from the original on 18 June 2024. Retrieved 12 April 2024.
- ^ Pearce, Fred (30 November 2005). "Failing ocean current raises fears of mini ice age". New Scientist. Archived from the original on 20 September 2008. Retrieved 12 April 2022.
- ^ Schiermeier, Quirin (2007). "Ocean circulation noisy, not stalling". Nature. 448 (7156): 844–5. Bibcode:2007Natur.448..844S. doi:10.1038/448844b. PMID 17713489.
- ^ Våge, Kjetil; Pickart, Robert S.; Thierry, Virginie; Reverdin, Gilles; Lee, Craig M.; Petrie, Brian; Agnew, Tom A.; Wong, Amy; Ribergaard, Mads H. (2009). "Surprising return of deep convection to the subpolar North Atlantic Ocean in winter 2007–2008". Nature Geoscience. 2 (1): 67–72. Bibcode:2009NatGe...2...67V. doi:10.1038/ngeo382. hdl:1912/2840. Archived from the original on 8 May 2021. Retrieved 12 April 2022.
- ^ a b c d Armstrong McKay, David (9 September 2022). "Exceeding 1.5°C global warming could trigger multiple climate tipping points – paper explainer". climatetippingpoints.info. Archived from the original on 18 July 2023. Retrieved 2 October 2022.
- ^ Roberts, C. D.; Jackson, L.; McNeall, D. (31 March 2014). "Is the 2004–2012 reduction of the Atlantic meridional overturning circulation significant?". Geophysical Research Letters. 41 (9): 3204–3210. Bibcode:2014GeoRL..41.3204R. doi:10.1002/2014GL059473. S2CID 129713110.
- ^ Trenberth, Kevin E.; Fasullo, John T. (8 February 2017). "Atlantic meridional heat transports computed from balancing Earth's energy locally". Geophysical Research Letters. 44 (4): 1919–1927. Bibcode:2017GeoRL..44.1919T. doi:10.1002/2016GL072475.
- ^ Trenberth, Kevin E.; Zhang, Yongxin; Fasullo, John T.; Cheng, Lijing (15 July 2019). "Observation-Based Estimates of Global and Basin Ocean Meridional Heat Transport Time Series". Journal of Climate. 32 (14): 4567–4583. Bibcode:2019JCli...32.4567T. doi:10.1175/JCLI-D-18-0872.1.
- ^ Volkov, Denis L.; Smith, Ryan H.; Garcia, Rigoberto F.; Smeed, David A.; Moat, Ben I.; Johns, William E.; Baringer, Molly O. (5 September 2024). "Florida Current transport observations reveal four decades of steady state". Nature Communications. 15 (1): 7780. Bibcode:2024NatCo..15.7780V. doi:10.1038/s41467-024-51879-5. ISSN 2041-1723. PMC 11377814. PMID 39237510.
- ^ a b Worthington, Emma L.; Moat, Ben I.; Smeed, David A.; Mecking, Jennifer V.; Marsh, Robert; McCarthy, Gerard (15 February 2021). "A 30-year reconstruction of the Atlantic meridional overturning circulation shows no decline". Ocean Science. 17 (1): 285–299. Bibcode:2021OcSci..17..285W. doi:10.5194/os-17-285-2021. Archived from the original on 31 October 2023. Retrieved 3 October 2022.
- ^ Fu, Yao; Li, Feili; Karstensen, Johannes; Wang, Chunzai (27 November 2020). "A stable Atlantic Meridional Overturning Circulation in a changing North Atlantic Ocean since the 1990s". Science Advances. 6 (48) eabc7836. Bibcode:2020SciA....6.7836F. doi:10.1126/sciadv.abc7836. PMC 7695472. PMID 33246958.
- ^ Jackson, Laura C.; Biastoch, Arne; Buckley, Martha W.; Desbruyères, Damien G.; Frajka-Williams, Eleanor; Moat, Ben; Robson, Jon (1 March 2022). "The evolution of the North Atlantic Meridional Overturning Circulation since 1980". Nature Reviews Earth & Environment. 3 (4): 241–254. Bibcode:2022NRvEE...3..241J. doi:10.1038/s43017-022-00263-2. S2CID 247160367. Archived from the original on 14 April 2023. Retrieved 3 October 2022.
- ^ Mihai Dima; Gerrit Lohmann (2010). "Evidence for Two Distinct Modes of Large-Scale Ocean Circulation Changes over the Last Century" (PDF). Journal of Climate. 23 (1): 5–16. Bibcode:2010JCli...23....5D. doi:10.1175/2009JCLI2867.1. Archived (PDF) from the original on 23 January 2023. Retrieved 12 April 2022.
- ^ Caesar, L.; Rahmsdorf, S.; Robinson, A.; Feulner, G.; Saba, V. (11 April 2018). "Observed fingerprint of a weakening Atlantic Ocean overturning circulation" (PDF). Nature. 556 (7700): 191–196. Bibcode:2018Natur.556..191C. doi:10.1038/s41586-018-0006-5. PMID 29643485. S2CID 4781781. Archived (PDF) from the original on 21 March 2024. Retrieved 15 April 2024.
- ^ Menviel, Laurie. "Meltwater from Greenland and the Arctic is weakening ocean circulation, speeding up warming down south". UNSW Sydney. Archived from the original on 30 November 2024. Retrieved 29 November 2024.
- ^ a b Michel, Simon L. L.; Swingedouw, Didier; Ortega, Pablo; Gastineau, Guillaume; Mignot, Juliette; McCarthy, Gerard; Khodri, Myriam (2 September 2022). "Early warning signal for a tipping point suggested by a millennial Atlantic Multidecadal Variability reconstruction". Nature Communications. 13 (1): 5176. Bibcode:2022NatCo..13.5176M. doi:10.1038/s41467-022-32704-3. PMC 9440003. PMID 36056010.
- ^ Thornalley, David JR; et al. (11 April 2018). "Anomalously weak Labrador Sea convection and Atlantic overturning during the past 150 years" (PDF). Nature. 556 (7700): 227–230. Bibcode:2018Natur.556..227T. doi:10.1038/s41586-018-0007-4. PMID 29643484. S2CID 4771341. Archived (PDF) from the original on 21 March 2024. Retrieved 15 April 2024.
- ^ Jean Lynch-Stieglitz (2017). "The Atlantic Meridional Overturning Circulation and Abrupt Climate Change". Annual Review of Marine Science. 9: 83–104. Bibcode:2017ARMS....9...83L. doi:10.1146/annurev-marine-010816-060415. PMID 27814029.
- ^ a b Harvey, Fiona (26 February 2021). "Atlantic Ocean circulation at weakest in a millennium, say scientists". The Guardian. Archived from the original on 22 November 2023. Retrieved 27 February 2021.
- ^ Caesar, L.; McCarthy, G.D.; Thornalley, D. J. R.; Cahill, N.; Rahmstorf, S. (17 February 2022). "Reply to: Atlantic circulation change still uncertain". Nature Geoscience. 15 (3): 168–170. Bibcode:2022NatGe..15..168C. doi:10.1038/s41561-022-00897-3. S2CID 246901654. Archived from the original on 4 December 2024. Retrieved 15 April 2024.
- ^ Brown, Dwayne; Cabbage, Michael; McCarthy, Leslie; Norton, Karen (20 January 2016). "NASA, NOAA Analyses Reveal Record-Shattering Global Warm Temperatures in 2015". NASA. Archived from the original on 20 January 2016. Retrieved 21 January 2016.
- ^ a b Allan, David; Allan, Richard P. (5 December 2019). "Seasonal Changes in the North Atlantic Cold Anomaly: The Influence of Cold Surface Waters From Coastal Greenland and Warming Trends Associated With Variations in Subarctic Sea Ice Cover" (PDF). Journal of Geophysical Research: Oceans. 124 (12): 9040–9052. Bibcode:2019JGRC..124.9040A. doi:10.1029/2019JC015379. Archived (PDF) from the original on 19 November 2023. Retrieved 15 April 2024.
- ^ a b Fan, Yifei; Liu, Wei; Zhang, Pengfei; Chen, Ru; Li, Laifang (12 June 2023). "North Atlantic Oscillation contributes to the subpolar North Atlantic cooling in the past century". Climate Dynamics. 61 (11–12): 5199–5215. Bibcode:2023ClDy...61.5199F. doi:10.1007/s00382-023-06847-y.
- ^ a b Shi, Jian; Wang, Jiaqi; Ren, Zixuan; Tang, Cong; Huang, Fei (3 May 2023). "Cold blobs in the subpolar North Atlantic: seasonality, spatial pattern, and driving mechanisms". Ocean Dynamics. 73 (5): 267–278. Bibcode:2023OcDyn..73..267S. doi:10.1007/s10236-023-01553-z.
- ^ a b Mooney, Chris (30 September 2015). "Everything you need to know about the surprisingly cold 'blob' in the North Atlantic ocean". The Washington Post. Archived from the original on 1 February 2023. Retrieved 12 April 2022.
- ^ a b McSweeney, Robert (29 June 2020). "Scientists shed light on human causes of North Atlantic's 'cold blob'". Carbon Brief. Archived from the original on 29 March 2024. Retrieved 13 April 2024.
- ^ Müller, Jens Daniel; Gruber, N.; Carter, B.; Feely, R.; Ishii, M.; Lange, N.; Lauvset, S. K.; Murata, A.; Olsen, A.; Pérez, F. F.; Sabine, C.; Tanhua, T.; Wanninkhof, R.; Zhu, D. (10 August 2023). "Decadal Trends in the Oceanic Storage of Anthropogenic Carbon From 1994 to 2014". AGU Advances. 4 (4) e2023AV000875. Bibcode:2023AGUA....400875M. doi:10.1029/2023AV000875. hdl:10261/333982.
- ^ Canadell, J.G.; Monteiro, P.M.S.; Costa, M.H.; Cotrim da Cunha, L.; Cox, P.M.; Eliseev, A.V.; Henson, S.; Ishii, M.; Jaccard, S.; Koven, C.; Lohila, A. (2021). "Global Carbon and Other Biogeochemical Cycles and Feedbacks" (PDF). In Masson-Delmotte, V.; Zhai, P.; Piran, A.; Connors, S.L.; Péan, C.; Berger, S.; Caud, N.; Chen, Y.; Goldfarb, L. (eds.). Climate Change 2021 – the Physical Science Basis. Vol. 2021. pp. 673–816. Bibcode:2021AGUFM.U13B..05K. doi:10.1017/9781009157896.007. ISBN 978-1-009-15789-6. Archived (PDF) from the original on 6 April 2023. Retrieved 23 May 2022.
{{cite book}}:|journal=ignored (help) - ^ Zhu, Chenyu; Liu, Zhengyu (14 September 2020). "Weakening Atlantic overturning circulation causes South Atlantic salinity pile-up". Nature Climate Change. 10 (11): 998–1003. Bibcode:2020NatCC..10..998Z. doi:10.1038/s41558-020-0897-7. S2CID 221674578.
- ^ Claret, Mariona; Galbraith, Eric D.; Palter, Jaime B.; Bianchi, Daniele; Fennel, Katja; Gilbert, Denis; Dunne, John P. (17 September 2018). "Rapid coastal deoxygenation due to ocean circulation shift in the northwest Atlantic". Nature Climate Change. 8 (10): 868–872. Bibcode:2018NatCC...8..868C. doi:10.1038/s41558-018-0263-1. PMC 6218011. PMID 30416585.
- ^ "Large-scale shift causing lower-oxygen water to invade Canada's Gulf of St. Lawrence". Phys.org. 17 September 2018. Archived from the original on 5 March 2024. Retrieved 13 April 2024.
- ^ Osman, Matthew B.; Das, Sarah B.; Trusel, Luke D.; Evans, Matthew J.; Fischer, Hubertus; Grieman, Mackenzie M.; Kipfstuhl, Sepp; McConnell, Joseph R.; Saltzman, Eric S. (6 May 2019). "Industrial-era decline in subarctic Atlantic productivity". Nature. 569 (7757): 551–555. Bibcode:2019Natur.569..551O. doi:10.1038/s41586-019-1181-8. PMID 31061499. S2CID 146118196.
- ^ Jongebloed, Ursula A.; Schauer, Andrew J.; Cole-Dai, Jihong; Larrick, Carleigh G.; Porter, William C.; Tashmim, Linia; Zhai, Shuting; Salimi, Sara; Edouard, Shana R.; Geng, Lei; Alexander, Becky (17 November 2023). "Industrial-era decline in Arctic methanesulfonic acid is offset by increased biogenic sulfate aerosol". Proceedings of the National Academy of Sciences. 120 (47) e2307587120. Bibcode:2023PNAS..12007587J. doi:10.1073/pnas.2307587120. PMID 37976260.
- ^ Chalif, Jacob I.; Jongebloed, Ursula A.; Osterberg, Erich C.; Koffman, Bess G.; Alexander, Becky; Winski, Dominic A.; Polashenski, David J.; Stamieszkin, Karen; Ferris, David G.; Kreutz, Karl J.; Wake, Cameron P.; Cole-Dai, Jihong (23 September 2024). "Pollution drives multidecadal decline in subarctic methanesulfonic acid". Nature Geoscience. 17 (10): 1016–1021. Bibcode:2024NatGe..17.1016C. doi:10.1038/s41561-024-01543-w.
- ^ a b Bellomo, Katinka; Angeloni, Michela; Corti, Susanna; von Hardenberg, Jost (16 June 2021). "Future climate change shaped by inter-model differences in Atlantic meridional overturning circulation response". Nature Communications. 12 (1): 3659. Bibcode:2021NatCo..12.3659B. doi:10.1038/s41467-021-24015-w. PMC 8209213. PMID 34135324.
- ^ Zhu, Jiang; Liu, Zhengyu; Zhang, Jiaxu; Liu, Wei (14 May 2014). "AMOC response to global warming: dependence on the background climate and response timescale". Climate Dynamics. 44 (11–12): 3449–3468. doi:10.1007/s00382-014-2165-x.
- ^ IPCC, 2021: Summary for Policymakers Archived 11 August 2021 at the Wayback Machine. In: Climate Change 2021: The Physical Science Basis. Contribution of Working Group I to the Sixth Assessment Report of the Intergovernmental Panel on Climate Change Archived 26 May 2023 at the Wayback Machine [Masson-Delmotte, V., P. Zhai, A. Pirani, S.L. Connors, C. Péan, S. Berger, N. Caud, Y. Chen, L. Goldfarb, M. I. Gomis, M. Huang, K. Leitzell, E. Lonnoy, J. B. R. Matthews, T. K. Maycock, T. Waterfield, O. Yelekçi, R. Yu, and B. Zhou (eds.)]. Cambridge University Press, Cambridge, United Kingdom and New York, New York, US, pp. 3−32, doi:10.1017/9781009157896.001.
- ^ a b Hassan, Taufiq; Allen, Robert J.; et al. (27 June 2022). "Air quality improvements are projected to weaken the Atlantic meridional overturning circulation through radiative forcing effects". Communications Earth & Environment. 3 (3): 149. Bibcode:2022ComEE...3..149H. doi:10.1038/s43247-022-00476-9. S2CID 250077615.
- ^ Heuze, Celine (13 January 2021). "Antarctic Bottom Water and North Atlantic Deep Water in CMIP6 models". Ocean Science. 17 (1): 59–90. Bibcode:2021OcSci..17...59H. doi:10.5194/os-17-59-2021.
- ^ Sadai, Shaina; Condron, Alan; DeConto, Robert; Pollard, David (23 September 2020). "Future climate response to Antarctic Ice Sheet melt caused by anthropogenic warming". Science Advances. 6 (39) eaaz1169. Bibcode:2020SciA....6.1169S. doi:10.1126/sciadv.aaz1169. PMC 7531873. PMID 32967838.
- ^ a b Drijfhout, Sybren; Angevaare, Joran R.; Mecking, Jennifer V.; van Westen, René M.; Rahmstorf, Stefan (28 August 2025). "Shutdown of northern Atlantic overturning after 2100 following deep mixing collapse in CMIP6 projections". Environmental Research Letters. 20 (9): 094062. Bibcode:2025ERL....20i4062D. doi:10.1088/1748-9326/adfa3b.
- ^ "Tipping Elements – big risks in the Earth System". Potsdam Institute for Climate Impact Research. Archived from the original on 31 January 2024. Retrieved 31 January 2024.
- ^ IPCC TAR WG1 (2001). "9.3.4.3 Thermohaline circulation changes". In Houghton, J.T.; Ding, Y.; Griggs, D.J.; Noguer, M.; van der Linden, P.J.; Dai, X.; Maskell, K.; Johnson, C.A. (eds.). Climate Change 2001: The Scientific Basis. Contribution of Working Group I to the Third Assessment Report of the Intergovernmental Panel on Climate Change. Cambridge University Press. ISBN 978-0-521-80767-8. (pb: 0-521-01495-6)
- ^ "IPCC AR5 WG1" (PDF). IPCC. p. Table 12.4. Archived from the original (PDF) on 24 August 2015.
- ^ Mecking, J.V.; Drijfhout, S.S.; Jackson, L.C.; Andrews, M.B. (1 January 2017). "The effect of model bias on Atlantic freshwater transport and implications for AMOC bi-stability". Tellus A: Dynamic Meteorology and Oceanography. 69 (1) 1299910. Bibcode:2017TellA..6999910M. doi:10.1080/16000870.2017.1299910. S2CID 133294706.
- ^ Weijer, W.; Cheng, W.; Drijfhout, S. S.; Fedorov, A. V.; Hu, A.; Jackson, L. C.; Liu, W.; McDonagh, E. L.; Mecking, J. V.; Zhang, J. (2019). "Stability of the Atlantic Meridional Overturning Circulation: A Review and Synthesis". Journal of Geophysical Research: Oceans. 124 (8): 5336–5375. Bibcode:2019JGRC..124.5336W. doi:10.1029/2019JC015083. ISSN 2169-9275. S2CID 199807871.
- ^ Climate Change 2023: Synthesis Report. Contribution of Working Groups I, II and III to the Sixth Assessment Report of the Intergovernmental Panel on Climate Change (PDF). Geneva, Switzerland: United Nations. 2023. pp. 18, 78. Archived (PDF) from the original on 25 July 2023. Retrieved 21 November 2024.
- ^ State of the Cryosphere 2024 Lost Ice, Global Damage (PDF). International Cryosphere Climate Initiative. November 2024. pp. x (in the beginning), 8, 48, 52. Archived (PDF) from the original on 19 November 2024. Retrieved 20 November 2024.
- ^ "State of the Cryosphere Report 2024 Lost Ice, Global Damage". UNESCO. Archived from the original on 21 November 2024. Retrieved 20 November 2024.
- ^ Baker, J.A.; Bell, M.J.; Jackson, L.C.; Vallis, G.K.; Watson, A.J.; Wood, R.A. (26 February 2025). "Continued Atlantic overturning circulation even under climate extremes". Nature. 638 (8052): 987–994. Bibcode:2025Natur.638..987B. doi:10.1038/s41586-024-08544-0. hdl:10871/139390. PMC 11864975. PMID 40011721.
- ^ a b Tzedakis, P. C.; Drysdale, R. N.; Margari, V.; Skinner, L. C.; Menviel, L.; Rhodes, R. H.; Taschetto, A. S.; Hodell, D. A.; Crowhurst, S. J.; Hellstrom, J. C.; Fallick, A. E.; Grimalt, J. O.; McManus, J. F.; Martrat, B.; Mokeddem, Z.; Parrenin, F.; Regattieri, E.; Roe, K.; Zanchetta, G. (12 October 2018). "Enhanced climate instability in the North Atlantic and southern Europe during the Last Interglacial". Nature Communications. 9 (1): 4235. Bibcode:2018NatCo...9.4235T. doi:10.1038/s41467-018-06683-3. hdl:11343/220077. PMC 6185935. PMID 30315157.
- ^ a b Liu, Wei; Fedorov, Alexey V.; Xie, Shang-Ping; Hu, Shineng (26 June 2020). "Climate impacts of a weakened Atlantic Meridional Overturning Circulation in a warming climate". Science Advances. 6 (26) eaaz4876. Bibcode:2020SciA....6.4876L. doi:10.1126/sciadv.aaz4876. PMC 7319730. PMID 32637596.
- ^ Yin, Jianjun & Griffies, Stephen (25 March 2015). "Extreme sea level rise event linked to AMOC downturn". CLIVAR. Archived from the original on 18 May 2015.
- ^ Mooney, Chris (1 February 2016). "Why the U.S. East Coast could be a major 'hotspot' for rising seas". The Washington Post. Archived from the original on 31 March 2020. Retrieved 12 April 2022.
- ^ Karmalkar, Ambarish V.; Horton, Radley M. (23 September 2021). "Drivers of exceptional coastal warming in the northeastern United States". Nature Climate Change. 11 (10): 854–860. Bibcode:2021NatCC..11..854K. doi:10.1038/s41558-021-01159-7. S2CID 237611075.
- ^ Krajick, Kevin (23 September 2021). "Why the U.S. Northeast Coast Is a Global Warming Hot Spot". Columbia Climate School. Archived from the original on 27 September 2023. Retrieved 23 March 2023.
- ^ University of South Florida (22 January 2016). "Melting Greenland ice sheet may affect global ocean circulation, future climate". Phys.org. Archived from the original on 19 August 2023. Retrieved 12 April 2022.
- ^ Hansen, James; Sato, Makiko (2015). "Predictions Implicit in "Ice Melt" Paper and Global Implications". Archived from the original on 23 September 2015.
- ^ Dietz, Simon; Rising, James; Stoerk, Thomas; Wagner, Gernot (24 August 2021). "Economic impacts of tipping points in the climate system". Proceedings of the National Academy of Sciences. 118 (34) e2103081118. Bibcode:2021PNAS..11803081D. doi:10.1073/pnas.2103081118. PMC 8403967. PMID 34400500.
- ^ Keen, Steve; Lenton, Timothy M.; Garrett, Timothy J.; Rae, James W. B.; Hanley, Brian P.; Grasselli, Matheus (19 May 2022). "Estimates of economic and environmental damages from tipping points cannot be reconciled with the scientific literature". Proceedings of the National Academy of Sciences. 119 (21) e2117308119. Bibcode:2022PNAS..11917308K. doi:10.1073/pnas.2117308119. PMC 9173761. PMID 35588449.
- ^ Dietz, Simon; Rising, James; Stoerk, Thomas; Wagner, Gernot (19 May 2022). "Reply to Keen et al.: Dietz et al. modeling of climate tipping points is informative even if estimates are a probable lower bound". Proceedings of the National Academy of Sciences. 119 (21) e2201191119. Bibcode:2022PNAS..11901191D. doi:10.1073/pnas.2201191119. PMC 9173815. PMID 35588452.
- ^ Chen, Xianyao; Tung, Ka-Kit (18 July 2018). "Global surface warming enhanced by weak Atlantic overturning circulation". Nature. 559 (7714): 387–391. Bibcode:2018Natur.559..387C. doi:10.1038/s41586-018-0320-y. PMID 30022132. S2CID 49865284.
- ^ McSweeney, Robert (18 July 2018). "Slowdown of Atlantic conveyor belt could trigger 'two decades' of rapid global warming". Carbon Brief. Archived from the original on 19 May 2024. Retrieved 19 May 2024.
However, writing on the website RealClimate, climate scientists Prof Michael Mann, from Penn State, and Prof Stefan Rahmstorf, from the Potsdam Institute for Climate Impact Research, say that a weaker AMOC bringing warming runs counter to existing research
- ^ Wunderling, Nico; Donges, Jonathan F.; Kurths, Jürgen; Winkelmann, Ricarda (3 June 2021). "Interacting tipping elements increase risk of climate domino effects under global warming". Earth System Dynamics. 12 (2): 601–619. Bibcode:2021ESD....12..601W. doi:10.5194/esd-12-601-2021. ISSN 2190-4979. S2CID 236247596. Archived from the original on 4 June 2021. Retrieved 4 June 2021.
- ^ Curtis, Paul Edwin; Fedorov, Alexey V. (6 April 2024). "Collapse and slow recovery of the Atlantic Meridional Overturning Circulation (AMOC) under abrupt greenhouse gas forcing". Climate Dynamics. 62 (7): 5949. Bibcode:2024ClDy...62.5949C. doi:10.1007/s00382-024-07185-3.
- ^ University Of Illinois at Urbana-Champaign (20 December 2004). "Shutdown Of Circulation Pattern Could Be Disastrous, Researchers Say". ScienceDaily. Archived from the original on 13 January 2005. Retrieved 12 April 2022.
- ^ "Weather Facts: North Atlantic Drift (Gulf Stream) | weatheronline.co.uk". www.weatheronline.co.uk. Archived from the original on 1 September 2023. Retrieved 12 April 2023.
- ^ "The North Atlantic Drift Current". oceancurrents.rsmas.miami.edu. Archived from the original on 4 September 2011. Retrieved 12 April 2023.
- ^ Vellinga, M.; Wood, R.A. (2002). "Global climatic impacts of a collapse of the Atlantic thermohaline circulation" (PDF). Climatic Change. 54 (3): 251–267. Bibcode:2002ClCh...54..251V. doi:10.1023/A:1016168827653. S2CID 153075940. Archived from the original (PDF) on 6 September 2006.
- ^ Ritchie, Paul D. L.; Smith, Greg S.; Davis, Katrina J.; Fezzi, Carlo; Halleck-Vega, Solmaria; Harper, Anna B.; Boulton, Chris A.; Binner, Amy R.; Day, Brett H.; Gallego-Sala, Angela V.; Mecking, Jennifer V.; Sitch, Stephen A.; Lenton, Timothy M.; Bateman, Ian J. (13 January 2020). "Shifts in national land use and food production in Great Britain after a climate tipping point". Nature Food. 1: 76–83. doi:10.1038/s43016-019-0011-3. hdl:10871/39731. S2CID 214269716.
- ^ Watts, Jonathan (9 February 2024). "Atlantic Ocean circulation nearing 'devastating' tipping point, study finds". The Guardian. ISSN 0261-3077. Retrieved 10 February 2024.
- ^ "James Hansen's controversial sea level rise paper has now been published online". The Washington Post. 23 July 2015. Archived from the original on 26 November 2019. Retrieved 13 April 2024.
- ^ Wald, Lucien (2021). "Definitions of time: from year to second". Fundamentals of solar radiation. Boca Raton: CRC Press. ISBN 978-0-367-72588-4.
- ^ Williamson, Mark S.; Collins, Mat; Drijfhout, Sybren S.; Kahana, Ron; Mecking, Jennifer V.; Lenton, Timothy M. (17 June 2017). "Effect of AMOC collapse on ENSO in a high resolution general circulation model". Climate Dynamics. 50 (7–8): 2537–2552. doi:10.1007/s00382-017-3756-0. hdl:10871/28079. S2CID 55707315.
- ^ Orihuela-Pinto, Bryam; England, Matthew H.; Taschetto, Andréa S. (6 June 2022). "Interbasin and interhemispheric impacts of a collapsed Atlantic Overturning Circulation". Nature Climate Change. 12 (6): 558–565. Bibcode:2022NatCC..12..558O. doi:10.1038/s41558-022-01380-y. S2CID 249401296.
- ^ Orihuela-Pinto, Bryam; Santoso, Agus; England, Matthew H.; Taschetto, Andréa S. (19 July 2022). "Reduced ENSO Variability due to a Collapsed Atlantic Meridional Overturning Circulation". Journal of Climate. 35 (16): 5307–5320. Bibcode:2022JCli...35.5307O. doi:10.1175/JCLI-D-21-0293.1. hdl:1959.4/unsworks_80930. S2CID 250720455.
- ^ "A huge Atlantic ocean current is slowing down. If it collapses, La Niña could become the norm for Australia". The Conversation. 6 June 2022. Archived from the original on 24 November 2023. Retrieved 3 October 2022.
- ^ Ciemer, Catrin; Winkelmann, Ricarda; Kurths, Jürgen; Boers, Niklas (28 June 2021). "Impact of an AMOC weakening on the stability of the southern Amazon rainforest". The European Physical Journal Special Topics. 230 (14–15): 3065–3073. Bibcode:2021EPJST.230.3065C. doi:10.1140/epjs/s11734-021-00186-x. S2CID 237865150.
- ^ Yamamoto, A.; Abe-Ouchi, A.; Shigemitsu, M.; Oka, A.; Takahashi, K.; Ohgaito, R.; Yamanaka, Y. (5 October 2015). "Global deep ocean oxygenation by enhanced ventilation in the Southern Ocean under long-term global warming". Global Biogeochemical Cycles. 29 (10): 1801–1815. Bibcode:2015GBioC..29.1801Y. doi:10.1002/2015GB005181. S2CID 129242813.
| Waves |
|   |
|---|---|---|
| Circulation |
| |
| Tides | ||
| Landforms |
| |
| Plate tectonics | ||
| Ocean zones | ||
| Sea level | ||
| Acoustics | ||
| Satellites | ||
| Related |
| |
Atlantic meridional overturning circulation
View on GrokipediaDefinition and Components
Physical Structure and Mechanisms
The Atlantic Meridional Overturning Circulation (AMOC) comprises a northward flux of warm, saline waters in the upper ocean layers, balanced by a southward return of colder, denser deep waters. This structure is evident in meridional sections where the overturning streamfunction peaks at approximately 15–20 Sverdrups (Sv), with the upper branch occupying depths shallower than about 1000 meters and the lower branch extending to abyssal depths.[12][13] Key components include the northward-flowing Gulf Stream and North Atlantic Current in the upper limb, which transport heat and salt poleward, and the formation of North Atlantic Deep Water (NADW) through deep convection in the Nordic Seas and Labrador Sea. NADW, characterized by temperatures around 2–4°C and salinities of 34.9–35.0, constitutes the primary southward branch, while a shallower return flow of Antarctic Bottom Water (AABW) occupies the deep western boundary. The density-driven nature arises from cooling and increased salinity in the subpolar North Atlantic, where winter convection reaches depths of 2000 meters or more, enabling water mass transformation.[14][15][16] Mechanisms sustaining the AMOC involve buoyancy forcing from surface heat loss and evaporation minus precipitation, creating meridional density gradients that drive the sinking of dense waters. Unlike wind-driven gyres, the overturning is primarily thermohaline, with density differences (Δρ/ρ ≈ 10^{-3}) generating geostrophic flows that compensate the meridional pressure gradients. Observational estimates from programs like RAPID confirm the buoyancy component dominates the total overturning, with wind contributions modulating but not overturning the circulation.[17][18][14] The interplay of advection and diffusion maintains the required salinity contrast, as freshwater inputs in the south must be balanced by export northward; disruptions in this salt-advection feedback can alter stability, though empirical data indicate robustness under current forcings. Vertical shear in the flow arises from thermal wind balance, with warmer surface waters sloping equatorward in the deep return path.[15][8]Key Subsurface and Surface Elements
The surface branch of the Atlantic Meridional Overturning Circulation (AMOC) features northward transport of warm, saline water from subtropical to subpolar latitudes, primarily via the Gulf Stream and North Atlantic Current, with peak intensities of 13–20 Sverdrups (Sv).[15] The Gulf Stream separates from the North American coast at Cape Hatteras, continuing as the North Atlantic Current eastward of the Grand Banks.[15] This upper-ocean flow, extending to depths of roughly 1000 m, is driven by westerly winds inducing Ekman transport and buoyancy gradients from air-sea heat and freshwater fluxes.[18] In the subpolar North Atlantic, wintertime cooling and evaporation salinize surface waters, increasing density and triggering open-ocean convection that penetrates to depths exceeding 1500 m.[18] The subsurface branch comprises the southward return of cold, dense North Atlantic Deep Water (NADW) in the deep western boundary current, at rates of 13–17 Sv below 2000 m.[15] NADW formation totals 15–18 Sv, augmented by entrainment, with primary sources in the Nordic Seas and Labrador Sea.[18] In the Nordic Seas, deep convection reaches 3000 m, followed by dense overflows across the Greenland-Scotland Ridge: Denmark Strait Overflow Water (2.4–2.9 Sv) and Faroe Bank Channel overflow (2.4–2.7 Sv), contributing to lower NADW.[18] The Labrador Sea generates Labrador Sea Water (LSW) through convection to 1500–2200 m, yielding 2–4 Sv of relatively fresh (salinity <34.88), cold water that forms upper NADW after mixing with overflow components like Iceland-Scotland and Denmark Strait waters.[19][18] LSW acts as a salinity minimum at intermediate depths, ventilating the North Atlantic and influencing NADW properties through entrainment and spreading.[19] The deep southward flow balances surface convergence via diapycnal mixing and wind-driven upwelling, predominantly in the Southern Ocean.[18]