
Community hub
Litter
View on Wikipedia| Part of a series on |
| Pollution |
|---|
 |

Litter consists of waste products that have been discarded incorrectly, without consent, at an unsuitable location. The waste are objects, often man-made, such as aluminum cans, paper cups, food wrappers, cardboard boxes or plastic bottles, but also large and hazardous items of rubbish such as tires, electrical appliances, electronics, batteries and large industrial containers are sometimes dumped in isolated locations, such as national forests and other public lands.
Litter is a type of human impact on the environment and is a serious environmental problem in many countries. Litter can exist in the environment for long periods of time before decomposition and be transported over large distances into the world's oceans. Litter can negatively affect quality of life.
Cigarette butts are the most littered item in the world, with an estimated 4.5 trillion discarded each year.[1] Estimates of the required time for cigarette butts to break down vary, ranging from 5 to 400 years for complete degradation.[2][3]
Causes
[edit].jpg)
,_02.31.07.jpg)


In addition to intentional littering, almost half of litter on U.S. roadways is now accidental or unintentional litter, usually debris that falls off improperly secured trash, recycling collection vehicles and pickup trucks.[4] Population levels, traffic density and proximity to waste disposal sites are factors known to correlate with higher litter rates.[5][6][7][8][9]
Illegally dumped hazardous waste may be a response to the costs of dropping materials at designated sites: some of these charge a fee for depositing hazardous material.[10] Lack of access to nearby facilities that accept hazardous waste may deter use. Additionally, ignorance of the laws that regulate the proper disposal of hazardous waste may cause improper disposal.
According to a study by the Dutch organization VROM, 80% of people claim that "everybody leaves a piece of paper, tin or something, on the street behind".[11] Young people from 12 to 24 years cause more litter than the average (Dutch or Belgian) person; only 18% of people who regularly cause litter were 50 years of age or older. However, a 2010 survey of littering in Maine, New Hampshire and Vermont in the United States, placed litterers aged 55 and over at less than 5%. The same observational study estimated that 78% of litterers are male.[9] Litter organizations, such as Keep America Beautiful affiliates, Keep Northern Ireland Beautiful, and the Bay Area Stormwater Management Agencies Association, have focused educational efforts on youth littering.[12][13][14]
Negligent or lenient law enforcement contributes to littering behavior. Other causes are inconvenience, entitlement and economic conditions. A survey of dumping in Pennsylvania found that the largest number of illegal dumps were in townships without municipal trash hauling.[15] The same report also cites unavailability of curbside trash and recycling service, shortage of enforcement, and habit as possible causes.[16] The presence of litter invites more littering.[17]
Two-stage process model
[edit]The two-stage process model of littering behavior describes the different ways in which people litter. The model was proposed by Chris Sibley and James Liu and differentiates between two types of littering: active and passive.[18]
The theory has implications for understanding the different types of litter reduction interventions that will most effectively reduce littering in a given environment. The theory states that, all things being equal, passive littering will be more resistant to change because of two psychological processes: 1. diffusion of responsibility that increases as the latency between when an individual places litter in the environment and when they vacate the territory, and 2. forgetting, which is also more likely to occur at longer delays between when an individual places litter in the environment and when they vacate the territory.
Life cycle
[edit]Litter can remain visible for extended periods of time before it eventually biodegrades, with some items made of condensed glass, styrofoam or plastic possibly remaining in the environment for over a million years.[19][20][21]
About 18 percent of litter, usually traveling through stormwater systems, ends up in local streams, rivers, and waterways. Uncollected litter can accrete and flow into streams, local bays and estuaries. Litter in the ocean either washes up on beaches or collects in ocean gyres such as the Great Pacific Garbage Patch. About 80 percent of marine debris comes from land-based sources.[22]
Some litter that is collected can be recycled; however, degraded litter cannot be recycled and eventually degrades to sludge, often toxic. The majority of litter that is collected goes to landfills.
Effects
[edit]Litter can have a detrimental impact on humans and the environment in different ways.
Effects on humans
[edit]
Hazardous materials encapsulated within tires and other items of illegally dumped rubbish can leach into water sources, contaminate the soil and pollute the air.
Tires are the most often dumped hazardous waste.[citation needed] In 2007 the United States generated 262 million scrap tires.[23] Thirty-eight states have laws that ban whole tires being deposited in landfills.[24] Many of these discarded tires end up illegally dumped on public lands. Tires can become a breeding ground for insect vectors which can transmit disease to humans.[25] Mosquitoes, which breed in stagnant water, can transmit West Nile virus and malaria. Rodents nest in accumulated tires and can transmit diseases such as Hantavirus.[25]
When tires are burned, they can smolder for long periods of time, emitting hundreds of chemical compounds that pollute the air causing respiratory illnesses. Additionally the residue left behind can harm the soil and leach into groundwater.[25]

Visual pollution is a major effect of litter.
Open containers such as paper cups, cardboard food packets, plastic drink bottles and aluminum drinks cans get filled up with rainwater, providing breeding locations for mosquitoes. In addition, a spark or a lightning flash can start a fire if it strikes litter such as a paper bag or cardboard box.
Litter can be hazardous to health. Debris falling from vehicles is an increasing cause of automobile accidents.[26] Discarded dangerous goods, chemicals, tires, sharps waste and pathogens resulting from litter can cause accidental harm to humans.
Litter also carries substantial cost to the economy. Cleaning up litter in the US costs hundreds of dollars per ton, about ten times more than the cost of trash disposal, with a cost totaling about $11 billion per year.[5][27]
Effects on wildlife
[edit]Animals may get trapped or poisoned with litter in their habitats. Cigarette butts and filters are a threat to wildlife and have been found in the stomachs of fish, birds and whales, who have mistaken them for food.[28] Also, animals can get trapped in the rubbish and be in serious discomfort. For example, the plastic used to hold beverage cans together can get wrapped around animals' necks and cause them to suffocate as they grow.[29] Other instances where animals could be harmed by litter include broken glass lacerating the paws of dogs, cats, and other small mammals.
Other effects
[edit]Organic litter in large amounts can cause water pollution and lead to algal blooms.[30] Cigarettes could also start fires if they are not put out and then discarded in the environment.
Extent
[edit]Litter is an environmental concern in many countries around the world. While countries in the developing world lack the resources to deal with the issue, consumer-based economies in the western world are capable of generating larger quantities of litter per capita due to a higher consumption of disposable products.
Branded litter
[edit]A number of credible studies have shown that fast food packaging is one of the most common forms of litter, while McDonald's is the most common brand of litter, despite having messages to dispose of it properly, such as the Ronald McDonald "tidy man" marking.[31][32] According to Keep Britain Tidy in 2013, Cadbury chocolate wrappers, Walkers crisp packets and Coca-Cola cans were the three top brands that were the most common pieces of rubbish found in UK streets.[33]
Solutions
[edit]


Litter bins
[edit]
Public waste containers or street bins are provided by local authorities to be used as a convenient place for the disposal and collection of litter. Increasingly both general waste and recycling options are provided. Local councils collect the waste and take it for reuse or recycling. However, there are some problems with this approach; if the bins are not emptied regularly, then the bins will overflow and can increase litter indirectly. Some local authorities will only take responsibility for rubbish that is placed in the bins, which means that litter remains a problem. People may blame a lack of well-placed bins for their littering. Hazardous materials may often be incorrectly disposed of in the bins and they can encourage dumpster diving.
Cleanup
[edit]Volunteers, sometimes alone or coordinated through organizations, pick up litter and dispose of it. Clean up events may be organized in which participants will sometimes comb an area in a line to ensure that no litter is missed. Organizations may promote litter cleanup events and may also have separate media campaigns to prevent littering. In North America, Adopt a Highway programs are popular, in which companies and organizations commit to cleaning stretches of road. Keep America Beautiful has held litter cleanups called the Great America Cleanup since 1998 in over 20,000 communities nationwide.[34] Earth Day cleanups have been held globally since 1970. In 2019, Earth Day Network partnered with Keep America Beautiful and National Cleanup Day for the inaugural nationwide Earth Day CleanUp. Cleanups were held in all 50 States, 5 US Territories, 5,300 sites and had more than 500,000 volunteers.[35][36][37] Commercial properties such as retail, office and industrial have litter picking maintenance programs. This service may be provided by property owners or contracted to various service providers by property management companies acting on owner's behalf. Litter picking is performed on foot using simple hand tools. A worker will walk the sidewalks, parking lot and landscape and sweep up litter material into a litter collection tool. Contents are emptied into a waste bin on job site. In Kiwayu, a Kenyan island, some of the collected litter (flip-flops) is used to make art, which is then sold.[38][39]
Litter traps
[edit]
Litter traps can be used to capture litter as it exits stormwater drains into waterways. However, litter traps are only effective for large or floating items of litter and must be maintained. A recent watershed litter survey showed a difference in the composition of street litter and stormwater litter.[40]
Monitoring dumping sites
[edit]Increasingly, there have been efforts to use technology to monitor areas prone to dumping. In Japan, a study used Geographic Information Systems (GIS) to map areas of dumping based on site characteristics.[41] Another study used satellite images to detect possible illegal dumping sites.[42]
Container deposit legislation
[edit]Container deposit legislation can be aimed at both reducing littering and also encouraging picking up through local recycling programs that offer incentives, particularly for aluminium cans, glass bottles and plastic bottles. In New York, an expanded bottle bill that included plastic water bottles increased recycling rates and generated $120 million in revenue to the state General Fund from unclaimed deposits in 2010.[43]
In some countries such as Germany and the Netherlands, container-deposit legislation has been introduced on cans and plastic bottles. Parts of Belgium are also considering adopting such legislation.[44] People can thus collect refund value money from this type of waste. The result of this is that in Germany, hardly any cans or plastic bottles can still be found along the road. In the Netherlands, the amount of litter has dropped considerably since the new law was implemented, and 95% of the plastic bottles are now recycled. According to Chris Snick, the revenue that can be obtained from waste picking can be financially profitable in countries where container deposit legislation has been introduced: in 1 hour he managed to pick up 108 cans and 31 plastic bottles, earning him 13.90 euro (€0.10 per can/plastic bottle).[45] By comparison, in countries where only the value of the aluminum for example would be refunded, 139 cans would yield only 1.72 euro (0.0124 euro per can; assuming there is 15 grams of aluminum in a can, and with scrap aluminum valued at 0.8267 euro/kg[46]).
Fines
[edit]
Some countries and local authorities have introduced legislation to address the problem.
Actions resulting in fines can include on-the-spot fines for individuals administered by authorised officers in public or on public transport or littering from a vehicle, in which the vehicle owner is fined – reported by either responsible officer or third party, sometimes online.[47][48]
Specific legislation exists in the following countries:
- United States – punishable by a minimum fine of $200 and a maximum fine of $1,000 or even more in some states for a first offence, community service, or both, as set out by state statutes and city ordinances. All 50 states have anti-litter laws, with various fines, community service, and/or imprisonment as possible punishment.[49]
- United Kingdom – Leaving litter is an offence under the Environmental Protection Act 1990. This was extended by the Clean Neighbourhoods and Environment Act 2005 under section 18. It carries a maximum penalty of £2500 upon conviction. However, many local authorities issue fixed penalty notices under section 88 of the Environmental Protection Act 1990. Often incorrectly known as "on the spot fines", they do not have to be issued on the spot. Nor are they a fine.[citation needed] If an alleged offender does not want to pay a fixed penalty notice, they can have the case heard in the Magistrates Court.
- Australia – no national legislation, although state based environmental protection authorities have laws and fines to discourage littering.
- The Netherlands – Dutch police and local supervisors (known as buitengewoon opsporingsambtenaar, or BOA) fine citizens for throwing away cans, bottles or wrappers on the street.
- Switzerland – dumping refuse and household waste inappropriately or illegally incurs a heavy fine.
Gallery
[edit]-
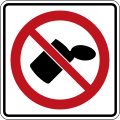 No littering – road sign in Canada
 -
 No littering – road sign in Central America
 -
 Litter container – road sign Mexico
 -
 Garbage can – road sign in Central America
 -
 Litter bin – road sign in Cambodia


Anti-litter campaigns
[edit]
Many groups exist with the aim of raising awareness and run campaigns including clean up events.
In the United States there are a number of organizations running anti-litter campaigns. Keep America Beautiful was founded in 1953, and promulgated the word litterbug, coined by its partner the Ad Council in 1947.[51] At least 38 states have high profile, government-recognized slogan campaigns, including Don't Mess with Texas; Let's Pick It Up New York; Don't Trash California; Take Pride in Florida; Keep Iowa Beautiful.
In Australia, Clean Up Australia Day is supported by many major Australian companies, firms and volunteers alike. Anti-litter organizations include "Keep Australia Beautiful", founded in 1963. It created the popular "Do the Right Thing" campaign and its Tidy Towns competition became well known being a very competitive expression of civic pride.
Keep Britain Tidy is a British campaign run by the Keep Britain Tidy environmental charity, which is part funded by the UK government.
History
[edit].jpg)
Throughout human history, people have disposed of unwanted materials onto streets, roadsides, in small local dumps or often in remote locations. Prior to reforms within cities in the mid-to-late 19th century, sanitation was not a government priority. The growing piles of waste led to the spread of disease.
Anti-littering legislation seems to have existed in ancient Greece, as is evidenced by a road marker discovered on the island of Paros, bearing the inscription "whoever drops their litter on the street owes 51 drachmae to whoever wishes to claim them".[52]
To address the growing amount of waste generated in the United States, the Solid Waste Disposal Act of 1965 was enacted. In 1976 the Federal government amended the Solid Waste Disposal Act, creating the Resource Conservation and Recovery Act (RCRA), which requires a "cradle to grave"[53] approach to the proper handling of potentially hazardous materials. RCRA gives authority to the Environmental Protection Agency (EPA) to regulate and enforce proper hazardous waste disposal.[54]
Many countries now have laws that require that household hazardous waste be deposited in a special location rather than sent to landfills with regular refuse. Household hazardous waste includes paints and solvents, chemicals, light bulbs, fluorescent lights, spray cans, disposable batteries, and yard products such as fertilizers, pesticides, herbicides and insecticides. Additionally, medical waste generated at home is considered a hazardous waste and must be disposed of properly.
See also
[edit]References
[edit]- ^ Novotny, T.E. & Zhao, F. (1999). Consumption and production waste: another externality of tobacco use. Tobacco Control, 8, 75-80.
- ^ "Littering Information". Archived from the original on October 6, 2012. Retrieved 2013-02-03.
- ^ "Umweltthemen Zigaretten". Archived from the original on 2016-05-12. Retrieved 2020-01-23.
- ^ Greve, Frank (January 24, 2008). "Fewer people trashing U.S. roads, beaches, experts say". Mcclatchydc.com. Archived from the original on 2009-08-05. Retrieved 2012-02-21.
- ^ a b "Erplanning.com" (PDF). Archived (PDF) from the original on 2020-09-24. Retrieved 2012-02-21.
- ^ "New Jersey Litter Report" (PDF). Archived from the original (PDF) on 2017-02-16. Retrieved 2012-02-21.
- ^ "Debris Wreaks Havoc on the Road - ABC News". Abcnews.go.com. 2007-05-15. Archived from the original on 2011-06-28. Retrieved 2012-02-21.
- ^ Leigh, Patricia (2007-05-11). "Highway Debris, Long an Eyesore, Grows as Hazard - NYTimes.com". New York Times. California. Archived from the original on 2012-11-11. Retrieved 2012-02-21.
- ^ a b "Northeast 2010 Litter Survey, Retrieved 2012.05.16" (PDF). njclean.org. Archived from the original (PDF) on 16 February 2017. Retrieved 27 March 2018.
- ^ "Illegal Dumping Prevention Guidebook" (PDF). 29 January 2013. Archived from the original (PDF) on 2013-04-27. Retrieved 2013-02-03.
- ^ "Volunteers Pick Up Litter in Sabana Park". Archived from the original on 2013-11-13. Retrieved 2013-02-03.
- ^ "BASMAA Five-Year Regional Strategic Outreach Plan: Litter" (PDF). Bay Area Stormwater Management Agencies Association. March 9, 2011. Archived (PDF) from the original on March 9, 2023. Retrieved December 16, 2022.
- ^ "Clean up your act and bin the litter, say stars". Belfast Telegraph. July 5, 2008. Archived from the original on December 16, 2022. Retrieved December 16, 2022.
- ^ "Measuring the Effectiveness of a Stormwater Public Education Campaign: Survey of Practice" (PDF). California Department of Transportation. December 4, 2019. Archived (PDF) from the original on March 20, 2023. Retrieved December 16, 2022.
- ^ "The York Daily Record". The York Daily Record. Archived from the original on 11 November 2013. Retrieved 27 March 2018.
- ^ "'PA CleanWays - Keep Pennsylvania Beautiful: Illegal Dump Survey Final Report York County 2010" (PDF). keeppabeautiful.org. Archived from the original (PDF) on 27 April 2013. Retrieved 27 March 2018.
- ^ Dur, Robert; Vollaard, Ben. "The Power of a Bad Example – A Field Experiment in Household Garbage Disposal" (PDF). Archived from the original (PDF) on July 29, 2012. Retrieved Jul 2, 2012.
- ^ Sibley, C.G., & Liu, J.H. (2003). Differentiating active and passive littering: A two-stage process model of littering behavior in public spaces. Environment and Behavior, 35, 415–433.
- ^ "Archived copy" (PDF). Archived from the original (PDF) on 2012-04-28. Retrieved 2011-09-23.
{{cite web}}: CS1 maint: archived copy as title (link) - ^ Brody, Jeremy (10 January 1998). "Teaching Leave No Trace. (Editorial)". blm.gov. Archived from the original on 14 August 2007. Retrieved 14 October 2009.
- ^ Christina Macfarlane, for CNN. "Golf balls: 'Humanity's signature litter'". CNN.com. Archived from the original on 2011-10-26. Retrieved 2012-02-21.
- ^ Faris, J. and Hart, K., Seas of Debris: A Summary of the Third International Conference on Marine Debris, N.C. Sea Grant College Program and NOAA, 1994, title page.
- ^ "Waste Tires - Waste 2 Resources Program - Washington State Department of Ecology". Archived from the original on July 8, 2008. Retrieved May 5, 2012.
- ^ "Basic information/scrap tires retrieved 05/15/2012". epa.gov. Archived from the original on 24 September 2015. Retrieved 27 March 2018.
- ^ a b c "Health and Environmental Concerns /Tires retrieved 05/15/2012". epa.gov. Archived from the original on 24 September 2015. Retrieved 27 March 2018.
- ^ "Debris Wreaks Havoc on the Road". ABCnews.go.com. 2007-05-15. Archived from the original on 2011-06-28. Retrieved 2012-02-21.
- ^ Litter watchers see a tidier United States Archived August 5, 2009, at the Wayback Machine
- ^ "Reducing Cigarette Marine Debris: What Does and Doesn't Work". Pacific Whale Foundation. Retrieved 20 March 2025.
- ^ "The danger of plastic six-pack rings". Protect The Wild. Retrieved 20 March 2025.
- ^ Litter management - Townsville City Council Archived March 28, 2011, at the Wayback Machine
- ^ "Study reveals McDonalds to be pick of the litter". thesatellite.com.au. Archived from the original on March 3, 2013. Retrieved March 1, 2013.
- ^ "McGregorTan Research, Keep Australia Beautiful National Branded Litter Study Annual Results 2011/12, Retrieved 16 January 2016" (PDF). kab.org.au. Archived from the original (PDF) on 9 April 2018. Retrieved 27 March 2018.
- ^ "Coke, Cadbury and Walkers 'most dumped' brands". Scotsman. Archived from the original on 5 July 2019. Retrieved 5 July 2019.
- ^ "About the Great American Cleanup". www.kab.org. 2016-01-25. Archived from the original on 2019-07-18. Retrieved 17 July 2019.
- ^ "Earth Day 2019 CleanUp". 26 April 2019. Archived from the original on 2019-08-28. Retrieved 2019-07-18.
- ^ "Song chắn rác" [Trash barrier]. vietaco.vn. Retrieved 2025-05-14.
- ^ "Earth Day Network Launches Great Global Clean Up". 4 April 2019. Archived from the original on 2019-12-23. Retrieved 2019-07-18.
- ^ "theffrc.com". www.theffrc.com. Archived from the original on 23 March 2018. Retrieved 27 March 2018.
- ^ "UniquEco: The Flip Flop Project | Artisans". Swahili-imports.com. Archived from the original on 2012-09-29. Retrieved 2012-11-06.
- ^ "Litter watchers see a tidier United States Litter watchers see a tidier United States" (PDF). Archived from the original (PDF) on 2016-01-08. Retrieved 2015-12-09.
- ^ Tasaki, T; Kawahata, T; Osako, M; Matsui, Y; Takagishi, S; Morita, A; Akishima, S (2007). "A GIS-based zoning of illegal dumping potential for efficient surveillance". Waste Management. 27 (2): 256–67. Bibcode:2007WaMan..27..256T. doi:10.1016/j.wasman.2006.01.018. PMID 16531036.
- ^ Kosako, A; Miyazaki, S; Inoue, U; Tasaki, T; Osako, M; Tamura, M (2009). "Detection of Illegal Dumping Sites by Using Vegetation Index and Land Surface Feature from High Resolution Satellite Images". Journal of the Remote Sensing Society of Japan. 29 (3): 497–514. doi:10.11440/rssj.29.497.
- ^ "New York's 'Bottle Bill' Brings in $120M". Archived from the original on November 11, 2013. Retrieved May 16, 2012.
- ^ "Wallonië wil statiegeld op blik invoeren". De Standaard. 19 August 2014. Archived from the original on 2014-08-26. Retrieved 2014-08-25.
- ^ Het Nieuwsblad, 23 august 2014; "13.90 euro voor wat gedeulte blikjes, geen slecht uurloon"
- ^ "How To Make Money Selling Scrap Metal". Archived from the original on 2014-04-04. Retrieved 2014-08-25.
- ^ "Littering". Archived from the original on 2015-09-22. Retrieved 2015-09-03.
- ^ "If you've been reported - EPA Victoria". Epa.vic.gov.au. Archived from the original on 2012-03-17. Retrieved 2012-02-21.
- ^ Legislatures, National Conference of State. "States with Littering Penalties". Archived from the original on 2013-05-17. Retrieved 2012-07-22.
- ^ "Public Information Films : 1964 to 1979 : Film index : Keep Britain Tidy". Nationalarchives.gov.uk. Archived from the original on 2012-01-16. Retrieved 2012-02-21.
- ^ "Ad Council : Pollution: Keep America Beautiful - Iron Eyes Cody (1961-1983)". Archived from the original on 2008-10-30. Retrieved 2009-04-23.
- ^ "73. Στήλη λευκού Παριακού μαρμάρου ελλιπής κάτω" [73. Column of white Parian marble, incomplete at the bottom.]. Archived from the original on 2017-12-16. Retrieved 2017-12-16.
- ^ "RCRA Orientation Manual: Managing Nonhazardous Solid Waste Retrieved 2012-05-15" (PDF). epa.gov. Archived from the original (PDF) on 2015-06-17. Retrieved 27 March 2018.
- ^ "Resource Conservation and Recovery Act". Archived from the original on 2013-01-29. Retrieved 2013-02-03.
External links
[edit] Media related to Litter at Wikimedia Commons
