
Community hub
Recent from talks
Contribute something
Nothing was collected or created yet.
Electroencephalography
View on Wikipedia
| Electroencephalography | |
|---|---|
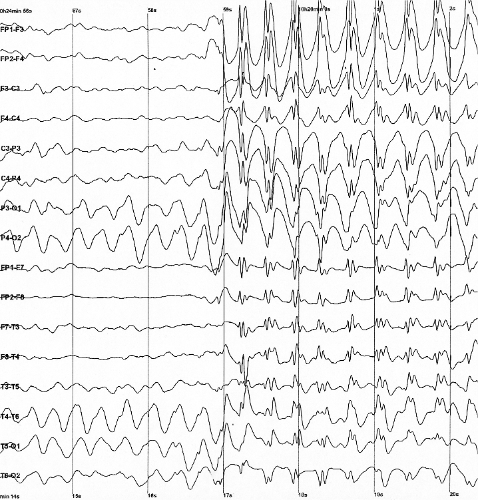
 Epileptic spike and wave discharges monitored EEG |
Electroencephalography (EEG)[1] is a method to record an electrogram of the spontaneous electrical activity of the brain. The bio signals detected by EEG have been shown to represent the postsynaptic potentials of pyramidal neurons in the neocortex and allocortex.[2] It is typically non-invasive, with the EEG electrodes placed along the scalp (commonly called "scalp EEG") using the International 10–20 system, or variations of it. Electrocorticography, involving surgical placement of electrodes, is sometimes called "intracranial EEG". Clinical interpretation of EEG recordings is most often performed by visual inspection of the tracing or quantitative EEG analysis.
Voltage fluctuations measured by the EEG bio amplifier and electrodes allow the evaluation of normal brain activity. As the electrical activity monitored by EEG originates in neurons in the underlying brain tissue, the recordings made by the electrodes on the surface of the scalp vary in accordance with their orientation and distance to the source of the activity. Furthermore, the value recorded is distorted by intermediary tissues and bones, which act in a manner akin to resistors and capacitors in an electrical circuit. This means that not all neurons will contribute equally to an EEG signal, with an EEG predominately reflecting the activity of cortical neurons near the electrodes on the scalp. Deep structures within the brain further away from the electrodes will not contribute directly to an EEG; these include the base of the cortical gyrus, medial walls of the major lobes, hippocampus, thalamus, and brain stem.[3]
A healthy human EEG will show certain patterns of activity that correlate with how awake a person is. The range of frequencies one observes are between 1 and 30 Hz, and amplitudes will vary between 20 and 100 μV. The observed frequencies are subdivided into various groups: alpha (8–13 Hz), beta (13–30 Hz), delta (0.5–4 Hz), and theta (4–7 Hz). Alpha waves are observed when a person is in a state of relaxed wakefulness and are mostly prominent over the parietal and occipital sites. During intense mental activity, beta waves are more prominent in frontal areas as well as other regions. If a relaxed person is told to open their eyes, one observes alpha activity decreasing and an increase in beta activity. Theta and delta waves are not generally seen in wakefulness – if they are, it is a sign of brain dysfunction.[3]
EEG can detect abnormal electrical discharges such as sharp waves, spikes, or spike-and-wave complexes, as observable in people with epilepsy; thus, it is often used to inform medical diagnosis. EEG can detect the onset and spatio-temporal (location and time) evolution of seizures and the presence of status epilepticus. It is also used to help diagnose sleep disorders, depth of anesthesia, coma, encephalopathies, cerebral hypoxia after cardiac arrest, and brain death. EEG used to be a first-line method of diagnosis for tumors, stroke, and other focal brain disorders,[4][5] but this use has decreased with the advent of high-resolution anatomical imaging techniques such as magnetic resonance imaging (MRI) and computed tomography (CT). Despite its limited spatial resolution, EEG continues to be a valuable tool for research and diagnosis. It is one of the few mobile techniques available and offers millisecond-range temporal resolution, which is not possible with CT, PET, or MRI.[6][7]
Derivatives of the EEG technique include evoked potentials (EP), which involves averaging the EEG activity time-locked to the presentation of a stimulus of some sort (visual, somatosensory, or auditory). Event-related potentials (ERPs) refer to averaged EEG responses that are time-locked to more complex processing of stimuli; this technique is used in cognitive science, cognitive psychology, and psychophysiological research.
Uses
[edit]Epilepsy
[edit]
EEG is the gold standard diagnostic procedure to confirm epilepsy. The sensitivity of a routine EEG to detect interictal epileptiform discharges at epilepsy centers has been reported to be in the range of 29–55%.[8] Given the low to moderate sensitivity, a routine EEG (typically with a duration of 20–30 minutes) can be normal in people that have epilepsy. When an EEG shows interictal epileptiform discharges (e.g. sharp waves, spikes, spike-and-wave, etc.) it is confirmatory of epilepsy in nearly all cases (high specificity), however up to 3.5% of the general population may have epileptiform abnormalities in an EEG without ever having had a seizure (low false positive rate)[8] or with a very low risk of developing epilepsy in the future.[9]
When a routine EEG is normal and there is a high suspicion or need to confirm epilepsy, it may be repeated or performed with a longer duration in the epilepsy monitoring unit (EMU) or at home with an ambulatory EEG. In addition, there are activating maneuvers such as photic stimulation, hyperventilation and sleep deprivation that can increase the diagnostic yield of the EEG.[8]
Epilepsy Monitoring Unit (EMU)
[edit]At times, a routine EEG is not sufficient to establish the diagnosis or determine the best course of action in terms of treatment. In this case, attempts may be made to record an EEG while a seizure is occurring. This is known as an ictal recording, as opposed to an interictal recording, which refers to the EEG recording between seizures. To obtain an ictal recording, a prolonged EEG is typically performed accompanied by a time-synchronized video and audio recording. This can be done either as an outpatient (at home) or during a hospital admission, preferably to an Epilepsy Monitoring Unit (EMU) with nurses and other personnel trained in the care of patients with seizures. Outpatient ambulatory video EEGs typically last one to three days. An admission to an Epilepsy Monitoring Unit typically lasts several days but may last for a week or longer. While in the hospital, seizure medications are usually withdrawn to increase the odds that a seizure will occur during admission. For reasons of safety, medications are not withdrawn during an EEG outside of the hospital. Ambulatory video EEGs, therefore, have the advantage of convenience and are less expensive than a hospital admission, but they also have the disadvantage of a decreased probability of recording a clinical event.[10]
Epilepsy monitoring is often considered when patients continue having events despite being on anti-seizure medications or if there is concern that the patient's events have an alternate diagnosis, e.g., psychogenic non-epileptic seizures, syncope (fainting), sub-cortical movement disorders, migraine variants, stroke, etc. In cases of epileptic seizures, continuous EEG monitoring helps to characterize seizures and localize/lateralize the region of the brain from which a seizure originates. This can help identify appropriate non-medication treatment options.[11] In clinical use, EEG traces are visually analyzed by neurologists to look at various features. Increasingly, quantitative analysis of EEG is being used in conjunction with visual analysis. Quantitative analysis displays like power spectrum analysis, alpha-delta ratio, amplitude integrated EEG, and spike detection can help quickly identify segments of EEG that need close visual analysis or, in some cases, be used as surrogates for quick identification of seizures in long-term recordings.
Other brain disorders
[edit]An EEG might also be helpful for diagnosing or treating the following disorders:[12]
- Brain tumor
- Brain damage from head injury
- Brain dysfunction that can have a variety of causes (encephalopathy)
- Inflammation of the brain (encephalitis)
- Stroke
- Sleep disorders
It can also:
- distinguish epileptic seizures from other types of spells, such as psychogenic non-epileptic seizures, syncope (fainting), sub-cortical movement disorders and migraine variants
- differentiate "organic" encephalopathy or delirium from primary psychiatric syndromes such as catatonia
- serve as an adjunct test of brain death in comatose patients
- prognosticate in comatose patients (in certain instances) or in newborns with brain injury from various causes around the time of birth
- determine whether to wean anti-epileptic medications.
Intensive Care Unit (ICU)
[edit]EEG can also be used in intensive care units for brain function monitoring to monitor for non-convulsive seizures/non-convulsive status epilepticus, to monitor the effect of sedative/anesthesia in patients in medically induced coma (for treatment of refractory seizures or increased intracranial pressure), and to monitor for secondary brain damage in conditions such as subarachnoid hemorrhage (currently a research method).[13]
In cases where significant brain injury is suspected, e.g., after cardiac arrest, EEG can provide some prognostic information.[citation needed]
If a patient with epilepsy is being considered for resective surgery to treat epilepsy, it is often necessary to localize the focus (source) of the epileptic brain activity with a resolution greater than what is provided by scalp EEG. In these cases, neurosurgeons typically implant strips and grids of electrodes or penetrating depth electrodes under the dura mater, through either a craniotomy or a burr hole. The recording of these signals is referred to as electrocorticography (ECoG), subdural EEG (SDE), intracranial EEG (iEEG), or stereotactic EEG (SEEG). The signal recorded from ECoG is on a different scale of activity than the brain activity recorded from scalp EEG. Low-voltage, high-frequency components that cannot be seen easily (or at all) in scalp EEG can be seen clearly in ECoG. Further, smaller electrodes (which cover a smaller parcel of brain surface) allow for better spatial resolution to narrow down the areas critical for seizure onset and propagation. Some clinical sites record data from penetrating microelectrodes.[14]
Home ambulatory EEG
[edit]Sometimes it is more convenient or clinically necessary to perform ambulatory EEG recordings in the home of the person being tested.[15][16] These studies typically have a duration of 24–72 hours.[citation needed]
Research use
[edit]EEG and the related study of ERPs are used extensively in neuroscience, cognitive science, cognitive psychology, neurolinguistics, and psychophysiological research, as well as to study human functions such as swallowing.[17][18][19] Any EEG techniques used in research are not sufficiently standardised for clinical use, and many ERP studies fail to report all of the necessary processing steps for data collection and reduction,[20] limiting the reproducibility and replicability of many studies. Based on a 2024 systematic literature review and meta analysis commissioned by the Patient-Centered Outcomes Research Institute (PCORI), EEG scans cannot be used reliably to assist in making a clinical diagnosis of ADHD.[21] However, EEG continues to be used in research on mental disabilities, such as auditory processing disorder (APD), ADD, and ADHD.[21] EEGs have also been studied for their utility in detecting neurophysiological changes in the brain after concussion,[22] however, at this time there are no advanced imaging techniques that can be used clinically to diagnose or monitor recovery from concussion.[23][24]
Advantages
[edit]Several other methods to study brain function exist, including functional magnetic resonance imaging (fMRI), positron emission tomography (PET), magnetoencephalography (MEG), nuclear magnetic resonance spectroscopy (NMR or MRS), electrocorticography (ECoG), single-photon emission computed tomography (SPECT), near-infrared spectroscopy (NIRS), and event-related optical signal (EROS). Despite the relatively poor spatial sensitivity of EEG, the "one-dimensional signals from localised peripheral regions on the head make it attractive for its simplistic fidelity and has allowed high clinical and basic research throughput".[25] Thus, EEG possesses some advantages over some of those other techniques:
- Hardware costs are significantly lower than those of most other techniques[26]
- EEG prevents limited availability of technologists to provide immediate care in high traffic hospitals.[27]
- EEG only requires a quiet room and briefcase-size equipment, whereas fMRI, SPECT, PET, MRS, or MEG require bulky and immobile equipment. For example, MEG requires equipment consisting of liquid helium-cooled detectors that can be used only in magnetically shielded rooms, altogether costing upwards of several million dollars;[28] and fMRI requires the use of a 1-ton magnet in, again, a shielded room.
- EEG can readily have a high temporal resolution, (although sub-millisecond resolution generates less meaningful data), because the two to 32 data streams generated by that number of electrodes is easily stored and processed, whereas 3D spatial technologies provide thousands or millions times as many input data streams, and are thus limited by hardware and software.[29] EEG is commonly recorded at sampling rates between 250 and 2000 Hz in clinical and research settings.
- EEG is relatively tolerant of subject movement, unlike most other neuroimaging techniques. There even exist methods for minimizing, and even eliminating movement artifacts in EEG data[30]
- EEG is silent, which allows for better study of the responses to auditory stimuli.
- EEG does not aggravate claustrophobia, unlike fMRI, PET, MRS, SPECT, and sometimes MEG[31]
- EEG does not involve exposure to high-intensity (>1 Tesla) magnetic fields, as in some of the other techniques, especially MRI and MRS. These can cause a variety of undesirable issues with the data, and also prohibit use of these techniques with participants that have metal implants in their body, such as metal-containing pacemakers[32]
- EEG does not involve exposure to radioligands, unlike positron emission tomography.[33]
- ERP studies can be conducted with relatively simple paradigms, compared with IE block-design fMRI studies
- Relatively non-invasive, in contrast to electrocorticography, which requires electrodes to be placed on the actual surface of the brain.
EEG also has some characteristics that compare favorably with behavioral testing:
- EEG can detect covert processing (i.e., processing that does not require a response)[34]
- EEG can be used in subjects who are incapable of making a motor response[35]
- Some ERP components can be detected even when the subject is not attending to the stimuli
- Unlike other means of studying reaction time, ERPs can elucidate stages of processing (rather than just the result)[36]
- the simplicity of EEG readily provides for tracking of brain changes during different phases of life. EEG sleep analysis can indicate significant aspects of the timing of brain development, including evaluating adolescent brain maturation.[37]
- In EEG there is a better understanding of what signal is measured as compared to other research techniques, e.g. the BOLD response in MRI.
Disadvantages
[edit]- Low spatial resolution on the scalp. fMRI, for example, can directly display areas of the brain that are active, while EEG requires intense interpretation just to hypothesize what areas are activated by a particular response.[38]
- Depending on the orientation and location of the dipole causing an EEG change, there may be a false localization due to the inverse problem.[39]
- EEG poorly measures neural activity that occurs below the upper layers of the brain (the cortex).
- Unlike PET and MRS, EEG cannot identify specific locations in the brain at which various neurotransmitters, drugs, etc. can be found.[33]
- Often takes a long time to connect a subject to EEG, as it requires precise placement of dozens of electrodes around the head and the use of various gels, saline solutions, and pastes to maintain good conductivity, and a cap is used to keep them in place. While the length of time differs dependent on the specific EEG device used, as a general rule it takes considerably less time to prepare a subject for MEG, fMRI, MRS, and SPECT.
- Signal-to-noise ratio is poor, so sophisticated data analysis and relatively large numbers of subjects are needed to extract useful information from EEG.[40]
- EEGs are not currently very compatible with individuals who have coarser or textured hair. Even protective styles can pose issues during testing. Researchers are currently trying to build better options for patients and technicians alike[41] Furthermore, researchers are starting to implement more culturally-informed data collection practices to help reduce racial biases in EEG research.[42]
With other neuroimaging techniques
[edit]Simultaneous EEG recordings and fMRI scans have been obtained successfully,[43][44][45][46] though recording both at the same time effectively requires that several technical difficulties be overcome, such as the presence of ballistocardiographic artifact, MRI pulse artifact and the induction of electrical currents in EEG wires that move within the strong magnetic fields of the MRI. While challenging, these have been successfully overcome in a number of studies.[47][48]
MRI's produce detailed images created by generating strong magnetic fields that may induce potentially harmful displacement force and torque. These fields produce potentially harmful radio frequency heating and create image artifacts rendering images useless. Due to these potential risks, only certain medical devices can be used in an MR environment.
Similarly, simultaneous recordings with MEG and EEG have also been conducted, which has several advantages over using either technique alone:
- EEG requires accurate information about certain aspects of the skull that can only be estimated, such as skull radius, and conductivities of various skull locations. MEG does not have this issue, and a simultaneous analysis allows this to be corrected for.
- MEG and EEG both detect activity below the surface of the cortex very poorly, and like EEG, the level of error increases with the depth below the surface of the cortex one attempts to examine. However, the errors are very different between the techniques, and combining them thus allows for correction of some of this noise.
- MEG has access to virtually no sources of brain activity below a few centimetres under the cortex. EEG, on the other hand, can receive signals from greater depth, albeit with a high degree of noise. Combining the two makes it easier to determine what in the EEG signal comes from the surface (since MEG is very accurate in examining signals from the surface of the brain), and what comes from deeper in the brain, thus allowing for analysis of deeper brain signals than either EEG or MEG on its own.[49]
Recently, a combined EEG/MEG (EMEG) approach has been investigated for the purpose of source reconstruction in epilepsy diagnosis.[50]
EEG has also been combined with positron emission tomography. This provides the advantage of allowing researchers to see what EEG signals are associated with different drug actions in the brain.[51]
Recent studies using machine learning techniques such as neural networks with statistical temporal features extracted from frontal lobe EEG brainwave data has shown high levels of success in classifying mental states (Relaxed, Neutral, Concentrating),[52] mental emotional states (Negative, Neutral, Positive)[53] and thalamocortical dysrhythmia.[54]
Mechanisms
[edit]The brain's electrical charge is maintained by billions of neurons.[55] Neurons are electrically charged (or "polarized") by membrane transport proteins that pump ions across their membranes. Neurons are constantly exchanging ions with the extracellular milieu, for example to maintain resting potential and to propagate action potentials. Ions of similar charge repel each other, and when many ions are pushed out of many neurons at the same time, they can push their neighbours, who push their neighbours, and so on, in a wave. This process is known as volume conduction. When the wave of ions reaches the electrodes on the scalp, they can push or pull electrons on the metal in the electrodes. Since metal conducts the push and pull of electrons easily, the difference in push or pull voltages between any two electrodes can be measured by a voltmeter. Recording these voltages over time gives us the EEG.[56]
The electric potential generated by an individual neuron is far too small to be picked up by EEG or MEG.[57] EEG activity therefore always reflects the summation of the synchronous activity of thousands or millions of neurons that have similar spatial orientation. If the cells do not have similar spatial orientation, their ions do not line up and create waves to be detected. Pyramidal neurons of the cortex are thought to produce the most EEG signal because they are well-aligned and fire together. Because voltage field gradients fall off with the square of distance, activity from deep sources is more difficult to detect than currents near the skull.[58]
Scalp EEG activity shows oscillations at a variety of frequencies. Several of these oscillations have characteristic frequency ranges, spatial distributions and are associated with different states of brain functioning (e.g., waking and the various sleep stages). These oscillations represent synchronized activity over a network of neurons. The neuronal networks underlying some of these oscillations are understood (e.g., the thalamocortical resonance underlying sleep spindles), while many others are not (e.g., the system that generates the posterior basic rhythm). Research that measures both EEG and neuron spiking finds the relationship between the two is complex, with a combination of EEG power in the gamma band and phase in the delta band relating most strongly to neuron spike activity.[59]
Method
[edit].jpg)
In conventional scalp EEG, the recording is obtained by placing electrodes on the scalp with a conductive gel or paste, usually after preparing the scalp area by light abrasion to reduce impedance due to dead skin cells. Many systems typically use electrodes, each of which is attached to an individual wire. Some systems use caps or nets into which electrodes are embedded; this is particularly common when high-density arrays of electrodes are needed.[citation needed]
Electrode locations and names are specified by the International 10–20 system[60] for most clinical and research applications (except when high-density arrays are used). This system ensures that the naming of electrodes is consistent across laboratories. In most clinical applications, 19 recording electrodes (plus ground and system reference) are used.[61] A smaller number of electrodes are typically used when recording EEG from neonates. Additional electrodes can be added to the standard set-up when a clinical or research application demands increased spatial resolution for a particular area of the brain. High-density arrays (typically via cap or net) can contain up to 256 electrodes more-or-less evenly spaced around the scalp.
Each electrode is connected to one input of a differential amplifier (one amplifier per pair of electrodes); a common system reference electrode is connected to the other input of each differential amplifier. These amplifiers amplify the voltage between the active electrode and the reference (typically 1,000–100,000 times, or 60–100 dB of power gain). In analog EEG, the signal is then filtered (next paragraph), and the EEG signal is output as the deflection of pens as paper passes underneath. Most EEG systems these days, however, are digital, and the amplified signal is digitized via an analog-to-digital converter, after being passed through an anti-aliasing filter. Analog-to-digital sampling typically occurs at 256–512 Hz in clinical scalp EEG; sampling rates of up to 20 kHz are used in some research applications.
During the recording, a series of activation procedures may be used. These procedures may induce normal or abnormal EEG activity that might not otherwise be seen. These procedures include hyperventilation, photic stimulation (with a strobe light), eye closure, mental activity, sleep and sleep deprivation. During (inpatient) epilepsy monitoring, a patient's typical seizure medications may be withdrawn.
The digital EEG signal is stored electronically and can be filtered for display. Typical settings for the high-pass filter and a low-pass filter are 0.5–1 Hz and 35–70 Hz respectively. The high-pass filter typically filters out slow artifact, such as electrogalvanic signals and movement artifact, whereas the low-pass filter filters out high-frequency artifacts, such as electromyographic signals. An additional notch filter is typically used to remove artifact caused by electrical power lines (60 Hz in the United States and 50 Hz in many other countries).[14]
The EEG signals can be captured with opensource hardware such as OpenBCI and the signal can be processed by freely available EEG software such as EEGLAB or the Neurophysiological Biomarker Toolbox.
As part of an evaluation for epilepsy surgery, it may be necessary to insert electrodes near the surface of the brain, under the surface of the dura mater. This is accomplished via burr hole or craniotomy. This is referred to variously as "electrocorticography (ECoG)", "intracranial EEG (I-EEG)" or "subdural EEG (SD-EEG)". Depth electrodes may also be placed into brain structures, such as the amygdala or hippocampus, structures, which are common epileptic foci and may not be "seen" clearly by scalp EEG. The electrocorticographic signal is processed in the same manner as digital scalp EEG (above), with a couple of caveats. ECoG is typically recorded at higher sampling rates than scalp EEG because of the requirements of Nyquist theorem – the subdural signal is composed of a higher predominance of higher frequency components. Also, many of the artifacts that affect scalp EEG do not impact ECoG, and therefore display filtering is often not needed.
A typical adult human EEG signal is about 10 μV to 100 μV in amplitude when measured from the scalp.[62]
Since an EEG voltage signal represents a difference between the voltages at two electrodes, the display of the EEG for the reading electroencephalographer may be set up in one of several ways. The representation of the EEG channels is referred to as a montage.
- Sequential montage
- Each channel (i.e., waveform) represents the difference between two adjacent electrodes. The entire montage consists of a series of these channels. For example, the channel "Fp1-F3" represents the difference in voltage between the Fp1 electrode and the F3 electrode. The next channel in the montage, "F3-C3", represents the voltage difference between F3 and C3, and so on through the entire array of electrodes.
- Referential montage
- Each channel represents the difference between a certain electrode and a designated reference electrode. There is no standard position for this reference; it is, however, at a different position than the "recording" electrodes. Midline positions are often used because they do not amplify the signal in one hemisphere vs. the other, such as Cz, Oz, Pz etc. as online reference. The other popular offline references are:
- REST reference: which is an offline computational reference at infinity where the potential is zero. REST (reference electrode standardization technique) takes the equivalent sources inside the brain of any a set of scalp recordings as springboard to link the actual recordings with any an online or offline( average, linked ears etc.) non-zero reference to the new recordings with infinity zero as the standardized reference.[63]
- "linked ears": which is a physical or mathematical average of electrodes attached to both earlobes or mastoids.
- Average reference montage
- The outputs of all of the amplifiers are summed and averaged, and this averaged signal is used as the common reference for each channel.
- Laplacian montage
- Each channel represents the difference between an electrode and a weighted average of the surrounding electrodes.[64]
When analog (paper) EEGs are used, the technologist switches between montages during the recording in order to highlight or better characterize certain features of the EEG. With digital EEG, all signals are typically digitized and stored in a particular (usually referential) montage; since any montage can be constructed mathematically from any other, the EEG can be viewed by the electroencephalographer in any display montage that is desired.
The EEG is read by a clinical neurophysiologist or neurologist (depending on local custom and law regarding medical specialities), optimally one who has specific training in the interpretation of EEGs for clinical purposes. This is done by visual inspection of the waveforms, called graphoelements. The use of computer signal processing of the EEG – so-called quantitative electroencephalography – is somewhat controversial when used for clinical purposes (although there are many research uses).
Dry EEG electrodes
[edit]In the early 1990s Babak Taheri, at University of California, Davis demonstrated the first single and also multichannel dry active electrode arrays using micro-machining. The single channel dry EEG electrode construction and results were published in 1994.[65] The arrayed electrode was also demonstrated to perform well compared to silver/silver chloride electrodes. The device consisted of four sites of sensors with integrated electronics to reduce noise by impedance matching. The advantages of such electrodes are: (1) no electrolyte used, (2) no skin preparation, (3) significantly reduced sensor size, and (4) compatibility with EEG monitoring systems. The active electrode array is an integrated system made of an array of capacitive sensors with local integrated circuitry housed in a package with batteries to power the circuitry. This level of integration was required to achieve the functional performance obtained by the electrode. The electrode was tested on an electrical test bench and on human subjects in four modalities of EEG activity, namely: (1) spontaneous EEG, (2) sensory event-related potentials, (3) brain stem potentials, and (4) cognitive event-related potentials. The performance of the dry electrode compared favorably with that of the standard wet electrodes in terms of skin preparation, no gel requirements (dry), and higher signal-to-noise ratio.[66]
In 1999 researchers at Case Western Reserve University, in Cleveland, Ohio, led by Hunter Peckham, used 64-electrode EEG skullcap to return limited hand movements to quadriplegic Jim Jatich. As Jatich concentrated on simple but opposite concepts like up and down, his beta-rhythm EEG output was analysed using software to identify patterns in the noise. A basic pattern was identified and used to control a switch: Above average activity was set to on, below average off. As well as enabling Jatich to control a computer cursor the signals were also used to drive the nerve controllers embedded in his hands, restoring some movement.[67]
In 2018, a functional dry electrode composed of a polydimethylsiloxane elastomer filled with conductive carbon nanofibers was reported. This research was conducted at the U.S. Army Research Laboratory.[68] EEG technology often involves applying a gel to the scalp which facilitates strong signal-to-noise ratio. This results in more reproducible and reliable experimental results. Since patients dislike having their hair filled with gel, and the lengthy setup requires trained staff on hand, utilizing EEG outside the laboratory setting can be difficult.[69] Additionally, it has been observed that wet electrode sensors' performance reduces after a span of hours.[68] Therefore, research has been directed to developing dry and semi-dry EEG bioelectronic interfaces.[citation needed]
Dry electrode signals depend upon mechanical contact. Therefore, it can be difficult getting a usable signal because of impedance between the skin and the electrode.[69][68] Some EEG systems attempt to circumvent this issue by applying a saline solution.[70] Others have a semi dry nature and release small amounts of the gel upon contact with the scalp.[69] Another solution uses spring loaded pin setups. These may be uncomfortable. They may also be dangerous if they were used in a situation where a patient could bump their head since they could become lodged after an impact trauma incident.[68]
Currently, headsets are available incorporating dry electrodes with up to 30 channels.[71] Such designs are able to compensate for some of the signal quality degradation related to high impedances by optimizing pre-amplification, shielding and supporting mechanics.[72]
Limitations
[edit]EEG has several limitations. Most important is its poor spatial resolution.[73] EEG is most sensitive to a particular set of post-synaptic potentials: those generated in superficial layers of the cortex, on the crests of gyri directly abutting the skull and radial to the skull. Dendrites which are deeper in the cortex, inside sulci, in midline or deep structures (such as the cingulate gyrus or hippocampus), or producing currents that are tangential to the skull, make far less contribution to the EEG signal.
EEG recordings do not directly capture axonal action potentials. An action potential can be accurately represented as a current quadrupole, meaning that the resulting field decreases more rapidly than the ones produced by the current dipole of post-synaptic potentials.[28] In addition, since EEGs represent averages of thousands of neurons, a large population of cells in synchronous activity is necessary to cause a significant deflection on the recordings. Action potentials are very fast and, as a consequence, the chances of field summation are slim. However, neural backpropagation, as a typically longer dendritic current dipole, can be picked up by EEG electrodes and is a reliable indication of the occurrence of neural output.
Not only do EEGs capture dendritic currents almost exclusively as opposed to axonal currents, they also show a preference for activity on populations of parallel dendrites and transmitting current in the same direction at the same time. Pyramidal neurons of cortical layers II/III and V extend apical dendrites to layer I. Currents moving up or down these processes underlie most of the signals produced by electroencephalography.[74]
EEG thus provides information with a large bias in favor of particular neuron types, locations and orientations. So it generally should not be used to make claims about global brain activity. The meninges, cerebrospinal fluid and skull "smear" the EEG signal, obscuring its intracranial source.
It is mathematically impossible to reconstruct a unique intracranial current source for a given EEG signal,[14] as some currents produce potentials that cancel each other out. This is referred to as the inverse problem. However, much work has been done to produce remarkably good estimates of, at least, a localized electric dipole that represents the recorded currents.[75]
EEG vis-à-vis fMRI, fNIRS, fUS and PET
[edit]EEG has several strong points as a tool for exploring brain activity. EEGs can detect changes over milliseconds, which is excellent considering an action potential takes approximately 0.5–130 milliseconds to propagate across a single neuron, depending on the type of neuron.[76] Other methods of looking at brain activity, such as PET, fMRI or fUS have time resolution between seconds and minutes. EEG measures the brain's electrical activity directly, while other methods record changes in blood flow (e.g., SPECT, fMRI, fUS) or metabolic activity (e.g., PET, NIRS), which are indirect markers of brain electrical activity.
EEG can be used simultaneously with fMRI or fUS so that high-temporal-resolution data can be recorded at the same time as high-spatial-resolution data, however, since the data derived from each occurs over a different time course, the data sets do not necessarily represent exactly the same brain activity. There are technical difficulties associated with combining EEG and fMRI including the need to remove the MRI gradient artifact present during MRI acquisition. Furthermore, currents can be induced in moving EEG electrode wires due to the magnetic field of the MRI.
EEG can be used simultaneously with NIRS or fUS without major technical difficulties. There is no influence of these modalities on each other and a combined measurement can give useful information about electrical activity as well as hemodynamics at medium spatial resolution.
EEG vis-à-vis MEG
[edit]EEG reflects correlated synaptic activity caused by post-synaptic potentials of cortical neurons. The ionic currents involved in the generation of fast action potentials may not contribute greatly to the averaged field potentials representing the EEG.[57][77] More specifically, the scalp electrical potentials that produce EEG are generally thought to be caused by the extracellular ionic currents caused by dendritic electrical activity, whereas the fields producing magnetoencephalographic signals[28] are associated with intracellular ionic currents.[78]
Normal activity
[edit]-
 Human EEG with prominent resting state activity – alpha-rhythm. Left: EEG traces (horizontal – time in seconds; vertical – amplitudes, scale 100 μV). Right: power spectra of shown signals (vertical lines – 10 and 20 Hz, scale is linear). Alpha-rhythm consists of sinusoidal-like waves with frequencies in 8–12 Hz range (11 Hz in this case) more prominent in posterior sites. Alpha range is red at power spectrum graph.
 -
 Human EEG with in resting state. Left: EEG traces (horizontal – time in seconds; vertical – amplitudes, scale 100 μV). Right: power spectra of shown signals (vertical lines – 10 and 20 Hz, scale is linear). 80–90% of people have prominent sinusoidal-like waves with frequencies in 8–12 Hz range – alpha rhythm. Others (like this) lack this type of activity.
 -
 Common artifacts in human EEG. 1: Electrooculographic artifact caused by the excitation of eyeball's muscles (related to blinking, for example). Big-amplitude, slow, positive wave prominent in frontal electrodes. 2: Electrode's artifact caused by bad contact (and thus bigger impedance) between P3 electrode and skin. 3: Swallowing artifact. 4: Common reference electrode's artifact caused by bad contact between reference electrode and skin. Huge wave similar in all channels.
 -
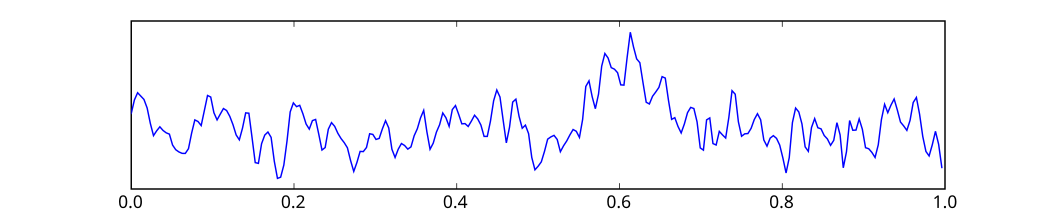 One second of EEG signal


The EEG is typically described in terms of (1) rhythmic activity and (2) transients. The rhythmic activity is divided into bands by frequency. To some degree, these frequency bands are a matter of nomenclature (i.e., any rhythmic activity between 8–12 Hz can be described as "alpha"), but these designations arose because rhythmic activity within a certain frequency range was noted to have a certain distribution over the scalp or a certain biological significance. Frequency bands are usually extracted using spectral methods (for instance Welch) as implemented for instance in freely available EEG software such as EEGLAB or the Neurophysiological Biomarker Toolbox. Computational processing of the EEG is often named quantitative electroencephalography (qEEG).
Most of the cerebral signal observed in the scalp EEG falls in the range of 1–20 Hz (activity below or above this range is likely to be artifactual, under standard clinical recording techniques). Waveforms are subdivided into bandwidths known as alpha, beta, theta, and delta to signify the majority of the EEG used in clinical practice.[79]
Comparison of EEG bands
[edit]| Band | Frequency (Hz) | Location | Normally | Pathologically |
|---|---|---|---|---|
| Delta | < 4 | frontally in adults, posteriorly in children; high-amplitude waves |
|
|
| Theta | 4–7 | Found in locations not related to task at hand |
|
|
| Alpha | 8–12 | posterior regions of head, both sides, higher in amplitude on dominant side. Central sites (c3-c4) at rest |
|
|
| Beta | 13–30 | both sides, symmetrical distribution, most evident frontally; low-amplitude waves |
|
|
| Gamma | > 32 | Somatosensory cortex |
| |
| Mu | 8–12 | Sensorimotor cortex |
|
|
The practice of using only whole numbers in the definitions comes from practical considerations in the days when only whole cycles could be counted on paper records. This leads to gaps in the definitions, as seen elsewhere on this page. The theoretical definitions have always been more carefully defined to include all frequencies. Unfortunately there is no agreement in standard reference works on what these ranges should be – values for the upper end of alpha and lower end of beta include 12, 13, 14 and 15. If the threshold is taken as 14 Hz, then the slowest beta wave has about the same duration as the longest spike (70 ms), which makes this the most useful value.

Wave patterns
[edit]
- Delta is the frequency range up to 4 Hz. It tends to be the highest in amplitude and the slowest waves. It is normally seen in adults during slow-wave sleep, and in babies. It may occur focally with subcortical lesions and in general distribution with diffuse lesions, metabolic encephalopathy hydrocephalus or deep midline lesions. It is usually most prominent frontally in adults (e.g. FIRDA – frontal intermittent rhythmic delta) and posteriorly in children (e.g. OIRDA – occipital intermittent rhythmic delta).

- Theta is the frequency range from 4 Hz to 7 Hz. Theta is seen normally in young children. It may be seen in drowsiness or arousal in older children and adults; it can also be seen in meditation.[86] Excess theta for age represents abnormal activity. It can be seen as a focal disturbance in focal subcortical lesions; it can be seen in generalized distribution in diffuse disorder or metabolic encephalopathy or deep midline disorders or some instances of hydrocephalus. On the contrary this range has been associated with reports of relaxed, meditative, and creative states.

- Alpha is the frequency range from 8 Hz to 12 Hz.[87] Hans Berger named the first rhythmic EEG activity he observed the "alpha wave". This was the "posterior basic rhythm" (also called the "posterior dominant rhythm" or the "posterior alpha rhythm"), seen in the posterior regions of the head on both sides, higher in amplitude on the dominant side. It emerges with closing of the eyes and with relaxation, and attenuates with eye opening or mental exertion. The posterior basic rhythm is actually slower than 8 Hz in young children (therefore technically in the theta range).

- In addition to the posterior basic rhythm, there are other normal alpha rhythms such as the mu rhythm (alpha activity in the contralateral sensory and motor cortical areas) that emerges when the hands and arms are idle; and the "third rhythm" (alpha activity in the temporal or frontal lobes).[88][89] Alpha can be abnormal; for example, an EEG that has diffuse alpha occurring in coma and is not responsive to external stimuli is referred to as "alpha coma".

- Beta is the frequency range from 13 Hz to about 30 Hz. It is seen usually on both sides in symmetrical distribution and is most evident frontally. Beta activity is closely linked to motor behavior and is generally attenuated during active movements.[90] Low-amplitude beta with multiple and varying frequencies is often associated with active, busy or anxious thinking and active concentration. Rhythmic beta with a dominant set of frequencies is associated with various pathologies, such as Dup15q syndrome, and drug effects, especially benzodiazepines. It may be absent or reduced in areas of cortical damage. It is the dominant rhythm in patients who are alert or anxious or who have their eyes open.

- Gamma is the frequency range approximately 30–100 Hz. Gamma rhythms are thought to represent binding of different populations of neurons together into a network for the purpose of carrying out a certain cognitive or motor function.[14]
- Mu range is 8–13 Hz and partly overlaps with other frequencies. It reflects the synchronous firing of motor neurons in rest state. Mu suppression is thought to reflect motor mirror neuron systems, because when an action is observed, the pattern extinguishes, possibly because the normal and mirror neuronal systems "go out of sync" and interfere with one other.[85]
"Ultra-slow" or "near-DC" activity is recorded using DC amplifiers in some research contexts. It is not typically recorded in a clinical context because the signal at these frequencies is susceptible to a number of artifacts.
Some features of the EEG are transient rather than rhythmic. Spikes and sharp waves may represent seizure activity or interictal activity in individuals with epilepsy or a predisposition toward epilepsy. Other transient features are normal: vertex waves and sleep spindles are seen in normal sleep.
There are types of activity that are statistically uncommon, but not associated with dysfunction or disease. These are often referred to as "normal variants". The mu rhythm is an example of a normal variant.
The normal electroencephalogram (EEG) varies by age. The prenatal EEG and neonatal EEG is quite different from the adult EEG. Fetuses in the third trimester and newborns display two common brain activity patterns: "discontinuous" and "trace alternant." "Discontinuous" electrical activity refers to sharp bursts of electrical activity followed by low frequency waves. "Trace alternant" electrical activity describes sharp bursts followed by short high amplitude intervals and usually indicates quiet sleep in newborns.[91] The EEG in childhood generally has slower frequency oscillations than the adult EEG.
The normal EEG also varies depending on state. The EEG is used along with other measurements (EOG, EMG) to define sleep stages in polysomnography. Stage I sleep (equivalent to drowsiness in some systems) appears on the EEG as drop-out of the posterior basic rhythm. There can be an increase in theta frequencies. Santamaria and Chiappa cataloged a number of the variety of patterns associated with drowsiness. Stage II sleep is characterized by sleep spindles – transient runs of rhythmic activity in the 12–14 Hz range (sometimes referred to as the "sigma" band) that have a frontal-central maximum. Most of the activity in Stage II is in the 3–6 Hz range. Stage III and IV sleep are defined by the presence of delta frequencies and are often referred to collectively as "slow-wave sleep". Stages I–IV comprise non-REM (or "NREM") sleep. The EEG in REM (rapid eye movement) sleep appears somewhat similar to the awake EEG.
EEG under general anesthesia depends on the type of anesthetic employed. With halogenated anesthetics, such as halothane or intravenous agents, such as propofol, a rapid (alpha or low beta), nonreactive EEG pattern is seen over most of the scalp, especially anteriorly; in some older terminology this was known as a WAR (widespread anterior rapid) pattern, contrasted with a WAIS (widespread slow) pattern associated with high doses of opiates. Anesthetic effects on EEG signals are beginning to be understood at the level of drug actions on different kinds of synapses and the circuits that allow synchronized neuronal activity.[92] Recent algorithms based on state-chart representation using EEG signals can now to monitor the brain states during general anesthesia allowing to classify the brain depth under various sedation.[93]
Artifacts
[edit]
EEG is an extremely useful technique for studying brain activity, but the signal measured is always contaminated by artifacts which can impact the analysis of the data. An artifact is any measured signal that does not originate within the brain. Although multiple algorithms exist for the removal of artifacts, the problem of how to deal with them remains an open question. The source of artifacts can be from issues relating to the instrument, such as faulty electrodes, line noise or high electrode impedance, or they may be from the physiology of the subject being recorded. This can include, eye blinks and movement, cardiac activity and muscle activity and these types of artifacts are more complicated to remove. Artifacts may bias the visual interpretation of EEG data as some may mimic cognitive activity that could affect diagnoses of problems such as Alzheimer's disease or sleep disorders. As such the removal of such artifacts in EEG data used for practical applications is of the utmost importance.[94]
Artifact removal
[edit]It is important to be able to distinguish artifacts from genuine brain activity in order to prevent incorrect interpretations of EEG data. General approaches for the removal of artifacts from the data are, prevention, rejection and cancellation. The goal of any approach is to develop methodology capable of identifying and removing artifacts without affecting the quality of the EEG signal. As artifact sources are quite different the majority of researchers focus on developing algorithms that will identify and remove a single type of noise in the signal. Simple filtering using a notch filter is commonly employed to reject components with a 50/60 Hz frequency. However such simple filters are not an appropriate choice for dealing with all artifacts, as for some, their frequencies will overlap with the EEG frequencies.
Regression algorithms have a moderate computation cost and are simple. They represented the most popular correction method up until the mid-1990s when they were replaced by "blind source separation" type methods. Regression algorithms work on the premise that all artifacts are comprised by one or more reference channels. Subtracting these reference channels from the other contaminated channels, in either the time or frequency domain, by estimating the impact of the reference channels on the other channels, would correct the channels for the artifact. Although the requirement of reference channels ultimately lead to this class of algorithm being replaced, they still represent the benchmark against which modern algorithms are evaluated.[95] Blind source separation (BSS) algorithms employed to remove artifacts include principal component analysis (PCA) and independent component analysis (ICA) and several algorithms in this class have been successful at tackling most physiological artifacts.[95] Recent real-time algorithms based on wavelet transport called WQN can now be used to find and replace artifact segment in real-time in the absence of artifact information. These classes of algorithms depend on the continuity of spectral energy in the different frequency bands[96][97]
Physiological artifacts
[edit]Ocular artifacts
[edit]Ocular artifacts affect the EEG signal significantly. This is due to eye movements involving a change in electric fields surrounding the eyes, distorting the electric field over the scalp, and as EEG is recorded on the scalp, it therefore distorts the recorded signal. A difference of opinion exists among researchers, with some arguing ocular artifacts are, or may be reasonably described as a single generator, whilst others argue it is important to understand the potentially complicated mechanisms. Three potential mechanisms have been proposed to explain the ocular artifact.
The first is corneal retinal dipole movement which argues that an electric dipole is formed between the cornea and retina, as the former is positively and the latter negatively charged. When the eye moves, so does this dipole which impacts the electrical field over the scalp, this is the most standard view. The second mechanism is retinal dipole movement, which is similar to the first but differing in that it argues there is a potential difference, hence dipole across the retina with the cornea having little effect. The third mechanism is eyelid movement. It is known that there is a change in voltage around the eyes when the eyelid moves, even if the eyeball does not. It is thought that the eyelid can be described as a sliding potential source and that the impacting of blinking is different to eye movement on the recorded EEG.[98]
Eyelid fluttering artifacts of a characteristic type were previously called Kappa rhythm (or Kappa waves). It is usually seen in the prefrontal leads, that is, just over the eyes. Sometimes they are seen with mental activity. They are usually in the Theta (4–7 Hz) or Alpha (7–14 Hz) range. They were named because they were believed to originate from the brain. Later study revealed they were generated by rapid fluttering of the eyelids, sometimes so minute that it was difficult to see. They are in fact noise in the EEG reading, and should not technically be called a rhythm or wave. Therefore, current usage in electroencephalography refers to the phenomenon as an eyelid fluttering artifact, rather than a Kappa rhythm (or wave).[99]
The propagation of the ocular artifact is impacted by multiple factors including the properties of the subject's skull, neuronal tissues and skin but the signal may be approximated as being inversely proportional to the distance from the eyes squared. The electrooculogram (EOG) consists of a series of electrodes measuring voltage changes close to the eye and is the most common tool for dealing with the eye movement artifact in the EEG signal.[98]
Muscular artifacts
[edit]Another source of artifacts are various muscle movements across the body. This particular class of artifact is usually recorded by all electrodes on the scalp due to myogenic activity (increase or decrease of blood pressure). The origin of these artifacts have no single location and arises from functionally independent muscle groups, meaning the characteristics of the artifact are not constant. The observed patterns due to muscular artifacts will change depending on subject sex, the particular muscle tissue, and its degree of contraction. The frequency range for muscular artifacts is wide and overlaps with every classic EEG rhythm. However most of the power is concentrated in the lower range of the observed frequencies of 20 to 300 Hz making the gamma band particularly susceptible to muscular artifacts. Some muscle artifacts may have activity with a frequency as low as 2 Hz, so delta and theta bands may also be affected by muscle activity. Muscular artifacts may impact sleep studies, as unconscious bruxism (grinding of teeth) movements or snoring can seriously impact the quality of the recorded EEG. In addition the recordings made of epilepsy patients may be significantly impacted by the existence of muscular artifacts.[100]
Cardiac artifacts
[edit]The potential due to cardiac activity introduces electrocardiograph (ECG) errors in the EEG.[101] Artifacts arising due to cardiac activity may be removed with the help of an ECG reference signal.[94]
Other physiological artifacts
[edit]Glossokinetic artifacts are caused by the potential difference between the base and the tip of the tongue. Minor tongue movements can contaminate the EEG, especially in parkinsonian and tremor disorders.[citation needed]
Environmental artifacts
[edit]In addition to artifacts generated by the body, many artifacts originate from outside the body. Movement by the patient, or even just settling of the electrodes, may cause electrode pops, spikes originating from a momentary change in the impedance of a given electrode. Poor grounding of the EEG electrodes can cause significant 50 or 60 Hz artifact, depending on the local power system's frequency. A third source of possible interference can be the presence of an IV drip; such devices can cause rhythmic, fast, low-voltage bursts, which may be confused for spikes.[citation needed]
Abnormal activity
[edit]Abnormal activity can broadly be separated into epileptiform and non-epileptiform activity. It can also be separated into focal or diffuse.
Focal epileptiform discharges represent fast, synchronous potentials in a large number of neurons in a somewhat discrete area of the brain. These can occur as interictal activity, between seizures, and represent an area of cortical irritability that may be predisposed to producing epileptic seizures. Interictal discharges are not wholly reliable for determining whether a patient has epilepsy nor where his/her seizure might originate. (See focal epilepsy.)
Generalized epileptiform discharges often have an anterior maximum, but these are seen synchronously throughout the entire brain. They are strongly suggestive of a generalized epilepsy.
Focal non-epileptiform abnormal activity may occur over areas of the brain where there is focal damage of the cortex or white matter. It often consists of an increase in slow frequency rhythms or a loss of normal higher frequency rhythms. It may also appear as focal or unilateral decrease in amplitude of the EEG signal.
Diffuse non-epileptiform abnormal activity may manifest as diffuse abnormally slow rhythms or bilateral slowing of normal rhythms, such as the PBR.
Intracortical Encephalogram electrodes and sub-dural electrodes can be used in tandem to discriminate and discretize artifact from epileptiform and other severe neurological events.
More advanced measures of abnormal EEG signals have also recently received attention as possible biomarkers for different disorders such as Alzheimer's disease.[102]
Remote communication
[edit]Systems for decoding imagined speech from EEG have applications such as in brain–computer interfaces.[103]
EEG diagnostics
[edit]The Department of Defense (DoD) and Veteran's Affairs (VA), and U.S Army Research Laboratory (ARL), collaborated on EEG diagnostics in order to detect mild to moderate Traumatic Brain Injury (mTBI) in combat soldiers.[104] Between 2000 and 2012, 75 percent of U.S. military operations brain injuries were classified mTBI. In response, the DoD pursued new technologies capable of rapid, accurate, non-invasive, and field-capable detection of mTBI to address this injury.[104]
Combat personnel often develop PTSD and mTBI in correlation. Both conditions present with altered low-frequency brain wave oscillations.[105] Altered brain waves from PTSD patients present with decreases in low-frequency oscillations, whereas, mTBI injuries are linked to increased low-frequency wave oscillations. Effective EEG diagnostics can help doctors accurately identify conditions and appropriately treat injuries in order to mitigate long-term effects.[106]
Traditionally, clinical evaluation of EEGs involved visual inspection. Instead of a visual assessment of brain wave oscillation topography, quantitative electroencephalography (qEEG), computerized algorithmic methodologies, analyzes a specific region of the brain and transforms the data into a meaningful "power spectrum" of the area.[104] Accurately differentiating between mTBI and PTSD can significantly increase positive recovery outcomes for patients especially since long-term changes in neural communication can persist after an initial mTBI incident.[106]
Another common measurement made from EEG data is that of complexity measures such as Lempel-Ziv complexity, fractal dimension, and spectral flatness,[25] which are associated with particular pathologies or pathology stages.
Economics
[edit]Inexpensive EEG devices exist for the low-cost research and consumer markets. Recently, a few companies have miniaturized medical grade EEG technology to create versions accessible to the general public. Some of these companies have built commercial EEG devices retailing for less than US$100.
- In 2004 OpenEEG released its ModularEEG as open source hardware. Compatible open source software includes a game for balancing a ball.
- In 2007 NeuroSky released the first affordable consumer based EEG along with the game NeuroBoy. This was also the first large scale EEG device to use dry sensor technology.[107]
- In 2008 OCZ Technology developed device for use in video games relying primarily on electromyography.
- In 2008 the Final Fantasy developer Square Enix announced that it was partnering with NeuroSky to create a game, Judecca.[108][109]
- In 2009 Mattel partnered with NeuroSky to release the Mindflex, a game that used an EEG to steer a ball through an obstacle course. By far the best-selling consumer based EEG to date.[108][110]
- In 2009 Uncle Milton Industries partnered with NeuroSky to release the Star Wars Force Trainer, a game designed to create the illusion of possessing the Force.[108][111]
- In 2010, NeuroSky added a blink and electromyography function to the MindSet.[112]
- In 2011, NeuroSky released the MindWave, an EEG device designed for educational purposes and games.[113] The MindWave won the Guinness Book of World Records award for "Heaviest machine moved using a brain control interface".[114]
- In 2012, a Japanese gadget project, neurowear, released Necomimi: a headset with motorized cat ears. The headset is a NeuroSky MindWave unit with two motors on the headband where a cat's ears might be. Slipcovers shaped like cat ears sit over the motors so that as the device registers emotional states the ears move to relate. For example, when relaxed, the ears fall to the sides and perk up when excited again.
- In 2014, OpenBCI released an eponymous open source brain-computer interface after a successful kickstarter campaign in 2013. The board, later renamed "Cyton", has 8 channels, expandable to 16 with the Daisy module. It supports EEG, EKG, and EMG. The Cyton Board is based on the Texas Instruments ADS1299 IC and the Arduino or PIC microcontroller, and initially costed $399 before increasing in price to $999. It uses standard metal cup electrodes and conductive paste.
- In 2015, Mind Solutions Inc released the smallest consumer BCI to date, the NeuroSync. This device functions as a dry sensor at a size no larger than a Bluetooth ear piece.[115]
- In 2015, A Chinese-based company Macrotellect released BrainLink Pro and BrainLink Lite, a consumer grade EEG wearable product providing 20 brain fitness enhancement Apps on Apple and Android App Stores.[116]
- In 2021, BioSerenity release the Neuronaute and Icecap a single-use disposable EEG headset that allows recording with equivalent quality to traditional cup electrodes.[117][118]
Future research
[edit]The EEG has been used for many purposes besides the conventional uses of clinical diagnosis and conventional cognitive neuroscience. An early use was during World War II by the U.S. Army Air Corps to screen out pilots in danger of having seizures;[119] long-term EEG recordings in epilepsy patients are still used today for seizure prediction. Neurofeedback remains an important extension, and in its most advanced form is also attempted as the basis of brain computer interfaces.[120] The EEG is also used quite extensively in the field of neuromarketing.
The EEG is altered by drugs that affect brain functions, the chemicals that are the basis for psychopharmacology. Berger's early experiments recorded the effects of drugs on EEG. The science of pharmaco-electroencephalography has developed methods to identify substances that systematically alter brain functions for therapeutic and recreational use.
Honda is attempting to develop a system to enable an operator to control its Asimo robot using EEG, a technology it eventually hopes to incorporate into its automobiles.[121]
EEGs have been used as evidence in criminal trials in the Indian state of Maharashtra.[122][123] Brain Electrical Oscillation Signature Profiling (BEOS), an EEG technique, was used in the trial of State of Maharashtra v. Sharma to show Sharma remembered using arsenic to poison her ex-fiancé, although the reliability and scientific basis of BEOS is disputed.[124]
A lot of research is currently being carried out in order to make EEG devices smaller, more portable and easier to use. So called "Wearable EEG" is based upon creating low power wireless collection electronics and 'dry' electrodes which do not require a conductive gel to be used.[125] Wearable EEG aims to provide small EEG devices which are present only on the head and which can record EEG for days, weeks, or months at a time, as ear-EEG. Such prolonged and easy-to-use monitoring could make a step change in the diagnosis of chronic conditions such as epilepsy, and greatly improve the end-user acceptance of BCI systems.[126] Research is also being carried out on identifying specific solutions to increase the battery lifetime of Wearable EEG devices through the use of the data reduction approach.
In research, currently EEG is often used in combination with machine learning.[127] EEG data are pre-processed then passed on to machine learning algorithms. These algorithms are then trained to recognize different diseases like schizophrenia,[128] epilepsy[129] or dementia.[130] Furthermore, they are increasingly used to study seizure detection.[131][132][133][134] By using machine learning, the data can be analyzed automatically. In the long run this research is intended to build algorithms that support physicians in their clinical practice[135] and to provide further insights into diseases.[136] In this vein, complexity measures of EEG data are often calculated, such as Lempel-Ziv complexity, fractal dimension, and spectral flatness.[25] It has been shown that combining or multiplying such measures can reveal previously hidden information in EEG data.[25]
EEG signals from musical performers were used to create instant compositions and one CD by the Brainwave Music Project, run at the Computer Music Center at Columbia University by Brad Garton and Dave Soldier.[citation needed] Similarly, an hour-long recording of the brainwaves of Ann Druyan was included on the Voyager Golden Record, launched on the Voyager probes in 1977, in case any extraterrestrial intelligence could decode her thoughts, which included what it was like to fall in love.[citation needed]
History
[edit]

In 1875, Richard Caton (1842–1926), a physician practicing in Liverpool, presented his findings about electrical phenomena of the exposed cerebral hemispheres of rabbits and monkeys in the British Medical Journal. In 1890, Polish physiologist Adolf Beck published an investigation of spontaneous electrical activity of the brain of rabbits and dogs that included rhythmic oscillations altered by light. Beck started experiments on the electrical brain activity of animals. Beck placed electrodes directly on the surface of the brain to test for sensory stimulation. His observation of fluctuating brain activity led to the conclusion of brain waves.[137]
In 1912, Ukrainian physiologist Vladimir Vladimirovich Pravdich-Neminsky published the first animal EEG and the evoked potential of the mammalian (dog).[138] In 1914, Napoleon Cybulski and Jelenska-Macieszyna photographed EEG recordings of experimentally induced seizures.[citation needed]
German physiologist and psychiatrist Hans Berger (1873–1941) recorded the first human EEG in 1924.[139] Expanding on work previously conducted on animals by Richard Caton and others, Berger also invented the electroencephalograph (giving the device its name), an invention described "as one of the most surprising, remarkable, and momentous developments in the history of clinical neurology".[140] His discoveries were first confirmed by British scientists Edgar Douglas Adrian and B. H. C. Matthews in 1934 and developed by them.
In 1934, Fisher and Lowenbach first demonstrated epileptiform spikes. In 1935, Gibbs, Davis and Lennox described interictal spike waves and the three cycles/s pattern of clinical absence seizures, which began the field of clinical electroencephalography.[141] Subsequently, in 1936 Gibbs and Jasper reported the interictal spike as the focal signature of epilepsy. The same year, the first EEG laboratory opened at Massachusetts General Hospital.[citation needed]
Franklin Offner (1911–1999), professor of biophysics at Northwestern University developed a prototype of the EEG that incorporated a piezoelectric inkwriter called a Crystograph (the whole device was typically known as the Offner Dynograph).
In 1947, The American EEG Society was founded and the first International EEG congress was held. In 1953 Aserinsky and Kleitman described REM sleep.
In the 1950s, William Grey Walter developed an adjunct to EEG called EEG topography, which allowed for the mapping of electrical activity across the surface of the brain. This enjoyed a brief period of popularity in the 1980s and seemed especially promising for psychiatry. It was never accepted by neurologists and remains primarily a research tool.

An electroencephalograph system manufactured by Beckman Instruments was used on at least one of the Project Gemini crewed spaceflights (1965–1966) to monitor the brain waves of astronauts on the flight. It was one of many Beckman Instruments specialized for and used by NASA.[142]
The first instance of the use of EEG to control a physical object, a robot, was in 1988. The robot would follow a line or stop depending on the alpha activity of the subject. If the subject relaxed and closed their eyes therefore increasing alpha activity, the bot would move. Opening their eyes thus decreasing alpha activity would cause the robot to stop on the trajectory.[143]
See also
[edit]- Amplitude integrated electroencephalography
- Binaural beats
- Brainwave synchronization
- Cerebral function monitoring
- Comparison of consumer brain-computer interface devices
- Direct brain interfaces
- EEG measures during anesthesia
- EEG microstates
- Electromagnetic pulse
- Electroneurogram
- Electropalatograph
- Emotiv Systems
- European data format
- FieldTrip
- God helmet
- Hemoencephalography
- Hypersynchronization of electrophysiological activity in epilepsy
- Induced activity
- Local field potentials
- Magnetoencephalography
- Mind machine
- Neural oscillations
- Neural synchrony
- Ongoing brain activity
- Michael Graham Saunders
- Spontaneous potential
- EEG analysis
References
[edit]- ^
Compare EEC: Moran A (August 2, 2004). Sport and Exercise Psychology: A Critical Introduction. Hove, East Sussex: Routledge. p. 104. ISBN 978-1-134-70410-1. Retrieved July 6, 2024.
[...] electroencephalographic (EEC) methods [...]. In a typical EEC experiment, an electrode is attached to a person's scalp in order to detect the electrical activity of neurons in the underlying brain region. Another electrode is then attached to the person's earlobe, where there is no electrical activity to detect. Then the EEC is recorded to indicate the difference in electrical potentials detected by the electrodes [...]. In recent years, a considerable amount of research has been conducted on EEC activity in athletes [...].
- ^ Amzica F, Lopes da Silva FH (November 2017). Schomer DL, Lopes da Silva FH (eds.). Cellular Substrates of Brain Rhythms. Vol. 1. Oxford University Press. doi:10.1093/med/9780190228484.003.0002.
- ^ a b Eric R. Kandel, John Koester, Sarah Mack, Steven Siegelbaum (2021). Principles of neural science (6th ed.). New York: McGraw-Hill Companies. p. 1450. ISBN 978-1-259-64223-4. OCLC 1199587061.
- ^ "EEG: MedlinePlus Medical Encyclopedia". medlineplus.gov. Archived from the original on July 5, 2016. Retrieved July 24, 2022.
- ^ Chernecky CC, Berger BJ (2013). Laboratory tests and diagnostic procedures (6th ed.). St. Louis, Mo.: Elsevier. ISBN 978-1-4557-0694-5.
- ^ Deschamps A, Ben Abdallah A, Jacobsohn E, Saha T, Djaiani G, El-Gabalawy R, et al. (July 2024). "Electroencephalography-Guided Anesthesia and Delirium in Older Adults After Cardiac Surgery: The ENGAGES-Canada Randomized Clinical Trial". JAMA. 332 (2): 112–123. doi:10.1001/jama.2024.8144. PMC 11165413. PMID 38857019.
- ^ Hao D, Fritz BA, Saddawi-Konefka D, Palanca BJ (November 2023). "Pro-Con Debate: Electroencephalography-Guided Anesthesia for Reducing Postoperative Delirium". Anesthesia and Analgesia. 137 (5): 976–982. doi:10.1213/ANE.0000000000006399. PMID 37862399.
- ^ a b c Pillai J, Sperling MR (2006). "Interictal EEG and the diagnosis of epilepsy". Epilepsia. 47 Suppl 1 (Suppl 1): 14–22. doi:10.1111/j.1528-1167.2006.00654.x. PMID 17044820. S2CID 8668713.
- ^ So EL (August 2010). "Interictal epileptiform discharges in persons without a history of seizures: what do they mean?". Journal of Clinical Neurophysiology. 27 (4): 229–238. doi:10.1097/WNP.0b013e3181ea42a4. PMID 20634716.
- ^ Li C, Amin U, Rivera-Cruz A, Frontera AT, Benbadis SR (October 2023). "The Yield of Ambulatory Video-EEG – Predictors of Successful Event Capture". Neurology Clinical Practice. 13 (5) e200194. doi:10.1212/CPJ.0000000000200194. PMC 10511269. PMID 37736066.
- ^ van Rooij LG, Hellström-Westas L, de Vries LS (August 2013). "Treatment of neonatal seizures". Seminars in Fetal & Neonatal Medicine. 18 (4): 209–215. doi:10.1016/j.siny.2013.01.001. PMID 23402893.
- ^ "EEG (Electroencephalogram) – Mayo Clinic". Mayo Clinic. Archived from the original on August 30, 2019. Retrieved August 30, 2019.
- ^ Rubinos C, Alkhachroum A, Der-Nigoghossian C, Claassen J (2020). "Electroencephalogram Monitoring in Critical Care". Seminars in Neurology. 40 (6): 675–680. doi:10.1055/s-0040-1719073. ISSN 1098-9021. PMC 7856834. PMID 33176375.
- ^ a b c d Niedermeyer E, da Silva FL (2004). Electroencephalography: Basic Principles, Clinical Applications, and Related Fields. Lippincott Williams & Wilkins. ISBN 978-0-7817-5126-1.[page needed]
- ^ Lawley A, Evans S, Manfredonia F, Cavanna AE (2015). "The role of outpatient ambulatory electroencephalography in the diagnosis and management of adults with epilepsy or nonepileptic attack disorder: A systematic literature review". Epilepsy & Behavior. 53: 26–30. doi:10.1016/j.yebeh.2015.09.032. ISSN 1525-5069. PMID 26515156.
- ^ Seneviratne U, D'Souza WJ (2019). "Ambulatory EEG". Clinical Neurophysiology: Basis and Technical Aspects. Handbook of Clinical Neurology. Vol. 160. pp. 161–170. doi:10.1016/B978-0-444-64032-1.00010-2. ISBN 978-0-444-64032-1. ISSN 0072-9752. PMID 31277845.
- ^ Yang H, Ang KK, Wang C, Phua KS, Guan C (2016). "Neural and cortical analysis of swallowing and detection of motor imagery of swallow for dysphagia rehabilitation—A review". Brain-Computer Interfaces: Lab Experiments to Real-World Applications. Progress in Brain Research. Vol. 228. pp. 185–219. doi:10.1016/bs.pbr.2016.03.014. ISBN 978-0-12-804216-8. PMID 27590970.
- ^ Jestrović I, Coyle JL, Sejdić E (October 2015). "Decoding human swallowing via electroencephalography: a state-of-the-art review". Journal of Neural Engineering. 12 (5) 051001. Bibcode:2015JNEng..12e1001J. doi:10.1088/1741-2560/12/5/051001. PMC 4596245. PMID 26372528.
- ^ Cuellar M, Harkrider AW, Jenson D, Thornton D, Bowers A, Saltuklaroglu T (July 2016). "Time-frequency analysis of the EEG mu rhythm as a measure of sensorimotor integration in the later stages of swallowing". Clinical Neurophysiology. 127 (7): 2625–2635. doi:10.1016/j.clinph.2016.04.027. PMID 27291882. S2CID 3746307.
- ^ Clayson PE, Carbine KA, Baldwin SA, Larson MJ (November 2019). "Methodological reporting behavior, sample sizes, and statistical power in studies of event-related potentials: Barriers to reproducibility and replicability". Psychophysiology. 56 (11) e13437. doi:10.1111/psyp.13437. PMID 31322285. S2CID 197665482. Archived from the original on October 7, 2022. Retrieved October 7, 2022.
- ^ a b Peterson BS, Trampush J, Maglione M, Bolshakova M, Brown M, Rozelle M, et al. (2024). "ADHD Diagnosis and Treatment in Children and Adolescents". effectivehealthcare.ahrq.gov. doi:10.23970/ahrqepccer267. PMID 38657097. Retrieved June 19, 2024.
- ^ Burma JS, Lapointe AP, Wilson M, Penner LC, Kennedy CM, Newel KT, et al. (2024). "Adolescent Sport-Related Concussion and the Associated Neurophysiological Changes: A Systematic Review". Pediatric Neurology. 150: 97–106. doi:10.1016/j.pediatrneurol.2023.10.020. ISSN 1873-5150. PMID 38006666.
- ^ "Living Guideline for Pediatric Concussion". Living Guideline for Pediatric Concussion Care. Retrieved November 21, 2024.
- ^ "Home | Living Concussion Guidelines". concussionsontario.org. Retrieved November 21, 2024.
- ^ a b c d Burns T, Rajan R (2015). "Combining complexity measures of EEG data: multiplying measures reveal previously hidden information". F1000Research. 4: 137. doi:10.12688/f1000research.6590.1. PMC 4648221. PMID 26594331.
- ^ Vespa PM, Nenov V, Nuwer MR (January 1999). "Continuous EEG monitoring in the intensive care unit: early findings and clinical efficacy". Journal of Clinical Neurophysiology. 16 (1): 1–13. doi:10.1097/00004691-199901000-00001. PMID 10082088.
- ^ Schultz TL (March 2012). "Technical tips: MRI compatible EEG electrodes: advantages, disadvantages, and financial feasibility in a clinical setting". The Neurodiagnostic Journal. 52 (1): 69–81. PMID 22558648.
- ^ a b c Hämäläinen M, Hari R, Ilmoniemi RJ, Knuutila J, Lounasmaa OV (1993). "Magnetoencephalography-theory, instrumentation, and applications to noninvasive studies of the working human brain". Reviews of Modern Physics. 65 (2): 413–97. Bibcode:1993RvMP...65..413H. doi:10.1103/RevModPhys.65.413. Archived from the original on January 26, 2019. Retrieved September 10, 2018.
- ^ Montoya-Martínez J, Vanthornhout J, Bertrand A, Francart T (2021). "Effect of number and placement of EEG electrodes on measurement of neural tracking of speech". PLOS ONE. 16 (2) e0246769. Bibcode:2021PLoSO..1646769M. bioRxiv 10.1101/800979. doi:10.1371/journal.pone.0246769. PMC 7877609. PMID 33571299.
- ^ O'Regan S, Faul S, Marnane W (2010). "Automatic detection of EEG artifacts arising from head movements". 2010 Annual International Conference of the IEEE Engineering in Medicine and Biology. pp. 6353–6. doi:10.1109/IEMBS.2010.5627282. ISBN 978-1-4244-4123-5.
- ^ Murphy KJ, Brunberg JA (1997). "Adult claustrophobia, anxiety and sedation in MRI". Magnetic Resonance Imaging. 15 (1): 51–54. doi:10.1016/S0730-725X(96)00351-7. PMID 9084025.
- ^ Schenck JF (June 1996). "The role of magnetic susceptibility in magnetic resonance imaging: MRI magnetic compatibility of the first and second kinds". Medical Physics. 23 (6): 815–850. Bibcode:1996MedPh..23..815S. doi:10.1118/1.597854. PMID 8798169.
- ^ a b Yasuno F, Brown AK, Zoghbi SS, Krushinski JH, Chernet E, Tauscher J, et al. (January 2008). "The PET radioligand [11C]MePPEP binds reversibly and with high specific signal to cannabinoid CB1 receptors in nonhuman primate brain". Neuropsychopharmacology. 33 (2): 259–269. doi:10.1038/sj.npp.1301402. PMID 17392732.
- ^ Mulholland T (2012). "Objective EEG Methods for Studying Covert Shifts of Visual Attention". In McGuigan FJ, Schoonover RA (eds.). The Psychophysiology of Thinking: Studies of Covert Processes. Elsevier. pp. 109–51. ISBN 978-0-323-14700-2.
- ^ Hinterberger T, Kübler A, Kaiser J, Neumann N, Birbaumer N (March 2003). "A brain-computer interface (BCI) for the locked-in: comparison of different EEG classifications for the thought translation device". Clinical Neurophysiology. 114 (3): 416–425. doi:10.1016/S1388-2457(02)00411-X. PMID 12705422. S2CID 11857440.
- ^ Sereno SC, Rayner K, Posner MI (July 1998). "Establishing a time-line of word recognition: evidence from eye movements and event-related potentials". NeuroReport. 9 (10): 2195–2200. doi:10.1097/00001756-199807130-00009. PMID 9694199. S2CID 19466604.
- ^ Feinberg I, Campbell IG (February 2013). "Longitudinal sleep EEG trajectories indicate complex patterns of adolescent brain maturation". American Journal of Physiology. Regulatory, Integrative and Comparative Physiology. 304 (4): R296 – R303. doi:10.1152/ajpregu.00422.2012. PMC 3567357. PMID 23193115.
- Lay summary in: "Sleep study reveals how the adolescent brain makes the transition to mature thinking". ScienceDaily (Press release). March 19, 2013.
- ^ Srinivasan R (1999). "Methods to Improve the Spatial Resolution of EEG". International Journal. 1 (1): 102–11.
- ^ Grech R, Cassar T, Muscat J, Camilleri KP, Fabri SG, Zervakis M, et al. (November 2008). "Review on solving the inverse problem in EEG source analysis". Journal of Neuroengineering and Rehabilitation. 5 (1) 25. doi:10.1186/1743-0003-5-25. PMC 2605581. PMID 18990257.
- ^ Schlögl A, Slater M, Pfurtscheller G (2002). "Presence research and EEG" (PDF). Archived (PDF) from the original on August 11, 2017. Retrieved August 24, 2013.
- ^ Etienne A, Laroia T, Weigle H, Afelin A, Kelly SK, Krishnan A, et al. (2020). "Novel Electrodes for Reliable EEG Recordings on Coarse and Curly Hair". 2020 42nd Annual International Conference of the IEEE Engineering in Medicine & Biology Society (EMBC). pp. 6151–6154. bioRxiv 10.1101/2020.02.26.965202. doi:10.1109/EMBC44109.2020.9176067. ISBN 978-1-7281-1990-8. PMID 33019375.
- ^ Adams EJ, Scott ME, Amarante M, Ramírez CA, Rowley SJ, Noble KG, et al. (April 2024). "Fostering inclusion in EEG measures of pediatric brain activity". npj Science of Learning. 9 (1) 27. Bibcode:2024npjSL...9...27A. doi:10.1038/s41539-024-00240-y. PMC 10987610. PMID 38565857.
- ^ Huang-Hellinger FR, Breiter HC, McCormack G, Cohen MS, Kwong KK, Sutton JP, et al. (1995). "Simultaneous Functional Magnetic Resonance Imaging and Electrophysiological Recording". Human Brain Mapping. 3: 13–23. doi:10.1002/hbm.460030103. S2CID 145788101.
- ^ Goldman RI, Stern JM, Engel J, Cohen MS (November 2000). "Acquiring simultaneous EEG and functional MRI". Clinical Neurophysiology. 111 (11): 1974–1980. doi:10.1016/s1388-2457(00)00456-9. PMID 11068232. S2CID 11716369.
- ^ Horovitz SG, Skudlarski P, Gore JC (May 2002). "Correlations and dissociations between BOLD signal and P300 amplitude in an auditory oddball task: a parametric approach to combining fMRI and ERP". Magnetic Resonance Imaging. 20 (4): 319–325. doi:10.1016/S0730-725X(02)00496-4. PMID 12165350.
- ^ Laufs H, Kleinschmidt A, Beyerle A, Eger E, Salek-Haddadi A, Preibisch C, et al. (August 2003). "EEG-correlated fMRI of human alpha activity". NeuroImage. 19 (4): 1463–1476. CiteSeerX 10.1.1.586.3056. doi:10.1016/S1053-8119(03)00286-6. PMID 12948703. S2CID 6272011.
- ^ US patent 7286871, Mark S. Cohen, "Method and apparatus for reducing contamination of an electrical signal", published May 20, 2004
- ^ Difrancesco MW, Holland SK, Szaflarski JP (October 2008). "Simultaneous EEG/functional magnetic resonance imaging at 4 Tesla: correlates of brain activity to spontaneous alpha rhythm during relaxation". Journal of Clinical Neurophysiology. 25 (5): 255–264. doi:10.1097/WNP.0b013e3181879d56. PMC 2662486. PMID 18791470.
- ^ Huizenga HM, van Zuijen TL, Heslenfeld DJ, Molenaar PC (July 2001). "Simultaneous MEG and EEG source analysis". Physics in Medicine and Biology. 46 (7): 1737–1751. Bibcode:2001PMB....46.1737H. CiteSeerX 10.1.1.4.8384. doi:10.1088/0031-9155/46/7/301. PMID 11474922. S2CID 250761006.
- ^ Aydin Ü, Vorwerk J, Dümpelmann M, Küpper P, Kugel H, Heers M, et al. (2015). "Combined EEG/MEG can outperform single modality EEG or MEG source reconstruction in presurgical epilepsy diagnosis". PLOS ONE (Review). 10 (3) e0118753. Bibcode:2015PLoSO..1018753A. doi:10.1371/journal.pone.0118753. PMC 4356563. PMID 25761059.
- ^ Schreckenberger M, Lange-Asschenfeldt C, Lange-Asschenfeld C, Lochmann M, Mann K, Siessmeier T, et al. (June 2004). "The thalamus as the generator and modulator of EEG alpha rhythm: a combined PET/EEG study with lorazepam challenge in humans". NeuroImage. 22 (2): 637–644. doi:10.1016/j.neuroimage.2004.01.047. PMID 15193592. S2CID 31790623.
- ^ Bird J, Manso LJ, Ekart A, Faria DR (September 2018). A Study on Mental State Classification using EEG-based Brain-Machine Interface. Madeira Island, Portugal: 9th international Conference on Intelligent Systems 2018. Retrieved December 3, 2018.
- ^ Bird JJ, Ekart A, Buckingham CD, Faria DR (2019). Mental Emotional Sentiment Classification with an EEG-based Brain-Machine Interface. St Hugh's College, University of Oxford, United Kingdom: The International Conference on Digital Image and Signal Processing (DISP'19). Archived from the original on December 3, 2018. Retrieved December 3, 2018.
- ^ Vanneste S, Song JJ, De Ridder D (March 2018). "Thalamocortical dysrhythmia detected by machine learning". Nature Communications. 9 (1) 1103. Bibcode:2018NatCo...9.1103V. doi:10.1038/s41467-018-02820-0. PMC 5856824. PMID 29549239.
- ^ Herculano-Houzel S (2009). "The human brain in numbers: a linearly scaled-up primate brain". Frontiers in Human Neuroscience. 3: 31. doi:10.3389/neuro.09.031.2009. PMC 2776484. PMID 19915731.
- ^ Tatum WO, Husain AM, Benbadis SR (2008). Handbook of EEG Interpretation. Demos Medical Publishing.[page needed]
- ^ a b Nunez PL, Srinivasan R (1981). Electric fields of the brain: The neurophysics of EEG. Oxford University Press. ISBN 978-0-19-502796-9.[page needed]
- ^ Klein S, Thorne BM (October 3, 2006). Biological psychology. New York, N.Y.: Worth. ISBN 978-0-7167-9922-1.[page needed]
- ^ Whittingstall K, Logothetis NK (October 2009). "Frequency-band coupling in surface EEG reflects spiking activity in monkey visual cortex". Neuron. 64 (2): 281–289. doi:10.1016/j.neuron.2009.08.016. PMID 19874794. S2CID 17650488.
- ^ Towle VL, Bolaños J, Suarez D, Tan K, Grzeszczuk R, Levin DN, et al. (January 1993). "The spatial location of EEG electrodes: locating the best-fitting sphere relative to cortical anatomy". Electroencephalography and Clinical Neurophysiology. 86 (1): 1–6. doi:10.1016/0013-4694(93)90061-Y. PMID 7678386.
- ^ "Guideline seven: a proposal for standard montages to be used in clinical EEG. American Electroencephalographic Society". Journal of Clinical Neurophysiology. 11 (1): 30–36. January 1994. doi:10.1097/00004691-199401000-00008. PMID 8195424.
- ^ Aurlien H, Gjerde IO, Aarseth JH, Eldøen G, Karlsen B, Skeidsvoll H, et al. (March 2004). "EEG background activity described by a large computerized database". Clinical Neurophysiology. 115 (3): 665–673. doi:10.1016/j.clinph.2003.10.019. PMID 15036063. S2CID 25988980.
- ^ Yao D (November 2001). "A method to standardize a reference of scalp EEG recordings to a point at infinity". Physiological Measurement. 22 (4): 693–711. doi:10.1088/0967-3334/22/4/305. PMID 11761077. S2CID 250847914.
- ^ Nunez PL, Pilgreen KL (October 1991). "The spline-Laplacian in clinical neurophysiology: a method to improve EEG spatial resolution". Journal of Clinical Neurophysiology. 8 (4): 397–413. doi:10.1097/00004691-199110000-00005. PMID 1761706. S2CID 38459560.
- ^ Taheri BA, Knight RT, Smith RL (May 1994). "A dry electrode for EEG recording". Electroencephalography and Clinical Neurophysiology. 90 (5): 376–383. doi:10.1016/0013-4694(94)90053-1. PMID 7514984. Archived from the original on December 22, 2019. Retrieved December 10, 2019.
- ^ Alizadeh-Taheri B (1994). Active Micromachined Scalp Electrode Array for Eeg Signal Recording (PhD thesis). University of California, Davis. p. 82. Bibcode:1994PhDT........82A.
- ^ Hockenberry J (August 2001). "The Next Brainiacs". Wired Magazine.
- ^ a b c d Slipher GA, Hairston WD, Bradford JC, Bain ED, Mrozek RA (2018). "Carbon nanofiber-filled conductive silicone elastomers as soft, dry bioelectronic interfaces". PLOS ONE. 13 (2) e0189415. Bibcode:2018PLoSO..1389415S. doi:10.1371/journal.pone.0189415. PMC 5800568. PMID 29408942.
- ^ a b c Wang F, Li G, Chen J, Duan Y, Zhang D (August 2016). "Novel semi-dry electrodes for brain-computer interface applications". Journal of Neural Engineering. 13 (4) 046021. Bibcode:2016JNEng..13d6021W. doi:10.1088/1741-2560/13/4/046021. PMID 27378253. S2CID 26744679.
- ^ Fiedler P, Griebel S, Pedrosa P, Fonseca C, Vaz F, Zentner L, et al. (January 1, 2015). "Multichannel EEG with novel Ti/TiN dry electrodes". Sensors and Actuators A: Physical. 221: 139–147. Bibcode:2015SeAcA.221..139F. doi:10.1016/j.sna.2014.10.010. ISSN 0924-4247.
- ^ "Dry EEG Headsets | Products | CGX". CGX 2021. Archived from the original on February 13, 2020. Retrieved February 13, 2020.
- ^ "Dry EEG Technology". CGX LLC. Archived from the original on February 13, 2020. Retrieved February 13, 2020.
- ^ Kondylis ED, Wozny TA, Lipski WJ, Popescu A, DeStefino VJ, Esmaeili B, et al. (2014). "Detection of high-frequency oscillations by hybrid depth electrodes in standard clinical intracranial EEG recordings". Frontiers in Neurology. 5: 149. doi:10.3389/fneur.2014.00149. PMC 4123606. PMID 25147541.
- ^ Murakami S, Okada Y (September 2006). "Contributions of principal neocortical neurons to magnetoencephalography and electroencephalography signals". The Journal of Physiology. 575 (Pt 3): 925–936. doi:10.1113/jphysiol.2006.105379. PMC 1995687. PMID 16613883.
- ^ Clerc M, Leblond J, Marmorat JP, Papageorgakis C (2016), Uniqueness result for an inverse conductivity recovery problem with application to EEG, Università Degli Studi Di Trieste, EUT Edizioni Università di Trieste, doi:10.13137/2464-8728/13165, retrieved June 3, 2025
- ^ Anderson J (October 22, 2004). Cognitive Psychology and Its Implications (Hardcover) (6th ed.). New York, NY: Worth. p. 17. ISBN 978-0-7167-0110-1.
- ^ Creutzfeldt OD, Watanabe S, Lux HD (January 1966). "Relations between EEG phenomena and potentials of single cortical cells. I. Evoked responses after thalamic and erpicortical stimulation". Electroencephalography and Clinical Neurophysiology. 20 (1): 1–18. doi:10.1016/0013-4694(66)90136-2. PMID 4161317.
- ^ Buzsaki G (2006). Rhythms of the brain. Oxford University Press. ISBN 978-0-19-530106-9.[page needed]
- ^ Tatum WO (March 2014). "Ellen R. Grass Lecture: extraordinary EEG". The Neurodiagnostic Journal. 54 (1): 3–21. PMID 24783746.
- ^ a b Kirmizi-Alsan E, Bayraktaroglu Z, Gurvit H, Keskin YH, Emre M, Demiralp T (August 2006). "Comparative analysis of event-related potentials during Go/NoGo and CPT: decomposition of electrophysiological markers of response inhibition and sustained attention". Brain Research. 1104 (1): 114–128. doi:10.1016/j.brainres.2006.03.010. PMID 16824492. S2CID 18850757.
- ^ Frohlich J, Senturk D, Saravanapandian V, Golshani P, Reiter LT, Sankar R, et al. (December 2016). "A Quantitative Electrophysiological Biomarker of Duplication 15q11.2-q13.1 Syndrome". PLOS ONE. 11 (12) e0167179. Bibcode:2016PLoSO..1167179F. doi:10.1371/journal.pone.0167179. PMC 5157977. PMID 27977700.
- ^ Kisley MA, Cornwell ZM (November 2006). "Gamma and beta neural activity evoked during a sensory gating paradigm: effects of auditory, somatosensory and cross-modal stimulation". Clinical Neurophysiology. 117 (11): 2549–2563. doi:10.1016/j.clinph.2006.08.003. PMC 1773003. PMID 17008125.
- ^ Kanayama N, Sato A, Ohira H (May 2007). "Crossmodal effect with rubber hand illusion and gamma-band activity". Psychophysiology. 44 (3): 392–402. doi:10.1111/j.1469-8986.2007.00511.x. PMID 17371495.
- ^ Gastaut H (1952). "[Electrocorticographic study of the reactivity of rolandic rhythm]". Revue Neurologique. 87 (2): 176–182. PMID 13014777.
- ^ a b Oberman LM, Hubbard EM, McCleery JP, Altschuler EL, Ramachandran VS, Pineda JA (July 2005). "EEG evidence for mirror neuron dysfunction in autism spectrum disorders". Brain Research. Cognitive Brain Research. 24 (2): 190–198. doi:10.1016/j.cogbrainres.2005.01.014. PMID 15993757.
- ^ Cahn BR, Polich J (March 2006). "Meditation states and traits: EEG, ERP, and neuroimaging studies". Psychological Bulletin. 132 (2): 180–211. doi:10.1037/0033-2909.132.2.180. PMID 16536641. S2CID 2151810.
- ^ Gerrard P, Malcolm R (June 2007). "Mechanisms of modafinil: A review of current research". Neuropsychiatric Disease and Treatment. 3 (3): 349–364. PMC 2654794. PMID 19300566.
- ^ Niedermeyer E (June 1997). "Alpha rhythms as physiological and abnormal phenomena". International Journal of Psychophysiology. 26 (1–3): 31–49. doi:10.1016/S0167-8760(97)00754-X. PMID 9202993.
- ^ Feshchenko VA, Reinsel RA, Veselis RA (July 2001). "Multiplicity of the alpha rhythm in normal humans". Journal of Clinical Neurophysiology. 18 (4): 331–344. doi:10.1097/00004691-200107000-00005. PMID 11673699.
- ^ Pfurtscheller G, Lopes da Silva FH (November 1999). "Event-related EEG/MEG synchronization and desynchronization: basic principles". Clinical Neurophysiology. 110 (11): 1842–1857. doi:10.1016/S1388-2457(99)00141-8. PMID 10576479. S2CID 24756702.
- ^ Anderson AL, Thomason ME (November 2013). "Functional plasticity before the cradle: a review of neural functional imaging in the human fetus". Neuroscience and Biobehavioral Reviews. 37 (9 Pt B): 2220–2232. doi:10.1016/j.neubiorev.2013.03.013. PMID 23542738. S2CID 45733681.
- ^ "The MacIver Lab". Stanford University. Archived from the original on November 23, 2008. Retrieved December 16, 2006.
- ^ Loison V, Voskobiynyk Y, Lindquist B, Necula D, Longrois D, Paz J, et al. (January 1, 2024). "Mapping general anesthesia states based on electro-encephalogram transition phases". NeuroImage. 285 120498. doi:10.1016/j.neuroimage.2023.120498. ISSN 1053-8119. PMC 10792552. PMID 38135170.
- ^ a b Jiang X, Bian GB, Tian Z (February 2019). "Removal of Artifacts from EEG Signals: A Review". Sensors. 19 (5): 987. Bibcode:2019Senso..19..987J. doi:10.3390/s19050987. PMC 6427454. PMID 30813520.
- ^ a b Alsuradi H, Park W, Eid M (2020). "EEG-Based Neurohaptics Research: A Literature Review". IEEE Access. 8: 49313–49328. Bibcode:2020IEEEA...849313A. doi:10.1109/ACCESS.2020.2979855. ISSN 2169-3536. S2CID 214596892.
- ^ Dora M, Holcman D (2022). "Adaptive Single-Channel EEG Artifact Removal With Applications to Clinical Monitoring". IEEE Transactions on Neural Systems and Rehabilitation Engineering. 30: 286–295. Bibcode:2022ITNSR..30..286D. doi:10.1109/TNSRE.2022.3147072. ISSN 1558-0210. PMID 35085086.
- ^ Dora M, Jaffard S, Holcman D (2024). "The WQN Algorithm for EEG Artifact Removal in the Absence of Scale Invariance". IEEE Transactions on Signal Processing. 72: 2663–2676. arXiv:2307.04155. Bibcode:2024ITSP...72.2663D. doi:10.1109/TSP.2024.3403965. ISSN 1941-0476.
- ^ a b Croft RJ, Barry RJ (February 2000). "Removal of ocular artifact from the EEG: a review". Clinical Neurophysiology. 30 (1): 5–19. doi:10.1016/S0987-7053(00)00055-1. PMID 10740792. S2CID 13738373.
- ^ Epstein CM (1983). Introduction to EEG and evoked potentials. J. B. Lippincott Co. ISBN 978-0-397-50598-2.[page needed]
- ^ Chen X, Xu X, Liu A, Lee S, Chen X, Zhang X, et al. (July 15, 2019). "Removal of Muscle Artifacts From the EEG: A Review and Recommendations". IEEE Sensors Journal. 19 (14): 5353–5368. Bibcode:2019ISenJ..19.5353C. doi:10.1109/JSEN.2019.2906572. ISSN 1558-1748. S2CID 116693954.
- ^ Kaya I (May 18, 2022), "A Brief Summary of EEG Artifact Handling", in Asadpour V (ed.), Brain-Computer Interface, Artificial Intelligence, vol. 9, IntechOpen, arXiv:2001.00693, doi:10.5772/intechopen.99127, ISBN 978-1-83962-522-0, S2CID 209832569, archived from the original on December 20, 2022, retrieved December 20, 2022
- ^ Montez T, Poil SS, Jones BF, Manshanden I, Verbunt JP, van Dijk BW, et al. (February 2009). "Altered temporal correlations in parietal alpha and prefrontal theta oscillations in early-stage Alzheimer disease". Proceedings of the National Academy of Sciences of the United States of America. 106 (5): 1614–1619. Bibcode:2009PNAS..106.1614M. doi:10.1073/pnas.0811699106. PMC 2635782. PMID 19164579.
- ^ Panachakel JT, Ramakrishnan AG (2021). "Decoding Covert Speech From EEG-A Comprehensive Review". Frontiers in Neuroscience. 15 642251. doi:10.3389/fnins.2021.642251. PMC 8116487. PMID 33994922.
- ^ a b c Rapp PE, Keyser DO, Albano A, Hernandez R, Gibson DB, Zambon RA, et al. (2015). "Traumatic brain injury detection using electrophysiological methods". Frontiers in Human Neuroscience. 9: 11. doi:10.3389/fnhum.2015.00011. PMC 4316720. PMID 25698950.
- ^ Franke LM, Walker WC, Hoke KW, Wares JR (August 2016). "Distinction in EEG slow oscillations between chronic mild traumatic brain injury and PTSD". International Journal of Psychophysiology. 106: 21–29. doi:10.1016/j.ijpsycho.2016.05.010. PMID 27238074.
- ^ a b "Study: EEG can help tell apart PTSD, mild traumatic brain injury". www.research.va.gov. Archived from the original on October 9, 2019. Retrieved October 9, 2019.
- ^ "Mind Games". The Economist. March 23, 2007. Archived from the original on December 12, 2009. Retrieved August 12, 2010.
- ^ a b c Li S (August 8, 2010). "Mind reading is on the market". Los Angeles Times. Archived from the original on January 4, 2013.
- ^ Fruhlinger J (October 9, 2008). "Brains-on with NeuroSky and Square Enix's Judecca mind-control game". Engadget. Archived from the original on October 30, 2010. Retrieved December 2, 2010.
- ^ "New games powered by brain waves". Physorg.com. Archived from the original on June 6, 2011. Retrieved December 2, 2010.
- ^ Snider M (January 7, 2009). "Toy trains 'Star Wars' fans to use The Force". USA Today. Archived from the original on October 23, 2012. Retrieved May 1, 2010.
- ^ "News – NeuroSky Upgrades SDK, Allows For Eye Blink, Brainwave-Powered Games". Gamasutra. June 30, 2010. Archived from the original on February 22, 2017. Retrieved December 2, 2010.
- ^ Fiolet E. "NeuroSky MindWave Brings Brain-Computer Interface to Education". www.ubergizmo.com. Ubergizmo. Archived from the original on December 12, 2017. Retrieved May 18, 2015.
- ^ "NeuroSky MindWave Sets Guinness World Record for "Largest Object Moved Using a Brain-Computer Interface"". NeuroGadget.com. NeuroGadget. Archived from the original on October 15, 2013. Retrieved June 2, 2011.
- ^ "Product Launch! Neurosync – The World's Smallest Brain-Computer-Interface". www.prnewswire.com. July 15, 2015. Archived from the original on December 9, 2018. Retrieved July 21, 2017.
- ^ "APP – Macrotellect". o.macrotellect.com. Archived from the original on January 23, 2017. Retrieved December 8, 2016.
- ^ "510(k) Premarket Notification". www.accessdata.fda.gov. Archived from the original on November 12, 2021. Retrieved November 12, 2021.
- ^ Bell J, ed. (January 8, 2021). "BioSerenity receives FDA clearance for EEG wearable device system". NeuroNews International. Archived from the original on November 12, 2021. Retrieved November 12, 2021.
- ^ Keiper A (2006). "The age of neuroelectronics". New Atlantis. 11. The New Atlantis: 4–41. PMID 16789311. Archived from the original on February 12, 2016.
- ^ Wan F, da Cruz JN, Nan W, Wong CM, Vai MI, Rosa A (June 2016). "Alpha neurofeedback training improves SSVEP-based BCI performance". Journal of Neural Engineering. 13 (3) 036019. Bibcode:2016JNEng..13c6019W. doi:10.1088/1741-2560/13/3/036019. PMID 27152666. S2CID 206099640.
- ^ "Mind over matter: Brain waves control Asimo". Japan Times. April 1, 2009. Archived from the original on April 3, 2009.
- ^ Natu N (July 21, 2008). "This brain test maps the truth". The Times of India. Archived from the original on July 18, 2012. Retrieved April 14, 2021.
- ^ Puranik DA, Joseph SK, Daundkar BB, Garad MV (November 2009). Brain Signature Profiling In India: Its Status As An Aid In Investigation And As Corroborative Evidence-As Seen From Judgments (PDF). Proceedings of XX All India Forensic Science Conference. pp. 815–822. Archived from the original (PDF) on March 3, 2016.
- ^ Gaudet LM (2011). "Brain Fingerprinting, Scientific Evidence, and "Daubert": A Cautionary Lesson from India". Jurimetrics. 51 (3): 293–318. ISSN 0897-1277. JSTOR 41307131.
- ^ Casson A, Yates D, Smith S, Duncan J, Rodriguez-Villegas E (2010). "Wearable electroencephalography. What is it, why is it needed, and what does it entail?". IEEE Engineering in Medicine and Biology Magazine. 29 (3): 44–56. Bibcode:2010IEMBM..29c..44C. doi:10.1109/MEMB.2010.936545. hdl:10044/1/5910. PMID 20659857. S2CID 1891995.
- ^ Looney D, Kidmose P, Park C, Ungstrup M, Rank M, Rosenkranz K, et al. (November 1, 2012). "The in-the-ear recording concept: user-centered and wearable brain monitoring". IEEE Pulse. 3 (6): 32–42. Bibcode:2012IPuls...3f..32L. doi:10.1109/MPUL.2012.2216717. PMID 23247157. S2CID 14103460.
- ^ Lotte F, Bougrain L, Cichocki A, Clerc M, Congedo M, Rakotomamonjy A, et al. (June 2018). "A review of classification algorithms for EEG-based brain-computer interfaces: a 10 year update". Journal of Neural Engineering. 15 (3): 031005. Bibcode:2018JNEng..15c1005L. doi:10.1088/1741-2552/aab2f2. PMID 29488902.
- ^ Shim M, Hwang HJ, Kim DW, Lee SH, Im CH (October 2016). "Machine-learning-based diagnosis of schizophrenia using combined sensor-level and source-level EEG features". Schizophrenia Research. 176 (2–3): 314–319. doi:10.1016/j.schres.2016.05.007. PMID 27427557. S2CID 44504680.
- ^ Buettner R, Frick J, Rieg T (November 12, 2019). "High-performance detection of epilepsy in seizure-free EEG recordings: A novel machine learning approach using very specific epileptic EEG sub-bands". ICIS 2019 Proceedings. Archived from the original on January 21, 2021. Retrieved January 13, 2021.
- ^ Ieracitano C, Mammone N, Hussain A, Morabito FC (March 2020). "A novel multi-modal machine learning based approach for automatic classification of EEG recordings in dementia". Neural Networks. 123: 176–190. doi:10.1016/j.neunet.2019.12.006. PMID 31884180. S2CID 209510497.
- ^ Bhattacharyya A, Pachori RB (September 2017). "A Multivariate Approach for Patient-Specific EEG Seizure Detection Using Empirical Wavelet Transform". IEEE Transactions on Bio-Medical Engineering. 64 (9): 2003–2015. Bibcode:2017ITBE...64.2003B. doi:10.1109/TBME.2017.2650259. PMID 28092514. S2CID 3522546.
- ^ Saab K, Dunnmon J, Ré C, Rubin D, Lee-Messer C (April 20, 2020). "Weak supervision as an efficient approach for automated seizure detection in electroencephalography". npj Digital Medicine. 3 (1) 59. doi:10.1038/s41746-020-0264-0. PMC 7170880. PMID 32352037.
- ^ Bomela W, Wang S, Chou CA, Li JS (May 2020). "Real-time Inference and Detection of Disruptive EEG Networks for Epileptic Seizures". Scientific Reports. 10 (1) 8653. Bibcode:2020NatSR..10.8653B. doi:10.1038/s41598-020-65401-6. PMC 7251100. PMID 32457378.
- ^ Paesschen WV (March 2018). "The future of seizure detection". The Lancet. Neurology. 17 (3): 200–202. doi:10.1016/S1474-4422(18)30034-6. PMID 29452676. S2CID 3376296.
- ^ Chen PC, Liu Y, Peng L (May 2019). "How to develop machine learning models for healthcare". Nature Materials. 18 (5): 410–414. Bibcode:2019NatMa..18..410C. doi:10.1038/s41563-019-0345-0. PMID 31000806. S2CID 122563425.
- ^ Rudin C (May 2019). "Stop Explaining Black Box Machine Learning Models for High Stakes Decisions and Use Interpretable Models Instead". Nature Machine Intelligence. 1 (5): 206–215. arXiv:1811.10154. doi:10.1038/s42256-019-0048-x. PMC 9122117. PMID 35603010.
- ^ Coenen A, Fine E, Zayachkivska O (2014). "Adolf Beck: a forgotten pioneer in electroencephalography". Journal of the History of the Neurosciences. 23 (3): 276–286. doi:10.1080/0964704x.2013.867600. PMID 24735457. S2CID 205664545.
- ^ Pravdich-Neminsky VV (1913). "Ein Versuch der Registrierung der elektrischen Gehirnerscheinungen". Zentralblatt für Physiologie. 27: 951–60.
- ^ Haas LF (January 2003). "Hans Berger (1873–1941), Richard Caton (1842–1926), and electroencephalography". Journal of Neurology, Neurosurgery, and Psychiatry. 74 (1): 9. doi:10.1136/jnnp.74.1.9. PMC 1738204. PMID 12486257.
- ^ Millet D (June 2002). The origins of EEG. 7th Annual Meeting of the International Society for the History of the Neurosciences (ISHN). Archived from the original on September 8, 2020. Retrieved November 27, 2010.
- ^ Gibbs FA, Davis H, Lennox WG (December 1935). "The Electro-Encephalogram in Epilepsy and in Conditions of Impaired Consciousness". Archives of Neurology and Psychiatry. 34 (6): 1133. doi:10.1001/archneurpsyc.1935.02250240002001.
- ^ "Beckman Instruments Supplying Medical Flight Monitoring Equipment" (PDF). Space News Roundup. March 3, 1965. pp. 4–5. Archived (PDF) from the original on August 7, 2019. Retrieved August 7, 2019.
- ^ Bozinovski S (2013). "Controlling Robots Using EEG Signals, Since 1988". In Markovski S, Gusev M (eds.). ICT Innovations 2012. Advances in Intelligent Systems and Computing. Vol. 207. Berlin, Heidelberg: Springer. pp. 1–11. doi:10.1007/978-3-642-37169-1_1. ISBN 978-3-642-37169-1.
Further reading
[edit]- Nunez PL, Srinivasan R (2007). "PDF". Scholarpedia. 2 (2): 1348. Bibcode:2007SchpJ...2.1348N. doi:10.4249/scholarpedia.1348.
- Arns M, Sterman MB (2019). Neurofeedback: How it all started. Nijmegen, The Netherlands: Brainclinics Insights. ISBN 978-90-830013-0-2.
External links
[edit]- "A tutorial on simulating and estimating EEG sources in Matlab". Archived from the original on March 7, 2016.
- "A tutorial on analysis of ongoing, evoked, and induced neuronal activity: Power spectra, wavelet analysis, and coherence". Archived from the original on November 7, 2018.
| International | |
|---|---|
| National | |
| Other | |
Electroencephalography
View on GrokipediaFundamentals
Definition and Principles
Electroencephalography (EEG) is a non-invasive technique for recording the spontaneous electrical activity of the brain through electrodes placed on the scalp. This method captures voltage fluctuations generated by the synchronous firing of millions of cortical pyramidal neurons, primarily in the superficial layers of the cerebral cortex.[1] The first human EEG recording was achieved by German psychiatrist Hans Berger in 1924, laying the foundation for this technology.[1] The biophysical basis of EEG relies on the generation of electrical dipoles from postsynaptic potentials in the dendrites of pyramidal neurons, which are oriented perpendicular to the cortical surface. These dipoles produce extracellular current flows that summate across neuronal populations, creating measurable voltage changes on the scalp via volume conduction through the brain tissues, cerebrospinal fluid, skull, and scalp.[4] EEG thus reflects the summed extracellular voltage fluctuations from these synchronized neuronal activities, rather than individual action potentials, which are too brief and localized to contribute significantly to scalp signals.[4] Key concepts in EEG include the categorization of signals into frequency bands, which correspond to different states of brain activity. These bands are defined as delta (0.5–4 Hz, associated with deep sleep), theta (4–8 Hz, linked to drowsiness and light sleep), alpha (8–13 Hz, prominent during relaxed wakefulness with eyes closed), beta (13–30 Hz, related to active thinking and alertness), and gamma (>30 Hz, involved in high-level cognitive processing).[5] Basic EEG instrumentation involves differential amplifiers to boost weak scalp signals (typically 1–100 μV) while rejecting common-mode noise, analog or digital filters to attenuate irrelevant frequencies (e.g., high-pass filters above 0.5 Hz and low-pass below 70 Hz), and analog-to-digital converters with sampling rates of 256–1024 Hz to comply with the Nyquist theorem, ensuring accurate capture of frequencies up to the brain's typical range without aliasing.[6]Historical Development
The discovery of electrical activity in the brain dates back to the late 19th century, when British physiologist Richard Caton conducted pioneering experiments on rabbits and monkeys in 1875, using a galvanometer to detect variations in electrical currents on the cerebral surface during sensory stimulation and visual evoked responses.[1] These findings, presented at a British Medical Association meeting, marked the first documented observation of brain electrical oscillations, though limited by the technology of the time which prevented waveform recording.[7] Building on this, Russian-Ukrainian physiologist Vladimir Pravdich-Neminsky achieved the first actual electroencephalogram (EEG) recording in 1912-1913, capturing brain potentials in dogs via a string galvanometer and even photographing an epileptic seizure in the cerebral cortex, thus providing the earliest visual evidence of EEG waveforms.[8] The transition to human EEG occurred in the 1920s through the work of German psychiatrist Hans Berger, who recorded the first human brain electrical signals on July 6, 1924, at the University of Jena using scalp electrodes and a galvanometer.[9] Berger's experiments from 1924 to 1929 revealed rhythmic oscillations, including the prominent 8-13 Hz alpha waves that attenuate with eye opening or mental effort, which he termed the "Elektrenkephalogramm des Menschen."[10] Initially met with widespread skepticism in the scientific community due to concerns over artifactual signals and Berger's non-engineering background, his findings gained validation through collaborations with British physiologist Edgar Adrian, who independently replicated the recordings in 1934, confirming their authenticity and spurring broader adoption.[11] Berger published his seminal paper in 1929, establishing EEG as a tool for studying brain function in humans.[12] In the mid-20th century, EEG advanced toward clinical standardization, with American neurologist Herbert H. Jasper developing the 10-20 electrode placement system in 1958, which uses proportional measurements from cranial landmarks to ensure consistent, reproducible electrode positioning across subjects of varying head sizes.[13] This international standard, adopted by the International Federation of Societies for Electroencephalography and Clinical Neurophysiology, facilitated comparative studies and remains foundational for routine EEG.[14] Concurrently, the introduction of digital EEG in the 1960s and 1970s shifted from analog ink-writing machines to computer-based acquisition, beginning with evoked potential recordings and enabling improved signal storage, amplification, and preliminary quantitative analysis.[15] The late 20th and early 21st centuries saw a profound shift to computerized EEG analysis in the 1990s, with the launch of first-generation commercial digital systems that supported automated artifact rejection, spectral analysis, and topographic mapping, enhancing diagnostic precision beyond visual inspection.[6] In the 2000s, the U.S. Food and Drug Administration (FDA) approved quantitative EEG (qEEG) devices, such as the NeuroGuide system, for specific post-hoc applications like adjunctive analysis in epilepsy monitoring and mild traumatic brain injury assessment, classifying them as Class II medical devices with cleared normative databases.[16] The 2010s marked milestones in portability, exemplified by the 2010 release of the Emotiv EPOC wireless headset, a low-cost, consumer-grade device with 14 channels that democratized EEG for research in brain-computer interfaces and ambulatory monitoring, amassing hundreds of studies worldwide.[17] Key figures shaped EEG's trajectory: Hans Berger's foundational human recordings established the technique's viability; Frederic Gibbs, alongside his wife Erna, pioneered clinical applications in the 1930s-1940s, identifying the 3 Hz spike-and-wave pattern in absence epilepsy and advocating EEG-guided surgical excisions for focal seizures, which influenced epilepsy management protocols.[18] Additionally, mathematician Ingrid Daubechies's development of compactly supported orthogonal wavelets in the 1980s provided essential tools for EEG signal processing, enabling efficient time-frequency decomposition for denoising and feature extraction in subsequent decades of analysis.[19] In 2024, the EEG community celebrated the 100th anniversary of Berger's first human recording with various events and publications highlighting its enduring significance.[20]Methods and Techniques
Recording Procedures
Prior to conducting an EEG recording, a thorough patient history is obtained, including details on seizures, medications, and relevant medical conditions, to identify indications and potential contraindications such as scalp infections that could preclude electrode placement.[21] Informed consent is secured from the patient or guardian, explaining the procedure's purpose, steps, and minimal risks.[22] The recording occurs in a quiet, dimly lit room to minimize environmental interference and promote patient relaxation.[23] The procedure begins with skin preparation, where the scalp is cleaned and abraded using a mild abrasive paste or gel to reduce impedance, particularly for wet electrode systems.[21] Electrodes are then applied to the scalp according to the 10-20 international system, ensuring secure attachment with conductive paste or gel.[23] Impedance is checked at each electrode site and must be below 5 kΩ (with 10 kΩ acceptable in some cases) to ensure signal quality; adjustments are made if thresholds are exceeded.[22] Baseline recordings follow, capturing 3-5 minutes each of eyes-closed and eyes-open states to evaluate resting rhythms, followed by activation techniques: hyperventilation for at least 3 minutes (15-30 breaths per minute) unless contraindicated, and intermittent photic stimulation using flashes from 1-60 Hz to provoke potential abnormalities.[21][22] A routine EEG typically lasts 20-60 minutes, including baseline and activation phases, with efforts to record during drowsiness or natural sleep for enhanced diagnostic yield.[23] Variations may involve partial sleep deprivation (e.g., 4-6 hours for adults) prior to the session to increase the likelihood of capturing epileptiform activity, or prolonged monitoring beyond 60 minutes in select cases.[22] EEG is a non-invasive procedure with rare risks, primarily limited to mild skin irritation or allergic reactions to electrode gel or paste, which can be mitigated through patch testing and hypoallergenic alternatives.[21] Contraindications for activations like hyperventilation include severe cardiopulmonary disease or recent stroke, requiring physician oversight and immediate cessation if distress occurs.[22] Continuous monitoring by a trained technologist ensures patient safety throughout.[23]Electrode Types and Placement
Electroencephalography relies on standardized electrode placement systems to ensure consistent and comparable recordings across studies and clinical settings. The International 10-20 system, developed in 1958, uses 21 electrodes positioned based on percentages of distances between cranial landmarks such as the nasion (bridge of the nose) and inion (occipital protuberance), as well as between the preauricular points over the ears.[14] This system divides the scalp into regions labeled with letters indicating lobes (F for frontal, C for central, P for parietal, O for occipital, T for temporal) and numbers denoting position (odd for left, even for right, z for midline).[24] Extensions like the 10-10 system refine this by incorporating 10% intervals, enabling up to 74 or more electrodes for higher spatial resolution in high-density EEG applications.[24] Wet electrodes, typically silver-silver chloride (Ag/AgCl) cups or discs filled with conductive gel or paste, remain the gold standard for EEG due to their low impedance (often below 5 kΩ), which minimizes noise and ensures stable signal quality.[21] The gel facilitates ionic conduction between the electrode and scalp, reducing motion artifacts and providing high-fidelity recordings essential for clinical diagnostics.[25] However, preparation requires skin abrasion and gel application, which can take 30-60 minutes and cause discomfort or allergic reactions in some subjects.[26] Dry electrodes eliminate the need for gels, offering faster setup (under 10 minutes) and suitability for long-term or ambulatory monitoring, though they often exhibit higher impedance (5-50 kΩ) that can introduce more noise unless mitigated by active amplification.[27] Common types include pin or multi-pin designs that penetrate hair without skin contact, bristle or brush arrays for conformal scalp fitting, and capacitive variants that detect electric fields non-contactually.[28] Recent post-2020 developments feature polymer-based electrodes with conductive nanomaterials for improved biocompatibility and signal stability, as well as spring-loaded mechanisms that maintain consistent pressure against the scalp in wearable devices; as of 2025, benchmarking studies have demonstrated dry-electrode EEG's potential for substantial improvements in clinical trials and neurofeedback applications when using device-specific protocols, alongside new guidelines for electrode tip geometry to enhance user comfort across varying head positions.[27][29][30][31] Electrode placement includes dedicated reference and ground sites to establish a baseline for differential amplification. Reference electrodes are commonly placed on the mastoid process (M1/M2) or earlobe (A1/A2), providing a neutral potential relative to active scalp sites.[32] Ground electrodes, often at Fz or Cz, shield against environmental interference.[21] Montages configure these for display: bipolar montages chain adjacent electrodes to highlight local gradients, referential montages compare each to a common reference for absolute potentials, and average reference montages sum all electrodes as the reference to approximate a zero-potential mean, enhancing detection of widespread activity.[33][34] High-density arrays with 128-256 channels, building on 10-10 positions, improve source localization by increasing spatial sampling to approximately 2 cm intervals across the scalp, enabling precise inverse modeling of subcortical generators.[35] These systems are particularly valuable in epilepsy for improving the identification of epileptic foci compared to standard 21-electrode setups.[36] During setup, interelectrode impedances are checked to remain below 10 kΩ for optimal signal integrity.[21]Signal Processing Basics
After recording, raw EEG signals undergo preprocessing to enhance signal quality and remove unwanted components. This typically begins with filtering to eliminate noise and drifts. A high-pass filter at 0.5 Hz is commonly applied to remove DC offsets and slow drifts from electrode movements or perspiration, while a low-pass filter at 70 Hz attenuates high-frequency noise from muscle activity or electrical interference.[37] Additionally, notch filters centered at 50 Hz or 60 Hz, depending on the regional power line frequency, are used to suppress line noise artifacts. These finite impulse response (FIR) or infinite impulse response (IIR) filters are selected for their linear phase characteristics to minimize distortion of the EEG's physiological content. Artifact rejection follows preprocessing to identify and exclude contaminated data segments. Threshold-based methods set amplitude limits, such as ±100 μV, to automatically reject epochs exceeding these values, which often indicate ocular or muscular artifacts.[38] For more sophisticated removal, independent component analysis (ICA) decomposes the multi-channel EEG into statistically independent components, allowing visual or automated identification and subtraction of artifactual sources without losing neural data.[39] ICA assumes that artifacts are non-Gaussian and independent from brain signals, enabling effective separation in datasets with up to 64 channels.[40] Feature extraction transforms preprocessed EEG into quantifiable metrics for analysis. In the time domain, simple statistics like mean amplitude and variance capture signal variability and power, useful for detecting event-related potentials.[41] Frequency-domain features employ the fast Fourier transform (FFT) to compute power spectral density, quantifying energy distribution across bands such as delta (0.5-4 Hz) or alpha (8-12 Hz).[42] For non-stationary signals, time-frequency methods like continuous wavelet transforms provide localized representations, revealing transient changes in frequency content over time, such as during cognitive tasks.[43] Quantitative EEG (qEEG) applies statistical norms to these features for clinical interpretation. Normative databases, compiled from healthy populations across ages and sexes, enable computation of z-scores, which standardize individual metrics (e.g., absolute power in theta band) relative to group means and standard deviations, highlighting deviations like elevated delta in dementia.[44] Connectivity measures assess inter-channel relationships; coherence quantifies linear phase consistency between signals at specific frequencies, indicating synchronized activity, while the phase-locking value (PLV) evaluates nonlinear phase synchronization, robust to amplitude variations and common in studying neural coupling during attention.[45][46] Open-source software facilitates these processing steps. EEGLAB, a MATLAB-based toolbox, offers an interactive graphical interface for filtering, ICA-based artifact correction, and feature extraction via plugins, supporting single-trial analysis and visualization.[47] MNE-Python, a Python library, provides modular functions for advanced preprocessing, FFT/wavelet-based features, and connectivity computations like PLV, integrating seamlessly with machine learning ecosystems for reproducible pipelines.[48]EEG Signal Patterns
Normal Activity
In healthy individuals, the electroencephalogram (EEG) exhibits characteristic rhythms that reflect synchronized neuronal activity across different states of consciousness. These rhythms are typically categorized by their frequency bands and vary with wakefulness, sleep, and cognitive engagement, providing benchmarks for normal brain function.[49] The alpha rhythm, a hallmark of relaxed wakefulness, consists of sinusoidal waves oscillating at 8-13 Hz with amplitudes ranging from 20-100 µV, predominantly observed in the posterior (occipital) regions. It attenuates or desynchronizes with eye opening, attention, or mental activity, giving way to faster frequencies.[49][50] Other prominent rhythms include theta waves (4-8 Hz), which appear during drowsiness or in children and are often frontocentral; delta waves (0.5-4 Hz), dominant in deep non-REM sleep (N3 stage) with high amplitudes over 75 µV; beta waves (13-30 Hz, low amplitude 10-20 µV), associated with alertness and active thinking, primarily frontal and central; and gamma waves (30-80 Hz), linked to cognitive processing and sensory integration, distributed widely including in visual and premotor areas.[50][49] EEG patterns shift markedly with behavioral states. During wakefulness, a mix of alpha (posterior) and beta (anterior) rhythms predominates in relaxed adults with eyes closed, transitioning to low-amplitude mixed frequencies upon arousal. In sleep, stage N1 features theta activity (4-7 Hz) and vertex waves; N2 includes sleep spindles (12-16 Hz bursts, frontocentral) and K-complexes (high-amplitude biphasic waves); N3 shows slow-wave delta (>20% of record); and REM sleep displays desynchronized low-voltage activity with theta, sawtooth waves (2-6 Hz, triangular), and rapid eye movements.[51][49][52] Age-related variations influence these rhythms, with infants showing higher theta and delta frequencies (e.g., alpha-like activity as low as 5-6 Hz at 6 months) alongside discontinuous patterns, maturing to more continuous adult-like alpha (8-10 Hz) by adolescence around 10-18 years.[53][54] Spatially, alpha is posterior-dominant, while theta can increase frontally during meditation or relaxation practices in adults.[55][49]Abnormal Activity
Abnormal EEG activity encompasses deviations from typical brain wave patterns, such as the posterior dominant alpha rhythm observed in relaxed wakefulness, manifesting as irregular frequencies, amplitudes, or morphologies that signal underlying neurological or psychiatric dysfunction.[56] Epileptiform discharges represent hallmark interictal abnormalities in epilepsy, characterized by transient, high-amplitude events including spikes and sharp waves. Spikes are brief potentials lasting less than 70 milliseconds with amplitudes exceeding 50 microvolts, often arising from focal epileptic zones, while sharp waves extend to 200 milliseconds and indicate similar hyperexcitable cortical regions.[57] These discharges can generalize or remain focal, disrupting normal background rhythms and predisposing to seizures. Spike-and-wave complexes, a specific generalized form, feature a spike followed by a slow wave, with the classic 3 Hz bilaterally synchronous pattern serving as the primary electrographic marker for childhood absence epilepsy during absence seizures.[58] In encephalopathies, EEG often reveals diffuse slowing of background activity, shifting from predominant alpha and beta frequencies to excessive theta (4-8 Hz) and delta (0.5-4 Hz) waves, reflecting widespread cortical dysfunction due to metabolic disturbances like uremia or electrolyte imbalances.[59] This generalized slowing correlates with the severity of encephalopathy, progressing from intermittent theta bursts to continuous delta dominance in advanced stages. Triphasic waves, a distinctive pattern in hepatic encephalopathy, consist of high-amplitude, symmetric waves with a triphasic morphology—positive, negative, positive—typically occurring at 1-2 Hz and superimposed on slowed backgrounds, aiding in the diagnosis of liver-related cerebral toxicity.[60] Focal abnormalities on EEG include asymmetric slowing or amplitude asymmetries, where one hemisphere shows reduced faster frequencies and increased slow waves compared to the contralateral side, indicating localized structural damage. In acute ischemic stroke, such focal delta slowing emerges over the infarcted region within hours, reflecting neuronal dysfunction and edema without epileptiform features in most cases.[56] Similarly, traumatic brain injury often produces unilateral or bilateral focal slowing, with asymmetries in theta or delta activity over contused areas, persisting as a marker of injury severity and correlating with cognitive deficits.[61] In psychiatric disorders, EEG patterns show subtler asymmetries or spectral shifts. Depression is associated with reduced frontal alpha asymmetry, characterized by greater relative right frontal alpha power (indicating left hypoactivity), a stable trait marker observed at rest and linked to negative affect and withdrawal behaviors.[62] Schizophrenia, conversely, features increased delta activity, particularly in frontal regions, suggesting impaired arousal regulation and cortical inhibition, with elevated low-frequency power distinguishing affected individuals from controls during resting states.[63] For prognostic evaluation in comatose patients, burst-suppression patterns—alternating bursts of mixed-frequency activity and voltage-suppressed intervals—strongly predict poor neurological outcomes, especially in postanoxic coma following cardiac arrest, with absence of reactivity further confirming dismal recovery prospects when observed within 24-72 hours.[64] This pattern reflects profound cortical suppression, guiding decisions on life-sustaining therapies with high specificity for unfavorable recovery.[65]Artifacts and Mitigation
Physiological Artifacts
Physiological artifacts in electroencephalography (EEG) recordings originate from biological processes outside the brain, such as movements of the eyes, muscles, heart, and other bodily functions, which generate electrical potentials that contaminate the neural signals. These artifacts can mimic or obscure genuine brain activity due to their overlapping frequency ranges and high amplitudes, but they are distinguished by their synchronization with corresponding physiological events, such as eye blinks or cardiac cycles.[66][67] Ocular artifacts arise primarily from the corneo-retinal dipole, where the cornea is positively charged relative to the retina, producing deflections during eye movements. Eye blinks generate prominent, high-amplitude potentials reaching 100-200 µV, with low-frequency content below 5 Hz and durations of 0.2-0.4 seconds, most visible in frontal leads like Fp1 and Fp2 as symmetric downward deflections. Lateral eye gaze elicits spike-like discharges in frontopolar derivations, correlating directly with the direction and timing of eye movement. These artifacts propagate across the scalp and are identifiable by their temporal alignment with observed blinks or gazes.[68][69][66] Muscle artifacts, known as electromyographic (EMG) activity, stem from contractions in facial, neck, or scalp muscles, producing high-frequency noise that often exceeds 20 Hz and can extend to 100 Hz. Jaw clenching or neck tension generates irregular, spiky waveforms of varying amplitude, typically higher than background EEG, which can obscure delta and theta bands due to low-frequency components from sustained tension. Swallowing introduces brief low-frequency bursts from pharyngeal muscle activity. These are differentiated by their irregular, broadband spectral content and association with visible muscle movements, such as chewing or frowning.[70][71][67] Cardiac artifacts result from the heart's electrical activity, manifesting as rhythmic pulses at the heart rate frequency, approximately 1 Hz for a typical 60 beats per minute. These appear as slow waves or sharp deflections synchronized with the QRS complex of the electrocardiogram (ECG), particularly prominent in mastoid or temporal references due to proximity to major arteries. Pulse-related variants follow shortly after the QRS, creating periodic undulations that mimic delta activity but are confirmed by their exact timing with cardiac cycles.[72][66][67] Sweat artifacts occur due to perspiration altering electrode-skin impedance through sodium chloride and lactic acid, leading to slow DC shifts or irregular low-frequency waves below 1 Hz. These baseline fluctuations, often diffuse across the scalp, correlate with increased sweating from heat, anxiety, or physical exertion, and can be distinguished by their gradual, undulating nature unrelated to neural rhythms.[66][73][71] Respiration artifacts arise from chest and abdominal movements during breathing, producing slow rhythmic waves at 0.2-0.3 Hz that may appear as subtle modulations in EEG amplitude. These are most evident in frontal or mastoid channels and synchronize with inhalation and exhalation cycles, potentially amplified by electrode movement from thoracic expansion. Glossokinetic artifacts, generated by tongue or mouth movements, create reproducible delta-range potentials (1-4 Hz) due to the tongue acting as a dipole, with greater amplitude inferiorly and attenuation toward occipital leads; they are evoked by actions like repeating "la-la" and align precisely with speech or swallowing events.[66][72][67]Environmental and Technical Artifacts
Environmental and technical artifacts in electroencephalography (EEG) arise from external sources and equipment-related issues, contaminating the recorded signals with non-cerebral electrical activity that can obscure brain-derived patterns. These artifacts differ from physiological ones, such as those from eye blinks or muscle contractions, by originating outside the body. They are particularly prevalent in non-ideal recording environments and can mimic pathological waveforms if not addressed during setup. Electrical interference, often manifesting as 50/60 Hz line noise depending on regional power grid frequencies, is a primary environmental artifact caused by electromagnetic coupling from power lines, poor grounding, or nearby electrical devices. This noise appears as rhythmic oscillations superimposed on the EEG trace, potentially amplifying through unbalanced electrode impedances. Loose electrode connections exacerbate this issue by introducing 60 Hz harmonics, where intermittent contact creates unstable pathways for interference pickup.[74][75][76] Movement-related technical artifacts include electrode pops, which are sharp, transient spikes resulting from sudden impedance changes due to electrode displacement or poor scalp contact, often simulating epileptiform discharges. Cable sway introduces low-frequency drifts and broadband noise as leads move, forming inductive loops that pick up ambient electromagnetic fields; this is especially disruptive in setups with long or unbundled wires.[72][77] Additional environmental sources encompass photic flicker from flickering room lights, inducing unintended rhythmic potentials at the light's frequency, and low-level hum from HVAC systems or ventilation, which contributes mechanical vibrations and electrical noise. Electromagnetic fields from mobile phones or wireless devices can also induce transient bursts, coupling directly into the recording chain via unshielded components.[78][79] Technical flaws like amplifier saturation occur when input signals exceed the device's dynamic range, causing clipping and flatlining of traces that render data unusable for short periods; this is common with high-amplitude interference or faulty gain settings. Prevention strategies emphasize proper setup: conducting recordings in electrically shielded rooms to block external fields, using twisted cable pairs to minimize loop areas and inductive pickup, ensuring low electrode impedances through skin preparation, and verifying grounding to suppress line noise propagation.[80][81][82]Detection and Removal Methods
Manual detection of artifacts in EEG signals primarily involves visual inspection by trained experts, who identify characteristic patterns such as the slow, high-amplitude deflections of eye blinks or the rhythmic spikes of cardiac activity.[83] This approach, while reliable for small datasets, is labor-intensive and prone to inter-rater variability, often requiring multiple reviewers for consensus.[84] Automated methods offer scalable alternatives for artifact detection and removal. Thresholding techniques detect outliers based on predefined criteria, such as amplitudes exceeding 100 µV or frequencies outside the typical EEG range (0.5–40 Hz), enabling straightforward rejection of contaminated epochs.[83] Independent Component Analysis (ICA) decomposes the EEG into statistically independent components, allowing identification and subtraction of artifactual sources like ocular or muscular activity without dedicated reference channels; a seminal application demonstrated its efficacy in separating diverse artifacts from neural signals.[85] Regression methods, conversely, estimate and subtract artifact contributions using simultaneous recordings from reference channels, such as electrooculogram (EOG) for eye movements or electrocardiogram (ECG) for cardiac interference, though they assume linear relationships that may not hold for nonlinear artifacts.[83] Advanced techniques leverage machine learning and signal decomposition for more precise handling. Support Vector Machines (SVMs) classify ICA-derived components as artifactual based on features like topography or spectral power, achieving high accuracy (e.g., up to 98% for motion artifacts) in supervised settings.[86] Wavelet thresholding applies multiresolution analysis to suppress noise across scales, effectively removing transient artifacts like muscle bursts by adaptively setting coefficients below a threshold to zero, with studies showing improved signal fidelity compared to simple filtering.[82] Recent deep learning approaches, including convolutional neural networks (CNNs) combined with long short-term memory (LSTM) networks (e.g., DuoCL), and deep autoencoders, have demonstrated superior performance in detecting and removing complex artifacts, such as motion and physiological noise, with high accuracy in real-time and large-scale EEG data processing as of 2025.[87] Post-removal validation ensures artifact mitigation does not distort underlying neural activity. Common metrics include signal-to-noise ratio (SNR) improvements, where effective methods can boost SNR by over 6 dB, and assessments of topographic consistency to verify preserved spatial patterns across electrodes.[84] These checks often involve re-running spectral or event-related potential analyses to confirm enhanced data quality. Software tools facilitate these processes, with EEGLAB providing plugins for ICA decomposition, automated component classification (e.g., ICLabel), and rejection pipelines, widely adopted for their integration of manual and automated workflows.[88]Clinical Applications
Epilepsy and Seizure Monitoring
Electroencephalography (EEG) plays a central role in the diagnosis and management of epilepsy by identifying interictal epileptiform discharges (IEDs), which are transient abnormal electrical activities occurring between seizures. These discharges, such as spikes in temporal lobe epilepsy, aid in classifying epilepsy syndromes by localizing the epileptogenic zone and distinguishing focal from generalized forms. For instance, frequent interictal spikes during non-rapid eye movement sleep on scalp EEG can correlate weakly with higher monthly seizure frequency in drug-resistant temporal lobe epilepsy, supporting syndrome-specific diagnosis without strong ties to disease duration or MRI findings.[89] Abnormal spike-wave patterns, like those seen in certain focal epilepsies, may briefly reference interictal abnormalities but require correlation with clinical history for accurate classification.[90] Ictal EEG recordings capture the onset and evolution of seizures, essential for precise diagnosis and localization. Seizure onset often manifests as rhythmic theta or delta activity, typically building from low-amplitude fast rhythms (5-9 Hz in mesial temporal lobe epilepsy) that evolve into higher-frequency patterns or spread to adjacent regions.[91] Video-EEG monitoring integrates these electrophysiological changes with behavioral semiology, allowing correlation between ictal EEG patterns—such as temporal intermittent rhythmic delta or theta activity—and clinical symptoms like automatisms or altered awareness, thereby confirming seizure type and origin.[91][92] In epilepsy monitoring units (EMUs), standardized protocols facilitate comprehensive seizure capture through long-term video-EEG, often involving gradual withdrawal of antiseizure medications to provoke events. Tapering is individualized, with reductions typically starting prior to or upon admission, such as 50% daily dose decreases, to minimize risks while enabling ictal recordings over several days.[93][94] Monitoring durations commonly range from 3 to 7 days, adjusted based on seizure frequency and safety, under continuous supervision to handle potential complications like status epilepticus.[95][96] The prognostic value of EEG in epilepsy extends to surgical planning, where ictal patterns help delineate resection zones for optimal outcomes. Mesial temporal patterns, characterized by ≥5 Hz discharges at onset, strongly predict seizure freedom after temporal lobectomy in hippocampal sclerosis cases, with 82.7% of such patients achieving freedom compared to 28.6% with lateral or mixed (<5 Hz) patterns.[97] Ictal source imaging from EEG identifies the seizure onset zone more accurately than visual interpretation alone, guiding precise resection while preserving eloquent areas.[98] Long-term outcomes post-surgery correlate closely with preoperative and postoperative EEG findings, influencing seizure freedom rates. Quantitative analysis of normal scalp EEG, focusing on interhemispheric coherence in the 10-25 Hz range, predicts 1-year seizure freedom after anterior temporal lobectomy with 76-78% accuracy, outperforming MRI in some cohorts.[99] Postoperative persistence of interictal discharges indicates higher risk of seizure recurrence, with their absence linked to sustained freedom in up to 80% of temporal lobe epilepsy patients over 10 years.[100] Scalp ripples on spikes serve as noninvasive biomarkers, where resecting their generators yields favorable outcomes in focal epilepsies.[101]Other Brain Disorders
Electroencephalography (EEG) is instrumental in evaluating sleep disorders through its integration into polysomnography (PSG), a comprehensive sleep study that records brain waves alongside other physiological signals to diagnose conditions such as obstructive sleep apnea and idiopathic hypersomnia. In PSG, EEG facilitates the scoring of sleep stages—wakefulness, non-rapid eye movement (NREM) stages N1, N2, and N3, and rapid eye movement (REM)—by identifying characteristic rhythms like alpha waves (8–13 Hz) during wakefulness, theta waves (4–8 Hz) in light N1 sleep, sleep spindles and K-complexes in N2, slow delta waves (<4 Hz) in deep N3, and sawtooth theta in REM. This staging is essential for quantifying sleep fragmentation in apnea, where frequent arousals disrupt continuity, and for assessing excessive sleepiness in hypersomnia, often revealing prolonged N3 or altered slow-wave activity; automated EEG-based classifiers achieve high agreement (Cohen's kappa ≈0.8) with manual scoring per American Academy of Sleep Medicine guidelines, enabling reliable diagnosis even in single-channel setups.[102] In brain tumors, EEG often reveals focal slowing of background rhythms or epileptiform discharges overlying the lesion site, aiding in localization and assessment of functional impact, particularly in gliomas or meningiomas that infiltrate cortical areas; these patterns correlate with tumor grade and guide preoperative planning or monitor post-surgical changes.[103] For strokes, EEG detects hemispheric asymmetries such as delta slowing in ischemic regions, which can predict recovery or ongoing ischemia, and is used for prognostication in acute settings; as of 2025, bibliometric analyses indicate EEG's evolution into a therapeutic support tool, including neurofeedback for rehabilitation in post-stroke motor deficits.[104][105] In dementias, particularly Alzheimer's disease (AD), quantitative EEG (qEEG) reveals characteristic slowing of brain rhythms, marked by increased power in delta (0.5–4 Hz) and theta (4–8 Hz) bands alongside reductions in alpha (8–13 Hz) and beta (13–30 Hz) activity, reflecting underlying neuronal dysfunction and progression from mild cognitive impairment to advanced stages. This spectral shift correlates with cognitive decline, as measured by tools like the Mini-Mental State Examination, and is linked to decreased cerebral metabolism and blood flow in temporoparietal regions; early AD shows slowed posterior alpha peaks and widespread delta/theta source increases, serving as a non-invasive biomarker for monitoring disease severity and treatment response. Longitudinal studies confirm that theta/delta power elevations predict faster cognitive worsening, distinguishing AD from normal aging.[106] For movement disorders like Parkinson's disease (PD), EEG analysis of beta oscillations (13–30 Hz) provides insights into tremor pathophysiology, with exaggerated synchronized beta activity in the corticobasal ganglia circuits observed during rest and correlating with bradykinesia and rigidity. In PD patients, beta bursts in the subthalamic nucleus are prominent in tremor-dominant cases, originating potentially from dopamine-depleted striatum imbalances, and desynchronize with voluntary movement or dopaminergic therapy, improving motor function; deep brain stimulation targeting these oscillations reduces tremor amplitude by up to 50% in responsive patients, highlighting beta power as a dynamic marker for symptom monitoring and therapeutic optimization.[107] In psychiatric conditions such as schizophrenia, event-related potentials (ERPs) derived from EEG, particularly the P300 component, exhibit delayed latencies (typically 300–400 ms post-stimulus) during oddball paradigms, indicating impaired attention and cognitive processing. This prolongation, first noted in the 1970s, worsens with illness duration and is accompanied by reduced P300 amplitude, reflecting deficits in neural synchrony within delta/theta bands; meta-analyses across decades confirm consistent latency delays in chronic and first-episode patients, positioning P300 as an endophenotype for risk assessment and tracking antipsychotic efficacy.[108] Traumatic brain injury (TBI) severity is graded using EEG patterns like alpha coma, characterized by persistent, unreactive alpha-frequency (8–13 Hz) activity in comatose patients, signaling diffuse cortical damage and poor prognosis. In moderate-to-severe TBI, alpha coma often emerges subacutely, with anterior or posterior accentuation and lack of response to stimuli, predicting mortality or persistent vegetative states in over 80% of cases; combined with burst suppression or electrocerebral silence, it outperforms initial Glasgow Coma Scale scores for outcome forecasting at 3–6 months post-injury.[61]Critical Care and Ambulatory Use
In intensive care units (ICUs), continuous electroencephalography (cEEG) plays a pivotal role in detecting non-convulsive status epilepticus (NCSE), a condition characterized by prolonged seizure activity without overt motor manifestations that affects up to 34% of patients with unexplained altered mental status.[109] This monitoring is essential for patients post-cardiac arrest, with traumatic brain injury, or those with subarachnoid hemorrhage, where NCSE contributes to secondary brain injury if untreated.[109] By capturing subtle electrographic patterns such as periodic discharges or rhythmic delta activity over extended periods, cEEG enables early intervention with antiseizure medications like levetiracetam or fosphenytoin, potentially mitigating neuronal damage.[109] For brain death confirmation, EEG demonstrates electrocerebral silence (isoelectric EEG, <2 μV amplitude) after excluding reversible confounders like hypothermia or drug effects, serving as a confirmatory test alongside clinical criteria in many protocols.[110] Quantitative EEG tools, including compressed spectral arrays (CSA), facilitate trend monitoring in the ICU by transforming raw EEG data into color-coded spectrograms that display frequency power over time, allowing clinicians to identify evolving seizure patterns or sedation levels without constant review of full waveforms.[111] CSA exhibits high sensitivity (approximately 89%) for detecting seizures in large datasets, making it particularly valuable for non-experts in resource-limited settings, where it highlights "flame-shaped" increases in spectral power indicative of ictal activity.[111] For prognostication in comatose ICU patients, EEG reactivity assessment—evaluating changes in brain activity in response to stimuli like auditory clicks or painful maneuvers—serves as a reliable early predictor of neurological recovery, with absent reactivity showing 82% specificity for poor outcomes (Cerebral Performance Category 3-5) after cardiac arrest.[112] Similarly, the burst suppression ratio, which quantifies the proportion of time the EEG exhibits low-voltage suppression versus burst activity, correlates with prognosis; ratios exceeding 50% suppression often indicate severe hypoxic-ischemic injury and unfavorable recovery in postanoxic coma.[65] Ambulatory EEG extends monitoring beyond the hospital, typically capturing 24- to 72-hour recordings at home to diagnose elusive seizures or nocturnal events not reproducible in clinical settings, with yields of 13-43% for identifying electrographic seizures or interictal epileptiform discharges in suspected epilepsy cases.[113] Patients activate event markers to correlate symptoms like suspected seizures or sleep disturbances with EEG tracings, aiding differentiation of epileptic from non-epileptic paroxysmal events, particularly in those with infrequent spells.[113] Challenges in ambulatory EEG include managing patient mobility, which introduces motion artifacts that degrade signal quality, often necessitating reduced electrode counts of 8-32 channels to prioritize comfort and portability over full scalp coverage.[114] These systems use lightweight, battery-powered setups with at least 16 channels recommended for adequate spatial resolution, but environmental noise and limited video integration can complicate interpretation during daily activities.[114] Implementation of cEEG in the ICU has been associated with improved outcomes through early NCSE detection and treatment, including reduced ICU length of stay by facilitating timely de-escalation of care and lower mortality rates compared to routine intermittent EEG.[115] For instance, studies report shorter mechanical ventilation durations and hospital stays when cEEG guides interventions, emphasizing its role in optimizing resource use and patient recovery.[115]Research Applications
Cognitive Neuroscience
Electroencephalography (EEG) has been instrumental in cognitive neuroscience for mapping brain activity during tasks involving attention, memory, and perception, offering high temporal resolution to capture dynamic neural processes on the millisecond scale. By averaging EEG signals time-locked to stimuli or events, researchers derive event-related potentials (ERPs) that reflect stages of cognitive processing, while time-frequency analyses reveal oscillatory changes underlying cognitive functions. These methods enable dissection of how neural ensembles coordinate to support complex behaviors, such as decision-making and information integration, without relying on invasive techniques. Event-related potentials, particularly the P300 component, provide insights into attentional and decisional processes. In the oddball paradigm, where infrequent target stimuli are presented amid frequent standards, the P300 emerges as a positive deflection peaking around 300 ms post-stimulus over centro-parietal scalp sites, indexing context updating and resource allocation for novel or task-relevant events.[116] This component's amplitude scales with stimulus probability and task relevance, decreasing under divided attention, which underscores its role in selective processing. Similarly, the mismatch negativity (MMN), a negative deflection occurring 100-250 ms after a deviant auditory stimulus in a sequence of standards, reflects pre-attentive detection of irregularities, generated in superior temporal gyrus sources and robust even without focused attention.[117] Oscillatory dynamics captured via EEG further elucidate cognitive mechanisms, with specific frequency bands modulating during task engagement. Theta-band oscillations (4-8 Hz) enhance during memory encoding, particularly in hippocampal-prefrontal networks, where increased theta power correlates with successful item recognition in associative tasks, facilitating the temporal organization of sequential information.[118] In contrast, gamma-band activity (30-100 Hz) supports perceptual binding, synchronizing distributed neural populations to integrate features like color and motion into coherent objects, as evidenced by elevated gamma power during illusory contour perception.[119] Cross-frequency interactions, such as phase-amplitude coupling (PAC), reveal how low-frequency phases modulate high-frequency amplitudes to orchestrate working memory. In multi-item working memory tasks, theta-gamma PAC in the hippocampus coordinates the maintenance of sequential items, with theta phase predicting gamma bursts that encode individual elements, thereby enabling capacity-limited storage.[120] Paradigms like the n-back task, where participants monitor stimuli n-items back in a stream, leverage time-frequency analysis to show load-dependent increases in theta power during retention and frontal gamma during updating, highlighting oscillatory signatures of executive control.[121][122] Hemispheric asymmetries in EEG further illuminate specialized processing, notably in language comprehension. During semantic processing of spoken words, left-hemisphere dominance manifests as greater alpha power suppression in temporal regions, reflecting heightened activation for phonological and syntactic integration, while the right hemisphere shows relative desynchronization for prosodic elements.[123] These patterns, observed across bilingual and clinical populations, underscore EEG's utility in probing lateralized cognitive architectures.Brain-Computer Interfaces
Electroencephalography-based brain-computer interfaces (EEG-BCIs) enable direct communication between the brain and external devices by detecting and interpreting neural activity patterns recorded from scalp electrodes. These systems translate EEG signals into commands for controlling computers, prosthetics, or other assistive technologies, particularly benefiting individuals with severe motor impairments. Unlike traditional input methods, EEG-BCIs rely on voluntary modulation of brain signals, such as event-related potentials or oscillatory changes, to achieve non-muscular interaction.[124] Key paradigms in EEG-BCIs include steady-state visual evoked potentials (SSVEP), P300 spellers, and motor imagery. In SSVEP-based systems, users focus on flickering visual stimuli at specific frequencies, eliciting steady oscillatory responses in the visual cortex that can be detected in EEG for target selection. The P300 speller paradigm presents a matrix of characters flashing randomly, where attention to a target elicits a P300 event-related potential, allowing spelling through gaze-independent selection. Motor imagery involves imagining limb movements, which induces event-related desynchronization in mu (8-12 Hz) and beta (18-30 Hz) rhythms over sensorimotor areas, enabling control without physical action. These paradigms are often combined in hybrid systems to enhance robustness and speed.[125] Applications of EEG-BCIs focus on assistive technologies and therapeutic interventions. For locked-in patients, such as those with amyotrophic lateral sclerosis, P300 spellers and motor imagery enable typing by imagined movements, facilitating communication at rates sufficient for daily needs.[124] Neurofeedback using EEG-BCIs trains individuals with attention-deficit/hyperactivity disorder (ADHD) to self-regulate brain activity, such as decreasing theta/beta ratios, leading to improved attention and reduced symptoms in clinical settings, although meta-analyses indicate mixed results on its superiority over placebo.[126][127] Signal decoding in EEG-BCIs involves feature extraction and classification to interpret user intent. Common spatial patterns (CSP) is a widely used method for extracting discriminant spatial filters from multi-channel EEG, particularly effective for motor imagery by maximizing variance differences between classes. Extracted features are then classified using linear discriminant analysis (LDA) or support vector machines (SVM), which provide robust binary or multi-class decisions with low computational overhead. These techniques achieve reliable decoding by accounting for inter-subject variability in EEG patterns.[128][129][130] Recent medical applications from 2023 to 2025 highlight EEG-BCIs in rehabilitation and mental health. In stroke recovery, motor imagery BCIs paired with functional electrical stimulation promote neuroplasticity, improving upper limb function with significant gains in motor scores over traditional therapy.[131] For mental health, EEG-based emotion recognition BCIs detect affective states through valence-arousal models, aiding real-time interventions for conditions like depression by classifying emotions with spectral features.[132] Performance in EEG-BCIs is evaluated by classification accuracy and information transfer rate (ITR). Accuracies often exceed 70% in controlled settings for binary tasks like motor imagery, with multi-class paradigms reaching 80-90% using CSP and LDA/SVM. ITR, measuring effective bits per minute, typically ranges from 20-50 bits/min for P300 spellers and SSVEP systems, balancing speed and reliability for practical use.[133][134]Multimodal Integration
Multimodal integration in electroencephalography (EEG) involves combining EEG signals with other neuroimaging modalities to leverage complementary strengths, such as EEG's high temporal resolution with the superior spatial resolution of techniques like functional magnetic resonance imaging (fMRI), magnetoencephalography (MEG), near-infrared spectroscopy (NIRS), and functional ultrasound (fUS). This approach enhances the understanding of brain function by correlating electrophysiological activity with hemodynamic or magnetic responses, enabling more precise source localization and functional mapping.[135] Simultaneous EEG-fMRI recording allows for the direct correlation of EEG-derived electrophysiological patterns with blood-oxygen-level-dependent (BOLD) signals, providing insights into neurovascular coupling during cognitive tasks. This method addresses challenges such as MRI-induced gradient artifacts, which distort EEG signals through rapid magnetic field changes, and motion artifacts from cardiac pulsation or scanner vibrations, often mitigated via adaptive noise cancellation and reference layer techniques. Seminal studies have demonstrated negative correlations between alpha-band EEG power and BOLD signals in visual and sensorimotor cortices, highlighting the technique's utility in mapping resting-state networks.[135][136][137] Combining EEG and MEG improves source localization by integrating EEG's sensitivity to radial dipoles with MEG's strength in detecting tangential dipoles, reducing ambiguity in inverse problems. Algorithms like simulated annealing combined with quasi-Newton optimization on simultaneous MEG-EEG data from brain phantoms have shown localization errors reduced to under 5 mm for mixed dipole orientations, outperforming single-modality approaches. A novel integrated analysis method further enables accurate estimation of both radial and tangential source components by jointly inverting electric and magnetic fields, achieving up to 20% better localization accuracy in simulations of cortical sources.[138][139][140] Portable hybrid systems integrating EEG with NIRS or fUS facilitate non-invasive monitoring of oxygenation-hemodynamic coupling in naturalistic cognitive settings, such as during motor imagery or attention tasks. EEG-NIRS hybrids exploit neurovascular coupling to link electrical activity with cerebral blood flow changes measured via oxy-hemoglobin concentrations, with simultaneous recordings improving classification accuracy of brain states to over 90% in brain-computer interface applications. Emerging EEG-fUS combinations offer high spatiotemporal resolution for hemodynamic imaging in mobile scenarios, though clinical adoption remains limited; these systems enhance detection of cognition-related responses in prefrontal areas by correlating EEG event-related potentials with ultrasound-derived blood volume changes.[141][142][143] Data fusion methods, such as fMRI-informed EEG source estimation, refine localization by constraining EEG inverse solutions with fMRI-derived priors. The fMRI-Informed Regional Estimation (FIRE) technique uses BOLD activation maps to guide regional EEG source reconstruction, reducing localization errors by 30-50% in auditory and visual paradigms compared to standalone EEG. Similarly, low-resolution electromagnetic tomography (LORETA) informed by fMRI incorporates hemodynamic constraints into distributed source models, improving estimation of event-related potentials (ERPs) in multimodal setups analyzed via tools like SPM12. Multimodal ERPs further integrate time-locked EEG responses with fMRI or NIRS data to dissect sensory processing stages.[144][145][146] These integrations overcome EEG's inherent poor spatial localization by providing anatomical and functional anchors from complementary modalities, leading to applications in epilepsy surgery planning where fused EEG-fMRI or EEG-MEG data identify epileptogenic zones with 15-25% higher concordance to resection outcomes than unimodal EEG. In presurgical evaluations, multimodal approaches enhance prediction of seizure freedom post-resection, guiding precise electrode placements and minimizing invasive risks.[147][148][149]Limitations and Comparisons
Inherent Limitations
Electroencephalography (EEG) suffers from limited spatial resolution primarily due to volume conduction, where electrical currents from neural sources spread through the conductive tissues of the head, blurring the signals recorded at the scalp and resulting in a resolution of approximately 5 to 9 cm.[150] This blurring makes it difficult to precisely localize sources, particularly those that are tangentially oriented or distributed over larger areas.[151] Furthermore, EEG is inherently insensitive to deep brain structures, such as subcortical regions, because signals from these sources attenuate rapidly with distance from the scalp electrodes, often falling below detectable levels.[152] The technique's sensitivity is confined to superficial cortical layers, typically within 2 to 3 cm of the scalp surface, where neural activity generates measurable potentials.[151] Deeper or weaker neural activities produce signals with low signal-to-noise ratios, as the faint potentials are overshadowed by ongoing background brain activity and physiological noise, complicating their reliable detection without extensive averaging or enhancement techniques.[153] While EEG offers excellent temporal precision on the millisecond scale, enabling the capture of rapid neural dynamics, this advantage is compromised if the sampling rate is insufficient, leading to aliasing where higher-frequency components are misrepresented as lower frequencies.[154][155] To mitigate aliasing, sampling must adhere to the Nyquist theorem, requiring at least twice the frequency of the highest signal component of interest.[155] Inter-subject variability poses another inherent challenge, as anatomical differences such as skull thickness and conductivity directly influence signal amplitude and distribution at the scalp.[156] Thicker skulls, for instance, increase electrical resistance, reducing the amplitude of recorded potentials and introducing inconsistencies across individuals that affect both clinical interpretation and research reproducibility.[157] Practically, EEG requires active patient cooperation to minimize movement and ensure proper electrode placement, which can be particularly demanding for certain populations. In infants, the technique necessitates specialized adaptations, such as securing electrodes during sleep or using reduced montages, due to their limited ability to remain still or follow instructions.[158][159]Comparisons with Other Neuroimaging
Electroencephalography (EEG) provides direct measurement of neuronal electrical activity with high temporal precision, but its spatial localization is limited compared to other neuroimaging modalities. Functional magnetic resonance imaging (fMRI), which detects blood-oxygen-level-dependent (BOLD) signals reflecting hemodynamics, offers superior spatial resolution on the order of millimeters but sacrifices temporal detail, with effective resolution limited to seconds due to the slow vascular response. [150] In contrast, EEG achieves temporal resolution in the millisecond range (e.g., <1 ms), enabling real-time tracking of neural dynamics, though its spatial accuracy is coarser, typically 6–9 cm at the scalp level and improvable to 2–3 cm with advanced processing like current source density estimation. [150] These trade-offs make EEG and fMRI complementary: EEG excels in capturing rapid event-related potentials, while fMRI pinpoints subcortical and deep cortical sources. [150] Magnetoencephalography (MEG) shares EEG's excellent temporal resolution in the millisecond range, allowing both to resolve fast oscillatory and evoked responses without interference from slow metabolic processes. [160] However, MEG measures magnetic fields generated by neuronal currents, bypassing distortions from skull and tissue conductivity that smear EEG signals and reduce its spatial resolution. [160] As a result, MEG achieves better source localization, particularly for tangential cortical currents, often outperforming EEG in separating nearby generators. [160] Despite these advantages, EEG remains far more accessible and cost-effective, requiring only scalp electrodes rather than expensive cryogenic sensors and shielded environments essential for MEG. [160] Compared to positron emission tomography (PET), which maps metabolic activity via radioactive tracers, EEG avoids any invasiveness or radiation exposure, using non-invasive electrode placement for immediate, real-time data acquisition. [161] PET's temporal resolution is constrained to 1–2 minutes per scan, providing static snapshots of glucose uptake or receptor binding rather than dynamic electrical patterns, whereas EEG captures ongoing neural firing with sub-millisecond fidelity. [161] Functional near-infrared spectroscopy (fNIRS), another optical method assessing cortical hemodynamics like fMRI, offers portability similar to EEG but with shallower penetration limited to 1–3 cm depth, focusing on superficial layers. [162] While fNIRS provides moderate spatial resolution (centimeters) superior to EEG's, its temporal resolution is slower (<1 second) due to the hemodynamic lag, making EEG preferable for high-speed events despite its volume conduction challenges. [162] Functional ultrasound (fUS) neuroimaging, an emerging acoustic technique, contrasts with EEG by imaging cerebral blood volume changes with high spatial resolution (~200 μm) and sub-second temporal precision (e.g., 20 ms), enabling detailed localization of deep structures. [163] Unlike EEG's electrical basis, fUS relies on ultrasound waves for non-ionizing, contrast-agent-free detection, but current human applications often require a sonolucent skull implant, rendering it semi-invasive compared to EEG's fully wearable, electrode-based approach. [163] Both support mobility for ambulatory studies, though fUS is still maturing for unrestricted real-world use. [164]| Modality | Temporal Resolution | Spatial Resolution | Invasiveness | Key Trade-off |
|---|---|---|---|---|
| EEG | Milliseconds (<1 ms) | Centimeters (2–9 cm) | Non-invasive | High dynamics, poor localization [150] [160] [161] [162] |
| fMRI | Seconds (1–2 s) | Millimeters | Non-invasive | Precise localization, slow dynamics [150] |
| MEG | Milliseconds | Millimeters (better than EEG) | Non-invasive | Less distortion, high cost [160] |
| PET | Minutes (1–2 min) | Millimeters | Invasive (radioactive) | Metabolic insight, no real-time [161] |
| fNIRS | Seconds (<1 s) | Centimeters | Non-invasive | Portable, shallow depth [162] |
| fUS | Sub-seconds (20 ms) | Micrometers (200 μm) | Semi-invasive (implant) | High detail, emerging mobility [163] |