
Community hub
Recent from talks
Contribute something
Nothing was collected or created yet.
White Latin Americans
View on WikipediaWhite Latin Americans (Spanish: Latinoamericanos blancos[25][26]) are Latin Americans of total or predominantly European or West Asian ancestry.[27]
Key Information
Individuals with majority — or exclusively — European ancestry originate from European settlers who arrived in the Americas during the colonial and post-colonial period. These people are now found throughout Latin America.
Most immigrants who settled Latin America for the past five centuries were from Spain and Portugal; after independence, the most numerous non-Iberian immigrants were from France, Italy, and Germany, followed by other Europeans as well as West Asians (such as Levantine Arabs and Armenians).[28][29][30]
Composing 33-36% of the population as of 2010[update] (according to some sources),[1][2][31] White Latin Americans constitute the second largest racial-ethnic group in the region after mestizos (mixed Amerindian and European people). Latin American countries have often tolerated interracial marriage since the beginning of the colonial period.[32][33] White (Spanish: blanco or güero; Portuguese: branco) is the self-identification of many Latin Americans in some national censuses. According to a survey conducted by Cohesión Social in Latin America, conducted on a sample of 10,000 people from seven countries of the region, 34% of those interviewed identified themselves as white.[34]
Being white
[edit]Being white is a term that emerged from a tradition of racial classification that developed as many Europeans colonized large parts of the world and employed classificatory systems to distinguish themselves from the local inhabitants. However, while most present-day racial classifications include a concept of being white that is ideologically connected to European heritage and specific phenotypic and biological features associated with European heritage, there are differences in how people are classified. These differences arise from the various historical processes and social contexts in which a given racial classification is used. As Latin America is characterized by differing histories and social contexts, there is also variance in the perception of whiteness throughout Latin America.[35]
According to Peter Wade, a specialist in race concepts of Latin America,
...racial categories and racial ideologies are not simply those that elaborate social constructions on the basis of phenotypical variation or ideas about innate difference but those that do so using the particular aspects of phenotypical variation that were worked into vital signifiers of difference during European colonial encounters with others.[36]
In many parts of Latin America, being white is more a matter of socio-economic status than specific phenotypic traits, and it is often said that in Latin America "money whitens".[37] Within Latin America there are variations in how racial boundaries have been defined. In Argentina, for example, the notion of mixture has been downplayed. Alternately, in countries like Mexico and Brazil mixture has been emphasized as fundamental for nation-building, resulting in a large group of bi-racial mestizos, in Mexico, or tri-racial pardos, in Brazil,[38][39] who are considered neither fully white nor fully non-white.[40]
Unlike in the United States (where ancestry may be used exclusively to define race), by the 1970s, Latin American scholars came to agree that race in Latin America could not be understood as the "genetic composition of individuals" but instead must be "based upon a combination of cultural, social, and somatic considerations". In Latin America, a person's ancestry may not be decisive in racial classification. For example, full-blooded siblings can often be classified as belonging to different races (Harris 1964).[41][42]
For these reasons, the distinction between "white" and "mixed", and between "mixed" and "black" and "indigenous", is largely subjective and situational, meaning that any attempt to classify by discrete racial categories is fraught with problems.[43]
History
[edit]

People of European origin began to arrive in the Americas in the 15th century since the first voyage of Christopher Columbus in 1492. Most early migrants were male, but by the early and mid-16th century, more and more women also began to arrive from Europe.[44]
After the Wars of Independence, the elites of most of the countries of the region concluded that their underdevelopment was caused by their populations being mostly Amerindian, Mestizo or Mulatto;[45] so a major process of "whitening" was required, or at least desirable.[46][47] Most Latin American countries then implemented blanqueamiento policies to promote European immigration, and some were quite successful, especially Argentina, Uruguay, and Brazil. From the late 19th century to the early 20th century, the number of European immigrants who arrived far surpassed the number of original colonists. Between 1821 and 1932, of a total 15 million immigrants who arrived in Latin America,[28] Argentina received 6.4 million, and Brazil 5.5 million.[48]
Historical demographic growth
[edit]The following table shows estimates (in thousands) of white, black/mulatto, Amerindian, and mestizo populations of Latin America, from the 17th to the 20th centuries. The figures shown are, for the years between 1650 and 1980, from the Ariases' The Cry of My People...,[49] for 2000, from Lizcano's Composición Étnica....[2] Percentages are by the editor.
| Year | White | Black | Amerindian | Mestizo | Total |
|---|---|---|---|---|---|
| 1650 | 138 | 67 | 12,000 | 670 | 12,875 |
| Percentages | 1.1% | 0.5% | 93.2% | 5.2% | 100% |
| 1825 | 4,350 | 4,100 | 8,000 | 6,200 | 22,650 |
| Percentages | 19.2% | 18.1% | 35.3% | 27.3% | 100% |
| 1950 | 72,000 | 13,729 | 14,000 | 61,000 | 160,729 |
| Percentages | 44.8% | 8.5% | 8.7% | 37.9% | 100% |
| 1980 | 150,000 | 27,000 | 30,000 | 140,000 | 347,000 |
| Percentages | 43.2% | 7.7% | 8.6% | 40.3% | 100% |
| 2000 | 181,296 | 119,055 | 46,434 | 152,380 | 502,784 |
| Percentages | 36.1% | 23.6% | 9.2% | 30.3% | 100% |
Admixture
[edit]
Since European colonization, Latin America's population has had a long history of intermixing. Today, many Latin Americans who have European ancestry, may have varying degrees of Indigenous or Sub-Saharan African ancestry as well. The casta categories used in 18th-century colonial Latin America designated people according to their ethnic or racial background, with the main classifications being indio (used to refer to Native American people), Spaniard, and mestizo, although the categories were rather fluid and inconsistently used. Under this system, those with one Indio great-grandparent but the remainder being Spaniards, were legally Spaniards. The offspring of a castizo and Spaniard was a Spaniard. The same was not true for African ancestry.
As in Spain, persons of Moorish or Jewish ancestry within two generations were generally not allowed to enroll in the Spanish Army or the Catholic Church in the colonies, although this prohibition was inconsistently applied. Applicants to both institutions, and their spouses, had to obtain a Limpieza de sangre (purity of blood) certificate that proved that they had no Jewish or Moorish ancestors, in the same way as those in the Peninsula did. However, being a medieval concept that was more of a religious issue rather than a racial issue, it was never a problem for the native or slave populations in the colonies of the Spanish Empire, and by law people from all races were to join the army, with openly practicing Roman Catholicism being the only prerequisite. One notable example was that of Francisco Menendez, a free black military officer of the Spanish Army during the 18th century at the Gracia Real de Santa Teresa de Mose fort in St. Augustine, Florida.[50]
European DNA
[edit]| Country | European DNA average | |
|---|---|---|
| Native Europeans | 99 | |
| Argentina[51] | 71 | |
| Bolivia[52] | 25 | |
| Brazil[53] | 62 | |
| Chile[54] | 54 | |
| Colombia[55] | 42 | |
| Costa Rica[56] | 58 | |
| Cuba[57] | 71 | |
| Ecuador[58] | 36 | |
| El Salvador[59] | 47 | |
| Guatemala[60] | 35 | |
| Haiti[61] | 11 | |
| Honduras[51] | 50 | |
| Mexico[62] | 50 | |
| Nicaragua[51] | 57 | |
| Paraguay[63] | 60 | |
| Peru[64] | 29 | |
| Puerto Rico[56] | 64 | |
| Dom. Rep.[65] | 57 | |
| Uruguay[66] | 77 | |
| Venezuela[51] | 56 | |
Self-identified Populations
[edit]The country with the largest number of self-identified Euro-Latino inhabitants in Latin America is Brazil, with 88 million out of 203.0 million total Brazilians,[67] or 43.5% of the total population, as of the 2022 census. Brazil's southern region contains the highest concentration, at 79% of the population self-identificated.[3] Argentina received the largest number of post-colonial European immigrants, with more than 7 million,[68] second only to the United States, which received 24 million. In terms of percentage of the total population, Uruguay and Argentina have the highest concentrations of self-identified or classified whites, who constitute +80% of their total population, while Honduras, Ecuador, Haiti, Honduras, Bolivia, Peru, Guatemala, Panama and El Salvador have the smallest classified white population, in a range of 1-15%.
| Country | Self-identified (ethnic or skin color) | Population in (millions) |
|---|---|---|
| Argentina | 54–85[9] | 38M[2] |
| Bolivia | 5–15[69] | 0.600M–1.7M[2] |
| Brazil | 43.5[70][71] | 88M |
| Chile | 30–52.7[9] | 10M[2] |
| Colombia | 20–26[9] | 10M–14M[2] |
| Costa Rica | 14[72]-62[9] | 0.7[72]-2.8M[73][74] |
| Cuba | 64.1[75] | 7.1M[2] |
| Dominican Republic | 18.7[14] | 1.6M |
| Ecuador | 2.2-9.9[76] | 0.375M[2] |
| El Salvador | 1-12.7[77][78] | 0.730M[2] |
| Guatemala | 4–10[9] | 0.800M–1.8M[79] |
| Haiti | <5[22] | <0.59M[22] |
| Honduras | 1–7.8[80] | 0.09M–0.767M[81][82] |
| Mexico | [citation needed] | [citation needed] |
| Nicaragua | 17[83] | 1.1M[84] |
| Panama | 6.7–15[9] | 0.366M[85] |
| Paraguay | 20–30[9] | 1.7M[2] |
| Peru | 5.8–12[86] | 1.3M–5.8M[2] |
| Puerto Rico (U.S) | 17.1–75.8(2020/2010)[15] | 0.560–2.8M |
| Uruguay | 85.2-88[2] | 2.9M[2][87] |
| Venezuela | 16.6-43.6[7][8] | 13M[2] |
European influence by country
[edit]North America
[edit]Mexico
[edit]The European influence in Mexico has its origins in Spanish immigrants who arrived from many different regions of Spain, including the northern regions such as Cantabria, Navarra, Asturias, Burgos, Galicia and the Basque Country since the early 16th century;[88] and in the 19th and 20th century when many non-Iberian immigrants arrived to the country as well, either motivated by economic opportunity (Americans, Canadians, English), government programs (Italians, Irish, Germans) or political motives such as the French during the Second Mexican Empire.[89][90] In the 20th century, international political instability was a key factor to drive immigration to Mexico; in this era Greeks, Armenians, Poles, Russians, Lebanese, Palestinians and Jews,[90] along with many Spanish refugees fleeing the Spanish Civil War, also settled in Mexico[91] whereas in the 21st century, due to Mexico's economic growth, immigration from Europe has increased (mainly France and Spain), people from the United States have arrived as well, nowadays making up more than three-quarters of Mexico's roughly one million legal migrants. In that time, more people from the United States have been added to the population of Mexico than Mexicans to that of the United States, according to government data in both nations.[92]
Estimates of Mexico's white population differ greatly in definitions, methodology, and percentages given. The World Factbook estimate Mexico's European population as less than 10%.[93] Encyclopædia Britannica estimates 15% "White" in 2000, and does not give an exact percentage for 2012, but estimates that those belonging to "other" ethnicities, besides Mestizos and Indigenous people, make up 31% of the population.[4] A study made by the University College London in collaboration with Mexico's National Institute of Anthropology and History found that the frequencies of blond hair and light eyes in Mexicans are of 18% and 28% respectively.[94] Surveys that use skin color such as those made by Mexico's National Council to Prevent Discrimination, and Mexico's National Institute of Statistics and Geography reporting results that average 32%.[95][96][97][98][99][verification needed] According to ENADIS, around 29% of the Mexican population identify themselves with white/light skin tones; related to phototypes analysis, around 3 out 10 Mexicans could have scales I, II or III phototype.[100][101]
According to the American historian Howard F. Cline, writing in 1962, Mexicans in the western regions were physically similar in appearance to Spanish Europeans.[102] In the north and west of Mexico, the indigenous tribes were substantially smaller and, unlike those found in central and southern Mexico, they were mostly nomadic, therefore remaining isolated from colonial population centers, with hostilities between them and Mexican colonists often taking place.[103] This eventually led the northeast region of the country to become the region with the highest proportion of whites during the Spanish colonial period, although recent migration waves have been changing its demographic trends.[104][original research?]
A study performed in hospitals of Mexico City suggests that socioeconomic factors influence the frequency of Mongolian spots among newborns, as evidenced by the higher prevalence of 85% in newborns from a public institution, typically associated with lower socioeconomic status, compared to a 33% prevalence in newborns from private hospitals, which generally cater to families with higher socioeconomic status.[105] The Mongolian spot appears with a very high frequency (85-95%) in Native American, and African children, but can be present in some individuals in the Mediterranean populations.[106] The skin lesion reportedly almost always appears on South American[107] and Mexican children who are racially Mestizos,[108] while having a very low frequency (5–10%) in European children.[109] According to the Mexican Social Security Institute (shortened as IMSS) nationwide, around half of Mexican babies have the Mongolian spot.[110]
Caribbean
[edit]Cuba
[edit]Self-identified white people in Cuba make up 64.1% of the total population, according to the census of 2012,[111][112] with the majority being of Spanish descent. However, after the mass exodus resulting from the Cuban Revolution in 1959, Cuba's white population diminished. Today, the various records that claim to show the percentage of whites in Cuba are conflicting and uncertain; some reports (usually coming from Cuba) still report a similar, number, pre-revolutionary was around 80%, and others (usually from outside observers) report 40–45%. Although most white Cubans are of Spanish descent, many have French, Portuguese, German, Italian, Irish or Russian ancestry.[113] During the 18th, 19th, and early 20th centuries, large waves of Canarians, Catalans, Andalusians, Castilians, and Galicians immigrated to Cuba. Between 1901 and 1958, more than a million Spaniards arrived in Cuba from Spain. The country also saw an increase in the coming of Jewish immigrants.[114] Historically, Chinese descendants in Cuba were classified as white. Though more recent censuses would add a yellow (or amarilla) racial category before its removal in 21st century census results.[115][116]
An autosomal study from 2014 found the genetic makeup in Cuba to be 72% European, 20% African, and 8% Native American with different proportions depending on the self-reported ancestry (White, Mulatto or Mestizo, and Black). According to this study Whites are on average 86% European, 6.7% African and 7.8% Native American with European ancestry ranging from 65% to 99%. 75% of whites are over 80% European and 50% are over 88% European[117] According to a study in 2011 Whites are on average 5.8% African with African ancestry ranging from 0% to 13%. 75% of whites are under 8% African and 50% are under 5% African.[118] A study from 2009 analysed the genetic structure of the three principal ethnic groups from Havana City (209 individuals), and the contribution of parental populations to its genetic pool. A contribution from Indigenous peoples of the Americas was not detectable in the studied sample.[119]
| Self-reported ancestry | European | African | Native American |
|---|---|---|---|
| White | 86% | 6.7% | 7.8% |
| White (Havana) | 86% | 14% | 0% |
| Mulatto/Mestizo | 50.8% | 45.5% | 3.7% |
| Mulatto/Mestizo (Havana) | 60% | 40% | 0% |
| Black | 29% | 65.5% | 5.5% |
| Black (Havana) | 23% | 77% | 0% |
Dominican Republic
[edit]The 1750 estimates show that there were 30,863 whites, or 43.7% out of a total population of 70,625, in the colony of Santo Domingo.[120][121] other estimates include 1790 with 40,000 or 32% of the population,[122][123] and in 1846 with 80,000 or 48.5% of the population.[124]
The first census of 1920 reported that 24.9% identified as white. The second census, taken in 1935, covered race, religion, literacy, nationality, labor force, and urban–rural residence.[125] The 2022 census reported that 1,611,752 or 18.7% of Dominicans 12 years old and above self identify as white.[14] This was the first census since 1960 to gather data on ethnic-racial identification.[126]
| Identifying as white 1920–2022 | ||||
|---|---|---|---|---|
| Year | Population | % | Ref(s) | |
| 1920 | 223,144 | 24.9 | [127] | |
| 1935 | 192,732 | 13.0 | [128][129] | |
| 1950 | 600,994 | 28.14 | [127] | |
| 1960 | 489,580 | 16.1 | [130][131] | |
| 2022 | 1,611,752 | 18.7 | [14] | |
White Dominicans were estimated to be 17.8% of the Dominican Republic's population, according to a 2021 survey by the United Nations Population Fund.[132] with the vast majority being of Spanish descent. Notable other ancestries includes French, Italian, Lebanese, German, and Portuguese.[133][134][135]
The government of Rafael Leónidas Trujillo made a point of increasing the white population, or "whitening" the racial composition of the country, by rejecting black immigrants from Haiti and local blacks as foreigners.[136] He also welcomed Jewish refugees in 1938 and Spanish farmers in the 1950s as part of this plan.[137][138] The country's German minority is the largest in the Caribbean.[139]
Haiti
[edit]The white and the mulatto population of Haiti are classified together at about 5% of its population, while 95% is classified being of solely African descent.[22]
That 5% minority group comprises people of many different ethnic and national backgrounds, who are French, Spanish, Polish and other European ancestry,[140][141] as well as the Jewish diaspora, arriving from the Polish legion and during the Holocaust,[140][142] Germans (18th century and World War I),[143][144] and Italian.
Puerto Rico
[edit]
An early census on the island was conducted by Governor Francisco Manuel de Lando in 1530. An exhaustive 1765 census was taken by Lieutenant General Alexander O'Reilly, which, according to some sources, showed 17,572 whites out of a total population of 44,883.[121][145] The censuses from 1765 to 1887 were taken by the Spanish government who conducted them at irregular intervals. The 1899 census was taken by the United States Department of War. Since 1910, Puerto Rico has been included in every decennial census taken by the United States.
| Self identify as white 1765 - 2020 (census) | |||||||
|---|---|---|---|---|---|---|---|
| Year | Population | % | Ref(s) | Year | Population | % | Ref(s) |
| 1765 | 17,572 | - | [146] | 1887 | 474,933 | 59.5 | [147] |
| 1775 | 30,709 | 40.4 | [148] | 1897 | 573,187 | 64.3 | [147] |
| 1787 | 46,756 | 45.5 | [148] | 1899 | 589,426 | 61.8 | [147] |
| 1802 | 78,281 | 48.0 | [147] | 1910 | 732,555 | 65.5 | [149] |
| 1812 | 85,662 | 46.8 | [147] | 1920 | 948,709 | 73.0 | [149] |
| 1820 | 102,432 | 44.4 | [147] | 1930 | 1,146,719 | 74.3 | [149] |
| 1827 | 150,311 | 49.7 | [147] | 1940 | 1,430,744 | 76.5 | [150] |
| 1827 | 150,311 | 49.7 | [147] | 1950 | 1,762,411 | 79.7 | [150] |
| 1836 | 188,869 | 52.9 | [147] | 2000 | 3,064,862 | 80.5 | [151] |
| 1860 | 300,406 | 51.5 | [147] | 2010 | 2,825,100 | 75.8 | [152] |
| 1877 | 411,712 | 56.3 | [147] | 2020 | 560,592 | 17.1 | [153] |
In 2010, Self-identifierd white Puerto Ricans are said to comprise the majority of the island's population, with 75.8% of the population identifying as white.[154] Though in the 2020 U.S. census, this percentage dropped to 17.1%.[15] People of self-identified multiracial descent are now the largest demographic in the country, at 49.8%.[15]
In 1899, one year after the U.S. invaded and took control of the island, 61.8% identified as white. In 2000, for the first time in fifty years, the census asked people to define their race and found the percentage of whites had risen to 80.5% (3,064,862); not because there has been an influx of whites to the island (or an exodus of non-White people), but a change of race perceptions, mainly because Puerto Rican elites wished to portray Puerto Rico as the "white island of the Antilles", partly as a response to scientific racism.[155][156]
Geologist Robert T. Hill published a book titled Cuba and Porto Rico, with the other islands of the West Indies (1899), wrote that the island was "notable among the West Indian group for the reason that its preponderant population is of the white race"[157] and "Porto Rico, at least, has not become Africanized".[158][159]
According to a genetic research by the University of Brasília, Puerto Rican genetic admixture consists in a 60.3% European, 26.4% African, and 13.2% Amerindian ancestry.[160]
Central America
[edit]Costa Rica
[edit]
From the late 19th century to when the Panama Canal opened, European migrants used Costa Rica to get across the isthmus of Central America to reach the west coast of the United States (California).
The most recent 2022 Costa Rican census recorded ethnic or racial identity for all groups separately for the first time in more than ninety-five years since the 1927 census. Options included indigenous, Black or Afro-descendant, Mulatto, Chinese, Mestizo, white and other on section IV: question 7.[161]
Estimates of the percentage classified as white people vary between 14%,[72] 77%[73] and 82%,[2] or about 3.1–3.5 million people. The white and mestizo populations combined equal 83%, according to the CIA World Factbook.[162]
Many of the first Spanish colonists in Costa Rica may have been Jewish converts to Christianity.[163] The first sizable group of self-identified Jews immigrated from diaspora communities in Poland, beginning in 1929. From the 1930s to the early 1950s, journalistic and official anti-Semitic campaigns fueled harassment of Jews; however, by the 1950s and 1960s, the immigrants won greater acceptance. Most of the 3,500 Costa Rican Jews today are not highly observant, but they remain largely endogamous.[164]
A study done in Costa Rica, in the province of Guanacaste(the country's majority mestizo population), revealed that the average genetic admixture was 45% European, 33% indigenous, 14.6% black and 5.8% Asian.[165]
El Salvador
[edit]
According to the official 2007 Census in El Salvador, 12.7% of Salvadorans identified as being "white",[166] and 86.3% as mestizo.[167]
Historically, in Chalatenango due to the small indigenous population in the area and colonial governors wanting to repopulate the land with Europeans, today it is presumed that majority of population is white or pure European.[168] Spaniards, mainly from Galicia and Asturias emigrated to El Salvador. Their descendants are the blonde and fair-skinned people of Chalatenango Department.[169] Later, the country would experience other waves of other European immigrants, mainly Italian and Spaniards.[170][171][172] During World War II, El Salvador gave documents to Jews from Hungary, France, Germany, the Netherlands, Poland, and Switzerland. It is estimated that they were up to 20,000 immigrants.[173][174]
Genetic study of the publication Genomic Components in America's demography, in which geneticists from all over the continent and Japan participated, that the average genetic composition of the average Salvadoran is: 52% European, 40% Amerindian, 6% African and 2% Middle Eastern.[175]
Guatemala
[edit]
In the recent 2018 Census, those mestizos and whites are included in one category (Ladinos), accounting 56% of population.[176] Into the category Ladino, include part of Amerindians culturally Hispanic along people of mixed heritage, part of mixed Guatemalans could have important European ancestry or being castizo (mixed+white), specially in Metropolitan Areas and the East.
The most common European ancestry in Guatemalans mixed is Spanish descent, but there were German and Italian migration throughout Nineteen and Twenty Century in the country[177]
Honduras
[edit]Honduras contains perhaps one of the smallest percentages of classified whites in Latin America comparatively with the majority population. According some census with only about 3% of the Honduran population is classified in this group.[178][179] Another census indicates that near a 7.8% of the total population is white in Honduras.[180] During the 19th century several immigrants from Catalonia, Germany, Italy and Eastern Europe arrived to Honduras. Some of these Europeans were Jews from the Russian Empire, escaping the pogroms. However most of this migrants mixed up with the majority mestizo population of Honduras, thus adding new genetic load to the Honduran population from other places in Europe.[181]
Of these the majority are people of Spanish descent. There is an important Spanish community mostly located in the city of San Pedro Sula and Tegucigalpa. There are also people from The Bay Islands who descend from British settlers (either English, Irish, or Scottish). Another large migratory group in Honduras is the Arabs, predominantly Palestinians and to a lesser extent Lebanese.[182] Many of these Levantine Arabs were classified as white in national censuses; around 300,000 Arabs live in Honduras.
However, most Hondurans consider themselves as mestizos, regardless of their ethnic category, which is why it is difficult to determine the actual white population of Honduras.[183] According to Admixture and genetic relationships of Mexican Mestizos regarding Latin American and Caribbean populations based on 13 CODIS-STRs, the genetic composition of most Hondurans is 58.4% European, 36.2% Amerindian, and 5.4% African.[184] A 2021 study of 295 Honduran-Americans who reported all four grandparents born in Honduras found an average of 40% European, 39% Amerindian, and 21% African in the diaspora population.[185]
Nicaragua
[edit]Limited genetic studies have been done on Nicaraguans or those of Nicaraguan descent, finding varying degrees of European admixture in the population. A study called "Genomic Components in America's demography" published in 2017, estimates that the average Nicaraguan is of 58% European genetic background, primarily of Spanish (43.63%) but also of German, French, and Italian ancestry; 28% of indigenous American ancestry; and 14% of West African origin.[186] Another study published in 2014 in the journal Genetics and Molecular Biology, found a predominance of European ancestry at 69% of the total genetic contribution, followed by Sub-Saharan African ancestry at 20%, and Native American ancestry at 11%, making Nicaragua the country with one of the highest proportion of European ancestry in Latin America.[187][17] A 2021 study of 413 Nicaraguan-Americans who reported all four grandparents born in Nicaragua found an average of 44% European, 44% Indigenous, and 12% African ancestry in the diaspora population.[185]
Non-genetic self-reported data from the CIA World Factbook consider that Nicaragua's population averages phenotypically at 69% Mestizo/Pardo, 17% White, 9% Afro-Latino and 5% Native American.[188] This fluctuates with changes in migration patterns. The population is 58% urban as of 2013[update].[189]
In the 19th century, Nicaragua experienced a wave of immigration, primarily from Western Europe. In particular, families moved to Nicaragua to set up businesses with the money they brought from Europe. They established many agricultural businesses, such as coffee and sugarcane plantations, as well as newspapers, hotels, and banks.[citation needed]
Panama
[edit]White Panamanians are classified as 6.7% of the population,[190] with those of Spanish ancestry being in the majority. Other ancestries includes Dutch, English, French, German, Swiss, Danish, Irish, Greek, Italian, Portuguese, Polish, Russian, and Ukrainian. There is also a sizable and influential Jewish community.[citation needed]
South America
[edit]Argentina
[edit]
The ancestry of Argentines is mostly European, with both Native American and African contributions. According to a 2006 autosomal DNA study the genetic structure of Argentina would be: 78.0% European, 19.4% Amerindian and 2.5% African. Using other methods it was found that it could be: 80.2% European, 18.1% Amerindian and 1.7% African.[191] A 2010 autosomal DNA study found the Argentine population to average 78.5% European, 17.3% Native American, and 4.2% sub-Saharan African, in which 63.6% of the tested group had at least one ancestor who was Indigenous.[192] An autosomal DNA study from 2012 based in 441 DNA samples found the genetic composition of Argentines to be 65% European, 31% Native American, and 4% African. The study's conclusion reflects the existence of genetic heterogeneity among differing regions instead focusing in Greater Buenos Aires.[193] A 2022 study based on over 2.785 DNA samples revealed a genetic composition of: 85% Caucasian (74% European + 11% Middle East of which 7% is Jewish), 13% Amerindian and 1% African.[194]
Argentina's National Institute of Statistics and Censuses (INDEC) does not conduct ethnic/racial censuses; so, no official data exist on the percentage of white Argentines today. White Argentines are dispersed throughout the country, but their greatest concentration is in the east-central region of Pampas, the southern region of Patagonia, the west-central region of Cuyo and in the north-eastern region of Litoral. Their concentration is smaller in the north-western region (mainly in the provinces of Jujuy and Salta), which was the most densely populated region of the country (mainly by Amerindian and Mestizo people) before the wave of immigration of 1857-1940 and was the area where European newcomers settled the least.[195][196] During the last few decades, due to internal migration from these north-western provinces—as well as to immigration from Bolivia, Peru, and Paraguay—the percentage of white Argentines in certain areas of Greater Buenos Aires has decreased significantly.[197] According to Seldin M. et al. (2011) the genetic composition within 94 individuals from Argentina was 78% European, 19% amerindian and around 3% subsaharian African, those results were using the Bayesian clustering algorithm structure while on the weighted least mean square method was 80% European, 18% amerindian and 2% African.[191][198]
Initially, colonial Argentina and neighboring Uruguay had a predominantly mestizo population like the rest of the Spanish colonies, but due to a flood of continuous European migration waves in the 19th and early 20th centuries and the repeated intermarriage with Europeans, most of them Italians and Spaniards, this intensified the European influence on culture and society in Argentina and Uruguay. As a result, the Mestizo population became a so-called Castizo majority population. As a result, the term Mestizo has seen a decrease in use.
The white population in Argentina is mostly descended from immigrants arriving from Europe between the late 19th and early 20th centuries, with a smaller proportion from Spaniards of the colonial period. From 1506 to 1650—according to M. Möner, Peter Muschamp, and Boyd-Bowman—out of a total of 437,669 Spaniards who settled in the American Spanish colonies, between 10,500 and 13,125 Peninsulares settled in the Río de la Plata region.[199] The colonial censuses conducted after the creation of the Viceroyalty of the Río de la Plata showed that the proportion of Spaniards and Criollos was significant in the cities and surrounding countryside, but not so much in the rural areas. The 1778 census of Buenos Aires, ordered by Viceroy Juan José de Vértiz, revealed that, of a total population of 37,130 inhabitants (in both the city and surrounding countryside), the Spaniards and Criollos numbered 25,451, or 68.55% of the total. Another census, carried out in the Corregimiento de Cuyo in 1777, showed that the Spaniards and Criollos numbered 4,491 (or 51.24%) out of a population of 8,765 inhabitants. In Córdoba (city and countryside) the Spanish/Criollo people comprised a 39.36% (about 14,170) of 36,000 inhabitants.[200]
Data provided by Argentina's Dirección Nacional de Migraciones (National Bureau of Migrations) states that the country received a total of 6,611,000 immigrants during the period from 1857 to 1940.[201] The main immigrant group was 2,970,000 Italians (44.9% of the total), who came initially from Piedmont, Veneto, and Lombardy, and later from Campania, Calabria, and Sicily.[202] The second group in importance was Spaniards, some 2,080,000 (31.4% of the total), who were mostly Galicians and Basques, but also Asturians, Cantabrians, Catalans, and Andalucians. In smaller but significant numbers came Frenchmen from Occitania (239,000, 3.6% of the total) and Poles (180,000 – 2.7%). From the Russian Empire came some 177,000 people (2.6%), who were not only ethnic Russians, but also Ukrainians, Belarusians, Volga Germans, Lithuanians, etc. From the Ottoman Empire the contribution was mainly Armenians, Lebanese, and Syrians, some 174,000 in all (2.6%). Then come the immigrants from the German Empire, some 152,000 (2.2%). From the Austro-Hungarian Empire came 111,000 people (1.6%), among them Austríans, Hungarians, Croatians, Bosniaks, Serbs, Ruthenians, and Montenegrins. Roughly 75,000 people came from what was then the United Kingdom of Great Britain and Ireland, with the majority of these being Irish immigrants arriving via "coffin ships" escaping the Great Famine. Other minor groups were the Portuguese (65,000), Slavic peoples from the Balkans (48,000), Swiss (44,000), Belgians (26,000), Danes (18,000), white Americans (12,000), the Dutch (10,000), and the Swedish (7,000). 223,000 came from other countries not listed above. Even colonists from Australia, and Boers from South Africa, can be found in the Argentine immigration records.[citation needed] The city's motto is "Crespo: melting pot, culture of faith and hard work", referring to the Volga Germans, Italians, Spaniards, and other ethnicities that comprise its population.[203]
In the 1910s, when immigration reached its peak, more than 30% of Argentina's population had been born in Europe, and over half of the population of the city of Buenos Aires had been born abroad. According to the 1914 national census, 80% out of a total population of 7,903,662 were people who were either European, or the children and grandchildren of same. Among the remaining 20% (the descendants of the population previous to the immigratory wave), about one third were white. That makes for 86.6%, or about 6.8 million whites residing in Argentina.[204] European immigration continued to account for over half the population growth during the 1920s,[205] and for smaller percentages after World War II, many Europeans migrating to Argentina after the great conflict to escape hunger and destitution. According to Argentine records, 392,603 people from the Old World entered the country in the 1940s. In the following decade, the flow diminished because the Marshall Plan improved Europe's economy, and emigration was not such a necessity; but even then, between 1951 and 1970 another 256,252 Europeans entered Argentina.[206] From the 1960s—when whites were 76.1% of the total—onward, increasing immigration from countries on Argentina's northern border (Bolivia, Peru, and Paraguay)[207] significantly increased the process of Mestizaje in certain areas of Argentina, especially Greater Buenos Aires, because those countries have Amerindian and Mestizo majorities.[208][209][210]
In 1992, after the fall of the Communist regimes of the Soviet Union and its allies, the governments of Western Europe were worried about a possible mass exodus from Central Europe and Russia. President Carlos Menem offered to receive part of that emigratory wave in Argentina. On December 19, 1994, Resolution 4632/94 was enacted, allowing "special treatment" for applicants who wished to emigrate from the republics of the ex-Soviet Union. From January 1994 until December 2000, a total 9,399 Central and Eastern Europeans traveled and settled in Argentina. Of the total, 6,720 were Ukrainians (71.5%), 1,598 Russians (17%), 526 Romanians, Bulgarians, Armenians, Georgians, Moldovans, and Poles, and 555 (5.9%) traveled with a Soviet passport.[211] 85% of the newcomers were under age 45 and 51% had tertiary-level education, so most of them integrated quite rapidly into Argentine society, although some had to work for lower wages than expected at the beginning.[212]
Genetic studies of Argentina population:
- Homburguer et al., 2015, PLOS One Genetics: 67% European, 28% Amerindian, 4% African and 1.4% Asian.[213]
- Seldin et al., 2006, American Journal of Physical Anthropology: 78.0% European, 19.4% Amerindian and 2.5% African. Using other methods it was found that it could be: 80.2% European, 18.1% Amerindian and 1.7% African.[191]
- Olivas et al., 2017, Nature: 84,1% European and 12,8% Amerindian.[214]
- Genera (2022): 85% Caucasian (74% European + 11% Middle East), 13% Amerindian and 1% African.[194]
- According to Caputo et al., 2021, the study of autosomal DIPs show that the genetic contribution is 77.8% European, 17.9% Amerindian and 4.2% African. The X-DIPs matrilineal show 52.9% European, 39.6% Amerindian and 7.5% African.[215]
- Avena et al., 2012, PLOS One: 65% European, 31% Amerindian, and 4% African.[216]
- Buenos Aires Province: 76% European and 24% others.
- South Zone (Chubut Province): 54% European and 46% others.
- Northeast Zone (Misiones, Corrientes, Chaco & Formosa provinces): 54% European and 46% others.
- Northwest Zone (Salta Province): 33% European and 67% others.
- Other studies indicate that the genetic composition between regions would be:[217]
- Central Zone: 81% European, 15% Amerindian and 4% African
- South Zone: 68% European, 28% Amerindian and 4% African
- Northeast Zone: 79% European, 17% Amerindian and 4% African
- Northwest Zone: 55% European, 35% Amerindian and 10% African
- Corach et al.,. 2010, Annals of Human Genetics: 78.5% European, 17.3% Amerindian, and 4.2% African ancestry.[192]
- Oliveira, 2008, on Universidade de Brasília: 60% European, 31% Amerindian and 9% African.[160]
- National Geographic: 61% Caucasian (52% European + 9% Middle East/North Africa), 27% Amerindian and 9% African.[218]
Bolivia
[edit]This section needs expansion. You can help by adding to it. (June 2008) |
White people in Bolivia are classified as 5% of the nation's population.[69] The white population consists mostly of criollos, which consist of families of unmixed Spanish ancestry descended from the Spanish colonists and Spanish refugees fleeing the 1936–1939 Spanish Civil War.[citation needed] These two groups have constituted much of the aristocracy since independence. Other groups within the white population are Germans, who founded the national airline Lloyd Aéreo Boliviano, as well as Italians, Americans, Basques, Croats, Russians, Polish, English, Irish, and other minorities, many of whose members descend from families that have lived in Bolivia for several generations.[citation needed]
Comparatively, Bolivia experienced far less immigration than its South American neighbors.[citation needed]
Brazil
[edit]
Brazil is one of the few countries in Latin America that includes racial categories in its censuses: Branco (White), Negro (Black), Pardo (Multiracial), Amarelo (Yellow) and Indígena (Amerindian), with categorization being by self-identification. Taking into account the data provided by the last National Household Survey, conducted in 2010, Brazil would possess the most numerous white population in Latin America, given that a 47.7% – 91 million people – of Brazilians self-declared as "Brancos".[3] Comparing this survey with previous censuses, a slow but constant decrease in the percentage of self-identified white Brazilians can be seen: in the 2000 Census it was 53.7%,[220][221] in the 2006 Household Survey it was 49.9%,[222] and in the last, 2008, survey it decreased to the current 48.4%.[223] Some analysts believe that this decrease is evidence that more Brazilians have come to appreciate their mixed ancestry, re-classifying themselves as "Pardos".[224] Furthermore, some demographers estimate that a 9% of the self-declared white Brazilians have a certain degree of African and Amerindian ancestry, which, if the "one-drop rule" were applied, would classify them as "Pardos".[225]
The white Brazilian population is spread throughout the country, but it is concentrated in the four southernmost states, where 79.8% of the population self-identify as white.[222] The states with the highest percentage of white people are Santa Catarina (86.9%), Rio Grande do Sul (82.3%), Paraná (77.2%) and São Paulo (70.4%). Another five states that have significant proportions of whites are Rio de Janeiro (55.8%), Mato Grosso do Sul (51.7%), Espírito Santo (50.4%), Minas Gerais (47.2%) and Goiás (43.6%). São Paulo has the largest population in absolute numbers with 30 million whites.[226]
In the 18th century, an estimated 600,000 Portuguese arrived, including wealthy immigrants, as well as poor peasants, attracted by the Brazil Gold Rush in Minas Gerais.[227] By the time of Brazilian independence, declared by emperor Pedro I in 1822, an estimated 600,000 to 800,000 Europeans had come to Brazil, most of them male settlers from Portugal.[228][229] Rich immigrants who established the first sugarcane plantations in Pernambuco and Bahia, and New Christians and Gypsies fleeing from religious persecution, were among the early settlers.
After independence, Brazil saw several campaigns to attract European immigrants, which were prompted by a policy of Branqueamento (Whitening).[46] During the 19th century, the slave labor force was gradually replaced by European immigrants, especially Italians.[230] This mostly took place after 1850, as a result of the end of the slave trade in the Atlantic Ocean and the growth of coffee plantations in the São Paulo region.[231][232] European immigration was at its peak between the mid-19th and the mid-20th centuries, when nearly five million Europeans immigrated to Brazil, most of them Italians (58.5%), Portuguese (20%), Germans, Spaniards, Poles, Lithuanians, and Ukrainians. Between 1877 and 1903, 1,927,992 immigrants entered Brazil, an average of 71,000 people per year, with the peak year being 1891, when 215,239 Europeans arrived.[230]
After the First World War, the Portuguese once more became the main immigrant group, and Italians fell to third place. Spanish immigrants rose to second place because of the poverty that was affecting millions of rural workers.[233] Germans were fourth place on the list; they arrived especially during the Weimar Republic, due to poverty and unemployment caused by the First World War.[234] The numbers of Europeans of other ethnicities increased; among them were people from Poland, Russia, and Romania, who emigrated in the 1920s, probably because of politic persecution. Other peoples emigrated from the Middle East, especially from what now are Syria and Lebanon.[230] During the period 1821–1932, Brazil received an estimated 4,431,000 European immigrants.[48]
After the end of the Second World War, European immigration diminished significantly, although between 1931 and 1963 1.1 million immigrants entered Brazil, mostly Portuguese.[230] By the mid-1970s, some Portuguese immigrated to Brazil after the independence of Portugal's African colonies—from Angola, Mozambique and Guinea-Bissau.[235][236]
Genetic studies
[edit]A 2019 autosomal genetic study analysed the genetic structure of the three principal ethnic groups in six capitals of Brazil (9,333 individuals), and the contribution of parental populations to its genetic pool.[237]
| Self-reported ancestry[237] | European | African | Native American |
|---|---|---|---|
| White | 81.8% | 8.3% | 9.4% |
| Brown (Pardo) | 59.0% | 26.4% | 11.4% |
| Black | 30.1% | 56.4% | 9.0% |
A 2015 autosomal genetic study, which also analysed data of 25 studies of 38 different Brazilian populations, concluded the following: "European (EUR) ancestry is the major contributor to the genetic background of Brazilians, followed by African (AFR), and Amerindian (AMR) ancestries. The pooled ancestry contributions were 0.62 EUR, 0.21 AFR, and 0.17AMR. The Southern region had a greater EUR contribution (0.77) than other regions. Individuals from the Northeast (NE) region had the highest AFR contribution (0.27) whereas individuals from the North regions had more AMR contribution (0.32)".[53]
An autosomal study from 2013, of nearly 1,300 samples from all regions of Brazil, found predominantly European ancestry, combined with African and Native American contributions in varying degrees:
Following an increasing North to South gradient, European ancestry was the most prevalent in all urban populations (with values up to 74%). The populations in the North consisted of a significant proportion of Native American ancestry that was about two times higher than the African contribution. Conversely, in the Northeast, Center-West and Southeast, African ancestry was the second most prevalent. At an intrapopulation level, all urban populations were highly admixed, and most of the variation in ancestry proportions was observed between individuals within each population rather than among population.[238]
According to a genetic study about Brazilians (based upon about 200 samples), on the paternal side, 98% of the white Brazilian Y Chromosome comes from a European male ancestor, only 2% from an African ancestor and there is a complete absence of Amerindian contributions. On the maternal side, 39% have European Mitochondrial DNA, 33% Amerindian and 28% African female ancestry. This, considering the facts that the slave trade was effectively suppressed in 1850, and that the Amerindian population had been reduced to small numbers even earlier, shows that at least 61% of white Brazilians had at least one ancestor living in Brazil before the beginning of the Great Immigration. This analysis, however, only shows a small fraction of a person's ancestry (the Y Chromosome comes from a single male ancestor and the mtDNA from a single female ancestor, while the contributions of the many other ancestors is not specified).[239]
According to a genetic research by the University of Brasília, Brazilian genetic admixture consists in a 65.9% European, 24.8% African, and 9.3% Amerindian ancestry.[160]
According to another study, those who identified as whites in Rio de Janeiro turned out to have 86.4% European ancestry on average.[240]
Chile
[edit]Various autosomal studies have shown the following admixture in Chile:
- 67.9% European; 32.1% amerindian; (Valenzuela, 1984): Marco de referencia sociogenético para los estudios de salud pública en Chile, fuente: Revista Chilena de Pediatría.[241][242]
- 64.0% European; 35.0% amerindian; (Cruz-Coke, 1994): Genetic epidemiology of single gene defects in Chile, fuente: Universidad de Chile.[243]
- 57.2% European; 38.7% amerindian; 2.5% African; 1.7% Asiatic; (Homburger et al., 2015): Genomic Insights into the Ancestry and Demographic History of South America, fuente: PLOS Genetics.[244]
A 2015 autosomal DNA study found Chile to be 55.16% European, 42.38% Native American and 2.44% African, using LAMP-LD modeling; and 54.38% European, 43.22% Native American, and 2.40% African, using RFMix.[245] An autosomal DNA study from 2014 found the results to be 51.85% (± 5.44%) European, 44.34% (± 3.9%) Native American, and 3.81% (± 0.45%) African.[246][247]
A Chilean researcher in 2015 stated that "there are no Chileans without Amerindian or European ancestry".[248] She also added that the average ancestry was 51% European, 44% Amerindian and 3% African, and that in the upper classes the average Amerindian ancestry was 35.2%.
Studies estimates the white population at 20%,[249] to 60% of the Chilean population.[2] According to genetic research by the University of Brasília, Chilean genetic admixture consists of 51.6% European, 42.1% Amerindian, and 6.3% African ancestry.[160] According to an autosomal genetic study of 2014 carried out among soldiers in the city of Arica, Northern Chile, the European admixture goes from 56.8% in soldiers born in Magallanes to 41.2% for the ones who were born in Tarapacá.[250] According to a study from 2013, conducted by the Candela Project in Northern Chile as well, the genetic admixture of Chile is 52% European, 44% Native American, and 4% African.[251]
According to a study performed in 2014,[252] 37.9% of Chileans self-identified as white, a subsequent DNA tests showed that the average self identifying white was genetically 54% European.
Genotype and phenotype in Chileans vary according to social class. 13% of lower-class Chileans have at least one non-Spanish surname, compared to 72% of those who belong to the upper-middle-class.[253] Phenotypically, only 9.6% of lower-class girls have light-colored eyes—either green or blue—where 31.6% of upper-middle-class girls have such eyes.[253] Blonde hair is present in 2.2% and 21.3%, of lower-class and upper-middle girls respectively,[253] whilst black hair is more common among lower-class girls (24.5%) than upper-middle class ones (9.0%).[253]
Chile was initially an unattractive place for migrants, because it was far from Europe and relatively difficult to reach. However, during the 18th century an influx of emigrants from Spain moved to Chile. They were mostly Basques, who rose rapidly up the social ladder, becoming part of the political elite that still dominates the country.[254][255] An estimated 1.6 million (10%) to 3.2 million (20%) Chileans have a surname (one or both) of Basque origin.[256][257][258][259][260][261][262][263] The Basques liked Chile because of its similarity to their native land: cool climate, with similar geography, fruits, seafood, and wine.[255]
The Spanish was the most significant European immigration to Chile,[264] although there was never a massive immigration, such as happened in neighboring Argentina and Uruguay,[265] and, therefore, the Chilean population wasn't "whitened" to the same extent.[265] However, it is undeniable that immigrants have played a role in Chilean society.[265] Between 1851 and 1924, Chile received only 0.5% of the total European immigration to Latin America, compared to 46% for Argentina, 33% for Brazil, 14% for Cuba, and 4% for Uruguay.[264] This was because such migrants came across the Atlantic, not the Pacific, and before the construction of the Panama Canal,[264] Europeans preferring to settle in countries close to their homelands, instead of taking the long route through the Straits of Magellan or across the Andes.[264] In 1907, the European-born reached a peak of 2.4% of the Chilean population,[266] decreasing to 1.8% in 1920,[267] and 1.5% in 1930.[268]
About 5% of the Chilean population has some French ancestry.[269] Over 700,000 (4.5%) Chileans may be of British (English, Scottish and Welsh) or Irish origin.[270] Another significant immigrant group is Croatian. The number of their descendants today is estimated to be 380,000, or 2.4% of the population.[271][272] Other authors claim that close to 4.6% of the Chilean population must have some Croatian ancestry.[273]
After the failed liberal revolution of 1848 in the German states,[265][274] a significant German immigration took place, laying the foundation for the German-Chilean community. Sponsored by the Chilean government, to "unbarbarize" and colonize the southern region,[265] these Germans (including German-speaking Swiss, Silesians, Alsatians, Austrians, and Sudeten Germans) settled mainly in Valdivia, Llanquihue, Chiloé, and Los Ángeles.[275][276][277] The Chilean Embassy in Germany estimated that 150,000 to 200,000 Chileans are of German origin.[278][279] Like the Basques, the German settlers liked Chile, especially the south area, because they found climate and geography to be very similar to their own land.
Colombia
[edit]According to the 2005 Census 86% of Colombians are considered either White or Mestizo, which are not categorized separately. Though the census does not identify the number of white Colombians, most sources estimate whites to make up 20% of the population,[2] while Hudson and Schwartzman put that figure at 37% of the population,[34] forming the second largest racial group after Mestizo Colombians (at 49-60%).[280] A genetic study by Rojas et al. estimates that the ancestral composition of Colombians is about 47% Amerindian, 42% European, and 11% African.[55]
Between 1540 and 1559, 8.9 percent of the residents of Colombia were of Basque origin. It has been suggested that the present day incidence of business entrepreneurship in the region of Antioquia is attributable to the Basque immigration and character traits. Today many Colombians of the Department of Antioquia region preserve their Basque ethnic heritage. In Bogota, there is a small district/colonies of Basque families who emigrated as a consequence of Spain's Civil War or because of better opportunities.[281] Basque priests were the ones that introduced handball into Colombia. Basque immigrants in Colombia were devoted to teaching and public administration. In the first years of the Andean Multinational Company, Basque sailors navigated as captains and pilots on the majority of the ships until the country was able to train its own crews.[282]
The first and largest wave of immigration from the Middle East began around 1880, and continued during the first two decades of the twentieth century. The immigrants were mainly Maronite Christians from Greater Syria (Syria and Lebanon) and Palestine, fleeing those then Ottoman territories.[283] Syrians, Palestinians, and Lebanese have continued to settle in Colombia. Due to a lack of information, it is impossible to know the exact number of Lebanese and Syrians that immigrated to Colombia; but for 1880 to 1930, 5,000–10,000 is estimated. Syrians and Lebanese are perhaps the biggest immigrant group next to the Spanish since independence. Those who left their homeland in the Middle East to settle in Colombia left for different religious, economic, and political reasons. In 1945, Barranquilla, Cartagena, Cali, and Bogota are the cities with the largest numbers of Arabic-speakers in Colombia.[284] The Arabs that went to Maicao were mostly Sunni Muslim, with some Druze and Shiites, as well as Orthodox and Maronite Christians. The mosque of Maicao is the second largest mosque in Latin America. Middle Easterners are generally called Turcos (Turkish), a term derived from the fact that they arrived from the Ottoman Empire and held Turkish passports.[283]
In December 1941, the United States government estimated that there were 4,000 Germans living in Colombia. There were some Nazi agitators in Colombia, such as Barranquilla businessman Emil Prufurt. Colombia invited Germans who were on the U.S. blacklist to leave.[285] SCADTA, a Colombian-German air transport corporation, which was established by German immigrants in 1919, was the first commercial airline in the western hemisphere.[286] In recent years, the celebration of Colombian-German heritage has grown increasingly popular in Bogota, Cartagena, and Bucaramanga. There are many annual festivals that focus German cuisine, specially pastry arts and beer. Since 2009, there has been a considerable increase in collaborative research through advanced business and educational exchanges, such as those promoted by COLCIENCIAS and AIESEC. There are many Colombian-German companies focused on finance, science, education, technology and innovation, and engineering.[287]
Ecuador
[edit]According to the most recent 2022 National Population census, 2.2% or 374,925 of the population identified as white, down from 2010, where 6.1% of the population self-identified as such, and down from 10.5% in 2001.[76][288] In Ecuador, being white is more an indication of social class than of ethnicity. Classifying oneself as white is often done to claim membership to the middle class and to distance oneself from the lower class, which is associated being "Indian". For this reason the status of blanco is claimed by people who are not primarily of European heritage.[289] According to genetic research done in 2008 by the University of Brasília, the average Ecuadorian genetic admixture is 64.6% Amerindian, 31.0% European, and 4.4% African.[160] In 2015, another study showed the average Ecuadorian is estimated to be 52.96% Amerindian, 41.77% European, and 5.26% Sub-Saharan African overall.[290]
White Ecuadorians, mostly criollos, are descendants of Spanish colonists and also Spanish refugees fleeing the 1936–1939 Spanish Civil War. Most still hold large amounts of lands, mainly in the northern Sierra, and live in Quito or Guayaquil. There is also a large number of white people in Cuenca, a city in the southern Andes of Ecuador, due to the arrival of Frenchmen in the area, who came to measure the arc of the Earth. Cuenca, Loja, and the Galápagos attracted German immigration during the early 20th century. The Galápagos also had a small Norwegian fishing community until they were asked to leave. There are large populations of Italian, French, German, Basque, Portuguese, and Greek descent, as well as a small Ecuadorian Jewish population. Ecuador's Jews consists of Sephardic Jews arriving in the South of the country in the 16th and 17th centuries and Ashkenazi Jews during the 1930s in the main cities of Quito and Cuenca.[291]
Paraguay
[edit]Ethnically, culturally, and socially, Paraguay has one of the most homogeneous populations in South America. Because of José Gaspar Rodríguez de Francia's 1814 policy that no Spaniards and other Europeans could intermarry among themselves (they could only marry blacks, mulattoes, mestizos or the native Guaraní), a measure taken to avoid a white majority occurring in Paraguay (De Francia believed that all men were equal as well), it was within little more than one generation that most of the population were of mixed racial origin.[citation needed]
The exact percentage of the white Paraguayan population is not known because the Paraguayan census does not include racial or ethnic identification, save for the indigenous population,[292] which was 1.7% of the country's total in the 2002 census.[293] Other sources estimate the sizes of other groups, the mestizo population being estimated at 95% by the CIA World Factbook, with all other groups totaling 5%.[294][295] Thus, whites and the remaining groups (such as those of African descent) make up approximately 3.3% of the total population. According to Carlos Pastore, 30% are white and 70% approximately is mestizo.[13] Such a reading is complicated, because, as elsewhere in Latin America, "white" and "mestizo" are not mutually exclusive (people may identify as both).
Due to the European migration in the 19th and 20th centuries, the majority of Paraguay's white population are of German descent (including Mennonites), with others being of French, Italian, Spanish, and Portuguese descent.[296] Many are southern and southeastern Brazilians (brasiguayos), as well as Argentines and Uruguayans, and their descendants.[296] People from such regions are generally descendants of colonial settlers and/or more recent immigrants.[296]
In 2005, 600 families of Volga Germans who migrated to Germany after the fall of the Soviet Union, re-migrated and established a new colony, Neufeld, near Yuty (Caazapá Department), in southeastern Paraguay.[297]
Peru
[edit].jpg)
According to the 2017 census 5.9% or 1.3 million people self-identified as white of the population. This was the first time the census had asked an ancestral identity question. The highest proportion was in the La Libertad Region with 10% identifying as white.[86] They are descendants primarily of Spanish colonists, and also of Spanish refugees fleeing the Spanish Civil War. After World War II, many German refugees fled to Peru and settled in large cities, while others descend from Italian, French (mainly Basques), Austrian or German, Portuguese, British, Russians and Croatian immigrant families.
The regions with the highest proportion of self-identified whites were in La Libertad Region (10.5%), Tumbes Region and Lambayeque Region (9.0% each), Piura Region (8.1%), Callao (7.7%), Cajamarca Region (7.5%), Lima Province (7.2%) and Lima Region (6.0%).[86][298]
According to a genetic research in 2020, Peruvian genetic admixture indicates 63,7% Amerindian, 29,6% European, 4,8% African ancestry and 2,9% Asian.[299]
| White population by region, 2017[86] | |||||
|---|---|---|---|---|---|
| Region | Population | Percent | |||
| La Libertad | 144,606 | 10.5% | |||
| Tumbes | 15,383 | 9.0% | |||
| Lambayeque | 83,908 | 9.0% | |||
| Piura | 114,682 | 8.1% | |||
| Callao | 61,576 | 7.7% | |||
| Cajamarca | 76,953 | 7.5% | |||
| Lima Province | 507,039 | 7.2% | |||
| Lima | 43,074 | 6.0% | |||
| Ica | 38,119 | 5.8% | |||
| Ancash | 49,175 | 5.8% | |||
| Arequipa | 55,093 | 4.9% | |||
| Amazonas | 12,470 | 4.4% | |||
| Huánuco | 24,130 | 4.4% | |||
| San Martín | 24,516 | 4.0% | |||
| Moquegua | 5,703 | 4.0% | |||
| Pasco | 7,448 | 3.8% | |||
| Junín | 34,700 | 3.6% | |||
| Madre de Dios | 3,444 | 3.3% | |||
| Tacna | 8,678 | 3.2% | |||
| Ucayali | 8,283 | 2.3% | |||
| Ayacucho | 9,516 | 2.0% | |||
| Huancavelica | 5,222 | 2.0% | |||
| Loreto | 11,884 | 1.9% | |||
| Cusco | 12,458 | 1.3% | |||
| Apurímac | 3,034 | 1.0% | |||
| Puno | 5,837 | 0.6% | |||
| Republic of Peru | 1,336,931 | 5.9% | |||
Uruguay
[edit]Uruguay's population has a strong European heritage, resulting in a large white majority. A 2009 DNA study in the American Journal of Human Biology showed the genetic composition of Uruguay as primarily European, with Native American ancestry ranging from one to 20 percent and sub-Saharan African from seven to 15 percent, depending on the region.[300]
Between the mid-19th and mid-20th centuries, Uruguay experienced major waves of immigration from Europe. Most immigrants were Spanish, Italian, and French, leaving a lasting impact on the country's culture, demographics and society.[301] Swiss, British and Portuguese immigrants also arrived, along with smaller numbers of Russians, Germans, Lithuanians, Poles, and other ethnic groups from Central and Eastern Europe.[302][303] As a result, Uruguayan culture gradually developed a distinctly European character, especially in its architecture, cuisine, social customs, and urban life.[304]
The demographic impact of these migratory waves was profound. Uruguay's population grew from approximately 70,000 inhabitants in 1830 to 450,000 by 1875, and reached one million by 1900—an almost fourteen-fold increase in just seventy years.[305] Between 1840 and 1890, between 50% and 60% of Montevideo's residents were foreign-born, most of them from Europe. The 1860 census showed that 35% of the national population consisted of foreigners, although by 1908 this proportion had declined to 17%, with Italians accounting for 34% and Spaniards 30% of that group.[306][307]
Between 1996 and 1997, Uruguay's National Statistics Institute (INE) surveyed 40,000 households on racial identity, based on self-identification. Extrapolating the results, the INE estimated that of 2.79 million people, 93.2% identified as white, 5.9% as fully or partially Black, 0.4% as fully or partially Amerindian, and around 12,000 as Asian.[308] In 2006, a new survey focused on ancestry rather than race, showing a decrease in self-declared "pure whites," also reflecting greater recognition of diverse heritage. Data shows that 2,897,525 respondents (87.4%) reported exclusively white ancestry.[309]
According to the 2023 census, 88% of the population identifies as white.[310]
Venezuela
[edit]According to the official Venezuelan census, although "white" literally involves external issues such as light skin, shape and color of hair and eyes, among others, the term "white" has been used in different ways in different historical periods and places, so its precise definition is somewhat confusing.[7] Though the 2011 Venezuelan Census states that "White" in Venezuela is used to describe the Venezuelans of European origin.[311]
According to the 2011 National Population and Housing Census, 43.6% of the population identified themselves as white people.[7] A genomic study shows that about 60.6% of the Venezuelan gene pool has European origin. Among the countries in the study (Argentina, Bahamas, Brazil, Chile, Costa Rica, Colombia, El Salvador, Ecuador, Jamaica, Mexico, Peru, Puerto Rico, and Venezuela), Colombia, Brazil, Venezuela, and Argentina exhibit the highest European contribution.[160]
The Venezuelan gene pool indicates a 60.6% European, 23.0% Amerindian, and 16.3% African ancestry.[160] Spaniards were introduced into Venezuela during the colonial period. Most of them were from Andalusia, Galicia, Basque Country and from the Canary Islands. Until the last years of World War II, a large part of European immigrants to Venezuela came from the Canary Islands, and their cultural impact was significant, influencing its gastronomy, customs and the development of Castilian in the country. With the beginning of oil production during the first decades of the 20th century, employees of oil companies from the United States, United Kingdom, and the Netherlands established themselves in Venezuela. Later, in the middle of the century, there was a new wave of immigrants originating from Spain (mainly from Galicia, Andalucia, and Basque country, some being refugees from the Spanish Civil War), Italy (mainly from southern Italy and the Veneto region), and Portugal (from Madeira), as well as from Germany, France, England, Croatia, the Netherlands, and other European countries encouraged by a welcoming immigration policy to a prosperous, rapidly developing country where educated and skilled immigrants were needed.[citation needed]
Representation in the media
[edit]Some media outlets in the United States have criticized Latin American media for allegedly featuring a disproportionate number of blond and blue-eyed actors and actresses in telenovelas, relative to the overall population.[312][313][314][315]
See also
[edit]- Afro-Latin Americans
- Asian Latin Americans
- Blanqueamiento
- Carcamano
- Castizo
- European diaspora
- Indigenous peoples of the Americas
- Latin Americans
- Mestizo
- Mulatto
- Peninsulares
- Race and ethnicity in Latin America
- Racism in South America
- Spanish colonization of the Americas
- Portuguese colonization of the Americas
References
[edit]- ^ a b CIA data from The World Factbook's Field Listing :: Ethnic groups and Field Listing :: Population, retrieved on May 09 2011. They show 191,543,213 whites from a total population of 579,092,570. For a few countries the percentage of white population is not provided as a standalone figure, and thus that datum is considered to be not available; for example, in Chile's case the CIA states "white and white-Amerindian 95.4%". Unequivocal data are given for the following: Argentina 41,769,726 * 97% white = 40,516,634; Bolivia 10,118,683 * 5% white = 505,934; Brazil 203,429,773 * 53.7% white = 109,241,788; Colombia 44,725,543 * 20% white = 8,945,109; Cuba 11,087,330 * 65.1% white = 7,217,852; Dominican Republic 9,956,648 * 16% white = 1,593,064; El Salvador 6,071,774 * 9% white = 546,460; Honduras 8,143,564 * 1% white = 81,436; Mexico 113,724,226 * 9% white = 10,235,180; Nicaragua 5,666,301 * 17% white = 963,272; Panama 3,460,462 * 10% white = 346,046; Peru 29,248,943 * 15% white = 4,387,342; Puerto Rico 3,989,133 * 76.2% white = 3,039,719; Uruguay 3,308,535 * 88% white = 2,911,511. Total white population in these countries: 191,543,213, i.e 33.07% of the region's population.
- ^ a b c d e f g h i j k l m n o p q r s t u v w x Fernández, Francisco Lizcano (2007). Composición Étnica de las Tres Áreas Culturales del Continente Americano al Comienzo del Siglo XXI. Universidad Autónoma del Estado de México. ISBN 978-970-757-052-8.
- ^ a b c "Censo Demográfico 2010: Características gerais da população, religião e pessoas com deficiência" [Census 2010: general characteristics of the population, religion and people with disabilities]. Instituto Brasileiro de Geografia e Estatística (in Portuguese). 2010. Retrieved 7 October 2016.
- ^ a b Approximately two fifths"Mexico: Ethnic groups". Encyclopædia Britannica. Retrieved September 8, 2025.
- ^ "21 de Marzo: Día Internacional de la Eliminación de la Discriminación Racial" [March 21: International Day for the Elimination of Racial Discrimination] (PDF) (in Spanish). Mexico: CONAPRED. 2017. p. 7. Archived (PDF) from the original on May 25, 2017. Retrieved August 23, 2017.
- ^ "Encuesta Nacional Sobre Discriminación en Mexico 2010" [National Survey on Discrimination in Mexico 2010] (PDF) (in Spanish). Mexico: CONAPRED. June 2011. Archived (PDF) from the original on November 8, 2012. Retrieved August 24, 2017.
- ^ a b c d "Resultado Básico del XIV Censo Nacional de Población y Vivienda 2011 (Mayo 2014)" (PDF). Ine.gov.ve. p. 29. Retrieved 8 September 2014.
- ^ a b "DEMOGRÁFICOS: Censos de Población y Vivienda". Ine.gov.ve. Retrieved 8 October 2017.
- ^ a b c d e f g h "Raza/Etnia a la que pertenece". Latinobarómetro 2023 Colombia. Retrieved 13 February 2024.
- ^ "Censo de Población y Viviendas de Cuba de 2012" (PDF). almendron. 2016. Retrieved 24 October 2024.
- ^ "Perú: Perfil Sociodemográfico" (PDF). Instituto Nacional de Estadística e Informática. p. 214. Retrieved 5 February 2020.
- ^ "Uruguay: People and Society". CIA World Factbook. Retrieved 5 February 2014.
- ^ a b Pastore, Carlos (1972). La lucha por la tierra en el Paraguay: Proceso histórico y legislativo. Antequera. p. 526.
- ^ a b c d "REPÚBLICA DOMINICANA: Población de 12 años y más, por percepción del informante acerca de las facciones, color de piel y otras características culturales de los miembros del hogar, según región, provincia y grupos de edades". one.gob.do. 30 September 2024. Retrieved 19 October 2024.
- ^ a b c d "2020 Census Illuminates Racial and Ethnic Composition of the Country". United States Census. Retrieved 17 August 2021.
- ^ "El Salvador-The World Factbook". CIA.gov. Retrieved 23 July 2021.
- ^ a b Nuñez, Carolina; Baeta, Miriam; Sosa, Cecilia; Casalod, Yolanda; Ge, Jianye; Budowle, Bruce; Martínez-Jarreta, Begoña (December 2010). "Reconstructing the population history of Nicaragua by means of mtDNA, Y-chromosome STRs, and autosomal STR markers". American Journal of Physical Anthropology. 143 (4): 591–600. doi:10.1002/ajpa.21355. PMID 20721944.
- ^ "Honduras; People; Ethnic groups". CIA World Factbook. Retrieved 2007-11-21.
- ^ 2.2% or 374,925 of the Ecuadorian population identified as white in the 2022 census.
- ^ "Ecuador: Censo de Población y Vivienda 2022" (PDF). censoecuador.gob.ec. 21 September 2023. Archived (PDF) from the original on 12 November 2023. Retrieved 22 October 2024.
- ^ José Reyes Alveo. "Población panameña (página 2)". Monografias.com. Retrieved 8 October 2017.
- ^ a b c d CIA World Factbook : Haiti.
- ^ More precisely, these are the chief languages of Latin America, as per CIA – The World Factbook – Field Listing :: Languages, accessed 2010-02-24.
- ^ The religious profile of the Latin American countries can be seen in CIA – The World Factbook – Field Listing :: Religions (accessed 2010-02-24). As such, it is not the religious profile of white Latin Americans in particular, but is a good indication of white religious affiliation in the region's white-majority countries, especially.
- ^ Grosfoguel, Ramón; Maldonado-Torres, Nelson; Saldívar, José David (April 15, 2006). "Latin@s in the World-System: Decolonization Struggles in the 21st Century U.S. Empire". dlcl.stanford.edu.
Latino/as are multiracial (Afro-Latinos, Indo-Latinos, Asian-Latinos, and Euro-Latinos)
- ^ Various (2001). "Introduction". In Agustín Laó-Montes and Arlene Dávila (ed.). Mambo Montage: The Latinization of New York City. Columbia University Press.
For instance, in the global chain of otherness, upper-class Euro-Latinos can be located... (p. 10)
- ^ Chambers, Sarah C. (2003). "Little Middle Ground The Instability of a Mestizo Identity in the Andes, 18th and 19th centuries". In Nancy P. Appelbaum (ed.). Race and Nation in Modern Latin American. University of North Carolina Press.
This blending of culture and genealogy is also reflected in the use of the terms "Spanish" and "white". For most of the colonial period, Americans of European descent were simply referred to as "Spaniards"; beginning in the late 18th century, the term "blanco" (white) came into increasing but not exclusive use. Even those of presumably mixed ancestry may have felt justified in claiming to be Spanish (and later white) if they participated in the dominant culture by, for example, speaking Spanish and wearing European clothing.(p. 33)
- ^ a b South America: Postindependence overseas immigrants. Encyclopædia Britannica Retrieved 26-11-2007
- ^ Schrover, Marlou. "Migration to Latin America". Retrieved 2010-02-24.[permanent dead link]
- ^ CELADE (Organization) (2001). International migration and development in the Americas. Naciones Unidas, CEPAL/ECLAC, Population Division, Latin American and Caribbean Demographic Centre (CELADE). ISBN 978-92-1-121328-7.
- ^ Lizcano Fernández, Francisco (2004). "Las etnias centroamericanas en la segunda mitad del siglo XX". Revista Mexicana del Caribe. 9 (17): 7–43. Gale A466617637.
- ^ Schaefer, Richard T., ed. (2008). Encyclopedia of Race, Ethnicity and Society. Sage. p. 900. ISBN 978-1-4129-2694-2.
In New Spain, there was no strict idea of race (something that continued in Mexico). The Indians that had lost their connections with their communities and had adopted different cultural elements could "pass" and be considered mestizos. The same applied to blacks and castas. Rather, the factor that distinguished the various social groups was their calidad ("quality"); this concept was related to an idea of blood as conferring status, but there were also other elements, such as occupation and marriage, that could have the effect of blanqueamiento (whitening) on people and influence their upward social mobility.
- ^ Schaefer, Richard T., ed. (2008). Encyclopedia of Race, Ethnicity and Society. Sage. p. 1096. ISBN 978-1-4129-2694-2.
The variation of racial groupings between nations is at least partially explained by an unstable coupling between historical patterns of colonization and miscegenation. First, divergent patterns of colonization may account for differences in the construction of racial groupings, as evidenced in Latin America, which was colonized primarily by the Spanish. The Spanish colonials had a longer history of tolerance of non-White racial groupings through their interactions with the Moors and North African social groups, as well as a different understanding of the rights of colonized subjects and a different pattern of economic development.
- ^ a b Schwartzman, Simon (2008). "Etnia, condiciones de vida y discriminacion" (PDF). In Valenzuela, Eduardo; Schwartzman, Simón; Biehl, Andrés; Valenzuela, J. Samuel (eds.). Vínculos, Creencias e Ilusiones: La cohesión social de los Latinoamericanos. Uqbar Editores. ISBN 978-956-8601-17-1.
- ^ Chambers, Sarah C. (2003). "Little Middle Ground The Instability of a Mestizo Identity in the Andes, 18th and 19th centuries". In Nancy P. Appelbaum (ed.). Race and Nation in Modern Latin American. University of North Carolina Press.
This blending of culture and genealogy is also reflected in the use of the terms Spanish and white. For most of the colonial period, Americans of European descent were simply referred to as Spaniards; beginning in the late 18th century, the term blanco (white) came into increasing but not exclusive use. Even those of presumably mixed ancestry may have felt justified in claiming to be Spanish (and later white) if they participated in the dominant culture by, for example, speaking Spanish and wearing European clothing.(p. 33)
- ^ Wade, Peter (1997). Race And Ethnicity In Latin America. Pluto Press. p. 15. ISBN 978-0-7453-0987-3.
- ^ Levine-Rasky, Cynthia. 2002. "Working through whiteness: international perspectives. SUNY Press (p. 73) " 'Money whitens' If any phrase encapsulates the association of whiteness and the modern in Latin America, this is it. It is a cliché formulated and reformulated throughout the region, a truism dependent upon the social experience that wealth is associated with whiteness, and that in obtaining the former one may become aligned with the latter (and vice versa)."
- ^ IBGE. "IBGE - sala de imprensa - notícias". ibge.gov.br.
- ^ Do pensamento racial ao pensamento racional Archived May 22, 2014, at the Wayback Machine, laboratoriogene.com.br.
- ^ Wade, Peter (2008). "Race in Latin America". In Poole, Deborah (ed.). Companion to Latin American Anthropology. Blackwell publishing. p. 182. ISBN 978-0-631-23468-5.
The nature of Latin American societies as mestizo – with the variations that run from Argentina, where the image of mixture is downplayed in favor of whiteness, to Brazil or Mexico, where mixture is foregrounded in discourse on the nation – has powerfully shaped ideas about race in the region.
- ^ "Sample Chapter for Telles, E.E.: Race in Another America: The Significance of Skin Color in Brazil". princeton.edu. Archived from the original on 2012-01-25. Retrieved 2011-12-05.
- ^ The Japanese in multiracial Peru, 1899-1942. eScholarship (Thesis). UC San Diego. 2009.
- ^ Wade, Peter (2008). "Race in Latin America". In Poole, Deborah (ed.). Companion to Latin American Anthropology. Blackwell publishing. p. 184.
However, "black" and "indigenous" are often vaguely defined and there is an indecisive, subjective distinction between them and "mixed" and between the latter and "white" (hence the problems of enumerating these populations).
- ^ Tereixa Constenla (29 May 2012). "The women who made America". El Pais. Retrieved 19 September 2022.
- ^ "L'emigració dels europeus cap a Amèrica" [The Emigration of Europeans to America] (PDF). EduAlter.org (in Catalan). Archived from the original (PDF) on 8 November 2017. Retrieved 26 March 2018.
- ^ a b Ideologia do Branqueamento - Racismo á Brasileira? por Andreas Haufbauer
- ^ Loveman, Mara (5 December 2009). "Whiteness in Latin America: measurement and meaning in national censuses (1850-1950)". Journal de la société des américanistes. 95 (95–2): 207–234. doi:10.4000/jsa.11085.
- ^ a b Argentina. by Arthur P. Whitaker. New Jersey: Prentice Hall Inc, 1984. Cited in Yale immigration study
- ^ The Cry of My People. Out of Captivity in Latin America, escrita por Esther and Mortimer Arias. Editorial New York Friendship Press. 1980. Páginas 17 y 18.
- ^ Landers, Jane (1999). Black society in Spanish Florida. University of Illinois Press. p. 29. ISBN 0-252-06753-3.
- ^ a b c d Kirkegaard, Fuerst et (March 2016). "Admixture in the Americas: Regional and National Differences" [Admixture in the Americas: Regional and National Differences]. ResearchGate. 56: 366.
- ^ Taboada-Echalar, Patricia; Álvarez-Iglesias, Vanesa; Heinz, Tanja; Vidal-Bralo, Laura; Gómez-Carballa, Alberto; Catelli, Laura; Pardo-Seco, Jacobo; Pastoriza, Ana; Carracedo, Ángel; Torres-Balanza, Antonio; Rocabado, Omar; Vullo, Carlos; Salas, Antonio (2013). "The Genetic Legacy of the Pre-Colonial Period in Contemporary Bolivians". PLOS ONE. 8 (3) e58980. Bibcode:2013PLoSO...858980T. doi:10.1371/journal.pone.0058980. PMC 3604014. PMID 23527064.
- ^ a b Moura, RR; Coelho, AV; Balbino Vde, Q; Crovella, S; Brandão, LA (2015). "Meta-analysis of Brazilian genetic admixture and comparison with other Latin America countries". American Journal of Human Biology. 27 (5): 674–680. doi:10.1002/ajhb.22714. hdl:11368/2837176. PMID 25820814. S2CID 25051722.
- ^ Eyheramendy, Susana; Martinez, Felipe I.; Manevy, Federico; Vial, Cecilia; Repetto, Gabriela M. (17 March 2015). "Genetic structure characterization of Chileans reflects historical immigration patterns". Nature Communications. 6 (1): 6472. Bibcode:2015NatCo...6.6472E. doi:10.1038/ncomms7472. PMC 4382693. PMID 25778948.
- ^ a b "Genetic Make Up and Structure of Colombian Populations by Means of Uniparental and Biparental DNA Markers".
- ^ a b Salano, F.; Sanz, M. (31 March 2014). "Interethnic admixture and the evolution of Latin American populations". Genetics and Molecular Biology. 37 (1 Suppl): 151–170. doi:10.1590/s1415-47572014000200003. PMC 3983580. PMID 24764751.
- ^ Fortes-Lima, C.; Bybjerg-Grauholm, J.; Marin-Padrón, L. C.; Gomez-Cabezas, E. J.; Bækvad-Hansen, M.; Hansen, C. S.; Le, P.; Hougaard, D. M.; Verdu, P.; Mors, O.; Parra, E. J.; Marcheco-Teruel, B. (2018). "Exploring Cuba's population structure and demographic history using genome-wide data". Scientific Reports. 8 (1): 11422. Bibcode:2018NatSR...811422F. doi:10.1038/s41598-018-29851-3. PMC 6065444. PMID 30061702.
- ^ Gaviria, Zambrano; et al. (25 June 2019). "The three-hybrid genetic composition of an Ecuadorian population using AIMs-InDels compared with autosomes, mitochondrial DNA and Y chromosome data". Scientific Reports. 9 (1) 9247. Bibcode:2019NatSR...9.9247Z. doi:10.1038/s41598-019-45723-w. PMC 6592923. PMID 31239502.
- ^ Salazar-Flores, J.; Zuñiga-Chiquette, F.; Rubi-Castellanos, R.; Álvarez-Miranda, J.L.; Zetina-Hérnandez, A.; Martínez-Sevilla, V.M.; González-Andrade, F.; Corach, D.; Vullo, C.; Álvarez, J.C.; Lorente, J.A.; Sánchez-Diz, P.; Herrera, R.J.; Cerda-Flores, R.M.; Muñoz-Valle, J.F.; Rangel-Villalobos, H. (February 2015). "Admixture and genetic relationships of Mexican Mestizos regarding Latin American and Caribbean populations based on 13 CODIS-STRs". Homo. 66 (1): 44–59. doi:10.1016/j.jchb.2014.08.005. hdl:11336/15953. PMID 25435058.
- ^ Söchtig, J.; et al. (25 February 2015). "Genomic insights on the ethno-history of the Maya and the 'Ladinos' from Guatemala". BMC Genomics. 16 (1) 131. doi:10.1186/s12864-015-1339-1. PMC 4422331. PMID 25887241.
- ^ Fonte, F. (6 November 2016). "45 Haitian AncestryDNA Results". Tracing African Roots. Retrieved 7 October 2024.
- ^ "Evaluation of Ancestry and Linkage Disequilibrium Sharing in Admixed Population in Mexico". Archived from the original on January 16, 2013.Price, Alkes L.; Patterson, Nick; Yu, Fuli; Cox, David R.; Waliszewska, Alicja; McDonald, Gavin J.; Tandon, Arti; Schirmer, Christine; Neubauer, Julie; Bedoya, Gabriel; Duque, Constanza; Villegas, Alberto; Bortolini, Maria Catira; Salzano, Francisco M.; Gallo, Carla; Mazzotti, Guido; Tello-Ruiz, Marcela; Riba, Laura; Aguilar-Salinas, Carlos A.; Canizales-Quinteros, Samuel; Menjivar, Marta; Klitz, William; Henderson, Brian; Haiman, Christopher A.; Winkler, Cheryl; Tusie-Luna, Teresa; Ruiz-Linares, Andrés; Reich, David (June 2007). "A Genomewide Admixture Map for Latino Populations". The American Journal of Human Genetics. 80 (6): 1024–1036. doi:10.1086/518313. PMC 1867092. PMID 17503322.
- ^ Simão, F.; Ferreira, A.P.; Vullo, C.; Xavier, C.; Huber, G.; Quiroz, A.; Machado, P.; Velázquez, V.; Carvalho, E.F.; Gusmão, L.; Parson, W. (December 2017). "Paraguay: Unveiling migration patterns with ancestry genetic markers". Forensic Science International: Genetics Supplement Series. 6: e226 – e228. doi:10.1016/j.fsigss.2017.09.104.
- ^ Asgari, Samira; Luo, Yang; Huang, Chuan-Chin; Zhang, Zibiao; Calderon, Roger; Jimenez, Judith; Yataco, Rosa; Contreras, Carmen; Galea, Jerome T.; Lecca, Leonid; Jones, David; Moody, D. Branch; Murray, Megan B.; Raychaudhuri, Soumya (July 2022). "Admixture in Latin America: Geographic Structure, Phenotypic Diversity and Self-Perception of Ancestry Based on 7,342 Individuals". PLOS Genetics. 2 (7): 100151. Bibcode:2014PLOSG..10.4572R. doi:10.1371/journal.pgen.1004572. PMC 9306274. PMID 35873671.
- ^ Moreno-Estrada, Andrés; Gravel, Simon; Zakharia, Fouad; McCauley, Jacob L.; Byrnes, Jake K.; Gignoux, Christopher R.; Ortiz-Tello, Patricia A.; Martínez, Ricardo J.; Hedges, Dale J.; Morris, Richard W.; Eng, Celeste; Sandoval, Karla; Acevedo-Acevedo, Suehelay; Norman, Paul J.; Layrisse, Zulay; Parham, Peter; Martínez-Cruzado, Juan Carlos; Burchard, Esteban González; Cuccaro, Michael L.; Martin, Eden R.; Bustamante, Carlos D. (2013). "Reconstructing the Population Genetic History of the Caribbean". PLOS Genetics. 9 (11) e1003925. doi:10.1371/journal.pgen.1003925. PMC 3828151. PMID 24244192.
- ^ Bonilla, Carolina; Bertoni, Bernardo; Hidalgo, Pedro C; Artagaveytia, Nora; Ackermann, Elizabeth; Barreto, Isabel; Cancela, Paula; Cappetta, Mónica; Egaña, Ana (2015). "Breast cancer risk and genetic ancestry: a case–control study in Uruguay". BMC Women's Health. 15 11. doi:10.1186/s12905-015-0171-8. ISSN 1472-6874. PMC 4341228. PMID 25783644.
- ^ "IBGE | Portal do IBGE | IBGE". www.ibge.gov.br. Archived from the original on January 17, 2013.
- ^ "Argentina - The World Factbook". www.cia.gov. 14 April 2022.
- ^ a b "Bolivia: People; Ethnic groups". CIA World Factbook. Retrieved 2007-11-26.
- ^ "IBGE | Portal do IBGE | IBGE" (PDF).
- ^ Pinhoni, Marina; Croquer, Gabriel (22 December 2023). "Censo 2022: Pela 1ª vez, Brasil se declara mais pardo que branco; populações preta e indígena também crescem". G1 (in Brazilian Portuguese).
- ^ a b c J., Lecrerc. "Costa Rica". L'aménagement linguistique dans le monde. 1999. Retrieved 8 April 2025.
- ^ a b "Costa Rica". worldstatesmen.org.
- ^ "LUN.COM Mobile".
- ^ official 2012 Census Archived June 3, 2014, at the Wayback Machine |
- ^ a b "Más mestizos, menos afros y pocos blancos: así se ven los ecuatorianos". Primicias. 22 September 2023. Retrieved 14 November 2023.
- ^ "Voluntariado internacional 2013 – EL SALVADOR" (PDF). Solidaridad Internacional Andalucía. Archived from the original (PDF) on 2015-12-22.
- ^ "VI Censo de población y V de vivienda 2007" (PDF) (in Spanish). Dirección General de Estadística y Censos. p. 273. Archived from the original (PDF) on 2019-12-20. Retrieved 2021-05-02.
- ^ Lizcano Fernandez, Francisco (August 2005). "Composición Étnica de las Tres Áreas Culturales del Continente Americano al Comienzo del Siglo XXI". Convergencia. 12 (38): 185–232. Retrieved 23 July 2021.
- ^ Honduras - XVII Censo de Población y VI de Vivienda 2013
- ^ "Embajada de Honduras en México". Embajadahonduras.org.mx. Archived from the original on 2015-12-22.
- ^ "Conozca más de nuestras costumbres y tradiciones". Diario La Tribuna Honduras. Archived from the original on 2015-12-22. Retrieved 2015-12-28.
- ^ Latinobarómetro 2020. [1] "Raza/Etnia a la que pertenece"
- ^ "Nicaragua". britannica.com. BRITANNICA. Retrieved 11 November 2021.
- ^ "Cultura y Etnias". Espana.panamaemb.gob.pa. Archived from the original on 21 January 2017. Retrieved 8 October 2017.
- ^ a b c d "Censo 2017 Perú: Perfil Sociodemográfico" (PDF). Instituto Nacional de Estadística e Informática. p. 214. Retrieved 22 November 2023.
- ^ Central Intelligence Agency (2016). "Uruguay". The World Factbook. Langley, Virginia: Central Intelligence Agency. Retrieved 1 January 2017.
- ^ Brading, David A. (1975). Mineros y comerciantes en el México borbónico (1763-1810). Fondo de Cultura Economica. p. 150. ISBN 978-607-16-2741-4.
- ^ Palma Mora, Mónica (December 2005). "Asociaciones de inmigrantes extranjeros en la ciudad de México: Una mirada a fines del siglo XX" [Associations of foreign immigrants in Mexico City. A look at the end of the 20th century]. Migraciones Internacionales (in Spanish). 3 (2): 29–57.
- ^ a b Enciso, Fernando Saúl Alanís (1996). "Los extranjeros en México, la inmigración y el gobierno: ¿tolerancia o intolerancia religiosa?, 1821-1830" [Foreigners in Mexico, immigration and the government: tolerance or religious intolerance?, 1821-1830]. Historia Mexicana (in Spanish). 45 (3): 539–566. JSTOR 25139003.
- ^ "HISTORY TV Schedule". HISTORY.
- ^ "For Migrants, New Land of Opportunity Is Mexico". The New York Times. 22 September 2013.
- ^ "The World Factbook: North America: Mexico: People and Society". The World Factbook, Central Intelligence Agency (CIA). Retrieved August 23, 2017.
mestizo (Amerindian-Spanish) 62%, predominantly Amerindian 21%, Amerindian 7%, other 10% (mostly European)
- ^ Ruiz-Linares, Andrés; Adhikari, Kaustubh; Acuña-Alonzo, Victor; Quinto-Sanchez, Mirsha; Jaramillo, Claudia; et al. (25 September 2014). "Admixture in Latin America: Geographic Structure, Phenotypic Diversity and Self-Perception of Ancestry Based on 7,342 Individuals". PLOS Genetics. 10 (9) e1004572. Bibcode:2014PLOSG..10.4572R. doi:10.1371/journal.pgen.1004572. PMC 4177621. PMID 25254375.
- ^ "Encuesta Nacional sobre Discriminación 2017", CNDH, 6 August 2018, Retrieved on 10 August 2018.
- ^ "Encuesta Nacional sobre Discriminación (ENADIS) 2022". www.inegi.org.mx (in Spanish). Retrieved April 2, 2024.
- ^ "21 de Marzo: Día Internacional de la Eliminación de la Discriminación Racial" [March 21: International Day for the Elimination of Racial Discrimination] (PDF) (in Spanish). Mexico: CONAPRED. 2017. p. 7. Archived from the original (PDF) on May 25, 2017. Retrieved August 23, 2017.
- ^ " Visión INEGI 2021 Dr. Julio Santaella Castell", INEGI, 03 July 2017, Retrieved on 30 April 2018.
- ^ "Resultados del Modulo de Movilidad Social Intergeneracional" Archived 2018-07-09 at the Wayback Machine, INEGI, 16 June 2017, Retrieved on 30 April 2018.
- ^ ENADIS 2022 p.156. Retrieved on 12-04-2025.
- ^ Phototype comparison between caucasian and asian skin types p. 194. Retrieved on 15-04-2025.
- ^ Cline, Howard F. (1963). The United States and Mexico. Harvard University Press. p. 104. OCLC 414833. Retrieved 22 May 2025.
- ^ "Nómadas y sedentarios, El pasado prehispánico de Zacatecas", Mesoweb, Mexico, page 10, retrieved on July 7, 2024.
- ^ "Transición migratoria y demográfica de México. Nuevos patrones", page 17, retrieved on September 12, 2024.
- ^ Magaña, Mario; Valerio, Julia; Mateo, Adriana; Magaña-Lozano, Mario (April 2005). "Alteraciones cutáneas del neonato en dos grupos de población de México" [Skin lesions two cohorts of newborns in Mexico City]. Boletín médico del Hospital Infantil de México (in Spanish). 62 (2): 117–122.
- ^ Miller (1999). Nursing Care of Older Adults: Theory and Practice (3, illustrated ed.). Lippincott Williams & Wilkins. p. 90. ISBN 0-7817-2076-1. Retrieved May 17, 2014.
- ^ "Congenital Dermal Melanocytosis (Mongolian Spot): Background, Pathophysiology, Epidemiology". EMedicine.medscape.com. 7 January 2017. Retrieved 8 October 2017.
- ^ Lawrence C. Parish; Larry E. Millikan, eds. (2012). Global Dermatology: Diagnosis and Management According to Geography, Climate, and Culture. M. Amer, R.A.C. Graham-Brown, S.N. Klaus, J.L. Pace. Springer Science & Business Media. p. 197. ISBN 978-1-4612-2614-7. Retrieved May 17, 2014.
- ^ "About Mongolian Spot". tokyo-med.ac.jp. Archived from the original on 8 December 2008. Retrieved 1 October 2015.
- ^ "Tienen manchas mongólicas 50% de bebés", El Universal, January 2012. Retrieved on 3 July 2017.
- ^ "2012 Cuban Census". One.cu. 2006-04-28. Retrieved 2014-04-23.
- ^ Copesa, Grupo (8 November 2013). "Censo en Cuba concluye que la población decrece, envejece y se vuelve cada vez más mestiza". latercera.com. Archived from the original on 5 March 2016. Retrieved 22 May 2014.
- ^ "Etat des propriétés rurales appartenant à des Français dans l'île de Cuba". (from Cuban Genealogy Center)
- ^ "In Cuba, Finding a Tiny Corner of Jewish Life". The New York Times. 2007-02-04. Retrieved 2008-11-19.
- ^ "Report on the Census of Cuba, Census of Cuba 1899". Digital.tcl.sc.edu. p. 81. Retrieved 28 April 2022.
- ^ "El Color de la Piel según el Censo de Población y Viviendas" (PDF). Cuba Statistics and Information. pp. 8, 17–18. Archived from the original (PDF) on 21 January 2022. Retrieved 8 February 2022.
- ^ Marcheco-Teruel, B; Parra, EJ; Fuentes-Smith, E; Salas, A; Buttenschøn, HN; et al. (2014). "Cuba: Exploring the History of Admixture and the Genetic Basis of Pigmentation Using Autosomal and Uniparental Markers". PLOS Genetics. 10 (7) e1004488. doi:10.1371/journal.pgen.1004488. PMC 4109857. PMID 25058410.
- ^ Teruel, Beatriz Marcheco; Rodríguez, Juan J Llibre; McKeigue, Paul; Mesa T, Teresa Collazo; Fuentes, Evelyn; Cepero A, Adolfo Valhuerdi; Hernandez, Milagros A Guerra; Copeland JRM, John RM; Ferri, Cleusa P; Prince, Martin J (December 2011). "Interactions between genetic admixture, ethnic identity, APOE genotype and dementia prevalence in an admixed Cuban sample; a cross-sectional population survey and nested case-control study". BMC Medical Genetics. 12 (1): 43. doi:10.1186/1471-2350-12-43. PMC 3079615. PMID 21435264.
- ^ Cintado, A.; Companioni, O.; Nazabal, M.; Camacho, H.; Ferrer, A.; De Cossio, M. E. Fernandez; Marrero, A.; Ale, M.; Villarreal, A.; Leal, L.; Casalvilla, R.; Benitez, J.; Novoa, L.; Diaz-Horta, O.; Dueñas, M. (1 January 2009). "Admixture estimates for the population of Havana City". Annals of Human Biology. Vol. 36. pp. 350–360. doi:10.1080/03014460902817984. PMID 19381988. S2CID 10307820.
- ^ Engerman, Stanley L.; Higman, B. W. (2003). "The demographic structure of the Caribbean slave Societies in the eighteenth and nineteenth Centuries". General History of the Caribbean. pp. 45–104. doi:10.1007/978-1-349-73770-3_3. ISBN 978-1-349-73772-7.
PUERTO RICO: 17,572 whites; 5,037 slaves; 22,274 freed coloured people; total- 44,883. CUBA: 116,947 whites; 28,760 slaves; 24,293 freed coloured people; total- 170,000. SANTO DOMINGO: 30,863 whites; 8,900 slaves; 30,862 freed coloured people; total- 70,625. TOTAL SPANISH COLONIES: 165,382 whites; 42,967 slaves; 77,429 freed coloured people; total- 285,508.
- ^ a b A Population History of North America By Michael R. Haines, Richard H. Steckel
- ^ Dominican Republic Foreign Policy and Government Guide Volume 1 Strategic By IBP, Inc.
- ^ Helen Chapin Metz, ed. (December 1999). "The first colony". Dominican Republic: country studies. Washington, DC: Federal Research Division, Library of Congress. ISBN 0-8444-1044-6. Retrieved 3 August 2013.
As a result of the stimulus provided by the trade reforms, the population of the colony of Santo Domingo increased from about 6,000 in 1737 to approximately 125,000 in 1790. Of this number, about 40,000 were white landowners, about 25,000 were black or mulatto freedmen, and some 60,000 were slaves. The composition of Santo Domingo's population contrasted sharply with that of the neighboring French colony of Saint-Domingue, where some 30,000 whites and 27,000 freedmen extracted labor from at least 500,000 black slaves. To the Spanish colonists, Saint- Domingue represented a powder keg, the eventual explosion of which would echo throughout the island.
- Helen Chapin Metz, ed. (December 1999). Dominican Republic: country studies. Area handbook series. Washington, DC: Federal Research Division, Library of Congress. ISBN 0-8444-1044-6.
- ^ Franco Pichardo, Franklin J. (2009). Historia del Pueblo Dominicano (in Spanish). Santo Domingo: Ediciones Taller. p. 217. Retrieved 23 May 2013.
- ^ Dominican Republic, Summary of Biostatistics: Maps and Charts, Population, Natality and Mortality Statistics. U.S. Department of Commerce, Bureau of the Census. 1945. p. 5.
- ^ "El tema étnico-racial en los censos nacionales de población de RD (Y 3)" (in Spanish). 5 October 2022. Retrieved 6 April 2023.
- ^ a b Frank Moya Pons (1999). Breve Historia Contemporánea de la República Dominicana (in Spanish). Fondo De Cultura Economica USA. p. 62.
Según los datos del primer censo nacional, la población dominicana estaba compuesta por un 24.9% de blancos, (...) en 1920 había 223 144 blancos (...)
- ^ Dominican Republic, Summary of Biostatistics: Maps and Charts, Population, Natality and Mortality Statistics. U.S. Department of Commerce, Bureau of the Census. 1945. p. 41.
- ^ Pons, Frank Moya (2010). Historia de la República Dominicana. Editorial CSIC - CSIC Press. p. 51. ISBN 978-84-00-09240-5.
- ^ Cuarto censo nacional de población, 1960. Oficina Nacional del Censo. 1966. p. 32.
- ^ Power and Television in Latin America: The Dominican Case By Antonio V. Menéndez Alarcó
- ^ "Breve Encuesta Nacional de Autopercepción Racial y Étnica en la República Dominicana" (PDF). Santo Domingo: Fondo de Población de las Naciones Unidas (United Nations Population Fund). September 2021. p. 22. Retrieved November 3, 2022.
- ^ "Origen de la población dominicana". Archived from the original on 2007-12-30. Retrieved 2007-12-13.
- ^ "Revista Electrónica de Geografía y Ciencias Sociales". Universidad de Barcelona.
- ^ "Sitios patrimonio de la humanidad: San Pedro de Macorís, República Dominicana". Archived from the original on 2009-01-14.
- ^ Sagás, Ernesto. "A Case of Mistaken Identity: Antihaitianismo in Dominican Culture". Archived from the original on 2007-10-08. Retrieved 2007-12-08.
- ^ Levy, Lauren. "The Dominican Republic's Haven for Jewish Refugees". Jerusalem Post. Retrieved 2007-12-08.
- ^ "...no hicieron Las Américas". El País. Archived from the original on 2007-12-12. Retrieved 2007-12-08.
- ^ "Dominican Republic". German Federal Foreign Office. March 2005. Archived from the original on 2006-10-20. Retrieved 6 April 2022.
- ^ a b "The Polish Influence in Casale, Haiti and Contribution to the Haitian Revolution". Archived from the original on 25 February 2014. Retrieved 7 February 2014.
- ^ "Polish Haitians: How They Came to Be". 2011-02-17. Retrieved 6 February 2014.
- ^ "Haiti". Jewish Virtual Library. Retrieved 2014-02-07.
- ^ "Haiti And The German Connection". Retrieved 30 January 2014.
- ^ "Haiti Net Foreign Relations". Archived from the original on 16 October 2018. Retrieved 30 January 2014.
- ^ El crecimiento poblacional en Puerto Rico: 1493 al presente Archived 2015-10-03 at the Wayback Machine (Population of Puerto Rico 1493 - present) Page 11.
- ^ Google Books History – Google Books. Archived from the original on 2016-02-06. Retrieved 2016-02-22.
- ^ a b c d e f g h i j k "Report on the census of Porto Rico, 1899 Census of "Porto Rico"". 1900. p. 57. Retrieved July 3, 2024.
- ^ a b "El crecimiento poblacional en Puerto Rico: 1493 al presente" (PDF). Archived from the original (PDF) on 3 October 2015.
- ^ a b c "Puerto Rico Census of 1910, 1920 & 1930" (PDF). p. 136. Retrieved 7 December 2022.
- ^ a b "The population of the United States and Puerto Rico". p. 53-26. Retrieved 7 December 2022.
- ^ "Summary Population, Housing Characteristics Puerto Rico: 2000 Census" (PDF). p. 52. Retrieved 7 December 2022.
- ^ Puerto Rico: 2010 - Summary Population and Housing Characteristics 2010 Census of Population and Housing.
- ^ "Puerto Rico Population Declined 11.8% From 2010 to 2020". 25 August 2021. Retrieved 3 September 2021.
- ^ 2010.census.gov Archived January 2, 2011, at the Wayback Machine
- ^ Rigau-Pérez, José G. (1985). "Strategies that led to the eradication of smallpox in Puerto Rico, 1882-1921". Bulletin of the History of Medicine. 59 (1): 75–88. JSTOR 44452038. PMID 3886051. ProQuest 1296295316.
- ^ Loveman, Mara; Muniz, Jeronimo O. (December 2007). "How Puerto Rico Became White: Boundary Dynamics and Intercensus Racial Reclassification". American Sociological Review. 72 (6): 915–939. CiteSeerX 10.1.1.563.9069. doi:10.1177/000312240707200604. JSTOR 25472503. S2CID 144405526.
- ^ Hill, Robert Thomas (1899). Cuba and Porto Rico: With the Other Islands of the West Indies: Their Topography, Climate, Flora, Products, Industries, Cities, People, Political Conditions, Etc. Century. p. 146.
- ^ Hill, Robert Thomas (1899). Cuba and Porto Rico: With the Other Islands of the West Indies: Their Topography, Climate, Flora, Products, Industries, Cities, People, Political Conditions, Etc. Century. p. 165.
- ^ "Cuba and Porto Rico, with the other islands of the West Indies". Library of Congress. 1899. Retrieved 10 November 2023.
- ^ a b c d e f g Godinho, Neide Maria de Oliveira (2008). Repositório Institucional da UnB: Home (Thesis).
- ^ "INEC Cuestionario Censo 2022" (PDF). INEC. 2022. Retrieved 6 April 2023.
- ^ "The World Factbook". cia.gov. 10 May 2022.
- ^ "The Jewish Community in Costa Rica". jcpa.org.
- ^ "Culture of Costa Rica - history, people, women, beliefs, food, customs, family, social, marriage". everyculture.com.
- ^ Wallace, Arturo. "¿Qué tan diferentes son en realidad los habitantes de Costa Rica a los del resto de los países centroamericanos?". BBC News Mundo. Retrieved 22 December 2023.
- ^ "Vi Censo de Población V de Vivienda 2007" (PDF). Archived from the original (PDF) on 2015-09-23. Retrieved 2015-12-20.[unreliable source?]
- ^ "El Salvador-The World Factbook". The World Factbook. Retrieved 20 July 2021.
- ^ "La Gente Blanca de Chalatenango". chalatenango.sv. 22 November 2011. Retrieved 20 July 2021.
- ^ "La gente blanca de Chalatenango". 22 November 2011.
- ^ Colombo, Alessandra (10 July 2003). "La storia degli italiani in El Salvador". Retrieved 20 July 2021.
- ^ Jorge, Ferrer (6 September 2003). "Españoles en El Salvador a fines del siglo XIX y principios del Siglo XX". Retrieved 20 July 2021.
- ^ Gómez, Moisés (March 2013). "Ser extranjero en Centroamérica. Génesis y evolución de las leyes de extranjería y migración en El Salvador: siglos XIX y XX". Realidad, Revista de Ciencias Sociales y Humanidades (135): 117–151. doi:10.5377/realidad.v0i135.3167.
- ^ "El Refugio en Latinoamerica". encyclopedia.ushmm.org. Retrieved 21 July 2021.
- ^ "La historia del diplomático católico que salvó 40 mil judíos del holocausto". aciprensa. Retrieved 21 July 2021.
- ^ "América Central". c1.staticflickr.com (in Spanish).
- ^ Censo Población y Vivienda, 2018 Archived 2019-12-17 at the Wayback Machine INE (Instituto Nacional de Estadísticas).
- ^ Schoonover, Thomas (2008). Hitler's Man in Havana: Heinz Luning and Nazi Espionage in Latin America. United States of America: The University Press of Kentucky. p. 35. ISBN 978-0-8131-2501-5. Retrieved 27 May 2014.
- ^ Graham, Ross (2013). "English in Honduras". In Hopkins, Tometro; Decker, Kendall; McKenny, John (eds.). World Englishes: Volume III: Central America. doi:10.5040/9781474205979.ch-003. ISBN 978-1-4742-9854-4.
- ^ Project, Joshua. "Honduran White in Honduras". joshuaproject.net. Retrieved 2024-11-17.
- ^ Riaño, María Eugenia (2019-12-30). "Imputación de datos faltantes del Censo de Población y Vivienda de Uruguay utilizando técnicas de estadística espacial". SaberEs. 11 (2). doi:10.35305/s.v11i2.202. S2CID 212905166.
- ^ Ventura Lara, Libny Rodrigo (2014-05-01). "El templo de Colohete (Honduras) y su significado simbólico". Revista de Estudios Históricos de la Masonería Latinoamericana y Caribeña. 6 (1). doi:10.15517/rehmlac.v6i1.15228. ISSN 1659-4223.
- ^ "Lebanese Diaspora leaders urge Christians Sunnis, Druse to resist Hezbollah – Ya Libnan". 2011-01-01. Retrieved 2023-12-10.
- ^ Rocha, José Luis (13 December 2011). "Censo estadounidense 2010: cifras e implicaciones de la mayor presencia de centroamericanos en Estados Unidos". Encuentro (90): 19–33. doi:10.5377/encuentro.v44i90.598.
- ^ Salazar-Flores, J.; Zuñiga-Chiquette, F.; Rubi-Castellanos, R.; Álvarez-Miranda, J. L.; Zetina-Hérnandez, A.; Martínez-Sevilla, V. M.; González-Andrade, F.; Corach, D.; Vullo, C.; Álvarez, J. C.; Lorente, J. A.; Sánchez-Diz, P.; Herrera, R. J.; Cerda-Flores, R. M.; Muñoz-Valle, J. F.; Rangel-Villalobos, H. (1 February 2015). "Admixture and genetic relationships of Mexican Mestizos regarding Latin American and Caribbean populations based on 13 CODIS-STRs". Homo. 66 (1): 44–59. doi:10.1016/j.jchb.2014.08.005. hdl:11336/15953. PMID 25435058.
- ^ a b Horimoto, A.; Cai, J.; Thornton, T.; Franceschini, N. (2021-04-01). "POS-424 Genetic Admixture of U.S. Hispanics from Central America". Kidney International Reports. 6 (4): S183. doi:10.1016/j.ekir.2021.03.447. ISSN 2468-0249.
- ^ "Genomic Components in America's demography". Archived from the original on 7 March 2021. Retrieved 8 January 2018.
- ^ Salzano, Francisco Mauro; Sans, Mónica (2014). "Interethnic admixture and the evolution of Latin American populations". Genetics and Molecular Biology. 37 (1 suppl 1): 151–170. doi:10.1590/s1415-47572014000200003. PMC 3983580. PMID 24764751.
- ^ "Central America: Nicaragua". CIA: The World Factbook. Retrieved 10 September 2019.
- ^ "Urban population (% of total)". World Bank. Retrieved 26 June 2015.
- ^ "Panama; People; Ethnic groups". CIA World Factbook. Retrieved 2007-11-21.
- ^ a b c Seldin; et al. (2006). "Argentine Population Genetic Structure: Large Variance in Amerindian Contribution". American Journal of Physical Anthropology. 132 (3): 455–462. doi:10.1002/ajpa.20534. PMC 3142769. PMID 17177183.
- ^ a b Corach, Daniel; Lao, Oscar; Bobillo, Cecilia; Van Der Gaag, Kristiaan; Zuniga, Sofia; Vermeulen, Mark; Van Duijn, Kate; Goedbloed, Miriam; Vallone, Peter M.; Parson, Walther; De Knijff, Peter; Kayser, Manfred (January 2010). "Inferring Continental Ancestry of Argentineans from Autosomal, Y-Chromosomal and Mitochondrial DNA: Genetic Ancestry in Extant Argentineans". Annals of Human Genetics. 74 (1): 65–76. doi:10.1111/j.1469-1809.2009.00556.x. hdl:11336/14301. PMID 20059473. S2CID 5908692.
- ^ Avena, Sergio; Via, Marc; Ziv, Elad; Pérez-Stable, Eliseo J.; Gignoux, Christopher R.; Dejean, Cristina; Huntsman, Scott; Torres-Mejía, Gabriela; Dutil, Julie; Matta, Jaime L.; Beckman, Kenneth; Burchard, Esteban González; Parolin, María Laura; Goicoechea, Alicia; Acreche, Noemí; Boquet, Mariel; Ríos Part, María Del Carmen; Fernández, Vanesa; Rey, Jorge; Stern, Mariana C.; Carnese, Raúl F.; Fejerman, Laura (10 April 2012). "Heterogeneity in Genetic Admixture across Different Regions of Argentina". PLOS ONE. 7 (4) e34695. Bibcode:2012PLoSO...734695A. doi:10.1371/journal.pone.0034695. PMC 3323559. PMID 22506044.
- ^ a b "ADN argentino de donde viene y cuales son sus principales caracteristicas". Infobae (in Spanish). 15 September 2022.
- ^ Chamosa, Oscar (1 February 2008). "Indigenous or Criollo: The Myth of White Argentina in Tucumán's Calchaquí Valley". Hispanic American Historical Review. 88 (1): 71–106. doi:10.1215/00182168-2007-079.
- ^ Grasso, Dick Edgar Ibarra (1997). Los hombres barbados en la América precolombina: razas indígenas americanas [Bearded Men in Pre-Columbian America: Native American Races] (in Spanish). Editorial Kier. p. 79. ISBN 978-950-17-1703-7.
- ^ "Bolivianos en la Argentina: cómo viven este momento histórico de su país". www.clarin.com. 22 January 2006.
- ^ Corach, Daniel; Lao, Oscar; Bobillo, Cecilia; Van Der Gaag, Kristiaan; Zuniga, Sofia; Vermeulen, Mark; Van Duijn, Kate; Goedbloed, Miriam; Vallone, Peter M.; Parson, Walther; De Knijff, Peter; Kayser, Manfred (January 2010). "Inferring Continental Ancestry of Argentineans from Autosomal, Y-Chromosomal and Mitochondrial DNA". Annals of Human Genetics. 74 (1): 65–76. doi:10.1111/j.1469-1809.2009.00556.x. hdl:11336/14301. PMID 20059473. S2CID 5908692.
- ^ Vitale, Luis (1992). "Modos de producción y formaciones sociales". Introducción a una teoría de la historia para América Latina [Modes of production and social formations] (in Spanish). Planeta. pp. 71–. ISBN 978-950-9216-32-7.
- ^ Fuente: Argentina: de la Conquista a la Independencia. por C. S. Assadourian – C. Beato – J. C. Chiaramonte. Ed. Hyspamérica. Buenos Aires, 1986. Cited in Revisionistas. La Otra Historia de los Argentinos.[self-published source?]
- ^ "90.01.06: South American Immigration: Argentina". yale.edu.
- ^ "Feditalia - Confederación General de Federaciones Italianas en Argentina". feditalia.org.ar. Archived from the original on 2016-05-02. Retrieved 2010-04-13.
- ^ "Economía". Municipalidad de la Ciudad de Crespo, Entre Ríos (in Spanish). Archived from the original on 26 September 2008. Retrieved 30 April 2021.
- ^ History of Argentina, de Ricardo.Levene. University of North Carolina Press, 1937.
- ^ Rock, David (1987). Argentina, 1516-1987: From Spanish Colonization to Alphonsín. (Updated). University of California Press. ISBN 978-0-520-06178-1.[page needed]
- ^ Migration and Nationality Patterns in Argentina. Archived 2012-02-18 at the Wayback Machine Fuente: Dirección Nacional de Migraciones, 1976.
- ^ "Inmigración, Cambio Demográfico y Desarrollo Industrial en la Argentina". Alfredo Lattes and Ruth Sautu. Cuaderno Nº 5 del CENEP (1978). Citado en Rock, David (1987). Argentina, 1516-1987: From Spanish Colonization to Alphonsín. (Updated). University of California Press. ISBN 978-0-520-06178-1.[page needed]
- ^ "Bolivia". worldstatesmen.org.
- ^ "Peru". worldstatesmen.org.
- ^ "Paraguay". worldstatesmen.org.
- ^ Marcogliese, María José (2003). "La migración reciente de Europa central y oriental a la Argentina, ¿Un tratamiento especial?". Revista argentina de sociología (in Spanish). 1 (1): 44–58.
- ^ "Ukrainians, Russians and Armenians, from professionals to security guardians" Archived 2011-09-15 at the Wayback Machine (in Spanish) by Florencia Tateossian. Le Monde Diplomatique, June 2001.
- ^ Homburger; et al. (2015). "Genomic Insights into the Ancestry and Demographic History of South America". PLOS Genetics. 11 (12) e1005602. doi:10.1371/journal.pgen.1005602. PMC 4670080. PMID 26636962.
- ^ Olivas; et al. (2017). "Variable frequency of LRRK2 variants in the Latin American research consortium on the genetics of Parkinson's disease (LARGE-PD), a case of ancestry". Nature. 3 19. doi:10.1038/s41531-017-0020-6. PMC 5460260. PMID 28649619.
- ^ Caputo, M.; Amador, M. A.; Sala, A.; Riveiro dos Santos, A.; Santos, S.; Corach, D. (May 2021). "Ancestral genetic legacy of the extant population of Argentina as predicted by autosomal and X-chromosomal DIPs". Molecular Genetics and Genomics. 296 (3): 581–590. doi:10.1007/s00438-020-01755-w. PMID 33580820.
- ^ Avena; et al. (2012). "Heterogeneity in Genetic Admixture across Different Regions of Argentina". PLOS ONE. 7 (4) e34695. Bibcode:2012PLoSO...734695A. doi:10.1371/journal.pone.0034695. PMC 3323559. PMID 22506044.
- ^ Salzano, F. M.; Sans, M. (2013). "Interethnic admixture and the evolution of Latin American populations". Genetics and Molecular Biology. 37 (1 Suppl): 151–170. doi:10.1590/s1415-47572014000200003. PMC 3983580. PMID 24764751.
- ^ "Reference Populations – Geno 2.0 Next Generation". Genographic.nationalgeographic.com. Archived from the original on 24 November 2017. Retrieved 15 January 2018.
- ^ "Brazil - the Country and its People" (PDF). www.brazil.org.uk. Archived from the original (PDF) on October 21, 2014. Retrieved December 3, 2014.
- ^ "The World Factbook". cia.gov. 22 September 2021.
- ^ "Brazil". worldstatesmen.org.
- ^ a b PNAD 2006 Archived 2012-02-22 at the Wayback Machine
- ^ "Sistema IBGE de Recuperação Automática - SIDRA". ibge.gov.br. Archived from the original on 2011-06-14.
- ^ Duarte, Alessandra (29 April 2011). "Censo 2010: população do Brasil deixa de ser predominantemente branca". O Globo (in Portuguese). Rio de Janeiro. Infoglobo Comunicação e Participações S.A. Archived from the original on 24 January 2014. Retrieved 24 January 2014.
(...) A população branca foi, assim, a única que diminuiu. Paula Miranda-Ribeiro, professora de demografia do Centro de Desenvolvimento e Planejamento Regional da UFMG, sublinha essa mudança cultural.
— «O Brasil está mais preto, algo mais próximo da realidade» — diz Paula, para quem a principal razão é a maior identificação de pretos e pardos com sua cor. — «É a chamada desejabilidade social. Historicamente, pretos e pardos eram desvalorizados socialmente, o que fazia com que pretos desejassem ser pardos, e pardos, brancos. Agora, pretos e pardos quiseram se identificar assim. Isso pode ter a ver, ainda, com a afirmação dessa população como forte consumidor atualmente, que se refletiu em afirmação de identidade.» (...) - ^ Whitaker, Charles (February 1991). "Blacks in Brazil: the myth and the reality". Ebony. 46 (4): 58–62. Gale A9329550.
- ^ "Sistema IBGE de Recuperação Automática - SIDRA". ibge.gov.br.
- ^ "IBGE | Portal do IBGE | IBGE". www.ibge.gov.br. Archived from the original on April 19, 2009.
- ^ "IBGE | Portal do IBGE | IBGE". www.ibge.gov.br. Archived from the original on November 20, 2007.
- ^ Carvalho-Silva DR, Santos FR, Rocha J, Pena SD (January 2001). "The Phylogeography of Brazilian Y-Chromosome Lineages". Am. J. Hum. Genet. 68 (1): 281–6. doi:10.1086/316931. PMC 1234928. PMID 11090340.
- ^ a b c d Levy, Maria Stella Ferreira (June 1974). "O papel da migração internacional na evolução da população brasileira (1872 a 1972)" [The role of international migration on the evolution of the Brazilian population (1872 to 1972)]. Revista de Saúde Pública (in Portuguese). 8 (suppl): 49–90. doi:10.1590/S0034-89101974000500003.
- ^ "Fim da escravidão gera medidas de apoio à imigração no Brasil - 16/02/2005 - Resumos - História do Brasil". uol.com.br.
- ^ "Café atrai imigrante europeu para o Brasil - 22/02/2005 - Resumos - História do Brasil". uol.com.br.
- ^ "IBGE | Portal do IBGE | IBGE". www.ibge.gov.br. Archived from the original on July 5, 2009.
- ^ Seyferth, Giralda (1997). "A assimilação dos imigrantes como questão nacional". Mana. 3: 95–131. doi:10.1590/S0104-93131997000100004.
- ^ "Memórias da Emigração Portuguesa". sapo.pt. Archived from the original on 2012-05-16.
- ^ Flight from Angola, The Economist, August 16, 1975
- ^ a b Chor, Dóra; Pereira, Alexandre; Pacheco, Antonio G.; Santos, Ricardo V.; Fonseca, Maria J. M.; Schmidt, Maria I.; Duncan, Bruce B.; Barreto, Sandhi M.; Aquino, Estela M. L.; Mill, José G.; Molina, Maria delCB; Giatti, Luana; Almeida, Maria daCC; Bensenor, Isabela; Lotufo, Paulo A. (2019-05-16). "Context-dependence of race self-classification: Results from a highly mixed and unequal middle-income country". PLOS ONE. 14 (5) e0216653. Bibcode:2019PLoSO..1416653C. doi:10.1371/journal.pone.0216653. ISSN 1932-6203. PMC 6522012. PMID 31095585.
- ^ Saloum De Neves Manta, Fernanda; Pereira, Rui; Vianna, Romulo; Rodolfo Beuttenmüller De Araújo, Alfredo; Leite Góes Gitaí, Daniel; Aparecida Da Silva, Dayse; De Vargas Wolfgramm, Eldamária; Da Mota Pontes, Isabel; Ivan Aguiar, José; Ozório Moraes, Milton; Fagundes De Carvalho, Elizeu; Gusmão, Leonor (2013). "Revisiting the Genetic Ancestry of Brazilians Using Autosomal AIM-Indels". PLOS ONE. 8 (9) e75145. Bibcode:2013PLoSO...875145S. doi:10.1371/journal.pone.0075145. PMC 3779230. PMID 24073242.
- ^ "Os Genes de Cabral". 2007-08-29. Archived from the original on 2007-08-29. Retrieved 2023-06-07.
- ^ Pena, Sergio Danilo (2014-05-22). "Do pensamento racial ao pensamento racional" [From racial thinking to rational thinking] (PDF). Instituto Ciência Hoje (in Portuguese). Archived from the original (PDF) on 2014-05-22. Retrieved 2023-06-16.
- ^ Valenzuela C. (1984). Marco de Referencia Sociogenético para los Estudios de Salud Pública en Chile. Revista Chilena de Pediatría; 55: 123-7.
- ^ Vanegas l, Jairo; Villalón c, Marcelo; Valenzuela y, Carlos (2008). "Consideraciones acerca del uso de la variable etnia/Raza en investigación epidemiológica para la Salud Pública: A propósito de investigaciones en inequidades". Revista Médica de Chile. 136 (5). doi:10.4067/S0034-98872008000500014.
- ^ Cruz-Coke, Ricardo & Moreno, Rodrigo (September 1994). "Genetic epidemiology of single gene defects in Chile". J. Med. Genet. (in Spanish). 31 (9): 702–6. doi:10.1136/jmg.31.9.702. PMC 1050080. PMID 7815439.
- ^ Homburguer; et al. (2015). "Genomic Insights into the Ancestry and Demographic History of South America". PLOS Genetics. 11 (12) e1005602. doi:10.1371/journal.pgen.1005602. PMC 4670080. PMID 26636962.
- ^ Eyheramendy, Susana; Martinez, Felipe I.; Manevy, Federico; Vial, Cecilia; Repetto, Gabriela M. (May 2015). "Genetic structure characterization of Chileans reflects historical immigration patterns". Nature Communications. 6 (1): 6472. Bibcode:2015NatCo...6.6472E. doi:10.1038/ncomms7472. PMC 4382693. PMID 25778948.
- ^ Fuentes, Macarena; Pulgar, Iván; Gallo, Carla; Bortolini, María-Cátira; Canizales-Quinteros, Samuel; Bedoya, Gabriel; González-José, Rolando; Ruiz-Linares, Andrés; Rothhammer, Francisco (March 2014). "Geografía génica de Chile: Distribución regional de los aportes genéticos americanos, europeos y africanos" [Gene geography of Chile: regional distribution of American, European and African genetic contributions]. Revista médica de Chile (in Spanish). 142 (3): 281–289. doi:10.4067/S0034-98872014000300001. hdl:10183/118734. PMID 25052264.
- ^ Fuentes, Macarena; Pulgar, Iván; Gallo, Carla; Bortolini, María-Cátira; Canizales-Quinteros, Samuel; Bedoya, Gabriel; González-José, Rolando; Ruiz-Linares, Andrés; Rothhammer, Francisco (March 2014). "Geografía génica de Chile: Distribución regional de los aportes genéticos americanos, europeos y africanos" [Gene geography of Chile. Regional distribution of American, European and African genetic contributions]. Revista médica de Chile (in Spanish). 142 (3): 281–289. doi:10.4067/S0034-98872014000300001. hdl:10183/118734. PMID 25052264.
- ^ ""No hay ningún chileno que no tenga ancestría amerindia o europea. Todos somos mestizos"". www.uchile.cl. Retrieved 2023-05-31.
- ^ "Chile". Encyclopædia Britannica. Retrieved 2012-09-15.
"Chile's ethnic makeup is largely a product of Spanish colonization. About three fourths of Chileans are mestizo, a mixture of European and Amerindian ancestries. One-fifth of Chileans are of white European (mainly Spanish) descent.
- ^ El Gradiente Sociogenético Chileno y sus Implicaciones Etico-Sociales (2014)
- ^ "LUN.COM Mobile". lun.com.
- ^ Ruiz-Linares, Andrés; Adhikari, Kaustubh; Acuña-Alonzo, Victor; Quinto-Sanchez, Mirsha; Jaramillo, Claudia; Arias, William; Fuentes, Macarena; Pizarro, María; Everardo, Paola; de Avila, Francisco; Gómez-Valdés, Jorge; León-Mimila, Paola; Hunemeier, Tábita; Ramallo, Virginia; Silva de Cerqueira, Caio C.; Burley, Mari-Wyn; Konca, Esra; de Oliveira, Marcelo Zagonel; Veronez, Mauricio Roberto; Rubio-Codina, Marta; Attanasio, Orazio; Gibbon, Sahra; Ray, Nicolas; Gallo, Carla; Poletti, Giovanni; Rosique, Javier; Schuler-Faccini, Lavinia; Salzano, Francisco M.; Bortolini, Maria-Cátira; Canizales-Quinteros, Samuel; Rothhammer, Francisco; Bedoya, Gabriel; Balding, David; Gonzalez-José, Rolando (25 September 2014). "Admixture in Latin America: Geographic Structure, Phenotypic Diversity and Self-Perception of Ancestry Based on 7,342 Individuals". PLOS Genetics. 10 (9) e1004572. Bibcode:2014PLOSG..10.4572R. doi:10.1371/journal.pgen.1004572. PMC 4177621. PMID 25254375.
- ^ a b c d Valenzuela, Carlos Y.; Alvarado, Orlando; von Beck, Petra; Zemelman, Viviana (2002). "Sexual dimorphism in skin, eye and hair color and the presence of freckles in Chilean teenagers from two socioeconomic strata". Viviana Zemelman, Petra von Beck, Orlando Alvarado and Carlos y Valenzuela (in Spanish). 130 (8): 879–884. doi:10.4067/S0034-98872002000800006. PMID 12360796.
- ^ "Chile". Encyclopædia Britannica. Retrieved 2012-09-15.
"...Basque families who migrated to Chile in the 18th century vitalized the economy and joined the old Castilian aristocracy to become the political elite that still dominates the country.
- ^ a b De los Vascos, Oñati y los Elorza Archived 2013-08-19 at the Wayback Machine DE LOS VASCOS, OÑATI Y LOS ELORZA Waldo Ayarza Elorza. Page 68
- ^ Vasco, Diario (2006-07-24). "Diariovasco.com - EDICIÓN IMPRESA - "Los jóvenes vasco-chilenos están al día de todo lo que está pasando en Euskadi"". diariovasco.com.
- ^ "entrevista al Presidente de la Cámara vasca". Archived from the original on May 11, 2009.
- ^ vascos Ainara Madariaga: Autora del estudio "Imaginarios vascos desde Chile La construcción de imaginarios vascos en Chile durante el siglo XX".
- ^ "De los vascos en Chile y sus instituciones". euskonews.com.
- ^ Contacto Interlingüístico e intercultural en el mundo hispano.instituto valenciano de lenguas y culturas. Universitat de València Cita: "Un 20% de la población chilena tiene su origen en el País Vasco".
- ^ "La población chilena con ascendencia vasca bordea entre el 15% y el 20% del total, por lo que es uno de los países con mayor presencia de emigrantes venidos de Euskadi" (PDF). Archived from the original (PDF) on February 2, 2010.
- ^ De los Vascos, Oñati y los Elorza Archived 2013-08-19 at the Wayback Machine DE LOS VASCOS, OÑATI Y LOS ELORZA Waldo Ayarza Elorza.
- ^ "Jon Erdozia, nuevo Delegado en Chile: 'Iniciativas vasco chilenas como Emprebask son exportables a otros países'". Euskal kultura.
- ^ a b c d De los Vascos, Oñati y los Elorza Archived 2013-08-19 at the Wayback Machine DE LOS VASCOS, OÑATI Y LOS ELORZA Waldo Ayarza Elorza. Page 59, 65, 66
- ^ a b c d e Salazar Vergara, Gabriel; Pinto, Julio (1999). "La Presencia Inmigrante". Historia Contemporánea de Chile. Santiago de Chile: LOM Ediciones. pp. 76–81. ISBN 956-282-174-9. Retrieved September 16, 2012.
- ^ Memoria Presentada al Supremo Gobierno por la Comision Central del Censeo [Report Presented to the Supreme Government by the Central Commission of the Census] (PDF). National Statistics Institute of Chile (Report) (in Spanish). 1907. Archived from the original (PDF) on 4 March 2016. Retrieved 6 April 2022.
- ^ Censeo de Población de la República de Chile [Population Census of the Republic of Chile] (PDF). National Statistics Institute of Chile (Report) (in Spanish). 1920. Archived from the original (PDF) on 4 March 2016. Retrieved 6 April 2022.
- ^ Censo de Población de la República de Chile: Effectuado del 27 Noviembre 1930 [Results of the X Population Census of the Republic of Chile: Dated November 27, 1930] (PDF). National Statistics Institute of Chile (Report) (in Spanish). 1930. Archived from the original (PDF) on 3 March 2016. Retrieved 6 April 2022.
- ^ "5% de los chilenos tiene origen frances". Archived from the original on April 12, 2008.
- ^ "Historia de Chile, Británicos y Anglosajones en Chile durante el siglo XIX". Retrieved 2009-04-26.
- ^ (in Spanish) Diaspora Croata..
- ^ Ilić, Merien (25 March 2009). "Splitski osnovnoškolci rođeni u Čileu" (in Croatian). Hrvatska matica iseljenika. Archived from the original on 4 June 2012.
- ^ "Hrvatski Dom - Inmigrantes Croatas". hrvatski.cl. Archived from the original on 2016-03-03.
- ^ Durán, Hipólito (1997). "El crecimiento de la población latinoamericana y en especial de Chile • Academia Chilena de Medicina". Superpoblación. Madrid: Real Academia Nacional de Medicina. p. 217. ISBN 84-923901-0-7. Retrieved September 16, 2012.
- ^ Pérez Rosales, Vicente (1975) [1860]. Recuerdos del Pasado. Santiago de Chile: Editorial Andrés Bello. Retrieved September 16, 2012.
- ^ "Chiloe Island".
The second line of development is that brought by German colonists of the mid 19th century.
- ^ "A New Moral World Order: Carl Alexander Simon and the German Colonization of Southern Chile".
Between 1848 and 1875, approximately 8,000 German immigrants settled in the area of Lake Llanquihue, Chiloé and Valdivia, misleadingly assuming that Germans were 'people without a country', whereas Chile was 'a country without people'.
- ^ "Reisen Sie nach Chile? Reiseziele zu den wichtigsten touristischen Sehenswürdigkeiten" [Are you travelling to Chile? Major tourist destinations and attractions]. German Embassy in Chile (in German). 2008. Archived from the original on 5 August 2009.
- ^ Rosenberg, Peter (7 September 2001). Deutsche Minderheiten in Lateinamerika [German minorities in Latin America] (PDF). European University Viadrina (Report) (in German). Archived from the original (PDF) on 2 November 2012. Retrieved 6 April 2022.
- ^ Bushnell, David; Hudson, Rex A. (2010). "The Society and Its Environment". In Hudson, Rex A. (ed.). Colombia: a country study. Washington, D.C.: Federal Research Division, Library of Congress. pp. 86–87. ISBN 978-0-8444-9502-6. LCCN 2010009203.
- ^ Douglass, William A.; Bilbao, Jon (2005). Amerikanuak: Basques In The New World. University of Nevada Press. p. 167. ISBN 978-0-87417-675-9.
- ^ Pastor, José Manuel Azcona (2004). Possible Paradises: Basque Emigration to Latin America. University of Nevada Press. p. 203. ISBN 978-0-87417-444-1.
- ^ a b Cock, Diego Andrés Rosselli (15 December 2005). "La comunidad musulmana de Maicao (Colombia)" [The Muslim community of Maicao (Colombia)] (in Spanish). Archived from the original on 29 September 2007.
- ^ Fawcett, Louise; Carbó, Eduardo Posada (1992). "En la tierra de las oportunidades: los sirios-libaneses en Colombia" [In the land of opportunity: Syrian-Lebanese in Colombia]. Boletín Cultural y Bibliográfico (in Spanish). 29 (9): 3–21.
- ^ Leonard, Thomas M.; Bratzel, John F., eds. (2006). Latin America During World War II. Rowman & Littlefield Publishers. p. 117. ISBN 978-1-4616-3862-9.
- ^ "SCADTA Joins the Fight". stampnotes.com. Archived from the original on 2015-09-24. Retrieved 2014-08-07.
- ^ "Auswärtiges Amt - Colombia". Auswärtiges Amt.
- ^ "Población del país es joven y mestiza, dice censo del INEC". El Universo. 2011-09-02.
- ^ Levinson, David. 1998. Ethnic groups worldwide: a ready reference handbook. Greenwood Publishing Group. p. 346. "Blanco or White is more a social-class designation than an ethnic one, as identification as a Blanco is based on a combination of white skin color, European features, speaking Spanish, residence in the western part of the nation (especially in a city), and enough wealth or education to be classified as middle or upper class. However, in some rural regions, Mestizos refer to themselves as Blancos, to distinguish themselves from Native Americans and Quechua speakers. Blancos form the ruling elite in Ecuador, and categorization as a Blanco is considered desirable by people of full or partial European descent.
- ^ Montinaro, Francesco; Busby, George B.J.; Pascali, Vincenzo L.; Myers, Simon; Hellenthal, Garrett; Capelli, Cristian (24 March 2015). "Unravelling the hidden ancestry of American admixed populations". Nature Communications. 6 (1): 6596. Bibcode:2015NatCo...6.6596M. doi:10.1038/ncomms7596. PMC 4374169. PMID 25803618.
- ^ "Jews in Ecuador". Jewish Virtual Library.
- ^ "Paraguayan Census form" (PDF). Dgeec.gov.py. Archived from the original (PDF) on 9 November 2005. Retrieved 8 October 2017.
- ^ "II CENSO NACIONAL INDÍGENA DE POBLACIÓN Y VIVIENDAS 2002. Pueblos Indígenas del Paraguay. Resultados Finales" (PDF). Dgeec.gov.py. Retrieved 8 October 2017.
- ^ "Paraguay: People; Ethnic groups". CIA World Factbook. Retrieved 2007-11-26.
- ^ Paraguay. The World Factbook. Central Intelligence Agency.
- ^ a b c Martinez, María Victoria Benitez (September 2010). Inmigrantes europeos en Paraguay 1818 - 1930. XIV Encuentro de Latinoamericanistas Españoles : congreso internacional (in Spanish). pp. 1099–1121.
- ^ "Establecerán nueva colonia de alemanes en Paraguay". Abc.com (in Spanish). 26 August 2005. Retrieved 24 January 2014.
- ^ Carlos Miranda Loayza; Daniel Abuhadba Rodrigues (2007). "Inmigración Europea al Perú" [European immigration to Peru]. espejodelperu.com.pe (in Spanish). Retrieved 18 January 2016.
- ^ Marca-Ysabel, Maria Victoria; Rajabli, Farid; Cornejo-Olivas, Mario; Whitehead, Patrice G.; Hofmann, Natalia K.; Illanes Manrique, Maryenela Zaida; Veliz Otani, Diego Martin; Milla Neyra, Ana Karina; Castro Suarez, Sheila; Meza Vega, Maria; Adams, Larry D.; Mena, Pedro R.; Rosario, Isasi; Cuccaro, Michael L.; Vance, Jeffery M. (2021-05-01). "Dissecting the role of Amerindian genetic ancestry and the ApoE ε4 allele on Alzheimer disease in an admixed Peruvian population". Neurobiology of Aging. 101: 298.e11–298.e15. doi:10.1016/j.neurobiolaging.2020.10.003. ISSN 0197-4580. PMC 8122013.
- ^ Bonilla, Carolina; Bertoni, Bernardo; González, Susana; Cardoso, Horacio; Brum-Zorrilla, Nadir; Sans, Mónica (May 2004). "Substantial native American female contribution to the population of Tacuarembó, Uruguay, reveals past episodes of sex-biased gene flow: Native American Admixture in Uruguay". American Journal of Human Biology. 16 (3): 289–297. doi:10.1002/ajhb.20025. PMID 15101054. S2CID 34341356.
- ^ Beretta Curi, Alcides (2014). Inmigración europea e industria: Uruguay en la región (1870-1915). Montevideo: Comisión Sectorial de Investigación Científica - Universidad de la República. ISBN 978-9974-0-1081-9.
- ^ "Los rusos de San Javier: a 13.288 kilómetros de Moscú, así sigue la guerra la pequeña colonia en Uruguay". EL PAIS. 2022-03-05. Retrieved 2025-01-15.
- ^ Vidart, Daniel; Pi Hugarte, Renzo. El legado de los inmigrantes II [Our land, the legacy of immigrants II] (PDF). Editorial "Nuestra Tierra". p. 52. Archived from the original (PDF) on 2025-01-15. Retrieved 2025-07-12.
- ^ "¿Por qué ya no hay indígenas en Uruguay?". El Observador (in Spanish). Retrieved 2025-01-11.
- ^ Barrán, José Pedro (September 1995). "El nacimiento del Uruguay Moderno en la segunda mitad del siglo XIX" [The birth of Modern Uruguay in the second half of the 19th century] (in Spanish).[self-published source?]
- ^ Murillo García, Julio Cesar; Gutiérrez Morales, Guillermo; Gallego, Elizabeth (2024-06-30). "La imagen territorial como síntesis identitaria de la mujer emberá chamí, residentes en el departamento de Risaralda, Colombia". Scripta Nova. Revista Electrónica de Geografía y Ciencias Sociales. 28 (2). doi:10.1344/sn2024.28.43359. ISSN 1138-9788.
- ^ "Aumentan los retornos a Uruguay y la inmigración de países vecinos". International Organization for Migration (in Spanish). Retrieved 2025-01-13.
- ^ "Encuesta Continua de Hogares Módulo de Raza Principales Resultadosde". El Instituto Nacional de Estadística (in Spanish). 24 January 2003. Archived from the original on 25 January 2021. Retrieved 22 November 2020.
- ^ Bucheli, Marisa; Cabela, Wanda (2006). El perfil demográfico y socioeconómico de la población uruguaya según su ascendencia racial [The demographic and socioeconomic profile of the Uruguayan population according to their racial ancestry]. Encuesta Nacional de Hogares Ampliada (in Spanish).
- ^ "Censo 2023: Ascendencia étnico racial". Instituto Nacional de Estadística (in Spanish). Archived from the original on 2025-01-20. Retrieved 2025-07-12.
- ^ "Resultado Básico del XIV Censo Nacional de Población y Vivienda 2011 (Mayo 2014)" (PDF). Ine.gov.ve. p. 65. Retrieved 19 June 2022.
- ^ Quinonez, Ernesto (2003-06-19). "Y Tu Black Mama Tambien". Newsweek. Retrieved 2008-05-02.
- ^ "What are Telenovelas?". bellaonline.com.
- ^ "Racial Bias Charged On Spanish-language Tv". tribunedigital-sunsentinel. Archived from the original on 2012-09-15. Retrieved 2011-09-06.
- ^ "Film Description - Corpus - POV - PBS". pbs.org. Archived from the original on 2015-09-24. Retrieved 2017-09-18.
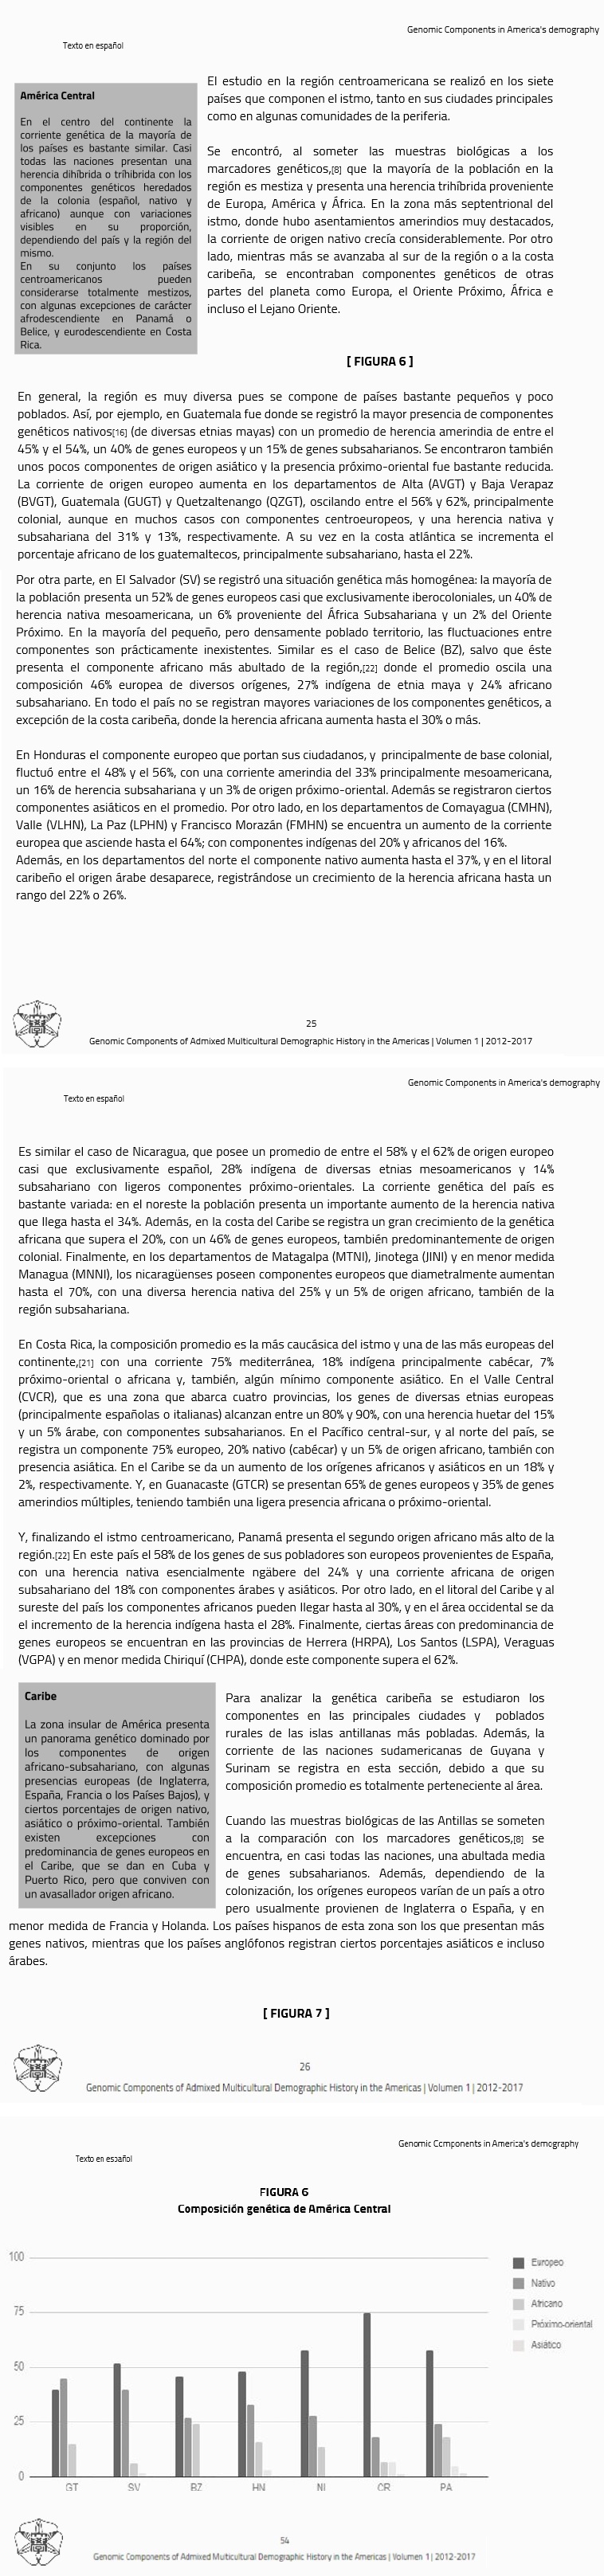
Further reading
[edit]- Twinam, Ann. 2015. Purchasing whiteness: Pardos, mulattos, and the quest for social mobility in the Spanish Indies. Stanford: Stanford University Press.
| |||||||||||
| European emigration by location |
| ||||||||||
| Historical concepts | |||||||||||
| Sociological phenomena and theories |
| ||||||||||
| Negative stereotypes of Whites | |||||||||||
| White identity politics | |||||||||||
White Latin Americans
View on GrokipediaDefinition and Identity
Phenotypic, Cultural, and Self-Identification Criteria
Self-identification serves as the primary criterion for categorizing White Latin Americans in contemporary demographic assessments, particularly in national censuses and surveys where individuals select racial or ethnic categories based on personal perception. This process is not purely subjective but is modulated by phenotypic appearance and socioeconomic position, reflecting historical associations of whiteness with European colonial elites. In Latin America, unlike hypodescent systems in the United States, racial classification emphasizes observable traits over strict ancestry rules, allowing for fluidity where lighter-skinned individuals of mixed heritage may identify as white.[4] Phenotypic criteria for whiteness typically include lighter skin tones, straight or wavy hair textures, and lighter eye and hair colors such as blue, green, or blonde, which align with European morphological standards inherited from colonial-era casta systems that hierarchized mixtures based on visual resemblance to Spaniards. A 2021 genomic study of 6,094 admixed individuals from Brazil, Chile, Colombia, Mexico, and Peru found that self-perceived European ethnicity strongly correlated with these traits—lighter skin and non-curly hair increased the likelihood of white identification, independent of actual genomic proportions of European DNA, which often showed underestimation among self-identified whites. Socioeconomic factors further reinforce this: higher education and wealth indices were positively associated with European self-classification, with odds favoring white identity among affluent, lighter-phenotyped groups, underscoring how class privileges amplify phenotypic signals in a region marked by color hierarchies.[4][5] Cultural criteria are less rigidly defined but often encompass adherence to European-derived customs, languages, and social norms prevalent among descendant communities of Spanish, Portuguese, or later immigrants from Italy, Germany, and elsewhere. White identity frequently intersects with elite status, where historical landownership, urban professionalism, and cosmopolitan orientations distinguish groups maintaining ties to Old World traditions, such as Catholic devotional practices or folk dances from specific European regions, within the broader Latin American cultural matrix. However, these markers are not exclusive, as mestizo populations may adopt similar cultural elements; instead, whiteness culturally manifests through perceived continuity with colonial power structures and modern socioeconomic dominance, where lighter appearance confers symbolic capital in stratified societies. Studies note that in nations like Argentina and Uruguay, cultural whiteness is near-hegemonic due to mass 19th-20th century European inflows, fostering national narratives of European essence, whereas in mestizo-dominant countries, it remains aspirational or class-bound.[6]Distinction from Genetic Ancestry
Self-identification as white among Latin Americans emphasizes phenotypic traits such as lighter skin, hair, and eye color, alongside cultural and socioeconomic factors tied to European heritage, rather than a threshold of genetic purity. Genetic analyses, using ancestry informative markers (AIMs) and genome-wide data, reveal that while this group consistently shows the highest European ancestry proportions within admixed populations, non-European components—typically Native American and African—are often present at low levels, reflecting historical intermixing despite self-perception of whiteness. This admixture arises from colonial-era mating patterns, where European males frequently partnered with indigenous or African women, leading to descendants who, over generations, could phenotypically align with white categories through selection or further European influx.[7][8] In Brazil, a multi-cohort study of over 5,800 individuals found strong but imperfect correlations between self-classification as white and elevated European genomic ancestry, with medians of 85.3% in southern Pelotas and 83.8% in southeastern Bambuí; African and Amerindian contributions were minimal but detectable, averaging under 10-15% combined, and overlaps existed with mixed-race groups in northeastern regions like Salvador where African ancestry diluted distinctions.[8] A 2024 analysis of 364 unrelated São Paulo residents self-identifying as white (branco) reported median ancestry of 86.3% European, 7.4% African, and 3.6% Native American, with 94.8% exceeding 50% European but 67% carrying some African heritage, underscoring that self-reported whiteness thresholds around predominant but not exclusive European genetics.[9] These patterns hold regionally: southern Brazilian whites exhibit less admixture due to 19th-20th century European immigration reinforcing European gene pools, whereas northern groups show greater variability.[10] Across other nations, similar disparities appear, though data specificity for self-identified whites varies. In Argentina, overall population studies indicate 65-78% average European ancestry with 4% African and 26-31% Native American, but self-identified whites—concentrated in urban and southern areas—likely skew higher toward 90%+ European, as admixture is lower in post-colonial immigrant-descended cohorts; Patagonia samples averaged 74.9% European, rising with reported European grandparents.[11] Mexican whites, comprising an estimated 10-20% of the population and often tracing to Spanish criollo elites or later Europeans, display predominantly European profiles, though targeted studies are limited; broader mestizo data show paternal European bias (64.9%) amid 30.8% Native American, suggesting whites exceed these with minimal African input.[12] Such findings affirm that genetic ancestry informs but does not dictate white identity, which prioritizes observable traits and social constructs over precise admixture ratios, with peer-reviewed genomic surveys cautioning against equating self-report with unadmixed European descent.[13]Historical Development
Colonial Era Foundations
The colonial foundations of white Latin American populations originated with Iberian settlement in the Americas, initiated by Spanish expeditions after Christopher Columbus's 1492 voyages and Pedro Álvares Cabral's 1500 arrival in Brazil. Spanish conquests, including Hernán Cortés's defeat of the Aztec Empire in 1519–1521 and Francisco Pizarro's conquest of the Inca Empire in 1532–1533, facilitated the establishment of permanent European communities in viceroyalties such as New Spain and Peru.[1] These early settlers, predominantly male, numbered around 240,000 to 300,000 Iberians arriving in the 16th century, forming the initial base through urban centers, mining operations, and agricultural estates under systems like the encomienda.[1] In Spanish America, the white population expanded via the reproduction of criollos—individuals of full European descent born in the colonies—who inherited privileges from peninsulares (Iberian-born elites) and occupied key roles in governance, the Catholic Church, and haciendas.[1] The casta system codified social stratification, positioning whites (españoles) at the apex, with legal and customary barriers discouraging intermarriage to preserve lineage purity, though informal unions with indigenous and African women were common among lower strata. By the 18th century, continued immigration—estimated at 440,000 Spaniards in the 17th century and 530,000 in the 18th—coupled with natural growth, bolstered white demographics despite high initial mortality from tropical diseases and warfare.[1] Portuguese colonization in Brazil followed a similar pattern, with systematic settlement via capitanias hereditárias from the 1530s, emphasizing sugar plantations and later gold mining. An influx of approximately 600,000 Portuguese during the early 18th-century gold rush significantly augmented the settler population, establishing white elites in coastal and interior regions.[14] Overall, these migrations and reproductive patterns created enduring white minorities—typically 5–20% of total populations by independence—who dominated socioeconomic structures, laying the demographic and cultural groundwork for modern white Latin American identities rooted in European ancestry and colonial privilege.[1]19th- and Early 20th-Century Immigration Waves
Following independence, several Latin American governments implemented policies to attract European immigrants for economic modernization, agricultural expansion, and demographic growth, viewing them as bearers of desired skills and cultural traits.[15] Argentina's 1853 Constitution explicitly promoted free immigration, with subsidies for passages offered in the 1880s to facilitate settlement.[16] Brazil similarly subsidized European laborers, particularly Italians, to replace enslaved workers on coffee plantations after abolition in 1888.[17] These efforts resulted in approximately 13 million Europeans arriving in Latin America between 1870 and 1930, with minimal entry barriers compared to other destinations.[18] Argentina emerged as the primary recipient, absorbing around 6 million European immigrants from 1850 to 1913, predominantly Italians (about 45%) and Spaniards (about 30%), who settled in urban centers like Buenos Aires and rural pampas regions.[19] [20] This influx quadrupled the country's population in the late 19th century, transforming it into one of the world's wealthiest per capita by 1913 through wheat and beef exports.[15] Brazil received 2 to 3 million immigrants during 1870–1930, mainly Italians (1.5 million) directed to southern states like São Paulo for agriculture, alongside Portuguese, Germans, and Spaniards who established colonies in the south.[17] [21] German settlers, numbering over 200,000 by the early 20th century, focused on farming in regions like Rio Grande do Sul.[22] Uruguay experienced proportionally intense immigration, with its population growing sevenfold in the second half of the 19th century largely due to Europeans, reaching 17% foreign-born by 1908; Italians and Spaniards dominated, supplemented by French and others.[15] [23] In Cuba, Spanish immigration surged post-1868 independence wars, with over 500,000 arriving by the early 20th century, primarily from Galicia and the Canary Islands, bolstering the white population amid tobacco and sugar economies.[24] Smaller but notable flows reached Chile (British, Germans for mining) and Venezuela, though these did not significantly alter overall demographics compared to the southern cone.[25] These migrants, overwhelmingly from Italy, Spain, Portugal, and Germany, reinforced white European ancestry in recipient societies, often integrating into elite or middle classes while governments tacitly endorsed "whitening" (blanqueamiento) to elevate perceived racial composition.[15]| Country | Estimated European Immigrants (1870–1930) | Primary Nationalities |
|---|---|---|
| Argentina | 6–7 million | Italian, Spanish |
| Brazil | 2–3 million | Italian, Portuguese, German |
| Uruguay | ~300,000 (relative high impact) | Italian, Spanish, French |
| Cuba | ~500,000–1 million | Spanish |
Mid-20th Century to Present Shifts
Following World War II, European immigration to Latin America declined sharply, with inflows averaging under 100,000 annually across major destinations like Argentina, Brazil, Uruguay, and Venezuela during the 1950s, compared to millions per decade in prior waves driven by economic opportunities and displacement. This slowdown stemmed from Europe's post-war recovery, stricter Latin American policies amid rising nationalism, and shifting global migration patterns toward North America and intra-regional flows. As a result, white populations grew primarily through natural increase rather than influxes, stabilizing relative proportions in Southern Cone nations while exposing others to endogenous admixture pressures.[26][27] In Brazil, census data reveal a notable shift in self-identification: the proportion identifying as white fell from 53.7% in 2000 to 47.7% in 2010 and further to 43.5% by 2022, with corresponding rises in the pardo (mixed) category from 39.1% to 45.3% and 50.7%, respectively. This change correlates with urbanization, expanded access to education, and intermarriage rates exceeding 20% in urban centers by the late 20th century, diluting phenotypic boundaries and prompting reclassification amid fluid cultural norms favoring mixed identities over strict European ancestry claims. Similar patterns appear in Colombia and Venezuela, where self-reported white shares dropped from around 20-30% in mid-century estimates to 15-20% by 2010s censuses, attributed to higher fertility among mestizo groups and emigration of whites during political instability—such as over 1 million departures from Venezuela since 2000, disproportionately affecting European-descended elites.[28][29][30] Conversely, in Argentina and Uruguay, white majorities—estimated at 97% and 88% of populations, respectively, based on ancestry surveys—exhibited relative stability post-1950, with minimal erosion from admixture due to sparse indigenous (under 2%) and African-descended (4-8%) minorities, coupled with low intermarriage rates below 10% in rural strongholds. National censuses in these countries largely omitted race questions after the 1940s, relying on indirect proxies like birthplace, which masked subtle shifts from internal mestizaje in urban peripheries but confirmed persistence of European phenotypic dominance through endogamous elite networks and geographic segregation. In Cuba, pre-1959 white self-identification hovered at 72%, but post-revolutionary exodus of over 500,000 primarily white exiles by 1980 reduced the share to 64% by 2012 estimates, illustrating how political upheavals accelerated demographic outflows over endogenous mixing.[31][32][1] Census methodologies evolved variably, with reintroductions of self-identification in Brazil (from 1991) and Peru (2017) highlighting greater racial fluidity than earlier enumerator-assigned categories, potentially understating mid-century white shares by 5-10% due to aspirational whitening biases now reversed amid affirmative policies. Overall, these shifts reflect causal interplay of halted immigration, differential fertility (non-white rates 10-20% higher in admixed nations until convergence post-1990s), and socioeconomic mobility eroding endogamy, yielding absolute white population growth but proportional declines averaging 5-15% in tracked countries since 1950.[33][34]Genetic Ancestry and Admixture
Proportions of European DNA Across Populations
Genetic studies utilizing genome-wide autosomal markers have quantified European ancestry proportions in Latin American populations, revealing substantial inter-country and intra-country variation attributable to differential colonial settlement, immigration waves, and admixture rates. In southern cone nations with heavy 19th- and 20th-century European influx, averages exceed 70%, whereas in Mesoamerican and Andean regions, they often fall below 50%, with Native American components dominating. These estimates derive from admixture mapping and principal component analysis in peer-reviewed genomic datasets, typically involving hundreds to thousands of individuals per study.[35][1] The following table summarizes average European ancestry proportions from representative genome-wide studies, focusing on national or major regional samples:| Country/Region | European Ancestry (%) | Notes/Source |
|---|---|---|
| Argentina | 65–79 | Overall national; higher in urban centers like Buenos Aires (76–80%). Corach et al. (2010); Avena et al. (2012).[36][37] |
| Uruguay | 85 | National average; reflects strong European settler dominance. Sans et al. (2002).[35] |
| Brazil | 60–77 | Varies by region; higher in South/Southeast (70–89%). Kehdy et al. (2015).[35][1] |
| Chile | 53–64 | National; elevated in central regions due to colonial and post-independence migration. Eyheramendy et al. (2015).[35] |
| Paraguay | 62 | National; influenced by Guarani admixture but with notable European input. Simão et al. (2021).[35] |
| Venezuela | 61 | National; coastal areas show higher European fractions. Moura et al. (2015).[35] |
| Colombia | 37–65 | Varies widely; Antioquia region up to 79%. Ruiz-Linares et al. (2014).[35][1] |
| Costa Rica | 54–60 | Central Valley higher; reflects Spanish colonial base with limited African admixture. Ruiz-Narváez et al. (2010).[35] |
| Cuba | 72–86 | Higher among self-identified whites; Havana samples. Marcheco-Teruel et al. (2014).[1] |
| Mexico | 36–50 | National; northern states up to 62%, central lower (21–32%). Silva-Zolezzi et al. (2009); Wang et al. (2008).[35][1] |
| Peru | 10–19 | Coastal higher (14–15%); Andean predominantly Native. 1000 Genomes Project (2015).[35][1] |
| Bolivia | 0.5–15 | Minimal; high Andean Native ancestry. Galanter et al. (2012).[35] |
Key Studies and Regional Variations
A landmark study by Wang et al. (2010) analyzed genome-wide patterns of population structure and admixture in 13 Latin American countries using STRUCTURE software on autosomal and X-chromosome data, revealing average European ancestry ranging from 30-90% across samples, with higher proportions in southern populations and lower in those with greater Native American or African contributions.[38] This work highlighted non-random admixture patterns tied to colonial demographics, where European male lineages predominated in many regions. Similarly, Pena et al. (2015) examined Brazilian admixture dynamics, finding that self-identified white Brazilians in the southeast and south exhibited predominantly European ancestry (often 80-90%), resulting from assortative mating and immigration waves, though with residual Native American (5-10%) and African (5-15%) components varying by locale.[39] Regional variations in European ancestry among white-identifying populations reflect historical migration, settlement, and mating patterns. In the Southern Cone—Argentina, Uruguay, and southern Brazil—studies indicate average European autosomal ancestry exceeding 78% in general populations, rising to 85-95% among self-identified whites due to 19th-century European immigration; for instance, a genetic analysis of Argentines reported 78.5% European DNA overall, with white subgroups showing minimal admixture.[40] In contrast, Central American white populations, such as in Costa Rica or Guatemala, display 60-80% European ancestry, tempered by higher Native American proportions (15-30%) from pre-colonial densities.[41] Further north, Mexican white-identifying individuals average 60-75% European ancestry per admixture mapping studies, with significant Native American input (20-35%) concentrated in central and southern regions, as evidenced by microsatellite analyses of over 1,000 samples showing paternal European bias but maternal Native persistence.[42] Caribbean white groups, including in Cuba or the Dominican Republic, exhibit lower European shares (50-70%) due to African admixture (10-30%), though elite historical strata retain higher European purity.[43] These gradients underscore causal influences like proximity to indigenous heartlands and slave trade routes, with southern latitudes favoring European dominance via later, larger settler inflows.[1]| Region | Avg. European Ancestry in White Populations | Key Admixture Influences | Source |
|---|---|---|---|
| Southern Cone (e.g., Argentina) | 85-95% | Immigration-driven, low Native/African | [40] |
| Southern Brazil | 80-90% | Assortative mating, regional settlement | [39] |
| Mexico/Central America | 60-75% | Native maternal lines, colonial mixing | [42] |
| Caribbean (e.g., Cuba) | 50-70% | African paternal/maternal input | [43] |
Demographic Overview
Overall Estimates and Census Methodologies
Estimates of the white population in Latin America range from approximately 150 million to 220 million, representing 23–33% of the region's total population of about 662 million as of 2024, though precise figures are challenging due to inconsistent data collection across countries.[44] These variations stem from differing national approaches to racial categorization, with some relying on self-identification of skin color or ethnicity, others omitting such questions entirely, and a few incorporating ancestry or indigenous language proficiency as proxies. Self-identification, the dominant modern method where data exists, often reflects social perceptions of phenotype and cultural norms rather than strict genetic criteria, potentially undercounting individuals with predominant European ancestry in mestizo-dominant societies.[45] Aggregate estimates thus combine official censuses from select nations with extrapolations from immigration records or private surveys for others, introducing uncertainty; for instance, countries like Argentina and Uruguay, with historically high European immigration, lack routine racial censuses but are estimated to have white majorities based on demographic histories.[33] In countries that enumerate race or color, methodologies typically involve respondents selecting predefined categories during household surveys or censuses, emphasizing self-perception over observer assessment—a shift from 19th–20th century practices where enumerators often classified based on appearance or descent. Brazil's Instituto Brasileiro de Geografia e Estatística (IBGE) uses five categories (branco for white, pardo for mixed, preto for black, amarelo for Asian-descent, and indigenous), with the 2022 census recording 43.5% (about 88.2 million) as branco out of a total population of 203 million, down from 47.7% in 2010, attributed to shifting self-perceptions amid affirmative action policies.[46] Similarly, Venezuela's 2011 census employed self-identification, yielding 43.6% white, though subsequent political instability has hindered updates. Colombia and Peru have incorporated ethno-racial self-identification in recent censuses (e.g., Colombia's 2018 survey at 20.8% white), focusing on categories like blanco, mestizo, and afrodescendiente, but these capture cultural identity more than ancestry, with lower white figures in indigenous-influenced regions.[45] Nations without direct racial data, such as Argentina, rely on indirect indicators like foreign-born ancestry (e.g., 30% of the population in the early 20th century from Europe) or occasional surveys, yielding estimates of 85–97% European-descended, or roughly 38–44 million white individuals from a 46 million total. Mexico's census avoids explicit racial categories, instead querying indigenous self-identification or language use, resulting in low explicit white claims (around 9–15% in surveys), despite genetic studies showing higher European admixture averages. This patchwork approach underscores systemic underreporting in mestizo-centric cultures, where social desirability favors mixed identities, and highlights the need for standardized self-identification to improve comparability, as recommended in regional analyses.[33][47] Overall, while self-reported data provides the most direct evidence, its subjectivity—potentially biased by class, region, or policy incentives—necessitates caution in totaling white populations beyond country-specific figures.Self-Identified Populations by Region
In the Southern Cone of South America, comprising Argentina, Uruguay, Chile, and Paraguay, self-identification as white remains predominant, largely attributable to extensive 19th- and 20th-century European immigration from Italy, Spain, and other nations, which demographically overwhelmed indigenous and African-descended populations. Uruguay's official estimates from 2011 place self-identified whites at 87.7% of the population. Similar patterns hold in Argentina, where, absent direct racial categorization in national censuses, surveys and demographic analyses consistently indicate over 85% self-identifying as white or of primarily European descent, reflecting minimal admixture in self-perception. In Chile, a 2011 Latinobarómetro survey reported 59% self-identifying as white, though genetic studies reveal average European ancestry of about 54% among this group, suggesting self-ID incorporates lighter mestizo phenotypes.[48] Brazil, representing a distinct regional demographic hub in eastern South America, recorded 43.5% of its population self-identifying as white in the 2022 national census conducted by the Brazilian Institute of Geography and Statistics (IBGE), down from 47.7% in 2010, amid shifting social perceptions of racial categories.[46] This figure equates to approximately 88.3 million individuals, concentrated in southern and southeastern states like Rio Grande do Sul and São Paulo, where European settler communities dominate. In contrast, northern and northeastern regions show lower rates, often below 20%, due to higher indigenous and African admixture. Northern and Andean South America exhibit more varied and generally lower self-identification as white. Venezuela's 2011 National Population and Housing Census reported 43.6% white self-identification, primarily in Andean and capital regions. Colombia's 2018 census did not separately tally whites, with 87.6% not affiliating with specific ethnic minorities (implicitly mestizo or white), but ancillary surveys estimate white self-ID at around 20-30%, clustered in highland areas like Antioquia. Peru's recent census data indicate only 4.6% self-identifying as white, underscoring strong mestizo dominance in Andean populations. Central America shows moderate concentrations, as in Costa Rica's 2011 census, where 66% identified as white or castizo (European-dominant mestizo).[49] Mexico lacks routine racial self-ID in censuses, but estimates from demographic studies place it at 9-17%, mainly in northern states with Spanish colonial legacies. Caribbean islands like Cuba report higher figures, with 64.1% white in the 2012 census, though recent migration and underreporting may adjust this downward.| Region | Key Countries | Approximate Self-ID White % (Recent Data) | Source Notes |
|---|---|---|---|
| Southern Cone | Uruguay | 87.7% (2011 est.) | CIA World Factbook estimates based on self-perception. |
| Southern Cone | Argentina | 85-97% (surveys/genetic correlates) | No census race data; derived from immigration history and self-reports. |
| Southern Cone | Chile | 59% (2011 survey) | Latinobarómetro; self-ID exceeds genetic European average.[48] |
| Brazil | Brazil | 43.5% (2022 census) | Official IBGE; decline from prior decades.[46] |
| Northern/Andean | Venezuela | 43.6% (2011 census) | National census; regional variation high. |
| Northern/Andean | Colombia | 20-30% (estimates) | Inferred from 2018 census non-ethnic majority. |
| Central America | Costa Rica | 66% white/castizo (2011 census) | INEC census; includes European-dominant mixed.[49] |
| Mexico | Mexico | 9-17% (estimates) | Demographic studies; no standard census category. |