
Community hub
Recent from talks
Contribute something
Nothing was collected or created yet.
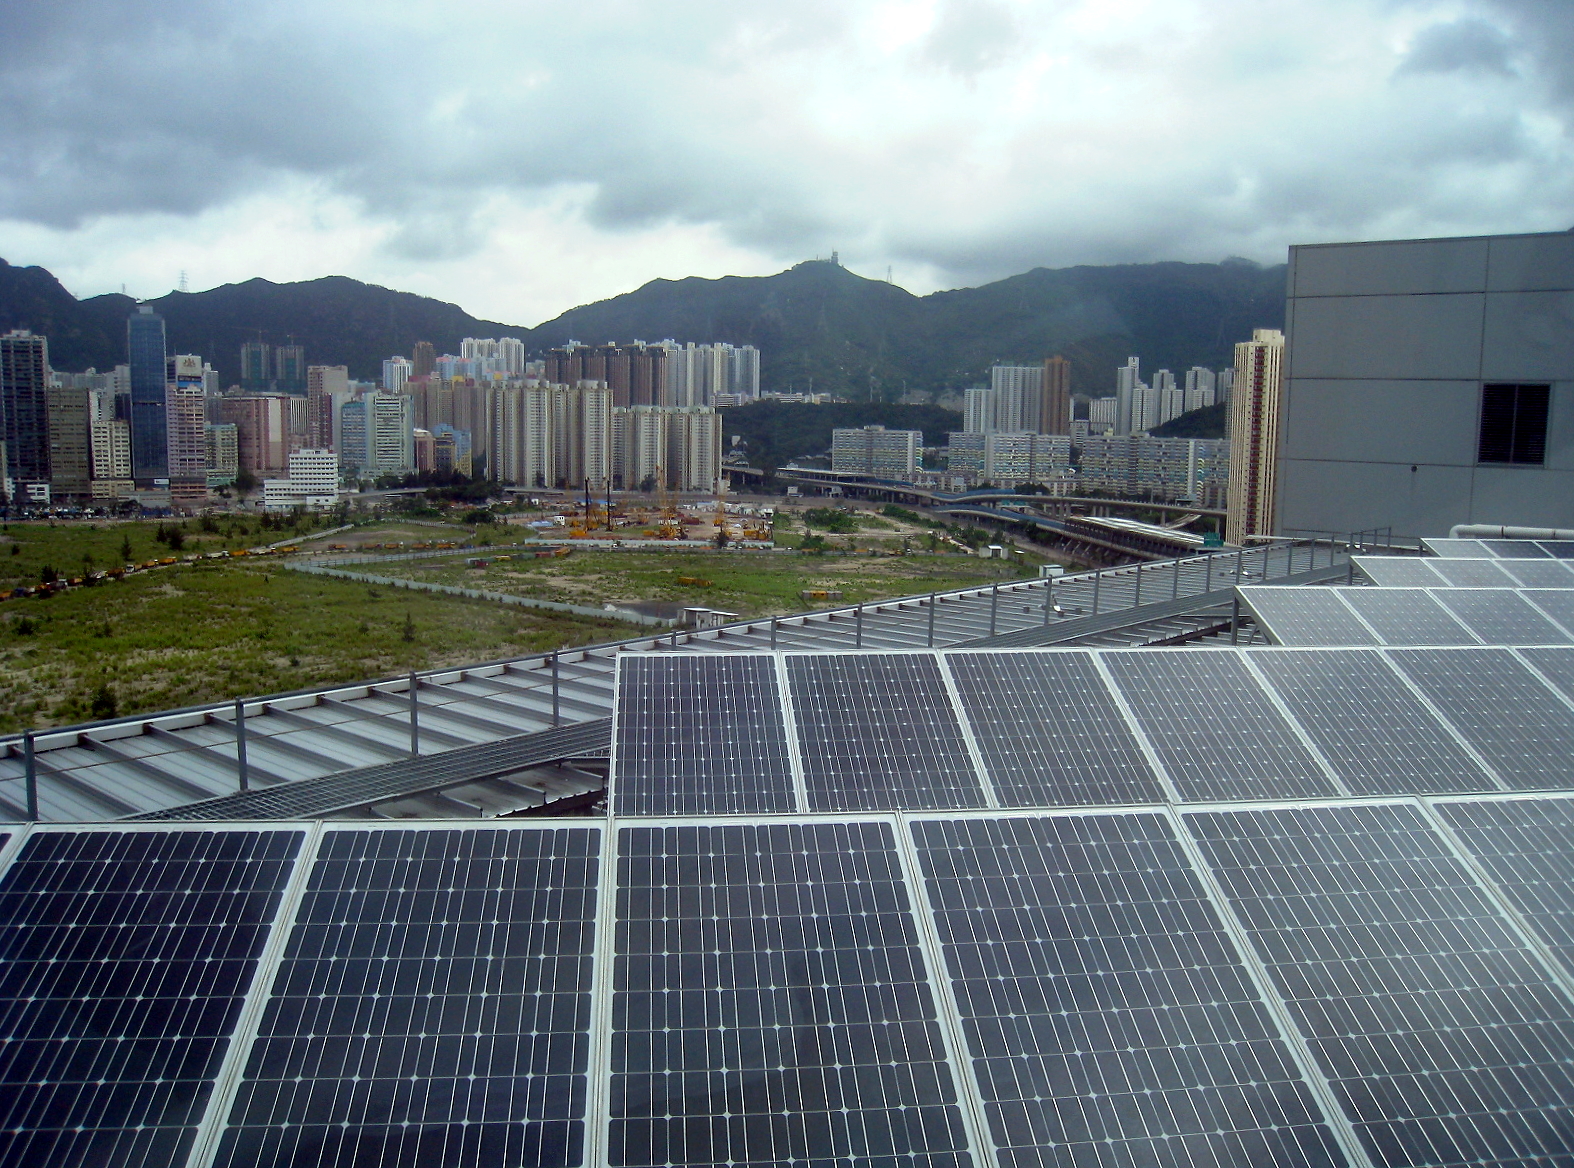
Solar power
View on Wikipedia


Solar power, also known as solar electricity, is the conversion of energy from sunlight into electricity, either directly using photovoltaics (PV) or indirectly using concentrated solar power. Solar panels use the photovoltaic effect to convert light into an electric current.[2] Concentrated solar power systems use lenses or mirrors and solar tracking systems to focus a large area of sunlight to a hot spot, often to drive a steam turbine.
Photovoltaics (PV) were initially solely used as a source of electricity for small and medium-sized applications, from the calculator powered by a single solar cell to remote homes powered by an off-grid rooftop PV system. Commercial concentrated solar power plants were first developed in the 1980s. Since then, as the cost of solar panels has fallen, grid-connected solar PV systems' capacity and production has doubled about every three years. Three-quarters of new generation capacity is solar,[3] with both millions of rooftop installations and gigawatt-scale photovoltaic power stations continuing to be built.
In 2024, solar power generated 6.9% (2,132 TWh) of global electricity and over 1% of primary energy, adding twice as much new electricity as coal.[4][5] Along with onshore wind power, utility-scale solar is the source with the cheapest levelised cost of electricity for new installations in most countries.[6][7] As of 2023, 33 countries generated more than a tenth of their electricity from solar, with China making up more than half of solar growth.[8] Almost half the solar power installed in 2022 was mounted on rooftops.[9]
Much more low-carbon power is needed for electrification and to limit climate change.[3] The International Energy Agency said in 2022 that more effort was needed for grid integration and the mitigation of policy, regulation and financing challenges.[10] Nevertheless solar may greatly cut the cost of energy.[5]
Potential
[edit]| Part of a series on |
| Sustainable energy |
|---|
 |
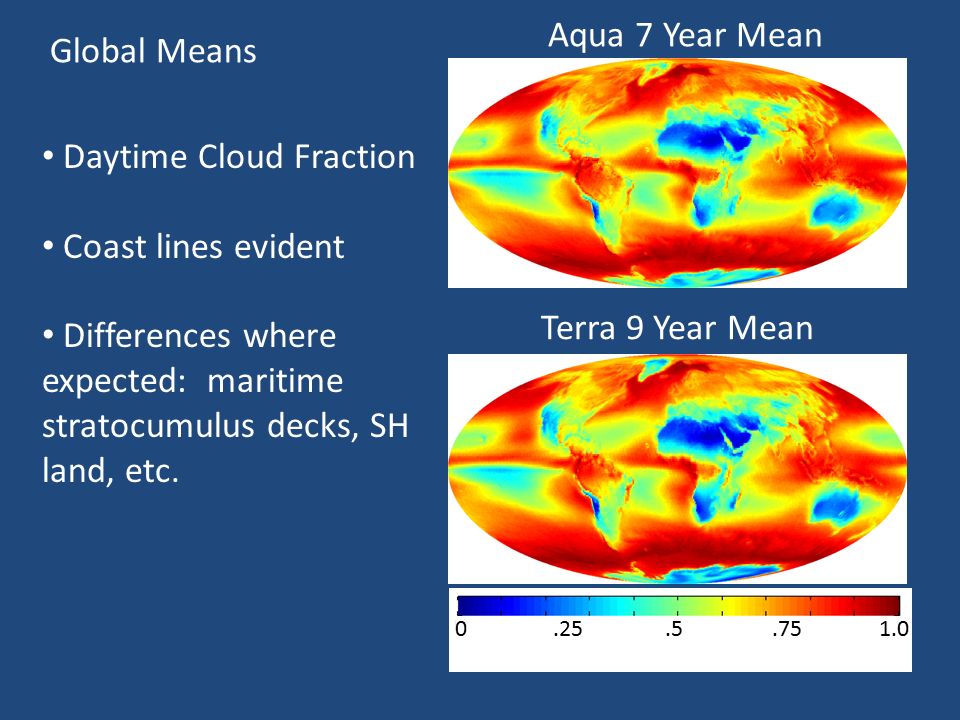
Geography affects solar energy potential because different locations receive different amounts of solar radiation. In particular, with some variations, areas that are closer to the equator generally receive higher amounts of solar radiation. However, solar panels that can follow the position of the Sun can significantly increase the solar energy potential in areas that are farther from the equator.[11] Daytime cloud cover can reduce the light available for solar cells. Land availability also has a large effect on the available solar energy.
Technologies
[edit]Solar power plants use one of two technologies:
- Photovoltaic (PV) systems use solar panels, either on rooftops or in ground-mounted solar farms, converting sunlight directly into electric power.[12]
- Concentrated solar power (CSP) systems use mirrors or lenses to concentrate sunlight to extreme heat to make steam, which is converted into electricity by a turbine.[13]
Photovoltaic cells
[edit]
A solar cell, or photovoltaic cell, is a device that converts light into electric current using the photovoltaic effect. The first solar cell was constructed by Charles Fritts in the 1880s.[15] The German industrialist Ernst Werner von Siemens was among those who recognized the importance of this discovery.[16] In 1931, the German engineer Bruno Lange developed a photo cell using silver selenide in place of copper oxide,[17] although the prototype selenium cells converted less than 1% of incident light into electricity. Following the work of Russell Ohl in the 1940s, researchers Gerald Pearson, Calvin Fuller and Daryl Chapin created the silicon solar cell in 1954.[18] These early solar cells cost US$286/watt and reached efficiencies of 4.5–6%.[19] In 1957, Mohamed M. Atalla developed the process of silicon surface passivation by thermal oxidation at Bell Labs.[20][21] The surface passivation process has since been critical to solar cell efficiency.[22]
As of 2022[update] over 90% of the market is crystalline silicon.[23] The array of a photovoltaic system, or PV system, produces direct current (DC) power which fluctuates with the sunlight's intensity. For practical use this usually requires conversion to alternating current (AC), through the use of inverters.[14] Multiple solar cells are connected inside panels. Panels are wired together to form arrays, then tied to an inverter, which produces power at the desired voltage, and for AC, the desired frequency/phase.[14]
Many residential PV systems are connected to the grid when available, especially in developed countries with large markets.[24] In these grid-connected PV systems, use of energy storage is optional. In certain applications such as satellites, lighthouses, or in developing countries, batteries or additional power generators are often added as back-ups. Such stand-alone power systems permit operations at night and at other times of limited sunlight.
In "vertical agrivoltaics" system, solar cells are oriented vertically on farmland, to allow the land to both grow crops and generate renewable energy.[25] Other configurations include floating solar farms, placing solar canopies over parking lots, and installing solar panels on roofs.[25]
Thin-film solar
[edit]A thin-film solar cell is a second generation solar cell that is made by depositing one or more thin layers, or thin film (TF) of photovoltaic material on a substrate, such as glass, plastic or metal. Thin-film solar cells are commercially used in several technologies, including cadmium telluride (CdTe), copper indium gallium diselenide (CIGS), and amorphous thin-film silicon (a-Si, TF-Si).[26]
Perovskite solar cells
[edit]A perovskite solar cell (PSC) is a type of solar cell that includes a perovskite-structured compound, most commonly a hybrid organic–inorganic lead or tin halide-based material as the light-harvesting active layer.[27][28] Perovskite materials, such as methylammonium lead halides and all-inorganic cesium lead halide, are cheap to produce and simple to manufacture.
Solar-cell efficiencies of laboratory-scale devices using these materials have increased from 3.8% in 2009[29] to 25.7% in 2021 in single-junction architectures,[30][31] and, in silicon-based tandem cells, to 34.85%,[30][32] exceeding the maximum efficiency achieved in single-junction silicon solar cells. Perovskite solar cells have therefore been the fastest-advancing solar technology as of 2016[update].[27] With the potential of achieving even higher efficiencies and very low production costs, perovskite solar cells have become commercially attractive. Core problems and research subjects include their short- and long-term stability.[33]Concentrated solar power
[edit]
Concentrated solar power (CSP), also called "concentrated solar thermal", uses lenses or mirrors and tracking systems to concentrate sunlight, then uses the resulting heat to generate electricity from conventional steam-driven turbines.[34]
As of 2021[update] the levelized cost of electricity from CSP is over twice that of PV.[35] As of 2022, less than 1% of solar power comes from CSP.
Hybrid systems
[edit]A hybrid system combines solar with energy storage or one or more other forms of generation. Hydro,[36][37] wind[38][39] and batteries[40] are commonly combined with solar. The combined generation may enable the system to vary power output with demand, or at least smooth the solar power fluctuation.[41][42] There is much hydro worldwide, and adding solar panels on or around existing hydro reservoirs is particularly useful, because hydro is usually more flexible than wind and cheaper at scale than batteries,[43] and existing power lines can sometimes be used.[44][45]
Development and deployment
[edit]


Early days
[edit]The early development of solar technologies starting in the 1860s was driven by an expectation that coal would soon become scarce, such as experiments by Augustin Mouchot.[49] Charles Fritts installed the world's first rooftop photovoltaic solar array, using 1%-efficient selenium cells, on a New York City roof in 1884.[50] However, development of solar technologies stagnated in the early 20th century in the face of the increasing availability, economy, and utility of coal and petroleum.[51] Bell Telephone Laboratories' 1950s research used silicon wafers with a thin coating of boron. The "Bell Solar Battery" was described as 6% efficient, with a square yard of the panels generating 50 watts.[52] The first satellite with solar panels was launched in 1957.[53]
By the 1970s, solar panels were still too expensive for much other than satellites.[54] In 1974 it was estimated that only six private homes in all of North America were entirely heated or cooled by functional solar power systems.[55] However, the 1973 oil embargo and 1979 energy crisis caused a reorganization of energy policies around the world and brought renewed attention to developing solar technologies.[56][57]
Deployment strategies focused on incentive programs such as the Federal Photovoltaic Utilization Program in the US and the Sunshine Program in Japan. Other efforts included the formation of research facilities in the United States (SERI, now NREL), Japan (NEDO), and Germany (Fraunhofer ISE).[58] Between 1970 and 1983 installations of photovoltaic systems grew rapidly. In the United States, President Jimmy Carter set a target of producing 20% of U.S. energy from solar by the year 2000, but his successor, Ronald Reagan, removed the funding for research into renewables.[54] Falling oil prices in the early 1980s moderated the growth of photovoltaics from 1984 to 1996.
Mid-1990s to 2010
[edit]In the mid-1990s development of both, residential and commercial rooftop solar as well as utility-scale photovoltaic power stations began to accelerate again due to supply issues with oil and natural gas, global warming concerns, and the improving economic position of PV relative to other energy technologies.[54][59] In the early 2000s, the adoption of feed-in tariffs—a policy mechanism, that gives renewables priority on the grid and defines a fixed price for the generated electricity—led to a high level of investment security and to a soaring number of PV deployments in Europe.
2010s
[edit]For several years, worldwide growth of solar PV was driven by European deployment, but it then shifted to Asia, especially China and Japan, and to a growing number of countries and regions all over the world. The largest manufacturers of solar equipment were based in China.[60][61] Although concentrated solar power capacity grew more than tenfold, it remained a tiny proportion of the total,[62]: 51 because the cost of utility-scale solar PV fell by 85% between 2010 and 2020, while CSP costs only fell 68% in the same timeframe.[63]
2020s
[edit]Despite the rising cost of materials, such as polysilicon, during the 2021–2022 global energy crisis,[64] utility scale solar was still the least expensive energy source in many countries due to the rising costs of other energy sources, such as natural gas.[65] In 2022, global solar generation capacity exceeded 1 TW for the first time.[66] However, fossil-fuel subsidies have slowed the growth of solar generation capacity.[67]
Current status
[edit]About half of installed capacity is utility scale.[68]

Forecasts
[edit]
Solar is forecast to become the largest source of renewable power before the end of the 2020s.[69] Utility scale is forecast to become the largest source of electricity in all regions except sub-Saharan Africa by 2050.[68]
Photovoltaic power stations
[edit]
A photovoltaic power station, also known as a solar park, solar farm, or solar power plant, is a large-scale grid-connected photovoltaic power system (PV system) designed for the supply of merchant power. They are different from most building-mounted and other decentralized solar power because they supply power at the utility level, rather than to a local user or users. Utility-scale solar is sometimes used to describe this type of project.
This approach differs from concentrated solar power, the other major large-scale solar generation technology, which uses heat to drive a variety of conventional generator systems. Both approaches have their own advantages and disadvantages, but to date, for a variety of reasons, photovoltaic technology has seen much wider use. As of 2019[update], about 97% of utility-scale solar power capacity was PV.[70][71]
In some countries, the nameplate capacity of photovoltaic power stations is rated in megawatt-peak (MWp), which refers to the solar array's theoretical maximum DC power output. In other countries, the manufacturer states the surface and the efficiency. However, Canada, Japan, Spain, and the United States often specify using the converted lower nominal power output in MWAC, a measure more directly comparable to other forms of power generation. Most solar parks are developed at a scale of at least 1 MWp. As of 2018, the world's largest operating photovoltaic power stations surpassed 1 gigawatt. At the end of 2019, about 9,000 solar farms were larger than 4 MWAC (utility scale), with a combined capacity of over 220 GWAC.[70]
Most of the existing large-scale photovoltaic power stations are owned and operated by independent power producers, but the involvement of community and utility-owned projects is increasing.[72] Previously, almost all were supported at least in part by regulatory incentives such as feed-in tariffs or tax credits, but as levelized costs fell significantly in the 2010s and grid parity has been reached in most markets, external incentives are usually not needed.Concentrating solar power stations
[edit]

Commercial concentrating solar power (CSP) plants, also called "solar thermal power stations", were first developed in the 1980s. The 377 MW Ivanpah Solar Power Facility, located in California's Mojave Desert, is the world's largest solar thermal power plant project. Other large CSP plants include the Solnova Solar Power Station (150 MW), the Andasol solar power station (150 MW), and Extresol Solar Power Station (150 MW), all in Spain. The principal advantage of CSP is the ability to efficiently add thermal storage, allowing the dispatching of electricity over up to a 24-hour period. Since peak electricity demand typically occurs at about 5 pm, many CSP power plants use 3 to 5 hours of thermal storage.[73]
Economics
[edit]Cost per watt
[edit]In many countries, solar power is the lowest cost source of electricity.[74] The typical cost factors for solar power include the costs of the modules, the frame to hold them, wiring, inverters, labour cost, any land that might be required, the grid connection, maintenance and the solar insolation that location will receive.
Photovoltaic systems use no fuel, and modules typically last 25 to 40 years.[75] Thus upfront capital and financing costs make up 80% to 90% of the cost of solar power,[76]: 165 which is a problem for countries where contracts may not be honoured, such as some African countries.[5] Some countries are considering price caps,[77] whereas others prefer contracts for difference.[78]
Installation prices
[edit]Expenses of high-power band solar modules has greatly decreased over time. Beginning in 1982, the cost per kW was approximately 27,000 American dollars, and in 2006 the cost dropped to approximately 4,000 American dollars per kW. The PV system in 1992 cost approximately 16,000 American dollars per kW and it dropped to approximately 6,000 American dollars per kW in 2008.[79] In 2025 in the US, residential solar costs around 2.50 dollars/watt[80] (but solar shingles cost much more).[81] As of 2025[update] utility solar costs are around 25 UScent/watt.[82]
Productivity by location
[edit]The productivity of solar power in a region depends on solar irradiance, which varies through the day and year and is influenced by latitude and climate. PV system output power also depends on ambient temperature, wind speed, solar spectrum, the local soiling conditions, and other factors.
Onshore wind power tends to be the cheapest source of electricity in Northern Eurasia, Canada, some parts of the United States, and Patagonia in Argentina whereas in other parts of the world mostly solar power (or less often a combination of wind, solar and other low carbon energy) is thought to be best.[83]: 8 Modelling by Exeter University suggests that by 2030, solar will be least expensive everywhere except in some nordic countries.[84]
The locations with highest annual solar irradiance lie in the arid tropics and subtropics. Deserts lying in low latitudes usually have few clouds and can receive sunshine for more than ten hours a day.[85][86] These hot deserts form the Global Sun Belt circling the world. This belt consists of extensive swathes of land in Northern Africa, Southern Africa, Southwest Asia, Middle East, and Australia, as well as the much smaller deserts of North and South America.[87]
Thus solar is (or is predicted to become) the cheapest source of energy in all of Central America, Africa, the Middle East, India, South-east Asia, Australia, and several other regions.[83]: 8
Different measurements of solar irradiance (direct normal irradiance, global horizontal irradiance) are mapped below:
-
 North America
 -
 South America
 -
 Europe
 -
 Africa and Middle East
 -
 South and South-East Asia
 -
 Australia
 -
 World
World


Self-consumption
[edit]In cases of self-consumption of solar energy, the payback time is calculated based on how much electricity is not purchased from the grid.[88] However, in many cases, the patterns of generation and consumption do not coincide, and some or all of the energy is fed back into the grid. The electricity is sold, and at other times when energy is taken from the grid, electricity is bought. The relative costs and prices obtained affect the economics. In many markets, the price paid for sold PV electricity is significantly lower than the price of bought electricity, which incentivizes self-consumption.[89] Moreover, separate self-consumption incentives have been used in e.g., Germany and Italy.[89] Grid interaction regulation has also included limitations of grid feed-in in some regions in Germany with high amounts of installed PV capacity.[89][90] By increasing self-consumption, the grid feed-in can be limited without curtailment, which wastes electricity.[91]
A good match between generation and consumption is key for high self-consumption. The match can be improved with batteries or controllable electricity consumption.[91] However, batteries are expensive, and profitability may require the provision of other services from them besides self-consumption increase,[92] for example avoiding power outages.[93] Hot water storage tanks with electric heating with heat pumps or resistance heaters can provide low-cost storage for self-consumption of solar power.[91] Shiftable loads, such as dishwashers, tumble dryers and washing machines, can provide controllable consumption with only a limited effect on the users, but their effect on self-consumption of solar power may be limited.[91]
Energy pricing, incentives and taxes
[edit]The original political purpose of incentive policies for PV was to facilitate an initial small-scale deployment to begin to grow the industry, even where the cost of PV was significantly above grid parity, to allow the industry to achieve the economies of scale necessary to reach grid parity. Since reaching grid parity, some policies are implemented to promote national energy independence,[94] high tech job creation[95] and reduction of CO2 emissions.[94]
Net metering
[edit]Net metering is a pricing method for residential solar: the price of the electricity produced is the same as the price supplied to the consumer, and the consumer is billed on the difference between production and consumption.[96]
Community solar
[edit]
A community solar project is a solar power installation that accepts capital from and provides output credit and tax benefits to multiple customers, including individuals, businesses, nonprofits, and other investors. Participants typically invest in or subscribe to a certain kW capacity or kWh generation of remote electrical production.[98]
Taxes
[edit]In some countries tariffs (import taxes) are imposed on imported solar panels.[99][100]
Grid integration
[edit]
.jpg)


Variability
[edit]The overwhelming majority of electricity produced worldwide is used immediately because traditional generators can adapt to demand and storage is usually more expensive. Both solar power and wind power are sources of variable renewable power, meaning that all available output must be used locally, carried on transmission lines to be used elsewhere, or stored (e.g., in a battery). Since solar energy is not available at night, storing it so as to have continuous electricity availability is potentially an important issue, particularly in off-grid applications and for future 100% renewable energy scenarios.[104]
Solar is intermittent due to the day/night cycles and variable weather conditions. However solar power can be forecast somewhat by time of day, location, and seasons. The challenge of integrating solar power in any given electric utility varies significantly. In places with hot summers and mild winters, solar tends to be well matched to daytime cooling demands.[105]
Energy storage
[edit]Concentrated solar power plants may use thermal storage to store solar energy, such as in high-temperature molten salts. These salts are an effective storage medium because they are low-cost, have a high specific heat capacity, and can deliver heat at temperatures compatible with conventional power systems. This method of energy storage is used, for example, by the Solar Two power station, allowing it to store 1.44 TJ in its 68 m3 storage tank, enough to provide full output for close to 39 hours, with an efficiency of about 99%.[106]
In stand alone PV systems, batteries are traditionally used to store excess electricity. With grid-connected photovoltaic power systems, excess electricity can be sent to the electrical grid. Net metering and feed-in tariff programs give these systems a credit for the electricity they produce. This credit offsets electricity provided from the grid when the system cannot meet demand, effectively trading with the grid instead of storing excess electricity.[107] When wind and solar are a small fraction of the grid power, other generation techniques can adjust their output appropriately, but as these forms of variable power grow, additional balance on the grid is needed. As prices are rapidly declining, PV systems increasingly use rechargeable batteries to store a surplus to be used later at night. Batteries used for grid-storage can stabilize the electrical grid by leveling out peak loads for a few hours. In the future, less expensive batteries could play an important role on the electrical grid, as they can charge during periods when generation exceeds demand and feed their stored energy into the grid when demand is higher than generation.
Common battery technologies used in today's home PV systems include nickel-cadmium, lead-acid, nickel metal hydride, and lithium-ion.[108][109][better source needed]Lithium-ion batteries have the potential to replace lead-acid batteries in the near future, as they are being intensively developed and lower prices are expected due to economies of scale provided by large production facilities such as the Tesla Gigafactory 1. In addition, the Li-ion batteries of plug-in electric cars may serve as future storage devices in a vehicle-to-grid system. Since most vehicles are parked an average of 95% of the time, their batteries could be used to let electricity flow from the car to the power lines and back.
Retired electric vehicle (EV) batteries can be repurposed.[110] Other rechargeable batteries used for distributed PV systems include, sodium–sulfur and vanadium redox batteries, two prominent types of a molten salt and a flow battery, respectively.[111][112][113]

Other technologies
[edit]Solar power plants, while they can be curtailed, usually simply output as much power as possible. Therefore in an electricity system without sufficient grid energy storage, generation from other sources (coal, biomass, natural gas, nuclear, hydroelectricity) generally go up and down in reaction to the rise and fall of solar electricity and variations in demand (see load following power plant).
Conventional hydroelectric dams work very well in conjunction with solar power; water can be held back or released from a reservoir as required. Where suitable geography is not available, pumped-storage hydroelectricity can use solar power to pump water to a high reservoir on sunny days, then the energy is recovered at night and in bad weather by releasing water via a hydroelectric plant to a low reservoir where the cycle can begin again.[115]
While hydroelectric and natural gas plants can quickly respond to changes in load; coal, biomass and nuclear plants usually take considerable time to respond to load and can only be scheduled to follow the predictable variation. Depending on local circumstances, beyond about 20–40% of total generation, grid-connected intermittent sources like solar tend to require investment in some combination of grid interconnections, energy storage or demand side management. In countries with high solar generation, such as Australia, electricity prices may become negative in the middle of the day when solar generation is high, thus incentivizing new battery storage.[116][117]
The combination of wind and solar PV has the advantage that the two sources complement each other because the peak operating times for each system occur at different times of the day and year.[118] The power generation of such solar hybrid power systems is therefore more constant and fluctuates less than each of the two component subsystems.[119] Solar power is seasonal, particularly in northern/southern climates, away from the equator, suggesting a need for long term seasonal storage in a medium such as hydrogen or pumped hydroelectric.[120]
Environmental effects
[edit]

Solar power is cleaner than electricity from fossil fuels,[23] and is better for the environment than burning things.[121][122] Solar power does not lead to harmful emissions during operation, but the production of the panels creates some pollution. The carbon footprint of manufacturing is less than 1kg CO2/Wp,[123] and this is expected to fall as manufacturers use more clean electricity and recycled materials.[124] Solar power carries an upfront cost to the environment via production with a carbon payback time of several years as of 2022[update],[124] but offers clean energy for the remainder of their 30-year lifetime.[125]
The life-cycle greenhouse-gas emissions of solar farms are less than 50 gram (g) per kilowatt-hour (kWh),[126][127][128] but with battery storage could be up to 150 g/kWh.[129] In contrast, a combined cycle gas-fired power plant without carbon capture and storage emits around 500 g/kWh, and a coal-fired power plant about 1000 g/kWh.[130] Similar to all energy sources where their total life cycle emissions are mostly from construction, the switch to low carbon power in the manufacturing and transportation of solar devices would further reduce carbon emissions.[128]
Lifecycle surface power density of solar power varies[131] but averages about 7 W/m2, compared to about 240 for nuclear power and 480 for gas.[132] However, when the land required for gas extraction and processing is accounted for, gas power is estimated to have not much higher power density than solar.[23] According to a 2021 study, obtaining 25% to 80% of electricity from solar farms in their own territory by 2050 would require the panels to cover land ranging from 0.5% to 2.8% of the European Union, 0.3% to 1.4% in India, and 1.2% to 5.2% in Japan and South Korea.[133] Occupation of such large areas for PV farms could drive residential opposition as well as lead to deforestation, removal of vegetation and conversion of farm land.[134] However some countries, such as South Korea and Japan, use land for agriculture under PV,[135][136] or floating solar,[137] together with other low-carbon power sources.[138][139] Worldwide land use has minimal ecological impact.[140] Land use can be reduced to the level of gas power by installing on buildings and other built up areas.[131]
Harmful materials are used in the production of solar panels, but generally in small amounts.[141] As of 2022[update], the environmental impact of perovskite is difficult to estimate, but there is some concern that lead may be a problem.[23]
A 2021 International Energy Agency study projects the demand for copper will double by 2040. The study cautions that supply needs to increase rapidly to match demand from large-scale deployment of solar and required grid upgrades.[142][143] More tellurium and indium may also be needed.[23]
Recycling may help.[23] As solar panels are sometimes replaced with more efficient panels, the second-hand panels are sometimes reused in developing countries, for example in Africa.[144] Several countries have specific regulations for the recycling of solar panels.[145][146][147] Although maintenance cost is already low compared to other energy sources,[148] some academics have called for solar power systems to be designed to be more repairable.[149][150]
Solar panels can increase local temperature. In large installation in the desert, the effect can be stronger than the urban heat island.[151]
A very small proportion of solar power is concentrated solar power. Concentrated solar power may use much more water than gas-fired power. This can be a problem, as this type of solar power needs strong sunlight so is often built in deserts.[152]
Politics
[edit]It has been argued that although the economic benefits of the energy transition to solar (and other clean energy) are so great that it cannot be stopped,[154] slowing it would result in more climate damage.[155] The fossil fuels lobby has been accused of delaying the transition.[156] Fossil fuel subsidies are political,[157][158] and impede the transition.[159] Solar generation cannot be cut off by geopolitics once installed, unlike oil and gas, which contributes to energy security.[160] And libertarians may favor it for reducing dependence on government,[161] and reliance on inadequate electricity grids.[162] However some right wing parties are opposed to or split on solar.[163][164] Far right party positions vary by country, with some opposing utility solar as part of their climate change denial.[165][166] Although Green parties may favor solar as part of climate change mitigation some environmentalists oppose new power lines.[167]
As of 2022[update] over 40% of global polysilicon manufacturing capacity is in Xinjiang in China,[168] which raises concerns about human rights violations (Xinjiang internment camps).[169] According to the International Solar Energy Society China's dominance of manufacturing is not a problem, both because they estimate solar manufacturing cannot grow to more than 400b USD per year, and because if Chinese supply was cut off other countries would have years to create their own industry.[170] Businesses may lobby government for or against tariffs on panel imports.[171][172]
See also
[edit]- 100% renewable energy
- Cost of electricity by source
- Gravity battery
- Index of solar energy articles
- List of cities by sunshine duration
- List of photovoltaic power stations
- List of solar thermal power stations
- List of solar-powered products
- Renewable energy commercialization
- Solar energy
- Solar lamp
- Solar vehicle
- Sustainable energy
- Thin-film solar cell
- Timeline of solar cells
References
[edit]- ^ "Global Solar Atlas". globalsolaratlas.info. Retrieved 12 August 2022.
- ^ "Energy Sources: Solar". Department of Energy. Archived from the original on 14 April 2011. Retrieved 19 April 2011.
- ^ a b Gabbatiss, Josh (12 January 2024). "Analysis: World will add enough renewables in five years to power US and Canada". Carbon Brief. Retrieved 11 February 2024.
- ^ "Global Electricity Review 2025". Ember. 8 April 2025. Retrieved 13 April 2025.
- ^ a b c "Sun Machines". The Economist. ISSN 0013-0613. Retrieved 26 June 2024.
- ^ "2023 Levelized Cost Of Energy+". Lazard. Retrieved 14 June 2023.
- ^ "Executive summary – Renewable Energy Market Update – Analysis". IEA. June 2023. Retrieved 14 June 2023.
- ^ "Global Electricity Review 2024". Ember. 7 May 2024. Retrieved 2 September 2024.
- ^ Norman, Will (13 June 2023). "Through the roof: 49.5% of world's PV additions were rooftop in 2022 – SolarPower Europe". PV Tech. Retrieved 14 June 2023.
- ^ "Solar PV – Analysis". IEA. Retrieved 10 November 2022.
- ^ Goldemberg, José; UNDP, eds. (2000). World energy assessment: energy and the challenge of sustainability (1. print ed.). New York, New York: United Nations Development Programme. ISBN 978-92-1-126126-4.
- ^ Arif, Muhammad (2019). Power Generation Technologies: An Introduction. Islamabad, Pakistan: Pakistan Institute of Engineering and Applied Sciences (PIEAS). p. 7. ISBN 978-969-7583-01-0.
- ^ Arif, Muhammad (2019). Power Generation Technologies: An Introduction. Islamabad, Pakistan: Pakistan Institute of Engineering and Applied Sciences (PIEAS). p. 8. ISBN 978-969-7583-01-0.
- ^ a b c Lewis Fraas, Larry Partain. Solar Cells and their Applications, Second Edition, Wiley, 2010, ISBN 978-0-470-44633-1, Section10.2.
- ^ Perlin 1999, p. 147.
- ^ Perlin 1999, pp. 18–20.
- ^ Corporation, Bonnier (June 1931). "Magic Plates, Tap Sun For Power". Popular Science: 41. Retrieved 19 April 2011.
- ^ Perlin 1999, p. 29.
- ^ Perlin 1999, pp. 29–30, 38.
- ^ Black, Lachlan E. (2016). New Perspectives on Surface Passivation: Understanding the Si-Al2O3 Interface (PDF). Springer. p. 13. ISBN 978-3-319-32521-7.
- ^ Lojek, Bo (2007). History of Semiconductor Engineering. Springer Science & Business Media. pp. 120& 321–323. ISBN 978-3-540-34258-8.
- ^ Black, Lachlan E. (2016). New Perspectives on Surface Passivation: Understanding the Si-Al2O3 Interface (PDF). Springer. ISBN 978-3-319-32521-7.
- ^ a b c d e f Urbina, Antonio (26 October 2022). "Sustainability of photovoltaic technologies in future net-zero emissions scenarios". Progress in Photovoltaics: Research and Applications. 31 (12): 1255–1269. doi:10.1002/pip.3642.
the apparent contradiction that can arise from the fact that large PV plants occupy more land than the relatively compact coal or gas plants is due to the inclusion in the calculation of impacts in land occupation arising from coal mining and oil or gas extraction; if they are included, the impact on land occupation is larger for fossil fuels.
- ^ "Trends in Photovoltaic Applications Survey report of selected IEA countries between 1992 and 2009, IEA-PVPS". Archived from the original on 25 May 2017. Retrieved 8 November 2011.
- ^ a b Budin, Jeremiah (17 January 2024). "Game-Changing Solar Power Technology to Get First US Installation: Valuable Land is almost Completely Preserved". The Cooldown. Archived from the original on 17 January 2024.
- ^ "Thin-Film Solar Panels | American Solar Energy Society".
- ^ a b Manser, Joseph S.; Christians, Jeffrey A.; Kamat, Prashant V. (2016). "Intriguing Optoelectronic Properties of Metal Halide Perovskites". Chemical Reviews. 116 (21): 12956–13008. doi:10.1021/acs.chemrev.6b00136. PMID 27327168.
- ^ Hamers, Laurel (26 July 2017). "Perovskites power up the solar industry". Science News.
- ^ Kojima, Akihiro; Teshima, Kenjiro; Shirai, Yasuo; Miyasaka, Tsutomu (6 May 2009). "Organometal Halide Perovskites as Visible-Light Sensitizers for Photovoltaic Cells". Journal of the American Chemical Society. 131 (17): 6050–6051. Bibcode:2009JAChS.131.6050K. doi:10.1021/ja809598r. PMID 19366264.
- ^ a b "Best Research-Cell Efficiencies" (PDF). National Renewable Energy Laboratory. 30 June 2022. Archived from the original (PDF) on 3 August 2022. Retrieved 12 July 2022.
- ^ Min, Hanul; Lee, Do Yoon; Kim, Junu; Kim, Gwisu; Lee, Kyoung Su; Kim, Jongbeom; Paik, Min Jae; Kim, Young Ki; Kim, Kwang S.; Kim, Min Gyu; Shin, Tae Joo; Il Seok, Sang (21 October 2021). "Perovskite solar cells with atomically coherent interlayers on SnO2 electrodes". Nature. 598 (7881): 444–450. Bibcode:2021Natur.598..444M. doi:10.1038/s41586-021-03964-8. PMID 34671136.
- ^ "Longi achieves 34.85% efficiency for two-terminal tandem perovskite solar cell". PV Magazine. Retrieved 16 October 2025.
- ^ Sun, Kai; Wang, Yanyan; Xu, Haoyuan; Zhang, Jing; Zhu, Yuejin; Hu, Ziyang (2019). "Short-Term Stability of Perovskite Solar Cells Affected by In Situ Interface Modification". Solar RRL. 3 (9) 1900089. doi:10.1002/solr.201900089.
- ^ "How CSP Works: Tower, Trough, Fresnel or Dish". Solarpaces. 11 June 2018. Retrieved 14 March 2020.
- ^ "Renewable Power Generation Costs in 2021". irena.org. 13 July 2022. Retrieved 4 November 2022.
- ^ Garanovic, Amir (10 November 2021). "World's largest hydro-floating solar hybrid comes online in Thailand". Offshore Energy. Retrieved 7 November 2022.
- ^ Ming, Bo; Liu, Pan; Guo, Yi (2022). "Operations management of large hydro–PV hybrid power plants: Case studies in China". Complementarity of Variable Renewable Energy Sources. pp. 439–502. doi:10.1016/B978-0-323-85527-3.00008-X. ISBN 978-0-323-85527-3.
- ^ "World's largest wind-solar hybrid complex goes online in India". Renewablesnow.com. 30 September 2022. Retrieved 7 November 2022.
- ^ Todorović, Igor (4 November 2022). "China completes world's first hybrid offshore wind-solar power plant". Balkan Green Energy News. Retrieved 7 November 2022.
- ^ Which?. "Solar panel battery storage". Which?. Retrieved 7 November 2022.
- ^ Brumana, Giovanni; Franchini, Giuseppe; Ghirardi, Elisa; Perdichizzi, Antonio (May 2022). "Techno-economic optimization of hybrid power generation systems: A renewables community case study". Energy. 246 123427. Bibcode:2022Ene...24623427B. doi:10.1016/j.energy.2022.123427.
- ^ Wang, Zhenni; Wen, Xin; Tan, Qiaofeng; Fang, Guohua; Lei, Xiaohui; Wang, Hao; Yan, Jinyue (August 2021). "Potential assessment of large-scale hydro-photovoltaic-wind hybrid systems on a global scale". Renewable and Sustainable Energy Reviews. 146 111154. Bibcode:2021RSERv.14611154W. doi:10.1016/j.rser.2021.111154.
- ^ Todorović, Igor (22 July 2022). "Portugal, Switzerland launch pumped storage hydropower plants of over 2 GW in total". Balkan Green Energy News. Retrieved 8 November 2022.
- ^ Bank (ADB), Asian Development. "ADB Partnership Report 2019: Building Strong Partnerships for Shared Progress". Asian Development Bank. Retrieved 7 November 2022.
- ^ Merlet, Stanislas; Thorud, Bjørn (18 November 2020). "Floating solar power connected to hydropower might be the future for renewable energy". sciencenorway.no. Retrieved 7 November 2022.
- ^ "Chart: Solar installations set to break global, US records in 2023". Canary Media. 15 September 2023. Archived from the original on 17 September 2023. For relevant chart, Canary Media credits: "Source: BloombergNEF, September 2023"
- ^ Chase, Jenny (5 September 2023). "3Q 2023 Global PV Market Outlook". BloombergNEF. Archived from the original on 21 September 2023.
- ^ 2023 data: Chase, Jenny (4 March 2024). "1Q 2024 Global PV Market Outlook". BNEF.com. BloombergNEF. Archived from the original on 13 June 2024.
- ^ Scientific American. Munn & Company. 10 April 1869. p. 227.
- ^ "Photovoltaic Dreaming 1875–1905: First Attempts At Commercializing PV". cleantechnica.com. 31 December 2014. Archived from the original on 30 August 2024. Retrieved 30 April 2018.
- ^ Butti and Perlin (1981), pp. 63, 77, 101.
- ^ "The Bell Solar Battery" (advertisement). Audio, July 1964, 15.
- ^ "Vanguard I The World's Oldest Satellite Still in Orbit". Archived from the original on 21 March 2015. Retrieved 24 September 2007.
 This article incorporates text from this source, which is in the public domain.
- ^ a b c Levy, Adam (13 January 2021). "The dazzling history of solar power". Knowable Magazine. doi:10.1146/knowable-011321-1.
- ^ "The Solar Energy Book—Once More." Mother Earth News 31: 16–17, January 1975.
- ^ Butti and Perlin (1981), p. 249.
- ^ Yergin (1991), pp. 634, 653–673.
- ^ "Chronicle of Fraunhofer-Gesellschaft". Fraunhofer-Gesellschaft. Archived from the original on 12 December 2007. Retrieved 4 November 2007.
- ^ Solar: photovoltaic: Lighting Up The World retrieved 19 May 2009 Archived 13 August 2010 at the Wayback Machine.
- ^ Colville, Finlay (30 January 2017). "Top-10 solar cell producers in 2016". PV-Tech. Archived from the original on 2 February 2017.
- ^ Ball, Jeffrey; et al. (21 March 2017). "The New Solar System – Executive Summary" (PDF). Stanford University Law School, Steyer-Taylor Center for Energy Policy and Finance. Archived (PDF) from the original on 20 April 2017. Retrieved 27 June 2017.
- ^ REN21 (2014). "Renewables 2014: Global Status Report" (PDF). Archived (PDF) from the original on 15 September 2014.
{{cite web}}: CS1 maint: numeric names: authors list (link) - ^ Santamarta, Jose. "The cost of Concentrated Solar Power declined by 16%". HELIOSCSP. Retrieved 15 September 2022.
- ^ "What is the impact of increasing commodity and energy prices on solar PV, wind and biofuels? – Analysis". IEA. December 2021. Retrieved 4 April 2022.
- ^ "Levelized Cost Of Energy, Levelized Cost Of Storage, and Levelized Cost Of Hydrogen". Lazard.com. Retrieved 4 April 2022.
- ^ "World Installs a Record 168 GW of Solar Power in 2021, enters Solar Terawatt Age". SolarPower Europe.
- ^ McDonnell, Tim (29 August 2022). "Soaring fossil fuel subsidies are holding back clean energy". Quartz. Retrieved 4 September 2022.
- ^ a b Olson, Dana; Bakken, Bent Erik. "Utility-scale solar PV: From big to biggest". Det Norske Veritas. Retrieved 15 January 2024.
- ^ "Solar - IEA". IEA. Archived from the original on 16 September 2025. Retrieved 4 October 2025.
- ^ a b Wolfe, Philip (17 March 2020). "Utility-scale solar sets new record" (PDF). Wiki-Solar. Retrieved 11 May 2010.
- ^ "Concentrated solar power had a global total installed capacity of 6,451 MW in 2019". HelioCSP. 2 February 2020. Retrieved 11 May 2020.
- ^ "Expanding Renewable Energy in Pakistan's Electricity Mix". World Bank. Retrieved 17 July 2022.
- ^ What is peak demand? Archived 11 August 2012 at the Wayback Machine, Energex.com.au website.
- ^ "Why wind and solar are key solutions to combat climate change". Ember. 9 February 2024. Retrieved 11 February 2024.
- ^ Nian, Victor; Mignacca, Benito; Locatelli, Giorgio (August 2022). "Policies toward net-zero: Benchmarking the economic competitiveness of nuclear against wind and solar energy". Applied Energy. 320 119275. Bibcode:2022ApEn..32019275N. doi:10.1016/j.apenergy.2022.119275. hdl:11311/1227558.
- ^ "Renewable electricity – Renewables 2022 – Analysis". IEA. Retrieved 12 December 2022.
- ^ "EU expects to raise €140bn from windfall tax on energy firms". the Guardian. 14 September 2022. Retrieved 15 September 2022.
- ^ "The EU's energy windfall tax gives UK ministers a yardstick for their talks". The Guardian. 14 September 2022. Retrieved 15 September 2022.
- ^ Timilsina, Govinda R.; Kurdgelashvili, Lado; Narbel, Patrick A. (January 2012). "Solar energy: Markets, economics and policies". Renewable and Sustainable Energy Reviews. 16 (1): 449–465. Bibcode:2012RSERv..16..449T. doi:10.1016/j.rser.2011.08.009.
- ^ Gearino, By Dan (3 April 2025). "Solar Panel Prices Are Rising Again. Here's Why, and What May Be Next". Inside Climate News. Retrieved 4 October 2025.
- ^ "Solar Shingles Vs. Solar Panels: Cost, Efficiency & More (2021)". EcoWatch. 8 August 2021. Retrieved 25 August 2021.
- ^ "Solar (photovoltaic) panel prices". Our World in Data. Archived from the original on 30 September 2025. Retrieved 4 October 2025.
- ^ a b Bogdanov, Dmitrii; Ram, Manish; Aghahosseini, Arman; Gulagi, Ashish; Oyewo, Ayobami Solomon; Child, Michael; Caldera, Upeksha; Sadovskaia, Kristina; Farfan, Javier; De Souza Noel Simas Barbosa, Larissa; Fasihi, Mahdi; Khalili, Siavash; Traber, Thure; Breyer, Christian (July 2021). "Low-cost renewable electricity as the key driver of the global energy transition towards sustainability". Energy. 227 120467. Bibcode:2021Ene...22720467B. doi:10.1016/j.energy.2021.120467.
- ^ "Is a solar future inevitable?" (PDF). University of Exeter. Retrieved 2 October 2023.
- ^ "Daytime Cloud Fraction Coast lines evident". Archived from the original on 22 August 2017. Retrieved 22 August 2017.
- ^ "Sunshine". Archived from the original on 23 September 2015. Retrieved 6 September 2015.
- ^ "Living in the Sun Belt: The Solar Power Potential for the Middle East". 27 July 2016. Archived from the original on 26 August 2017. Retrieved 22 August 2017.
- ^ "Money saved by producing electricity from PV and Years for payback". Archived from the original on 28 December 2014.
- ^ a b c Trends in Photovoltaic Applications 2014 (PDF) (Report). IEA-PVPS. 2014. Archived (PDF) from the original on 25 May 2017.
- ^ Stetz, T.; Marten, F.; Braun, M. (2013). "Improved Low Voltage Grid-Integration of Photovoltaic Systems in Germany". IEEE Transactions on Sustainable Energy. 4 (2): 534–542. Bibcode:2013ITSE....4..534S. doi:10.1109/TSTE.2012.2198925.
- ^ a b c d Salpakari, Jyri; Lund, Peter (2016). "Optimal and rule-based control strategies for energy flexibility in buildings with PV". Applied Energy. 161: 425–436. Bibcode:2016ApEn..161..425S. doi:10.1016/j.apenergy.2015.10.036.
- ^ Fitzgerald, Garrett; Mandel, James; Morris, Jesse; Touati, Hervé (2015). The Economics of Battery Energy Storage (PDF) (Report). Rocky Mountain Institute. Archived from the original (PDF) on 30 November 2016.
- ^ "The Value of Electricity Reliability: Evidence from Battery Adoption". Resources for the Future. Retrieved 14 June 2023.
- ^ a b "Germany boosts renewables with "biggest energy policy reform in decades"". Clean Energy Wire. 6 April 2022. Retrieved 8 November 2022.
- ^ "Indigenizing Solar Manufacturing: Charting the Course to a Solar Self-Sufficient India". www.saurenergy.com. November 2022. Retrieved 8 November 2022.
- ^ "Does net metering for home solar create winners and losers? | MIT Climate Portal". climate.mit.edu. Retrieved 4 October 2025.
- ^ Mentzel, Dashal (25 October 2023). "Partnership brings benefits of community solar to Vernon County". WEAU. Retrieved 22 November 2023.
- ^ "Community Solar Basics". Energy.gov. Retrieved 17 September 2021.
- ^ Philipp, Jennifer (7 September 2022). "Solar Power in Africa on the Rise". BORGEN. Retrieved 15 September 2022.
- ^ Busch, Marc L. (2 September 2022). "The mystery of India's new solar tariffs". The Hill. Retrieved 15 September 2022.
- ^ Wright, matthew; Hearps, Patrick; et al. Australian Sustainable Energy: Zero Carbon Australia Stationary Energy Plan Archived 24 November 2015 at the Wayback Machine, Energy Research Institute, University of Melbourne, October 2010, p. 33. Retrieved from BeyondZeroEmissions.org website.
- ^ Palgrave, Robert (1 December 2008). "Innovation in CSP". Renewable Energy Focus. 9 (6). Elsevier: 44–49. Bibcode:2008REneF...9...44P. doi:10.1016/S1755-0084(08)70066-8. Archived from the original on 24 September 2015.
- ^ Ray Stern (10 October 2013). "Solana: 10 Facts You Didn't Know About the Concentrated Solar Power Plant Near Gila Bend". Phoenix New Times. Archived from the original on 11 October 2013.
- ^ Carr (1976), p. 85.
- ^ Ruggles, Tyler H.; Caldeira, Ken (January 2022). "Wind and solar generation may reduce the inter-annual variability of peak residual load in certain electricity systems". Applied Energy. 305 117773. Bibcode:2022ApEn..30517773R. doi:10.1016/j.apenergy.2021.117773.
- ^ "Advantages of Using Molten Salt". Sandia National Laboratory. Archived from the original on 5 June 2011. Retrieved 29 September 2007.
- ^ "PV Systems and Net Metering". Department of Energy (United States). Archived from the original on 4 July 2008. Retrieved 31 July 2008.
- ^ Mohanty, Parimita; Muneer, Tariq; Kolhe, Mohan (30 October 2015). Solar Photovoltaic System Applications: A Guidebook for Off-Grid Electrification. Springer. p. 91. ISBN 978-3-319-14663-8. Retrieved 22 August 2022.
- ^ Xiao, Weidong (24 July 2017). Photovoltaic Power System: Modeling, Design, and Control. John Wiley & Sons. p. 288. ISBN 978-1-119-28034-7. Retrieved 22 August 2022.
- ^ Al-Alawi, Mohammed Khalifa; Cugley, James; Hassanin, Hany (1 December 2022). "Techno-economic feasibility of retired electric-vehicle batteries repurpose/reuse in second-life applications: A systematic review". Energy and Climate Change. 3 100086. doi:10.1016/j.egycc.2022.100086. ISSN 2666-2787.
- ^ Hoppmann, Joern; Volland, Jonas; Schmidt, Tobias S.; Hoffmann, Volker H. (July 2014). "The Economic Viability of Battery Storage for Residential Solar Photovoltaic Systems – A Review and a Simulation Model". ETH Zürich, Harvard University. Archived from the original on 3 April 2015.
- ^ Gerdes, Justin. "Solar Energy Storage About To Take Off In Germany and California". Forbes. Archived from the original on 29 July 2017. Retrieved 8 February 2023.
- ^ "Tesla launches Powerwall home battery with aim to revolutionize energy consumption". Associated Press. 1 May 2015. Archived from the original on 7 June 2015.
- ^ Kaspar, Frank; Borsche, Michael; Pfeifroth, Uwe; Trentmann, Jörg; Drücke, Jaqueline; Becker, Paul (2 July 2019). "A climatological assessment of balancing effects and shortfall risks of photovoltaics and wind energy in Germany and Europe". Advances in Science and Research. 16: 119–128. Bibcode:2019AdSR...16..119K. doi:10.5194/asr-16-119-2019.
- ^ "Pumped Hydro Storage". Electricity Storage Association. Archived from the original on 21 June 2008. Retrieved 31 July 2008.
- ^ Parkinson, Giles (23 October 2022). ""We don't need solar technology breakthroughs, we just need connections"". RenewEconomy. Retrieved 8 November 2022.
- ^ Vorrath, Sophie (17 October 2022). "MPower gets green light to connect solar battery projects, cash in on negative pricing". RenewEconomy. Retrieved 8 November 2022.
- ^ Nyenah, Emmanuel; Sterl, Sebastian; Thiery, Wim (May 2022). "Pieces of a puzzle: solar-wind power synergies on seasonal and diurnal timescales tend to be excellent worldwide". Environmental Research Communications. 4 (5): 055011. Bibcode:2022ERCom...4e5011N. doi:10.1088/2515-7620/ac71fb.
- ^ "Hybrid Wind and Solar Electric Systems". United States Department of Energy. 2 July 2012. Archived from the original on 26 May 2015.
- ^ Converse, Alvin O. (February 2012). "Seasonal Energy Storage in a Renewable Energy System". Proceedings of the IEEE. 100 (2): 401–409. doi:10.1109/JPROC.2011.2105231.
- ^ Fact Sheet: Environmental Life Cycle Assessment of Electricity from PV Systems (Report). IEA PVPS. 2 May 2024.
- ^ Environment, U. N. (11 October 2017). "Renewable energy | UNEP - UN Environment Programme". www.unep.org. Retrieved 5 October 2025.
- ^ Müller, Amelie; Friedrich, Lorenz; Reichel, Christian; Herceg, Sina; Mittag, Max; Neuhaus, Dirk Holger (15 September 2021). "A comparative life cycle assessment of silicon PV modules: Impact of module design, manufacturing location and inventory". Solar Energy Materials and Solar Cells. 230 111277. Bibcode:2021SEMSC.23011277M. doi:10.1016/j.solmat.2021.111277.
- ^ a b "Solar power's potential limited unless "you do everything perfectly" says solar scientist". Dezeen. 21 September 2022. Retrieved 15 October 2022.
- ^ "Aging Gracefully: How NREL Is Extending the Lifetime of Solar Modules". www.nrel.gov. Retrieved 15 October 2022.
- ^ Zhu, Xiaonan; Wang, Shurong; Wang, Lei (April 2022). "Life cycle analysis of greenhouse gas emissions of China's power generation on spatial and temporal scale". Energy Science & Engineering. 10 (4): 1083–1095. Bibcode:2022EneSE..10.1083Z. doi:10.1002/ese3.1100.
- ^ "Carbon Neutrality in the UNECE Region: Integrated Life-cycle Assessment of Electricity Sources" (PDF). p. 49.
- ^ a b "Life Cycle Greenhouse Gas Emissions from Solar Photovoltaics" (PDF).
- ^ Mehedi, Tanveer Hassan; Gemechu, Eskinder; Kumar, Amit (May 2022). "Life cycle greenhouse gas emissions and energy footprints of utility-scale solar energy systems". Applied Energy. 314 118918. Bibcode:2022ApEn..31418918M. doi:10.1016/j.apenergy.2022.118918.
- ^ "Life Cycle Assessment Harmonization". www.nrel.gov. Retrieved 4 December 2021.
- ^ a b Ritchie, Hannah (16 June 2022). "How does the land use of different electricity sources compare?". Our World in Data. Retrieved 3 November 2022.
- ^ Van Zalk, John; Behrens, Paul (1 December 2018). "The spatial extent of renewable and non-renewable power generation: A review and meta-analysis of power densities and their application in the U.S." Energy Policy. 123: 83–91. Bibcode:2018EnPol.123...83V. doi:10.1016/j.enpol.2018.08.023. hdl:1887/64883. ISSN 0301-4215.
- ^ van de Ven, Dirk-Jan; Capellan-Peréz, Iñigo; Arto, Iñaki; Cazcarro, Ignacio; de Castro, Carlos; Patel, Pralit; Gonzalez-Eguino, Mikel (3 February 2021). "The potential land requirements and related land use change emissions of solar energy". Scientific Reports. 11 (1): 2907. Bibcode:2021NatSR..11.2907V. doi:10.1038/s41598-021-82042-5. ISSN 2045-2322. PMC 7859221. PMID 33536519.
- ^ Diab, Khaled. "There are grounds for concern about solar power". www.aljazeera.com. Retrieved 15 April 2021.
- ^ Staff, Carbon Brief (25 August 2022). "Factcheck: Is solar power a 'threat' to UK farmland?". Carbon Brief. Retrieved 15 September 2022.
- ^ Oda, Shoko (21 May 2022). "Electric farms in Japan are using solar power to grow profits and crops". The Japan Times. Retrieved 14 October 2022.
- ^ Gerretsen, Isabelle (18 November 2022). "The floating solar panels that track the Sun". www.bbc.com. Retrieved 29 November 2022.
- ^ Pollard, Jim (29 May 2023). "Wind Power Body Plans to Provide a Third of Japan's Electricity". Asia Financial. Retrieved 31 May 2023.
- ^ "Clean power in South Korea" (PDF).
- ^ Dunnett, Sebastian; Holland, Robert A.; Taylor, Gail; Eigenbrod, Felix (8 February 2022). "Predicted wind and solar energy expansion has minimal overlap with multiple conservation priorities across global regions". Proceedings of the National Academy of Sciences. 119 (6) e2104764119. Bibcode:2022PNAS..11904764D. doi:10.1073/pnas.2104764119. ISSN 0027-8424. PMC 8832964. PMID 35101973.
- ^ Rabaia, Malek Kamal Hussien; Abdelkareem, Mohammad Ali; Sayed, Enas Taha; Elsaid, Khaled; Chae, Kyu-Jung; Wilberforce, Tabbi; Olabi, A.G. (February 2021). "Environmental impacts of solar energy systems: A review". Science of the Total Environment. 754 141989. Bibcode:2021ScTEn.75441989R. doi:10.1016/j.scitotenv.2020.141989. PMID 32920388.
- ^ "Renewable revolution will drive demand for critical minerals". RenewEconomy. 5 May 2021. Retrieved 5 May 2021.
- ^ "Clean energy demand for critical minerals set to soar as the world pursues net zero goals – News". IEA. 5 May 2021. Retrieved 5 May 2021.
- ^ "Used Solar Panels Are Powering the Developing World". Bloomberg.com. 25 August 2021. Retrieved 15 September 2022.
- ^ US EPA, OLEM (23 August 2021). "End-of-Life Solar Panels: Regulations and Management". United States Environmental Protection Agency. Retrieved 15 September 2022.
- ^ "The Proposed Legal Framework On Responsibility Of Producers And..." www.roedl.com. Retrieved 15 September 2022.
- ^ Majewski, Peter; Al-shammari, Weam; Dudley, Michael; Jit, Joytishna; Lee, Sang-Heon; Myoung-Kug, Kim; Sung-Jim, Kim (February 2021). "Recycling of solar PV panels- product stewardship and regulatory approaches". Energy Policy. 149 112062. Bibcode:2021EnPol.14912062M. doi:10.1016/j.enpol.2020.112062.
- ^ Gürtürk, Mert (March 2019). "Economic feasibility of solar power plants based on PV module with levelized cost analysis". Energy. 171: 866–878. Bibcode:2019Ene...171..866G. doi:10.1016/j.energy.2019.01.090.
- ^ Cross, Jamie; Murray, Declan (October 2018). "The afterlives of solar power: Waste and repair off the grid in Kenya". Energy Research & Social Science. 44: 100–109. Bibcode:2018ERSS...44..100C. doi:10.1016/j.erss.2018.04.034. hdl:20.500.11820/ec778014-f6e8-41dd-92cd-927d37fe4967.
- ^ Jang, Esther; Barela, Mary Claire; Johnson, Matt; Martinez, Philip; Festin, Cedric; Lynn, Margaret; Dionisio, Josephine; Heimerl, Kurtis (2018). "Crowdsourcing Rural Network Maintenance and Repair via Network Messaging". Proceedings of the 2018 CHI Conference on Human Factors in Computing Systems. pp. 1–12. doi:10.1145/3173574.3173641. ISBN 978-1-4503-5620-6.
- ^ Barron-Gafford, Greg A.; Minor, Rebecca L.; Allen, Nathan A.; Cronin, Alex D.; Brooks, Adria E.; Pavao-Zuckerman, Mitchell A. (13 October 2016). "The Photovoltaic Heat Island Effect: Larger solar power plants increase local temperatures". Scientific Reports. 6 35070. Bibcode:2016NatSR...635070B. doi:10.1038/srep35070. PMC 5062079. PMID 27733772.
- ^ "Water consumption solution for efficient concentrated solar power | Research and Innovation". ec.europa.eu. Retrieved 4 December 2021.
- ^ Chiu, Allyson; Guskin, Emily; Clement, Scott (3 October 2023). "Americans don't hate living near solar and wind farms as much as you might think". The Washington Post. Archived from the original on 3 October 2023.
- ^ "The Global Renewable Energy Boom Can't Be Stopped—Not Even by U.S. Politics | Columbia Business School". business.columbia.edu. 28 April 2025. Retrieved 4 October 2025.
- ^ Svoboda, Michael (18 September 2025). "Bill McKibben says cheap solar could topple Big Oil's power » Yale Climate Connections". Yale Climate Connections. Retrieved 4 October 2025.
- ^ Gentile, Giuliana; Gupta, Joyeeta (1 April 2025). "Orchestrating the narrative: The role of fossil fuel companies in delaying the energy transition". Renewable and Sustainable Energy Reviews. 212 115359. doi:10.1016/j.rser.2025.115359. ISSN 1364-0321.
- ^ "The political economy of fossil fuel subsidy reform" (PDF).
- ^ "The Political Economy of Fossil Fuel Subsidy Removal: Evidence from Bolivia and Mexico". IMF. Retrieved 4 October 2025.
- ^ Chavda, Priyanshu; Mehta, Dhyani (1 July 2025). "Assessing the impact of fossil fuel subsidies and environmental tax on renewable energy consumption of OECD countries: A panel quantile approach". Next Energy. 8 100313. doi:10.1016/j.nxener.2025.100313. ISSN 2949-821X.
- ^ "Making solar a source of EU energy security | Think Tank | European Parliament". www.europarl.europa.eu. Retrieved 3 November 2022.
- ^ Yoder, Kate (18 September 2025). "The politics of renewables are getting stranger. 'Sun Day' celebrates them anyway". Grist. Retrieved 4 October 2025.
Solar technology itself even has a libertarian bent. "It's more independence, it's local control — all the things that the right-wing libertarians want," said Daniel Kammen, an energy scientist at Johns Hopkins University.
- ^ "Pakistan's surprise solar surge shocks experts and grid – DW – 11/27/2024". dw.com. Retrieved 4 October 2025.
- ^ "Trump's political gift to the clean energy sector". www.ft.com. Retrieved 4 October 2025.
Republican unity on this issue is already showing significant cracks
- ^ "Net zero makes UK dangerously dependent on China, warns Badenoch". The Daily Telegraph. Retrieved 4 October 2025.
- ^ Weisskircher, Manès; Volk, Sabine. "The People against the Sun? Ideology and Strategy in Far-Right Parties' Climate Obstruction of Solar Energy". Environmental Politics. 0 (0): 1–32. doi:10.1080/09644016.2025.2458380. ISSN 0964-4016.
- ^ "Analysis: Reform-led councils threaten 6GW of solar and battery schemes across England". Carbon Brief. 16 June 2025. Retrieved 4 October 2025.
- ^ "'We need pylons and solar farms' - Green Party leader". BBC via Yahoo News. 3 October 2025. Retrieved 4 October 2025.
- ^ Blunt, Katherine; Dvorak, Phred (9 August 2022). "WSJ News Exclusive | U.S. Solar Shipments Are Hit by Import Ban on China's Xinjiang Region". The Wall Street Journal. ISSN 0099-9660. Retrieved 8 September 2022.
- ^ "Fears over China's Muslim forced labor loom over EU solar power". Politico. 10 February 2021. Retrieved 15 April 2021.
- ^ "China's solar dominance not an issue". 24 July 2024.
- ^ "Government wants to make solar panels and batteries more expensive in South Africa". Retrieved 4 October 2025.
- ^ "[SMM Analysis] India Imposes Three-Year Anti-Dumping Tariffs on Solar Cells and Modules from China | SMM". news.metal.com. Retrieved 4 October 2025.
Bibliography
[edit]- Perlin, John (1999). From space to Earth: the story of solar electricity. Earthscan. p. 50. ISBN 978-0-937948-14-9.
Further reading
[edit]- Sivaram, Varun (2018). Taming the Sun: Innovation to Harness Solar Energy and Power the Planet. Cambridge, Massachusetts: MIT Press. ISBN 978-0-262-03768-6.
External links
[edit]| Concepts |    | ||||||||||||||||
|---|---|---|---|---|---|---|---|---|---|---|---|---|---|---|---|---|---|
| Solar power |
| ||||||||||||||||
| Distribution and uses |
| ||||||||||||||||
| Applications |
| ||||||||||||||||
| See also | |||||||||||||||||
| Concepts | |||||||||||
|---|---|---|---|---|---|---|---|---|---|---|---|
| Photovoltaic system | |||||||||||
| Applications |
| ||||||||||
| Generation systems |
| ||||||||||
| PV companies |
| ||||||||||

| Africa | |||||
|---|---|---|---|---|---|
| Asia | |||||
| Europe |
| ||||
| North America | |||||
| Oceania | |||||
| South America | |||||
Solar power
View on GrokipediaFundamentals
Principles of Solar Energy Conversion
Solar radiation reaching Earth consists of electromagnetic waves spanning ultraviolet, visible, and infrared wavelengths, with a spectrum closely resembling that of a blackbody radiator at approximately 5772 K and an average surface irradiance of 1000 W/m² under standard test conditions (AM1.5 spectrum).[13] This energy can be converted into electricity primarily via the photovoltaic (PV) effect or through thermal processes in concentrated solar power (CSP) systems.[14] In photovoltaic conversion, photons absorbed by a semiconductor material, such as silicon with a bandgap of 1.1 eV, generate electron-hole pairs if their energy exceeds the bandgap, provided the photon wavelength is shorter than about 1100 nm.[15] The p-n junction in the solar cell creates a depletion region with a built-in electric field that separates these charge carriers: electrons toward the n-type side and holes toward the p-type side, producing a photovoltage typically around 0.5-0.6 V per cell under illumination.[16] Current flows when the cell is connected to an external circuit, with power output given by the product of voltage, current, and fill factor, though losses occur from reflection (5-10% mitigated by anti-reflective coatings), incomplete absorption, recombination, and thermalization of excess photon energy.[15] The Shockley-Queisser limit establishes a theoretical maximum efficiency of about 33% for single-junction cells under unconcentrated AM1.5 illumination, arising from unavoidable spectrum mismatch, radiative recombination, and blackbody emission constraints.[17] Thermal conversion in CSP systems employs mirrors or lenses to concentrate sunlight onto a receiver, achieving flux densities up to several thousand times the direct normal irradiance, heating a transfer fluid (e.g., molten salts or synthetic oil) to 300-565°C.[18] This thermal energy drives a conventional heat engine, such as a Rankine cycle steam turbine, where efficiency is bounded by the Carnot limit, η = 1 - T_cold/T_hot (with temperatures in Kelvin), yielding practical values of 15-25% depending on maximum temperatures and parasitic losses.[18] Receivers use selective coatings to maximize solar absorptivity (α > 0.95) while minimizing thermal emittance (ε < 0.1) in the infrared, reducing reradiation losses, though overall system efficiency incorporates optical, thermal, and mechanical conversion steps.[19] Unlike PV, CSP enables thermal energy storage for dispatchability, but requires direct beam radiation and larger infrastructure.[18]Classification of Solar Power Systems
Solar power systems for electricity generation are primarily classified into photovoltaic (PV) systems, which directly convert sunlight into electricity via the photovoltaic effect in semiconductor materials, and concentrated solar power (CSP) systems, which focus sunlight to heat a fluid that drives a conventional turbine generator.[20][21] This dichotomy reflects fundamental differences in energy conversion: PV relies on solid-state electron excitation without moving parts for the core process, achieving module efficiencies typically ranging from 15% to 22% for commercial crystalline silicon panels as of 2023, while CSP employs thermal cycles with potential for higher overall system efficiencies up to 20-25% when including storage, though it requires direct normal irradiance and larger land areas. PV systems dominate global solar electricity capacity, accounting for over 99% of installations by 2023 due to modularity, scalability from kilowatt residential setups to gigawatt utility-scale farms, and falling costs below $0.30 per watt for modules. They are further subclassified by grid integration: grid-connected systems, which feed excess power into the utility grid via inverters and comprise the majority of deployments; stand-alone or off-grid systems, often paired with batteries for remote applications like telecommunications or rural electrification; and hybrid systems combining PV with other sources such as diesel generators or wind for reliability. Thin-film PV variants, using materials like cadmium telluride or CIGS, offer lower costs and better performance in diffuse light but historically lower efficiencies around 10-15%. CSP systems, less prevalent with under 7 gigawatts installed globally as of 2023, utilize mirrors or lenses to concentrate sunlight by factors of 30 to 1,000 times onto receivers, generating steam or driving Stirling engines. Subtypes include parabolic trough collectors, which track the sun along one axis and held about 70% of CSP capacity in 2022; solar power towers with heliostats focusing on a central receiver, enabling higher temperatures above 500°C for molten salt storage and dispatchable power; linear Fresnel reflectors for simpler, lower-cost designs; and dish-Stirling systems for smaller, modular applications though less common commercially. CSP's advantage lies in thermal energy storage, allowing generation for 6-15 hours post-sunset, unlike unintermittent PV without batteries, but deployment is confined to high-insolation regions like deserts due to optical requirements and water needs for cooling. Beyond these, solar power classifications occasionally encompass hybrid PV-CSP integrations, which combine direct PV output with thermal storage for improved capacity factors above 50%, as demonstrated in pilot projects like the 50 MW Cerro Dominador plant in Chile operational since 2021. Passive solar systems, involving building orientation and materials for natural heating without mechanical conversion, and non-electric solar thermal for process heat are distinct but not classified as power systems generating electricity.Historical Development
Pre-20th Century Concepts
Ancient civilizations harnessed solar energy passively through architectural designs that maximized sunlight exposure for heating and lighting, such as south-facing windows and thermal mass in Greek homes around 500 BCE and Roman structures like baths.[22] Greeks and Romans also employed polished bronze or glass lenses to concentrate sunlight for igniting fires, a technique documented as early as the 7th century BCE.[23] In 1767, Swiss physicist Horace-Bénédict de Saussure constructed the first documented solar collector, an insulated wooden box with multiple glass layers that trapped heat to boil water, reaching temperatures up to 108°C (226°F), laying groundwork for solar thermal concentration.[23] This device demonstrated the principle of using enclosed transparent materials to amplify solar heating for practical applications like distillation. The 19th century saw advancements in solar thermal engines. French inventor Augustin Mouchot developed parabolic mirrors to focus sunlight onto boilers, producing steam to drive engines; his first prototype in 1861 generated enough power for a small steam engine, and a larger version in 1866 impressed Napoleon III by pumping water.[24] Mouchot's 4-meter-diameter engine at the 1878 Paris Universal Exhibition produced 50 liters of steam per minute, highlighting solar's potential for mechanical work amid coal shortages in French colonies.[25] Swedish engineer John Ericsson independently built similar solar steam engines in the 1860s, using reflectors to heat water for piston operation.[26] In 1839, French physicist Alexandre Edmond Becquerel discovered the photovoltaic effect while experimenting with an electrolytic cell containing platinum electrodes in a conductive solution; exposure to light increased the cell's voltage, marking the first observation of light-generated electricity, though inefficient and not practically applied until later.[27] These pre-20th century efforts emphasized solar's viability for heat and limited mechanical or electrical conversion, constrained by intermittent sunlight and material limitations, yet foreshadowing modern technologies.[23]20th Century Research and Early Applications
In 1954, researchers at Bell Telephone Laboratories developed the first practical silicon photovoltaic (PV) cell, achieving an efficiency of 6% in converting sunlight to electricity.[28] This breakthrough, led by Daryl Chapin, Calvin Fuller, and Gerald Pearson, involved doping silicon with boron and phosphorus to create a p-n junction that generated usable current under illumination, marking a shift from earlier low-efficiency selenium cells.[23] The cell was publicly demonstrated on April 25, 1954, powering a small toy Ferris wheel, which highlighted its potential despite initial costs exceeding $300 per watt.[28] Subsequent refinements at Bell Labs raised efficiency to around 11% by the late 1950s, driven by improved anti-reflective coatings and junction optimization.[29] Research in the 1950s and 1960s focused on space applications, funded by agencies like the U.S. Department of Defense and NASA, due to the reliability needs of satellites where batteries alone proved insufficient.[23] Hoffman Electronics advanced cell efficiency to 9% by 1958 and 14% by 1960 through manufacturing innovations, enabling compact power arrays.[30] These developments prioritized durability in vacuum and radiation environments over cost reduction, as terrestrial economics remained prohibitive with prices around $100 per watt by the mid-1960s.[31] Early applications were predominantly extraterrestrial; the Vanguard 1 satellite, launched on March 17, 1958, became the first spacecraft powered by solar cells, using a 0.1-watt array of 100 cm² to operate its transmitter for over six years.[32] This success spurred adoption in subsequent missions, including the 1962 Telstar communications satellite, which relied on 14 watts from PV panels for telecommunications relays.[23] By the late 1960s, solar PV had become standard for U.S. and Soviet space programs, powering larger satellites for weather monitoring and reconnaissance, though terrestrial uses were limited to niche off-grid systems like remote radio beacons and navigational aids where fuel logistics were challenging.[33] High costs—often 100 times that of grid electricity—confined ground-based deployments to experimental or isolated sites, underscoring PV's initial viability in power-constrained, maintenance-free scenarios rather than widespread energy production.[31]1970s Oil Crisis and Initial Commercialization
The 1973–1974 oil crisis, initiated by the Organization of Arab Petroleum Exporting Countries (OAPEC) embargo in response to U.S. support for Israel during the Yom Kippur War, quadrupled global oil prices from approximately $3 to $12 per barrel, triggering widespread energy shortages, inflation, and economic recession in oil-importing nations.[34] This event heightened awareness of dependence on imported fossil fuels and catalyzed policy shifts toward alternative energy sources, including solar power, as governments sought to diversify supply and reduce vulnerability to geopolitical disruptions.[35] In the United States, the crisis prompted President Richard Nixon's Project Independence initiative in November 1973, which aimed for energy self-sufficiency by 1980 and allocated initial federal funding for solar research amid broader renewable efforts.[36] U.S. legislative responses accelerated solar development, with the Solar Energy Research, Development and Demonstration Act of 1974 establishing federal programs to advance photovoltaic (PV) and solar thermal technologies through grants and demonstrations.[37] The Energy Research and Development Administration (ERDA), formed in 1974, consolidated energy R&D efforts and invested in scaling PV manufacturing, while the 1977 creation of the Solar Energy Research Institute (SERI, predecessor to the National Renewable Energy Laboratory) focused on applied research to lower costs from over $100 per watt.[23] Under President Jimmy Carter, the 1978 National Energy Act introduced a 10% tax credit for solar installations, and federal procurement—such as the June 1979 dedication of 32 PV panels on the White House roof generating 7.5 kW—signaled commitment to terrestrial applications beyond prior space uses.[38] These measures, driven by crisis-induced urgency rather than market demand alone, laid groundwork for commercialization despite high costs limiting adoption to niche off-grid uses. Initial commercialization emerged in remote and specialized applications, with companies like Exxon and ARCO investing in PV production; Exxon, for instance, funded Elliott Berman's design reducing cell costs by 80% through automated manufacturing in the mid-1970s.[39] By 1973, the University of Delaware's Solar One residence integrated PV cells to supply 10% of its electricity needs, marking an early grid-tied demonstration.[40] Commercial products included PV-powered calculators, bill changers, and remote telecom systems, with firms like Solarex (founded 1973) and Spire Solar selling modules for non-interconnected sites by the late 1970s.[14] Cumulative U.S. PV installations reached about 1 MW by decade's end, primarily supported by government subsidies, as terrestrial efficiency hovered at 10–12% and economics favored fossil fuels post-1979 price stabilization.[23] Private financing, such as Wells Fargo's backing of early utility-scale pilots, complemented federal efforts but underscored solar's transitional role amid unresolved scalability challenges.[41]1990s to Mid-2000s Maturation
During the 1990s, photovoltaic (PV) cell efficiencies for commercial crystalline silicon modules improved from around 12-14% to 14-16%, driven by refinements in cell doping, anti-reflective coatings, and wafer processing techniques that reduced recombination losses and enhanced light absorption.[42] Thin-film technologies, such as amorphous silicon and cadmium telluride, also advanced, achieving lab efficiencies exceeding 10% by the late 1990s, though they remained niche due to lower overall performance compared to silicon.[43] These gains stemmed from sustained research at institutions like the U.S. National Renewable Energy Laboratory, which in 1994 set a record for silicon cell efficiency at over 20% in laboratory conditions, influencing commercial designs.[44] Japan led early market maturation through government subsidies under the New Sunshine Program, launching a residential PV subsidy in 1994 that covered up to 50% of installation costs, spurring demand for grid-connected rooftop systems.[45] By the end of 2000, Japan had installed approximately 320 MW of cumulative PV capacity, primarily residential, representing over half of global deployments at the time and demonstrating scalable integration with urban electricity grids.[45] This policy-induced growth reduced module prices through economies of scale, with average costs falling to about $5 per watt by 2000 from higher levels in the early 1990s.[46] In Europe, Germany's Renewable Energy Sources Act (EEG) of 2000 introduced feed-in tariffs guaranteeing fixed payments for 20 years at rates up to €0.51 per kWh for small rooftop systems, accelerating installations from 110 MW cumulative in 2000 to over 1 GW by 2004.[47] [48] The policy prioritized renewables in grid priority and fostered a domestic manufacturing boom, though it relied on imports for modules as demand outpaced local supply. Similar incentives in Spain and other EU nations contributed to regional growth, with Europe's share of global PV installations rising significantly by mid-decade.[49] Globally, cumulative PV capacity grew modestly from under 100 MW in 1990 to around 1.8 GW by 2005, reflecting maturation from niche off-grid applications to early utility and residential integration, though fossil fuels dominated due to solar's high upfront costs and intermittency.[45] Cost declines, averaging 20% per doubling of capacity, began to make solar competitive in sunny regions with subsidies, setting the stage for exponential scaling post-2005.[5] Manufacturing shifted toward Asia, with production volumes increasing from hundreds of MW annually in the 1990s to over 1 GW by 2005, primarily for export to subsidized markets.[50]2010s Rapid Scaling
Global installed solar photovoltaic (PV) capacity expanded from 40 gigawatts (GW) at the end of 2010 to 627 GW by the end of 2019, reflecting compound annual growth exceeding 30%. This surge marked solar PV as the fastest-growing energy technology of the decade, with annual additions rising from 17 GW in 2010 to a peak of 115 GW in 2019. The logarithmic trajectory of deployments underscored learning curve effects, where each doubling of capacity correlated with approximately 20% cost reductions in modules.[51] Cost declines were pivotal, with global weighted-average total installed costs for utility-scale solar PV dropping 82% from 2010 to 2019, reaching $876 per kilowatt (kW).[52] Module prices fell over 90% since 2009, driven by scaled manufacturing efficiencies and oversupply.[53] China's dominance in PV supply chains emerged as a core causal factor; by the mid-2010s, the country controlled over 75% of polysilicon, wafer, cell, and module production stages, bolstered by state investments exceeding $50 billion and subsidies that expanded capacity tenfold relative to Europe.[54] This manufacturing surge, while fostering innovation through volume, also led to periodic gluts that accelerated price erosion but strained global competitors.[55] Policy mechanisms amplified deployment. In Germany, the Renewable Energy Sources Act's feed-in tariffs spurred over 38 GW of cumulative PV additions by 2019, peaking at 7.5 GW installed in 2011 alone, though subsequent tariff reductions curbed growth to manage grid integration costs.[56] The United States' federal Investment Tax Credit (ITC), extended through 2019 at 30% via the 2015 Consolidated Appropriations Act, catalyzed residential and utility-scale uptake, contributing to 77 GW total capacity by decade's end with average annual growth of 50% post-extension.[57] China's domestic policies, including quotas and subsidies under the 12th and 13th Five-Year Plans, drove over 200 GW of installations, shifting it from manufacturing leader to largest market.[58] These incentives, combined with falling costs, enabled solar PV's levelized cost of electricity to undercut new fossil fuel plants in many regions by 2017. Utility-scale projects proliferated, exemplified by India's 2.5 GW Rajasthan Solar Park (phased from 2013) and the U.S. Topaz Solar Farm (550 MW, completed 2014), leveraging thin-film and crystalline silicon advances.[59] Despite grid constraints and intermittency concerns raised in empirical analyses, the decade's scaling validated solar's dispatchable potential via storage hybrids emerging late-2010s, with global capacity crossing 1 terawatt (TW) thresholds in projections.[60] Empirical data from IEA tracking confirmed policy-manufacturing synergies as primary drivers, outpacing initial forecasts by factors of 10 in some models due to unanticipated supply elasticities.2020s Growth Amid Challenges
Global solar photovoltaic capacity experienced accelerated expansion in the 2020s, driven by falling module prices and supportive policies, despite disruptions from the COVID-19 pandemic and geopolitical tensions. Cumulative installed capacity surpassed 1 terawatt (TW) by the end of 2021 and reached approximately 1.6 TW by the end of 2023, more than doubling from the roughly 700 gigawatts (GW) at the decade's start.[61] In 2023, annual additions hit a record of around 447 GW, with China accounting for over half, followed by significant growth in the United States, India, and Europe.[62] This momentum continued into 2024, with global installations reaching 597 GW, a 33% increase from 2023, pushing cumulative capacity beyond 2.2 TW.[62] [61] Key drivers included dramatic cost reductions, with solar module prices dropping below $0.10 per watt in 2024 due to overcapacity in Chinese manufacturing, making photovoltaics the cheapest new-build electricity source in most regions.[63] The U.S. Inflation Reduction Act of 2022 incentivized domestic production and deployment, leading to 32.4 GW added in 2023 alone, a 37% jump from prior records.[64] In Europe, solar overtook coal in electricity generation by 2023, bolstered by energy security concerns following Russia's invasion of Ukraine, though growth faced headwinds from subsidy phase-outs and high interest rates.[65] India and emerging markets also scaled up, with policy auctions and rooftop incentives contributing to diversified deployment.[60] Persistent challenges tempered this expansion, particularly supply chain vulnerabilities stemming from China's dominance in polysilicon, wafers, and modules, which exceeded 80% of global production and exposed the sector to trade tariffs, export restrictions, and raw material shortages like those in 2021-2022.[66] Efforts to diversify, such as U.S. and EU investments in alternative sourcing, encountered delays due to higher costs and technological gaps.[67] Grid integration issues intensified with rapid scaling, as solar's intermittency necessitated expanded storage—battery pairings grew but remained insufficient for evening peaks—and transmission upgrades lagged behind generation additions, causing curtailments in high-penetration regions like California and Germany.[68] [69] Policy and economic hurdles further complicated growth, including permitting bottlenecks, local opposition to land use, and fluctuating subsidies amid fiscal pressures.[70] In 2024, while low prices spurred deployments, manufacturer bankruptcies outside China highlighted competitive imbalances, and concerns over forced labor in supply chains prompted traceability mandates.[71] Despite these, projections indicated solar could approach 1 TW annual additions by 2030 if interconnection and storage scale accordingly.[62]Core Technologies
Photovoltaic Cells
Photovoltaic cells, also known as solar cells, are semiconductor devices that directly convert sunlight into electrical energy via the photovoltaic effect, in which incident photons generate electron-hole pairs that produce a voltage difference across the cell.[14] In operation, a typical cell features a p-n junction formed by doping a semiconductor—most commonly silicon—with p-type (acceptor impurities creating holes) and n-type (donor impurities creating free electrons) regions, establishing a built-in electric field in the depletion zone.[15] When photons with energy exceeding the material's bandgap (1.12 eV for silicon) are absorbed, they excite electrons from the valence band to the conduction band, freeing charge carriers; the junction field separates these carriers, driving electrons toward the n-side and holes toward the p-side, which generates a photocurrent when the cell is connected to an external circuit. This process yields direct current (DC) electricity, with output dependent on factors such as spectral irradiance, temperature, and cell area, typically rated under standard test conditions of 1000 W/m² irradiance at 25°C.[15] Silicon dominates photovoltaic cell production due to its abundance, mature manufacturing processes, and suitable bandgap for capturing a broad spectrum of solar radiation, accounting for over 95% of global module shipments as of 2025.[72] Crystalline silicon cells are categorized into monocrystalline (single-crystal structure, yielding higher purity and uniformity) and polycrystalline (multi-crystal grains, lower cost but with grain boundaries reducing carrier lifetime).[72] Commercial monocrystalline cells achieve module efficiencies of 22-23%, exemplified by Maxeon's 440 W panels at 22.8%, while polycrystalline variants reach 18-20%; laboratory records for silicon cells stand at 26.7% for single-junction designs.[73][72] Thin-film technologies, deposited in layers mere micrometers thick, offer advantages in flexibility, lower material use, and performance in low-light or high-temperature conditions but generally lower efficiencies; cadmium telluride (CdTe) modules commercially hit 18-22%, with lab cells at 22.1%, while copper indium gallium selenide (CIGS) reaches 23.4% in research.[72] Amorphous silicon (a-Si) thin-films, with disordered structure, provide efficiencies around 10-12% but excel in building-integrated applications due to translucency and lightweight properties.[72] Emerging photovoltaic technologies aim to surpass silicon's practical limits through novel materials and architectures, though commercialization lags due to stability, scalability, and toxicity concerns. Perovskite cells, hybrid organic-inorganic lead halides with tunable bandgaps, have achieved lab efficiencies exceeding 26% in single junctions and over 33% in tandems with silicon, but face degradation from moisture and UV exposure.[72] Organic photovoltaics (OPV) and dye-sensitized cells offer low-cost, printable fabrication with flexibilities for wearables, yet efficiencies remain below 19% commercially due to limited charge mobility and lifetimes.[72] Multi-junction cells, stacking materials with decreasing bandgaps (e.g., gallium arsenide-based), capture more spectrum for concentrator systems, attaining record efficiencies of 47.6% under focused light, though high costs restrict them to space or utility-scale concentrating photovoltaics.[72] As of July 2025, NREL's confirmed research records highlight tandems—such as perovskite-silicon at 33.9%—as pathways to exceed 30% module efficiencies, with Oxford PV demonstrating a 25% efficient commercial-scale tandem panel in August 2025.[72][74] Overall, cell performance metrics like fill factor (typically 80-85% for high-quality silicon) and open-circuit voltage (around 0.6-0.7 V per cell) underpin power output, with anti-reflective coatings and passivation layers minimizing recombination losses to boost yields.Concentrated Solar Power Systems
Concentrated solar power (CSP) systems generate electricity by using arrays of mirrors or lenses to concentrate sunlight onto a receiver, heating a fluid to produce steam that drives a turbine.[75] These systems require direct normal irradiance and are typically deployed in utility-scale plants in sunny regions.[76] Key components include optical concentrators, receivers, heat transfer fluids (such as synthetic oil or molten salts), and thermal energy storage to enable dispatchable power generation beyond daylight hours.[77] The primary types of CSP technologies are parabolic trough collectors, solar power towers, parabolic dishes, and linear Fresnel reflectors. Parabolic trough systems, the most mature and widely deployed, use curved mirrors to focus sunlight along a linear receiver tube containing heat transfer fluid, achieving optical efficiencies around 70-80% and overall plant efficiencies of 20-25%.[78] They represent about 68% of global CSP capacity, benefiting from proven scalability but requiring tracking mechanisms for sun alignment.[79] Solar power towers employ heliostats—flat mirrors that track and reflect sunlight onto a central receiver atop a tower—often using molten salts as the heat transfer and storage medium, enabling efficiencies up to 35-40% and capacity factors exceeding 50% with storage.[78] This configuration allows for higher operating temperatures (over 500°C) compared to troughs, improving thermodynamic efficiency, though it demands precise heliostat control and larger land footprints.[80] Parabolic dish systems consist of modular, dish-shaped reflectors concentrating sunlight onto a focal point where a Stirling or other heat engine converts thermal energy directly to mechanical work, offering peak efficiencies of 31-32% and suitability for distributed applications without extensive grid infrastructure.[81] Linear Fresnel reflectors use long arrays of flat or slightly curved mirrors to focus light onto elevated receivers, providing lower costs due to simpler construction but reduced efficiency from higher optical losses.[82] Thermal energy storage, commonly molten salt in two-tank systems, decouples generation from insolation, allowing CSP to supply power during peak demand evenings, a key advantage over intermittent photovoltaics.[80] Global installed CSP capacity stood at approximately 7 GW as of 2024, with major plants including the 700 MW Mohammed bin Rashid Al Maktoum Solar Park in Dubai (tower and trough hybrid) and the 580 MW Noor Ouarzazate complex in Morocco.[83] [84] Despite these strengths, CSP faces challenges including high capital costs (often 2-3 times PV per MW), dependence on direct sunlight excluding cloudy areas, and water consumption for wet cooling, which limits deployment in arid regions without dry-cooling alternatives that reduce efficiency by 5-10%.[76] [85] Ongoing advancements focus on cost reductions through larger-scale projects and hybrid integrations, though growth remains modest compared to photovoltaics due to economic competitiveness.[86]Solar Thermal and Hybrid Approaches
Solar thermal systems utilize collectors to absorb solar radiation and convert it directly into heat for applications such as domestic hot water, space heating, and industrial process heat, distinct from electricity-focused concentrating solar power. Non-concentrating collectors, including flat-plate designs with an absorber plate enclosed in a glazed box and evacuated-tube collectors featuring vacuum-insulated tubes to minimize heat loss, operate at temperatures typically below 200°C. These technologies achieve thermal efficiencies of 40-60% under optimal conditions, depending on collector type and ambient factors.[87] By the end of 2023, global installed capacity for solar thermal heating systems exceeded 500 GWth, with China dominating the market through widespread adoption in residential and district heating sectors. Key applications include over 80% of installations for water heating, while industrial uses for process heat, such as drying and pasteurization, accounted for growing shares in regions like Europe and India. In 2023, top markets included China, India, Brazil, Türkiye, and the United States, reflecting policy support and cost reductions in collector manufacturing.[88][89] Hybrid approaches integrate solar thermal with photovoltaic or other energy sources to enhance overall efficiency by capturing both electrical and thermal outputs from the solar spectrum. Photovoltaic-thermal (PVT) systems combine PV modules with thermal absorbers, cooling the cells to boost electrical efficiency by 10-20% while yielding usable heat, achieving combined efficiencies up to 70%. These hybrids are particularly viable for building-integrated applications, where excess heat offsets conventional heating demands.[90][91] Other hybrid configurations pair solar thermal with fossil fuels or geothermal resources in power plants to provide dispatchable generation, mitigating intermittency; for instance, integrated solar combined cycle plants use solar preheat to improve steam cycle performance by 5-10%. Such systems, often employing parabolic troughs for thermal input, have been deployed in projects like those in Spain and the UAE, though deployment remains limited due to higher upfront costs compared to standalone PV. Research indicates potential for 20-35% energy yield improvements in PVT hybrids via optimized tracking, but commercialization lags behind pure PV owing to added complexity.[91][92][93]Deployment and Capacity
Global Installed Capacity Trends
Global installed solar photovoltaic (PV) capacity has demonstrated exponential growth over the past two decades, transitioning from niche applications to a major component of the world's electricity infrastructure. Cumulative capacity remained below 40 GW until the late 2000s but accelerated sharply following cost reductions in PV modules and supportive feed-in tariffs in Europe and later Asia. By the end of 2020, total installed solar PV capacity reached 710 GW.[2] This growth intensified in the 2020s, with annual additions surpassing 200 GW by 2021 and climbing to 407-446 GW in 2023, pushing cumulative capacity to 1.6 TW by year-end.[7] In 2024, new installations exceeded 600 GW, elevating the global total to over 2.2 TW, nearly doubling the capacity from two years prior.[61] This pace outstripped historical forecasts from organizations like the International Energy Agency, which had repeatedly underestimated deployment rates due to overly conservative assumptions about market adoption and supply chain scalability.[94]| Year | Cumulative Capacity (GW) | Annual Additions (GW) |
|---|---|---|
| 2020 | 710 | ~140 |
| 2023 | 1,600 | 407-446 |
| 2024 | >2,200 | >600 |
Leading Countries and Regions
China maintains the largest installed solar photovoltaic (PV) capacity globally, surpassing 800 GW by the end of 2024 after adding a record 329 GW that year, which represented over 50% of worldwide installations.[62] This dominance stems from state-supported manufacturing scale, grid expansions, and policy incentives that prioritize rapid deployment, though it has led to curtailment issues exceeding 10% in some provinces due to overcapacity relative to transmission infrastructure.[7] The United States ranked second, with cumulative capacity reaching approximately 186 GW following 47 GW of additions in 2024, driven by the Inflation Reduction Act's tax credits that spurred utility-scale and distributed generation growth.[95] India placed third, adding 32 GW to exceed 100 GW total, supported by auctions and rooftop subsidies amid ambitions for 500 GW of non-fossil capacity by 2030, though land acquisition and financing constraints have moderated pace.[95][96] Other notable leaders include Germany, which added 17 GW to approach 100 GW cumulative, emphasizing integration with legacy grids via feed-in tariffs phased into auctions; Japan, with steady additions building on post-Fukushima policies to around 90 GW; and Australia, achieving over 1 kW per capita through household incentives and remote area needs.[8][95]| Country | Approximate Total Capacity (GW, end-2024) | 2024 Additions (GW) |
|---|---|---|
| China | >800 | 329 |
| United States | 186 | 47 |
| India | >100 | 32 |
| Germany | ~100 | 17 |
| Japan | ~90 | Not specified |
Utility-Scale Projects and Installations
Utility-scale solar projects consist of large ground-mounted photovoltaic (PV) arrays or concentrated solar power (CSP) systems exceeding 1 MW capacity, designed to feed electricity directly into transmission grids for widespread distribution. These installations leverage economies of scale, fixed-axis or single-axis trackers, and bifacial modules to achieve high output, often situated in arid regions with high solar irradiance to maximize energy yield. As of 2025, global utility-scale solar dominates new renewable capacity additions, with China leading deployments through state-backed desert-based mega-parks.[61] The Midong Solar Park in Xinjiang, China, represents the largest single-unit PV installation worldwide, with a 3.5 GW capacity commissioned in June 2024 by China Green Development Group. Spanning approximately 200,000 acres in the Gobi Desert, it generates about 6.09 billion kWh annually, sufficient to power over a million households, and integrates with local wind resources for hybrid output. This project underscores China's dominance, where annual PV additions reached 357 GW in 2024, comprising nearly 60% of global new capacity.[98][99][61] In India, the Bhadla Solar Park in Rajasthan holds a prominent position with 2.245 GW capacity across 14,000 acres, operational since phases completed in 2018-2020. Equipped with over 10 million panels, it produces around 732,874 MWh yearly, reducing reliance on coal in a high-insolation Thar Desert site. Multiple developers, including NTPC and Azure Power, contributed phases under government land facilitation and power purchase agreements.[100][101] United States utility-scale solar reached a record 41.4 GWdc installed in 2024, driven by projects like the planned 1.3 GWac Mammoth Solar in Indiana, set for completion in phases by 2025. These often hybridize with battery storage, as seen in 26% of 2023 additions pairing PV with energy storage to mitigate intermittency. Deployment favors southwestern states like California and Texas for irradiance, though Midwest expansions reflect falling costs and federal incentives.[102][103][104]| Project Name | Location | Capacity (GW) | Commissioning Year | Annual Output (TWh) |
|---|---|---|---|---|
| Midong Solar Park | Xinjiang, China | 3.5 | 2024 | 6.09[98][105] |
| Bhadla Solar Park | Rajasthan, India | 2.245 | 2018-2020 | 0.73[101][106] |
| Mammoth Solar | Indiana, USA | 1.3 (planned) | 2025 | N/A[103] |
Economic Analysis
Cost Declines and Levelized Cost of Energy
The cost of solar photovoltaic (PV) modules has declined dramatically since the 1970s, driven by technological improvements, economies of scale, and manufacturing efficiencies, with prices falling approximately 99% from around $100 per watt to under $0.20 per watt by 2024.[107] This trajectory follows a learning curve where costs typically drop by about 20% for every doubling of global cumulative installed capacity, a pattern observed consistently over decades.[5] For instance, in 1975, module prices averaged $115 per watt, decreasing to $2.15 per watt by 2010 and $0.27 per watt by 2021, reflecting advances in cell efficiency and production processes, particularly from crystalline silicon technologies.[4] Utility-scale solar system installation costs have paralleled module price reductions, dropping 82% since 2010 due to optimized balance-of-system components, larger project scales, and supply chain maturation.[108] In the United States, benchmark utility-scale PV installed costs reached $1.43 per watt AC ($1.08 per watt DC) in 2023, an 8% decline from 2022 levels, with median prices for large utility-owned systems stabilizing around $1.27 per watt AC since 2018 amid fluctuations from supply constraints.[109][110] These reductions have been uneven globally, with steeper declines in regions like China benefiting from concentrated manufacturing, though recent years show stabilization as markets mature and input costs like polysilicon fluctuate.[111] The levelized cost of energy (LCOE) for solar PV, which calculates the net present value of total lifetime costs divided by energy output, has similarly plummeted, enabling competitiveness without subsidies in many locations. LCOE varies by region, with higher irradiance locations like the U.S. Southwest yielding lower values due to improved capacity factors, by technology such as fixed-tilt versus single-axis tracking panels, which can increase output by 15-30% and often reduce LCOE despite higher upfront costs, and by whether paired with storage, which significantly raises LCOE to provide dispatchable power. Globally, the weighted-average LCOE for utility-scale solar PV stood at $0.043 per kilowatt-hour in 2024, a 90% reduction from 2010 levels and 41% below the cheapest new fossil fuel-fired alternatives, assuming typical capacity factors of 15-25% depending on insolation.[112][113] Marginal operating costs for existing utility-scale solar plants remain low at under $10–$20 per MWh, primarily from operations and maintenance without fuel expenses.[114] In the U.S., utility-scale solar LCOE averaged $31 per megawatt-hour in 2023, reflecting site-specific factors like resource quality and financing costs at 8% debt and 12% equity rates.[115][116] However, LCOE metrics often exclude intermittency-related expenses such as storage or grid reinforcements, potentially understating system-level costs in high-penetration scenarios, as noted in analyses emphasizing full lifecycle and integration realities.[117] Lazard's 2025 report confirms unsubsidized solar's edge over fossil fuels in optimal conditions, though recent trends indicate stabilization after prior sharp drops, with minor upticks in some regions due to inflation and supply issues between 2021 and 2023.[118][119]Subsidies, Incentives, and Fiscal Impacts
Governments worldwide have implemented various subsidies and incentives to promote solar power deployment, including investment tax credits, production tax credits, feed-in tariffs, and direct grants, which reduce upfront costs or guarantee above-market payments for generated electricity.[120] In the United States, the Investment Tax Credit (ITC) provides a 30% credit on qualified solar installation costs for systems placed in service from 2022 through 2032, extended and expanded under the 2022 Inflation Reduction Act, applying to both residential and commercial projects.[121] Residential solar installations in the United States, facilitated by net metering policies that credit excess generation against utility bills[122] and the federal Investment Tax Credit, enable households to offset electricity costs through self-generation, complementing environmental benefits by reducing reliance on grid power. Similarly, the Production Tax Credit (PTC) offers payments per kilowatt-hour produced, with combined ITC and PTC outlays exceeding $31 billion in 2024 alone, projected to total $421 billion in taxpayer costs over the long term.[123] These mechanisms have accelerated capacity additions, with U.S. solar installations reaching nearly 50 GW in 2024, a 21% increase from 2023, partly attributable to such incentives.[102] In Europe and other regions, feed-in tariffs (FiTs) have historically dominated, obligating utilities to purchase solar electricity at fixed premium rates, as seen in Germany's early 2000s Energiewende policy, which spurred rapid growth but led to elevated consumer electricity prices.[120] Globally, G20 countries provided at least $168 billion in public financial support for renewable power generation in 2023, with solar comprising a significant share amid policy-driven expansions.[124] Empirical studies indicate these incentives boost investment, with one analysis of household and firm behavior showing positive effects on solar PV uptake, though effectiveness varies by investor type and subsidy design.[125] Fiscal impacts include substantial government expenditures, often financed through deficits or higher taxes, distorting energy markets by favoring intermittent solar over dispatchable alternatives.[126] U.S. federal data reveal renewables receive approximately 30 times more subsidies per unit of energy than fossil fuels, primarily via tax expenditures that reduce federal revenue.[127] Over the past decade, solar alone has absorbed $76 billion in U.S. subsidies, contributing to market inefficiencies such as overproduction in subsidized regions and stranded assets when incentives phase out.[126] Counterfactual analyses suggest subsidies inflate demand—e.g., increasing U.S. residential PV electricity by 255% relative to unsubsidized baselines—yet they impose regressive burdens via elevated network charges and fail to internalize intermittency costs borne by unsubsidized grid operators.[128] [129] While proponents argue incentives yield long-term cost reductions through scale, critics highlight opportunity costs, including foregone investments in reliable baseload capacity, with implicit household discount rates from solar adoption decisions averaging 10-15%, signaling perceived high risks or low standalone viability.[130]Productivity Metrics and Location Factors
Productivity in solar power systems is quantified through metrics such as capacity factor, specific yield, and performance ratio. The capacity factor represents the ratio of actual energy output over a period to the maximum possible output if operating at full rated capacity continuously, typically ranging from 15% to 25% for photovoltaic (PV) systems globally, with higher values in high-insolation regions like deserts (19-25%) and lower in temperate areas (15-18%).[9] Specific yield, measured in kilowatt-hours per kilowatt-peak (kWh/kWp) annually, averages 3-5 kWh/kWp per day (1095-1825 kWh/kWp/year) in countries housing 93% of the global population, with excellent sites exceeding 4.5 kWh/kWp per day (approximately 1642 kWh/kWp/year).[131] Electricity production for a solar PV system is estimated by multiplying the system capacity in kWp by the average daily insolation in kWh/m²/day, then by the performance ratio (approximately 0.85 for well-installed systems, accounting for losses, shading, and optimal tilt); for example, a 9.92 kWp system in a high-insolation area yields approximately 55-60 kWh daily, 1650-1750 kWh monthly, and 20,500-21,500 kWh annually.[132] Performance ratio accounts for system losses beyond irradiance, often 75-85%, incorporating factors like inverter efficiency and wiring.[133] Location significantly influences these metrics primarily through solar irradiance levels, which depend on latitude, altitude, and atmospheric conditions. These differences in productivity contribute to variations in the levelized cost of energy (LCOE), with higher irradiance locations such as the U.S. Southwest yielding lower LCOE due to greater energy output per installed capacity.[134] Regions nearer the equator, such as parts of Africa, the Middle East, and Australia, receive higher global horizontal irradiance (GHI) averaging over 2000 kWh/m²/year, enabling specific yields above 1800 kWh/kWp/year and capacity factors exceeding 20%.[135] In contrast, higher latitudes in Europe or northern North America experience lower annual insolation (1000-1500 kWh/m²/year) due to reduced sun angles and longer winters, resulting in yields around 900-1200 kWh/kWp/year and capacity factors of 10-15%.[136] Altitude enhances productivity by reducing atmospheric absorption, with each 1000-meter increase potentially boosting output by 10-15% through clearer skies and lower temperatures.[137] Atmospheric and environmental factors further modulate productivity. Cloud cover reduces direct and diffuse irradiance, lowering capacity factors by up to 50% on overcast days, with persistent cloudiness in tropical or coastal areas causing annual losses of 10-20%.[137] Soiling from dust, pollen, or pollution can diminish transmittance by 2-5% annually in clean environments but up to 20-40% in arid or industrial regions without mitigation, necessitating regular cleaning to maintain yields.[138][139] High ambient temperatures decrease PV cell efficiency by approximately 0.4% per °C above 25°C, impacting hot climates despite higher irradiance, while for concentrated solar power (CSP), low direct normal irradiance (DNI) from haze or clouds critically limits viability to sites with over 2000 kWh/m²/year DNI.[137] Terrain effects, such as shading from nearby structures or vegetation, and extreme weather like hail, add site-specific variability, underscoring the need for detailed resource assessments using tools like the Global Solar Atlas.[140][141]| Region Example | Typical GHI (kWh/m²/year) | Specific Yield (kWh/kWp/year) | Capacity Factor (%) |
|---|---|---|---|
| Southwest US (e.g., Arizona) | 2000-2200 | 1600-1900 | 18-22 |
| Sahara Desert (North Africa) | 2200-2500 | 1900-2200 | 22-25 |
| Germany (Temperate Europe) | 1000-1200 | 900-1100 | 10-13 |
| Tropical (e.g., India) | 1800-2000 | 1400-1700 | 16-19 |
Reliability and Integration Challenges
Intermittency and Output Variability
Solar photovoltaic (PV) generation is inherently intermittent, producing electricity only when solar irradiance exceeds system thresholds, with output ceasing entirely at night and fluctuating based on diurnal cycles, weather patterns, and seasonal changes.[143] This variability stems from the physics of solar insolation, where panels convert direct and diffuse radiation into power, but efficiency drops under low-light conditions such as cloud cover or atmospheric aerosols.[137] Empirical data indicate that global solar PV capacity factors—defined as actual output divided by maximum possible output—typically range from 10% to 36% for large-scale installations, averaging around 25-27% in high-insolation regions like the southwestern United States, reflecting the non-dispatchable nature of the resource.[144] [145] Daily output follows a predictable bell-shaped curve, ramping up after sunrise, peaking midday, and declining sharply toward evening, often dropping to zero within hours as irradiance falls below 100-200 W/m².[146] In California, this pattern has manifested as the "duck curve," where midday solar overgeneration suppresses net load on the grid, followed by a steep evening ramp-up demand exceeding 10 GW/hour in spring 2017, straining flexible generation resources and increasing curtailment risks.[146] Cloud-induced variability exacerbates short-term fluctuations, with studies showing intra-hour changes of up to 50-70% in output under partial shading, as measured in operational PV plants.[147] Aggregation across geographically dispersed sites can reduce overall variance by 20-50% through smoothing effects, but residual intermittency persists due to correlated weather fronts.[143] Seasonal variations further compound intermittency, with output in temperate latitudes declining by 50-80% from summer to winter solstice due to reduced daylight hours and lower solar elevation angles.[148] For instance, in regions like Jodhpur, India, PV power exhibits marked drops during monsoon seasons from cloudiness and rain, contrasting with clearer summer peaks.[149] These patterns necessitate overprovisioning of capacity—often 2-4 times peak demand—to achieve reliable supply, as evidenced by modeling showing that without storage or backup, solar alone cannot meet baseload requirements.[150] Grid operators thus rely on fossil fuel peakers or hydro for evening and winter balancing, highlighting solar's dependence on complementary dispatchable sources for system reliability.[151]Storage Solutions and Their Limitations
Battery energy storage systems (BESS), predominantly lithium-ion based, represent the primary solution for mitigating solar power's intermittency by capturing excess generation during peak sunlight hours for dispatch during evenings or low-production periods. As of 2024, global battery storage capacity paired with solar installations has grown significantly, with projections for an additional 350 GWh coming online in 2025 to support expanding photovoltaic deployments. These systems enable solar-plus-storage hybrids to provide dispatchable power, enhancing grid flexibility, though their deployment remains concentrated in regions with supportive policies like California and Australia.[152] Alternative storage technologies include pumped hydroelectric storage, which accounts for over 90% of global utility-scale storage capacity due to its long lifespan and high efficiency (70-85% round-trip), but is constrained by the need for suitable topography and water resources, limiting new builds to specific geographies. Flow batteries, such as vanadium redox types, offer scalability for longer-duration storage (4-12 hours) with potentially unlimited cycles via electrolyte replacement, yet suffer from lower energy density and higher upfront costs compared to lithium-ion. Hydrogen storage, produced via electrolysis from surplus solar power, provides potential for seasonal balancing but incurs substantial efficiency losses, with round-trip efficiencies typically below 40% due to conversion steps.[153][154][155] Lithium-ion batteries exhibit round-trip efficiencies of 85-90%, but degrade over 3,000-5,000 cycles, necessitating replacements every 10-15 years and raising lifecycle costs. Fire safety risks, including thermal runaway incidents at facilities like the 2022 Moss Landing event, demand advanced monitoring and suppression systems, while recycling rates hover below 5% globally, complicating material recovery from scarce lithium, cobalt, and nickel supplies. For grid-scale applications, lithium-ion systems are optimized for 2-4 hour durations, insufficient for multi-day lulls without massive overprovisioning, which escalates capital expenses to approximately $1,200/kW plus ongoing degradation adjustments.[156][157][158] Scaling storage to match solar's variability reveals fundamental limitations: no current technology economically provides affordable, high-efficiency storage for weeks-long periods, often requiring hybrid approaches with fossil fuel backups or demand response. Economic analyses indicate storage spreads (the price differential needed for viability) around 20¢/kWh for lithium-ion, yet this assumes ideal conditions and ignores systemic risks like supply chain vulnerabilities from concentrated mining in regions prone to geopolitical instability. Emerging alternatives like compressed air or gravity-based systems remain niche, with pumped hydro's geographic constraints underscoring that storage alone cannot render solar fully baseload-capable without complementary dispatchable generation.[157][159][160]Grid Stability and Backup Requirements
The integration of solar photovoltaic (PV) systems into electricity grids introduces significant stability challenges due to their intermittent and non-dispatchable nature, necessitating robust backup mechanisms to maintain frequency, voltage, and overall system reliability. Solar output fluctuates rapidly with cloud cover, diurnal cycles, and seasonal variations, lacking the inherent inertia provided by synchronous generators in conventional power plants, which results in faster frequency dynamics and larger deviations during imbalances.[161] Higher solar penetration exacerbates these issues by reducing grid inertia, increasing the risk of frequency nadir drops and instability, as demonstrated in modified IEEE 9-bus system simulations where PV levels above 30% significantly worsened frequency response.[162] To counteract this, grid operators must deploy ancillary services such as primary frequency control and spinning reserves, often sourced from natural gas peaker plants capable of rapid ramping, since solar cannot respond to demand signals or contingencies.[161] Backup requirements for solar are effectively 100% on an energy basis during non-production periods, such as nighttime or extended low-insolation events, because PV capacity factors typically range from 10-25% annually, providing minimal firm capacity credit—often below 15% in high-penetration scenarios—meaning nearly full system redundancy from dispatchable sources is required to avoid supply shortfalls.[163] In California, the "duck curve" phenomenon, observed by the California Independent System Operator (CAISO), illustrates this: midday solar oversupply depresses net load, followed by a steep evening ramp-up demand exceeding 10 GW in 2023, compelling reliance on gas-fired generation or batteries for stability, with curtailments reaching 2.5 million MWh in 2023 due to insufficient flexible backup.[164] Batteries have mitigated some ramping needs, adding over 4 GW of capacity by mid-2024, but their short-duration discharge (typically 4 hours) limits coverage for prolonged gaps, shifting costs to ratepayers via higher capacity markets and infrastructure upgrades estimated at billions annually.[165] In Germany, under the Energiewende policy, high solar penetration—reaching peaks that strain local grids—has led to calls for curtailed feed-in to prevent overloads and voltage instability, with unrestricted small-scale PV threatening frequency control and requiring expanded backup from fossil fuels or imports during the 2022-2023 energy crisis when renewables fell short.[166] Empirical analyses confirm that without synthetic inertia from inverters or overbuilt dispatchable capacity, solar-dominated grids face heightened blackout risks, as seen in reduced short-circuit ratios and transient power swings in systems with PV exceeding 50% instantaneous share.[161][167] These challenges underscore the causal dependency on reliable, controllable backups, as storage scalability remains constrained by material limits and round-trip efficiencies below 90%, making full solar reliance impractical without massive over-investment in redundancy.[168]Environmental Considerations
Lifecycle Emissions and Energy Payback
Lifecycle assessments of solar photovoltaic (PV) systems evaluate greenhouse gas (GHG) emissions across the full supply chain, from raw material extraction and manufacturing to installation, operation, maintenance, and end-of-life disposal or recycling. These emissions are predominantly front-loaded during production, particularly for silicon-based modules, where energy-intensive processes like polysilicon purification account for 70-90% of total lifecycle emissions. Operational emissions are negligible due to the absence of fuel use, but manufacturing in coal-dependent regions like China—responsible for over 80% of global PV production—elevates embodied emissions through grid electricity sourced from fossil fuels.[169][170][171] Harmonized lifecycle GHG emissions for crystalline silicon PV systems typically range from 20-80 grams of CO₂-equivalent per kilowatt-hour (g CO₂eq/kWh) in optimistic assessments assuming cleaner manufacturing grids, but empirical data accounting for China's coal-intensive production push estimates higher, often 100-250 g CO₂eq/kWh. For context, this exceeds IPCC medians of around 48 g CO₂eq/kWh, which critics argue understate impacts by relying on outdated or modeled data rather than verified Chinese supply chain emissions. Utility-scale thin-film technologies like cadmium telluride may achieve lower figures (10-40 g CO₂eq/kWh) due to less material intensity, though scalability and toxicity concerns limit their share. Variability arises from module efficiency, installation site irradiance, and recycling rates, with end-of-life emissions adding 5-15% if landfilled rather than recycled.[172][173][174] Energy payback time (EPBT) measures the duration required for a PV system to generate energy equivalent to that consumed in its lifecycle, excluding financial costs. Recent analyses indicate EPBTs of 0.5-2 years for monocrystalline silicon panels in high-insolation regions (e.g., 1,800-2,200 kWh/m²/year), shortening from 2-4 years a decade ago due to efficiency gains (now >20%) and manufacturing optimizations. In lower-irradiance areas or with coal-heavy production, EPBT extends to 2-3 years, as upfront energy demands—primarily for wafer slicing and cell fabrication—remain substantial. These figures assume 25-30 year lifespans, yielding net energy ratios of 10-30, but real-world degradation (0.5-1% annually) and balance-of-system components like inverters can increase effective EPBT by 10-20%.[175][176][177]Resource Extraction and Manufacturing Impacts
The production of solar photovoltaic (PV) panels relies on extracting raw materials such as quartz for silicon, silver for conductive pastes, copper for interconnects and wiring, and aluminum for frames, with global PV demand driving increased mining activities that disrupt ecosystems and generate waste. Quartz mining for high-purity silicon involves energy-intensive open-pit operations, leading to soil erosion, habitat loss, and dust emissions, while silver extraction—where PV modules consumed approximately 12% of global silver supply in 2022—produces acidic mine drainage and heavy metal contamination in water bodies. Copper mining similarly contributes to tailings pollution and land degradation, with solar-related demand exacerbating pressures on finite ore deposits.[178][179][180] Polysilicon refining, the foundational step for crystalline silicon panels (which dominate over 95% of the market), is highly polluting and concentrated in China, where it accounts for the bulk of global output; the process emits silicon tetrachloride and other hazardous byproducts, requiring additional energy for neutralization, and has historically caused local air and water contamination, including fluoride pollution and worker health issues like silicosis from silica dust. This stage is electricity-intensive, often powered by coal in China, generating upstream emissions equivalent to 20-50 grams of CO2 per kilowatt-hour of eventual panel output, depending on production efficiency. Efforts to curb pollution have prompted capacity reductions, with Chinese firms planning to shutter up to one-third of polysilicon plants by 2025 to meet stricter standards, potentially tightening supply.[181][182][183] Panel manufacturing amplifies these impacts through chemical-intensive processes, including the use of hydrofluoric acid, nitric acid, and solvents for wafer etching and cleaning, which pose risks of toxic releases if containment fails, as evidenced by past incidents in production hubs. Water consumption in silicon wafer and cell fabrication averages 10-20 liters per watt-peak, though advanced recycling can reduce this by up to 79%, and overall lifecycle water use remains far lower than for coal power (less than 1% equivalent). The manufacturing phase dominates lifecycle environmental burdens, contributing about 79% of impacts like acidification and eutrophication in regional assessments, due to high energy demands—often 2,000-4,000 kWh per kWp—and reliance on fossil fuels in supply chains. Thin-film alternatives, such as cadmium telluride, introduce additional toxicity risks from heavy metals, though they comprise a minority of production.[184][185][186]Land Use, Waste, and Decommissioning
Utility-scale solar photovoltaic installations typically require 5 to 10 acres of land per megawatt of capacity, depending on technology and site conditions, with fixed-tilt systems averaging around 2.8 acres per MWdc and single-axis tracking systems up to 4.2 acres per MWdc.[187][188] This land footprint arises from the need for panel spacing to minimize shading and accommodate infrastructure, often converting agricultural, grassland, or undeveloped areas into fenced facilities that fragment habitats and alter local ecosystems. Empirical studies indicate these developments can lead to biodiversity loss through vegetation clearing, soil compaction, and barriers to wildlife movement, particularly affecting ground-nesting birds, small mammals, and pollinators in converted habitats.[189][190] While some designs incorporate pollinator-friendly vegetation under panels to support biodiversity, such practices do not fully offset the net habitat loss from large-scale deployments, and evidence for widespread ecological benefits remains limited to pilot projects.[191] Solar panels, with operational lifespans of 25 to 30 years, generate significant end-of-life waste, projected to reach 1 million tons annually in the United States by 2030 and globally between 1.7 and 8 million tons by the same year, escalating to over 60 million tons by 2050 under high-deployment scenarios.[11][192] Crystalline silicon panels, dominant in the market, contain hazardous materials such as lead in solder and, in thin-film variants, cadmium and other heavy metals that pose leaching risks to soil and groundwater if landfilled.[193][194] Current global recycling rates are low, often below 10%, due to economic disincentives, technological complexities in separating layered materials like glass, aluminum, and semiconductors, and insufficient infrastructure, leading to most decommissioned panels entering landfills or incinerators.[195][196] Decommissioning solar farms entails dismantling panels, mounting structures, wiring, and inverters, followed by site restoration to pre-development conditions, with costs averaging approximately $368,000 per megawatt for ground-mounted systems, covering labor, transport, and partial recycling.[197] Regulations in regions like the European Union mandate producer responsibility for end-of-life management, but in the U.S., requirements vary by state, often relying on decommissioning bonds to ensure funding for removal and to prevent abandoned sites from becoming derelict hazards.[198] Improper decommissioning exacerbates environmental risks, including toxin release and erosion from unrestored land, though recycling recovers valuable materials like silver and silicon, potentially offsetting 90% of raw material needs if scaled.[199][200] Overall, without expanded recycling mandates and infrastructure, the cumulative waste stream threatens to undermine solar's environmental claims by creating persistent pollution legacies.[201]Policy and Market Dynamics
National Policies and Regulatory Frameworks
National policies promoting solar power deployment typically involve financial incentives such as tax credits, feed-in tariffs, and direct subsidies, alongside regulatory measures like simplified permitting and renewable portfolio standards that mandate minimum solar contributions to electricity mixes. These frameworks aim to offset the intermittency and higher upfront costs of solar photovoltaic (PV) systems compared to dispatchable fossil fuel sources, though they often transfer costs to consumers via levies or increased retail prices. In 2024, global solar additions reached approximately 600 GW, largely propelled by such interventions in leading markets.[62]| Country/Region | Key Mechanism | Details as of 2025 |
|---|---|---|
| United States | Investment Tax Credit (ITC) | Provides 30% federal tax credit on qualified solar installation costs for residential and commercial projects placed in service through 2032, extended and expanded under the 2022 Inflation Reduction Act; however, 2025 legislation has imposed stricter construction commencement deadlines for eligibility, potentially curtailing new utility-scale solar after July 2026.[121][202] |
| China | Subsidies and Mandates | Government subsidies for renewable generation persisted into 2024 but began phasing out feed-in tariffs amid market maturity, with new mandates requiring industries like steel and aluminum to meet renewable consumption targets; state-directed investments drove 277 GW of additions in 2024, exceeding global totals elsewhere.[203][204][205] |
| Germany | Renewable Energy Sources Act (EEG) | Feed-in tariffs for small-scale solar up to 100 kW reduced to €0.063-€0.125/kWh effective August 2024, with compensation withheld during negative pricing under the 2025 Solar Peak Act to manage grid surpluses; Solar Package I (2024) streamlined approvals for rooftop and agrivoltaic installations to accelerate deployment toward 80% renewables by 2030.[206][207][208] |
| India | PM Surya Ghar: Muft Bijli Yojana | Launched February 2024, offers central financial assistance covering up to 60% of costs for rooftop systems up to 2 kW and 40% for additional capacity, targeting 10 million households to generate 300 free electricity units monthly; updated guidelines in July 2025 simplified subsidy claims for Phase II installations.[209][210] |
| European Union | REPowerEU Plan | Adopted 2022 and advanced through 2025, sets accelerated permitting for renewables, financial support via EU funds, and a 45% renewables target by 2030; achieved interim solar goal of 320 GW by end-2025 through harmonized grid codes and mandates for building-integrated PV in new constructions.[211][212] |
Trade Dependencies and Supply Chain Vulnerabilities
The global solar photovoltaic (PV) supply chain is heavily concentrated in China, which accounted for over 80% of manufacturing capacity across polysilicon, wafers, cells, and modules as of 2023, a dominance projected to persist through 2026.[215] [54] This concentration stems from China's substantial investments, exceeding USD 50 billion in new PV supply capacity since 2011—ten times Europe's level—supported by state policies that have shifted production from Europe, Japan, and the United States.[54] As a result, major importing regions like the United States and Europe depend on Chinese exports for the majority of their solar modules, with China shipping a record 240 GW globally in 2024 alone.[216] Key upstream segments exhibit even greater vulnerabilities: China produces approximately 95% of global polysilicon and dominates ingot and wafer production, creating chokepoints for raw material availability.[54] Downstream, while module assembly has partially shifted to Southeast Asia (e.g., Vietnam and Malaysia, often via Chinese firms relocating to evade tariffs), core components remain China-centric, with over 99% of global module manufacturing capacity effectively controlled by Chinese entities as of September 2024.[217] Trade dependencies amplify risks, as evidenced by U.S. imports facing delays from customs scrutiny under the Uyghur Forced Labor Prevention Act, which presumes goods from Xinjiang—home to significant polysilicon production—are tainted unless proven otherwise, leading to project setbacks in 2024.[66] Supply chain vulnerabilities include geopolitical tensions, potential export restrictions, and disruptions from concentrated production, as demonstrated during the COVID-19 pandemic when factory shutdowns in China caused global shortages and price spikes.[218] Oversupply from China's capacity exceeding 1,100 GW by late 2024—more than double annual demand—has driven module prices to historic lows, but this masks risks of market distortion via state subsidies and dumping, prompting tariffs from the U.S. (e.g., up to 50% on Southeast Asian imports in 2024) and EU anti-subsidy investigations.[219] Additional concerns involve cybersecurity flaws, such as undocumented cellular radios in Chinese-made inverters discovered in 2024, posing potential backdoor risks to grid-connected systems.[220] Efforts to diversify, like U.S. module capacity expanding to 42 GW by end-2024 under the Inflation Reduction Act, remain nascent and insufficient to eliminate reliance on imported cells and wafers.[102]Debates on Subsidies and Energy Mandates
Subsidies for solar power, including tax credits such as the U.S. Investment Tax Credit (ITC) and Production Tax Credit (PTC), have significantly boosted deployment but sparked debates over their economic efficiency and market distortions. In fiscal year 2022, federal support for all renewables reached $15.6 billion, more than double the 2016 level, with solar benefiting substantially through these mechanisms that provide up to 30% investment credits and per-kWh payments. Globally, feed-in tariffs (FITs) in countries like Germany and earlier in the UK drove rapid photovoltaic (PV) capacity additions by guaranteeing above-market prices for solar output, yet these policies imposed substantial fiscal burdens, with UK FIT costs exceeding expectations and contributing to tariff reductions by 2012 amid concerns over intergenerational inequity. Critics argue these interventions create dependency, as unsubsidized solar projects often struggle with viability due to intermittency costs not captured in levelized cost estimates, while proponents claim they enable scale-driven cost reductions, though empirical analyses show subsidies primarily shift rather than optimize resource allocation.[221][222] Energy mandates, such as renewable portfolio standards (RPS) adopted by 29 U.S. states and the District of Columbia, require utilities to source a percentage of electricity from renewables like solar, typically escalating targets to 20-50% by 2030. These policies have increased electricity prices, with studies estimating RPS compliance adds surcharges to consumer bills and raises abatement costs to 460 per metric ton of CO2, far exceeding carbon pricing alternatives. In analytical models, RPS elevate long-run wholesale prices by integrating variable solar output, necessitating backup capacity and grid upgrades that amplify system-wide expenses passed to ratepayers. Defenders assert mandates ensure emissions reductions and hedge against fossil fuel volatility, but evidence indicates they reduce GDP growth and employment in net terms while favoring intermittent sources over dispatchable alternatives, exacerbating reliability risks without commensurate environmental gains relative to costs.[223][224][225][226][227] The broader debate centers on whether subsidies and mandates represent warranted public investment or inefficient transfers that crowd out competitive energy options. U.S. solar subsidies equated to roughly $56,000 per acre for utility-scale projects under the ITC, funding expansions that would likely contract without such support, as rooftop and ground-mount PV profitability hinges on policy incentives amid high upfront capital needs. FIT effectiveness in spurring PV growth is acknowledged, yet retrospective evaluations highlight over-subsidization, with early high tariffs accelerating deployment at the expense of fiscal sustainability and equitable burden-sharing across generations. Mandates compound these issues by enforcing quotas irrespective of marginal costs, leading to higher utility bills—estimated in billions annually across RPS states—and vulnerability to supply chain dependencies, underscoring causal links between policy interventions and elevated consumer prices without resolving solar's inherent limitations in energy density or firm capacity.[228][229][230][225]Comparative Performance
Capacity Factors Versus Dispatchable Sources
The capacity factor of a power plant measures the ratio of its actual electrical energy output over a given period to the maximum possible output if it operated continuously at full rated capacity during that period. For solar photovoltaic (PV) systems, capacity factors are inherently limited by diurnal cycles, weather variability, and seasonal insolation changes, typically ranging from 10% to 30% depending on geographic location and technology, with utility-scale systems in optimal U.S. conditions averaging 23.5% in 2023.[231] Globally, averages are lower, often 15-20%, as many deployments occur in less sunny regions without advanced tracking systems.[114] In comparison, dispatchable sources—those that can be controlled to match grid demand—exhibit significantly higher capacity factors due to their ability to operate on demand, independent of external conditions: nuclear plants averaged 93.1% in the U.S. in 2023, natural gas combined-cycle units 58.8%, and coal plants approximately 49%.[232][233]| Energy Source | U.S. Average Capacity Factor (2023) |
|---|---|
| Solar PV (utility-scale) | 23.5% |
| Nuclear | 93.1% |
| Natural Gas (combined cycle) | 58.8% |
| Coal | ~49% |