Hubbry Logo
Water footprintWater footprintMain
Open search
Water footprint
Community hub
Water footprint
logo
8 pages, 0 posts
0 subscribers
Be the first to start a discussion here.
Water footprint
Water footprint
from Wikipedia
Infographic of water footprints around the world

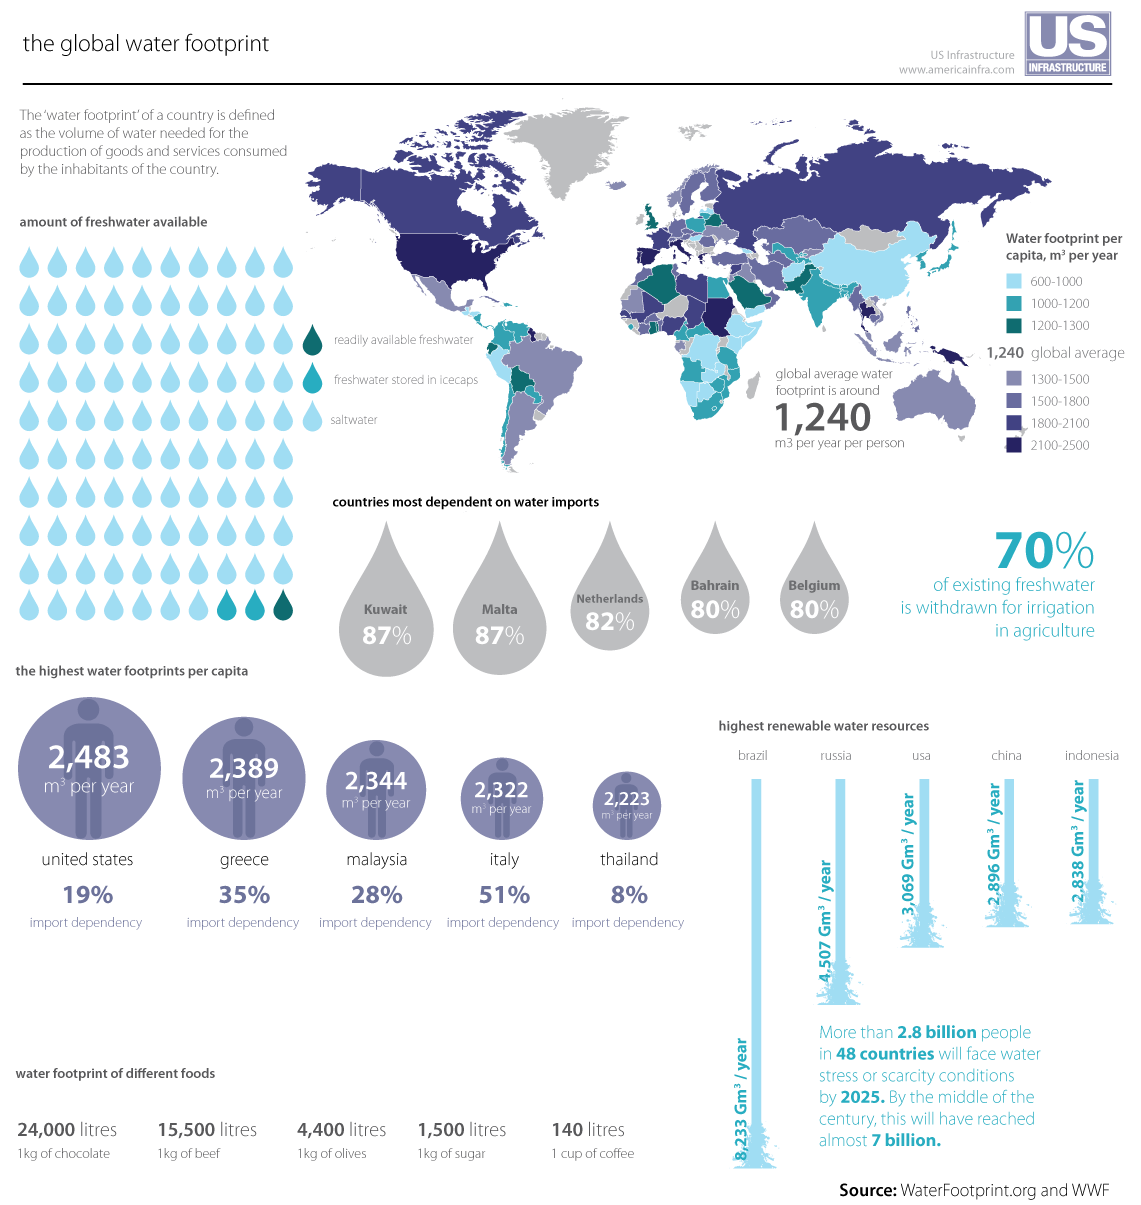
A water footprint shows the extent of water use in relation to consumption by people.[1] The water footprint of an individual, community, or business is defined as the total volume of fresh water used to produce the goods and services consumed by the individual or community or produced by the business. Water use is measured in water volume consumed (evaporated) and/or polluted per unit of time. A water footprint can be calculated for any well-defined group of consumers (e.g., an individual, family, village, city, province, state, or nation) or producers (e.g., a public organization, private enterprise, or economic sector), for a single process (such as growing rice) or for any product or service.[2]

Traditionally, water use has been approached from the production side, by quantifying the following three columns of water use: water withdrawals in the agricultural, industrial, and domestic sector. While this does provide valuable data, it is a limited way of looking at water use in a globalised world, in which products are not always consumed in their country of origin. International trade of agricultural and industrial products in effect creates a global flow of virtual water, or embodied water (akin to the concept of embodied energy).[1]

In 2002, the water footprint concept was introduced in order to have a consumption-based indicator of water use, that could provide useful information in addition to the traditional production-sector-based indicators of water use. It is analogous to the ecological footprint concept introduced in the 1990s. The water footprint is a geographically explicit indicator, not only showing volumes of water use and pollution, but also the locations.[3] The global issue of water footprinting underscores the importance of fair and sustainable resource management. Due to increasing water shortages, climate change, and environmental concerns, transitioning towards a fair impact of water use is critical. The water footprint concept offers detailed insights for adequate and equitable water resource management. It advocates for a balanced and sustainable water-use approach, aiming to tackle global challenges. This approach is essential for responsible and equitable water resource utilization globally. Thus, it gives a grasp on how economic choices and processes influence the availability of adequate water resources and other ecological realities across the globe (and vice versa).

Definition and measures

[edit]

There are many different aspects to water footprint and therefore different definitions and measures to describe them. Blue water footprint refers to groundwater or surface water usage, green water footprint refers to rainwater, and grey water footprint refers to the amount of water needed to dilute pollutants.[4]

Blue water footprint

[edit]

A blue water footprint refers to the volume of water that has been sourced from surface or groundwater resources (lakes, rivers, wetlands and aquifers) and has either evaporated (for example while irrigating crops), or been incorporated into a product or taken from one body of water and returned to another, or returned at a different time. Irrigated agriculture, industry and domestic water use can each have a blue water footprint.[5]

Green water footprint

[edit]

A green water footprint refers to the amount of water from precipitation that, after having been stored in the root zone of the soil (green water), is either lost by evapotranspiration or incorporated by plants. It is particularly relevant for agricultural, horticultural and forestry products.[5]

Grey water footprint

[edit]

A grey water footprint refers to the volume of water that is required to dilute pollutants (industrial discharges, seepage from tailing ponds at mining operations, untreated municipal wastewater, or nonpoint source pollution such as agricultural runoff or urban runoff) to such an extent that the quality of the water meets agreed water quality standards.[5] It is calculated as:

where L is the pollutant load (as mass flux), cmax the maximum allowable concentration and cnat the natural concentration of the pollutant in the receiving water body (both expressed in mass/volume).[6]

Calculation for different factors

[edit]

The water footprint of a process is expressed as volumetric flow rate of water. That of a product is the whole footprint (sum) of processes in its complete supply chain divided by the number of product units. For consumers, businesses and geographic area, water footprint is indicated as volume of water per time, in particular:[6]

  • That of a consumer is the sum of footprint of all consumed products.
  • That of a community or a nation is the sum for all of its members resp. inhabitants.
  • That of a business is the footprint of all produced goods.
  • That of a geographically delineated area is the footprint of all processes undertaken in this area. The virtual change in water of an area is the net import of virtual water Vi, net, defined as the difference of the gross import Vi of virtual water from its gross export Ve. The water footprint of national consumption WFarea,nat results from this as the sum of the water footprint of national area and its virtual change in water.

History

[edit]

The concept of a water footprint was coined in 2002, by Arjen Hoekstra, Professor in water management at the University of Twente, Netherlands, and co-founder and scientific director of the Water Footprint Network, whilst working at the UNESCO-IHE Institute for Water Education, as a metric to measure the amount of water consumed and polluted to produce goods and services along their full supply chain.[7][8][9] Water footprint is one of a family of ecological footprint indicators, which also includes carbon footprint and land footprint. The water footprint concept is further related to the idea of virtual water trade introduced in the early 1990s by Professor John Allan (2008 Stockholm Water Prize Laureate). The most elaborate publications on how to estimate water footprints are a 2004 report on the Water footprint of nations from UNESCO-IHE,[10] the 2008 book Globalization of Water,[11] and the 2011 manual The water footprint assessment manual: Setting the global standard.[12] Cooperation between global leading institutions in the field has led to the establishment of the Water Footprint Network in 2008.

Water Footprint Network (WFN)

[edit]

The Water Footprint Network is an international learning community (a non-profit foundation under Dutch law) which serves as a platform for sharing knowledge, tools and innovations among governments, businesses and communities concerned about growing water scarcity and increasing water pollution levels, and their impacts on people and nature. The network consists of around 100 partners from all sectors – producers, investors, suppliers and regulators – as well as non-governmental organisations and academics. It describes its mission as follows:

To provide science-based, practical solutions and strategic insights that empower companies, governments, individuals and small-scale producers to transform the way we use and share fresh water within earth's limits.[7]

International standard

[edit]

In February 2011, the Water Footprint Network, in a global collaborative effort of environmental organizations, companies, research institutions and the UN, launched the Global Water Footprint Standard. In July 2014, the International Organization for Standardization issued ISO 14046:2014, Environmental management—Water footprint—Principles, requirements and guidelines, to provide practical guidance to practitioners from various backgrounds, such as large companies, public authorities, non-governmental organizations, academic and research groups as well as small and medium enterprises, for carrying out a water footprint assessment. The ISO standard is based on life-cycle assessment (LCA) principles and can be applied for different sorts of assessment of products and companies.[13]

Life-cycle assessment of water use

[edit]

Life-cycle assessment (LCA) is a systematic, phased approach to assessing the environmental aspects and potential impacts that are associated with a product, process or service. "Life cycle" refers to the major activities connected with the product's life-span, from its manufacture, use, and maintenance, to its final disposal, and also including the acquisition of raw material required to manufacture the product.[14] Thus a method for assessing the environmental impacts of freshwater consumption was developed. It specifically looks at the damage to three areas of protection: human health, ecosystem quality, and resources. The consideration of water consumption is crucial where water-intensive products (for example agricultural goods) are concerned that need to therefore undergo a life-cycle assessment.[15] In addition, regional assessments are equally as necessary as the impact of water use depends on its location. In short, LCA is important as it identifies the impact of water use in certain products, consumers, companies, nations, etc. which can help reduce the amount of water used.[16]

Water positive

[edit]

The Water Positive initiative can be defined as the concept where an entity, such as a company, community, or individual, goes beyond simply conserving water and actively contributes to the sustainable management and restoration of water resources. A commercial or residential development is considered water positive when it generates more water than it consumes. This involves implementing practices and technologies that reduce water consumption, improve water quality, and enhance water availability. The goal of being water positive is to leave a positive impact on water ecosystem and ensure that more water is conserved and restored than is used or depleted.[17][18][19][20]

Water availability

[edit]
Total renewable water resources per capita in 2020

Globally, about 4 percent of precipitation falling on land each year (about 117,000 km3 (28,000 cu mi)),[21] is used by rain-fed agriculture and about half is subject to evaporation and transpiration in forests and other natural or quasi-natural landscapes.[22] The remainder, which goes to groundwater replenishment and surface runoff, is sometimes called "total actual renewable freshwater resources". Its magnitude was in 2012 estimated at 52,579 km3 (12,614 cu mi)/year.[23] It represents water that can be used either in-stream or after withdrawal from surface and groundwater sources. Of this remainder, about 3,918 km3 (940 cu mi) were withdrawn in 2007, of which 2,722 km3 (653 cu mi), or 69 percent, were used by agriculture, and 734 km3 (176 cu mi), or 19 percent, by other industry.[24] Most agricultural use of withdrawn water is for irrigation, which uses about 5.1 percent of total actual renewable freshwater resources.[23] World water use has been growing rapidly in the last hundred years.[25][26]

Water footprint of products (agricultural sector)

[edit]
water is our everyday necessity

The water footprint of a product is the total volume of freshwater used to produce the product, summed over the various steps of the production chain. The water footprint of a product refers not only to the total volume of water used; it also refers to where and when the water is used.[27] The Water Footprint Network maintains a global database on the water footprint of products: WaterStat.[28] Nearly over 70% of the water supply worldwide is used in the agricultural sector.[29][clarification needed]

The water footprints involved in various diets vary greatly, and much of the variation tends to be associated with levels of meat consumption.[30] The following table gives examples of estimated global average water footprints of popular agricultural products.[31][32][33]

Product Global average water footprint, L/kg
almonds, shelled 16,194
apple 822
avocado 283
banana 790
beef 15,415
bread, wheat 1,608
butter 5,553
cabbage 237
cheese 3,178
chicken 4,325
chocolate 17,196
cotton lint 9,114
cucumber 353
dates 2,277
eggs 3,300
groundnuts, shell 2,782
leather (bovine) 17,093
e 238
maize 1,222
mango/guava 1,800
milk 1,021
olive oil 14,430
orange 560
pasta (dry) 1,849
peach/nectarine 910
pork 5,988
potato 287
pumpkin 353
rice 2,497
tomatoes, fresh 214
tomatoes, dried 4,275
vanilla beans 126,505

Water footprint of companies (industrial sector)

[edit]

The water footprint of a business, the 'corporate water footprint', is defined as the total volume of freshwater that is used directly or indirectly to run and support a business. It is the total volume of water use to be associated with the use of the business outputs. The water footprint of a business consists of water used for producing/manufacturing or for supporting activities and the indirect water use in the producer's supply chain.

The Carbon Trust argue that a more robust approach is for businesses to go beyond simple volumetric measurement to assess the full range of water impact from all sites. Its work with leading global pharmaceutical company GlaxoSmithKline (GSK) analysed four key categories: water availability, water quality, health impacts, and licence to operate (including reputational and regulatory risks) in order to enable GSK to quantitatively measure, and credibly reduce, its year-on-year water impact.[34]

The Coca-Cola Company operates over a thousand manufacturing plants in about 200 countries. Making its drink uses a lot of water. Critics say its water footprint has been large. Coca-Cola has started to look at its water sustainability.[35] It has now set out goals to reduce its water footprint such as treating the water it uses so it goes back into the environment in a clean state. Another goal is to find sustainable sources for the raw materials it uses in its drinks, such as sugarcane, oranges, and maize. By making its water footprint better, the company can reduce costs, improve the environment, and benefit the communities in which it operates.[36]

Water footprint of individual consumers (domestic sector)

[edit]

The water footprint of an individual refers to the sum of their direct and indirect freshwater use. The direct water use is the water used at home, while the indirect water use relates to the total volume of freshwater that is used to produce the goods and services consumed.

The average global water footprint of an individual is 1,385 m3 per year. Residents of some example nations have water footprints as shown in the table:

Nation annual water footprint
China 1,071 m3[37]
Finland 1,733 m3[38][unreliable source?]
India 1,089 m3[37]
United Kingdom 1,695 m3[39]
United States 2,842 m3[40]

Water footprint of nations

[edit]
Global view of national per capita water footprints

The water footprint of a nation is the amount of water used to produce the goods and services consumed by the inhabitants of that nation. Analysis of the water footprint of nations illustrates the global dimension of water consumption and pollution, by showing that several countries rely heavily on foreign water resources and that (consumption patterns in) many countries significantly and in various ways impact how, and how much, water is being consumed and polluted elsewhere on Earth. International water dependencies are substantial and are likely to increase with continued global trade liberalisation. The largest share (76%) of the virtual water flows between countries is related to international trade in crops and derived crop products. Trade in animal products and industrial products contributed 12% each to the global virtual water flows. The four major direct factors determining the water footprint of a country are: volume of consumption (related to the gross national income); consumption pattern (e.g. high versus low meat consumption); climate (growth conditions); and agricultural practice (water use efficiency).[1]

Production or consumption

[edit]

The assessment of total water use in connection to consumption can be approached from both ends of the supply chain.[41] The water footprint of production estimates how much water from local sources is used or polluted in order to provide the goods and services produced in that country. The water footprint of consumption of a country looks at the amount of water used or polluted (locally, or in the case of imported goods, in other countries) in connection with all the goods and services that are consumed by the inhabitants of that country. The water footprint of production and that of consumption, can also be estimated for any administrative unit such as a city, province, river basin or the entire world.[1]

Absolute or per capita

[edit]

The absolute water footprint is the total sum of water footprints of all people. A country's per capita water footprint (that nation's water footprint divided by its number of inhabitants) can be used to compare its water footprint with those of other nations.

The global water footprint in the period 1996–2005 was 9.087 Gm3/yr (Billion Cubic Metres per year, or 9.087.000.000.000.000 liters/year), of which 74% was and green, 11% blue, 15% grey. This is an average amount per capita of 1.385 Gm3/yr., or 3.800 liters per person per day.[42] On average 92% of this is embedded in agricultural products consumed, 4.4% in industrial products consumed, and 3.6% is domestic water use. The global water footprint related to producing goods for export is 1.762 Gm3/y.[43]

In absolute terms, India is the country with the largest water footprint in the world, a total of 987 Gm3/yr. In relative terms (i.e. taking population size into account), the people of the USA have the largest water footprint, with 2480 m3/yr per capita, followed by the people in south European countries such as Greece, Italy and Spain (2300–2400 m3/yr per capita). High water footprints can also be found in Malaysia and Thailand. In contrast, the Chinese people have a relatively low per capita water footprint with an average of 700 m3/yr.[1] (These numbers are also from the period 1996–2005.)

Internal or external

[edit]
Global average numbers and composition of all national water footprints, internal and external

The internal water footprint is the amount of water used from domestic water resources; the external water footprint is the amount of water used in other countries to produce goods and services imported and consumed by the inhabitants of the country. When assessing the water footprint of a nation, it is crucial to take into account the international flows of virtual water (also called embodied water, i.e. the water used or polluted in connection to all agricultural and industrial commodities) leaving and entering the country. When taking the use of domestic water resources as a starting point for calculating a nation's water footprint, one should subtract the virtual water flows that leave the country and add the virtual water flows that enter the country.[1]

The external part of a nation's water footprint varies strongly from country to country. Some African nations, such as Sudan, Mali, Nigeria, Ethiopia, Malawi and Chad have hardly any external water footprint, simply because they have little import. Some European countries on the other hand—e.g. Italy, Germany, the UK and the Netherlands—have external water footprints that constitute 50–80% of their total water footprint. The agricultural products that on average contribute most to the external water footprints of nations are: bovine meat, soybean, wheat, cocoa, rice, cotton and maize.[1]

The top 10 gross virtual water exporting nations, which together account for more than half of the global virtual water export, are the United States (314 Gm3/year), China (143 Gm3/year), India (125 Gm3/year), Brazil (112 Gm3/year), Argentina (98 Gm3/year), Canada (91 Gm3/year), Australia (89 Gm3/year), Indonesia (72 Gm3/year), France (65 Gm3/year), and Germany (64 Gm3/year).[43]

The top 10 gross virtual water importing nations are the United States (234 Gm3/year), Japan (127 Gm3/year), Germany (125 Gm3/year), China (121 Gm3/year), Italy (101 Gm3/year), Mexico (92 Gm3/year), France (78 Gm3/year), the United Kingdom (77 Gm3/year), and The Netherlands (71 Gm3/year).[43]

Water use in continents

[edit]

Europe

[edit]

Each EU citizen consumes 4,815 litres of water per day on average; 44% is used in power production primarily to cool thermal plants or nuclear power plants. Energy production annual water consumption in the EU 27 in 2011 was, in billion m3: for gas 0.53, coal 1.54 and nuclear 2.44. Wind energy avoided the use of 387 million cubic metres (mn m3) of water in 2012, avoiding a cost of €743 million.[44][45]

Asia

[edit]

In south India the state Tamil Nadu is one of the main agricultural producers in India and it relies largely in groundwater for irrigation. In ten years, from 2002 to 2012, the Gravity Recovery and Climate Experiment calculated that the groundwater reduced in 1.4 m yr−1, which "is nearly 8% more than the annual recharge rate."[29]

Environmental water use

[edit]

Although agriculture's water use includes provision of important terrestrial environmental values (as discussed in the "Water footprint of products" section above), and much "green water" is used in maintaining forests and wild lands, there is also direct environmental use (e.g. of surface water) that may be allocated by governments. For example, in California, where water use issues are sometimes severe because of drought, about 48 percent of "dedicated water use" in an average water year is for the environment (somewhat more than for agriculture).[46] Such environmental water use is for keeping streams flowing, maintaining aquatic and riparian habitats, keeping wetlands wet, etc.

Water Footprint of Artificial Intelligence

[edit]

The rapid growth of artificial intelligence poses some serious environmental concerns one of which is its exceptionally high water footprint. To function, AI technology requires vast amounts of data therefore data centers are growing across the world. These data centers use water in two ways: direct and indirect. They directly use vast amounts of electricity which need to be generated and this requires significant amounts of water and they indirectly use large quantities of water for cooling.[47] This cooling occurs by circulating water through the data center which absorbs heat. As a result of this data centers have an exceptionally high water footprint, and in particular AI data centers. This is a result of the higher level processing that AI requires so there is a higher energy usage therefore more water is needed to generate the electricity and more cooling is necessary.[47]

The rate of AI development has been rapid in recent years, with data centers expected to account for 3.5 percent of the world's electricity use by 2030.[48] This rapid development, in particular with regard to water usage, have sparked concern amongst the global community, particularly in areas already facing water scarcity.[47] Whilst it is difficult to know exactly the statistics behind the water usage of AI, due to a lack of available statistics directly from the companies themselves, we can see the impact through examples such as the Great Salt Lake Basin, which is host to a number of data centers as a result of its cheap water, but which is experiencing new lows in water level year on year.[49]

This is a problem which is being addressed, with major tech companies such as Microsoft, Meta, Amazon and Google aiming to become water positive by 2030,[47] with Meta also promising to restore 200% of the water they consume in high water stress regions and 100% of the water they consume in medium water stress regions.[49] Furthermore, there are innovative solutions being developed, such as Google's using non-potable water at over 25% of its data centers, and developing new techniques using either low-water alternatives or recycled wastewater to try and reduce their water footprint. Furthermore, their Hamina data center in Finland uses sea water for cooling which is heated and then cooled again before being returned to the sea. Microsoft are attempting to utilize adiabatic cooling which substitutes the water for outside air, as well as developing Project Natick to try and build a submerged data center which makes use of the sea temperature for cooling.[47]

Criticism

[edit]

Insufficient consideration of consequences of proposed water saving policies to farm households

[edit]

According to Dennis Wichelns of the International Water Management Institute: "Although one goal of virtual water analysis is to describe opportunities for improving water security, there is almost no mention of the potential impacts of the prescriptions arising from that analysis on farm households in industrialized or developing countries. It is essential to consider more carefully the inherent flaws in the virtual water and water footprint perspectives, particularly when seeking guidance regarding policy decisions."[50]

Regional water scarcity should be taken into account when interpreting water footprint

[edit]

The application and interpretation of water footprints may sometimes be used to promote industrial activities that lead to facile criticism of certain products. For example, the 140 litres required for coffee production for one cup[2] might be of no harm to water resources if its cultivation occurs mainly in humid areas, but could be damaging in more arid regions. Other factors such as hydrology, climate, geology, topography, population and demographics should also be taken into account. Nevertheless, high water footprint calculations do suggest that environmental concern may be appropriate.

Many of the criticisms, including the above ones, compare the description of the water footprint of a water system to generated impacts, which is about its performance. Such a comparison between descriptive and performance factors and indicators is basically flawed.[51]

Disproportionality in Measuring the Effects of Grey Water

[edit]

In regards to grey water footprints, the current system has difficulties when it comes to accurately depicting the effect of pollution and dilution based contributions towards water footprints as opposed to usage.[52] The effects of contamination are not considered to be different from that of scarcity, though the two have different effects on both human life and the environment.

It is possible for many different waste byproducts to have effects on an ecosystem, and common water footprints approaches that only test for a few of these byproducts do not capture the complete harm done to the environment.[53] One form of unaccounted for environmental degradation can be found in marine ecosystem degradation. One of the most widely considered concerns in marine ecosystem degradation pertains to eutrophication, which is measured by the amount of nitrogen emitted by a body of water.[54][55] However, it is also possible for industrial waste to have other contaminants in the water, such as other oils or compounds, that can not be measured in the same way that eutrophication can, and therefore will not be accounted for in degradation reports without proper testing methods of their own.[55]

Waste byproducts also affect the quality of drinking water in a similar manner. In China, the byproducts of industrial waste result in heavy metals and salts being polluted into the public water supply.[54] Though water footprints methods do account for the actual water polluted by the contaminants, it does not factor in the amount of water needed to dilute the contaminated water in order to get it to reasonable levels. A similar phenomenon can be seen in an analysis on California's water usage.[56] Whereas the blue and green water components were able to be traced by researchers, the gray water component proved to be difficult to obtain data for by comparison. Therefore, due to a lack of consideration of all factors, water footprints fails to capture the entirety of the impact of industrial waste. If the effects of a process on the environment are unclear during the process of water footprints, it decreases the accuracy of the resulting report.

Effects of Location and Globalization on Water Footprints

[edit]

Water footprints also have difficulties when attempting to trace the total environmental impact on a global scale, as opposed to the effect in a singular area. With the globalization of the economy and how multiple processes are involved in the creation of a product, different procedures may have different impacts on the environment.[57] However, these processes can not be measured using general metrics, as the procedures that one facility may use to complete that process, be through necessity or efficiency, may not necessarily be the same as another facility tasked with the same procedure.[58] This introduces spatiality - that is, the location from which waste originates - as another axis of consideration in the problem of evaluating water footprints.[55] These implications apply to water footprints, as the environmental effects and contribution to scarcity similarly can not be assessed through generalization.[59]

The spatial effects can also be observed when looking at the concepts of direct and indirect water footprints.[58] Direct water footprint can be defined as water that is used at a specific site to generate or maintain conditions necessary to create a given product. Indirect water footprint can be defined as water that is used to complete the intermediate steps required for many products, such as harvesting foods or fuel sources.[60] While direct water footprint can be measured by taking reports from a specific facility to the amount of water that they use or dilute, indirect water footprints brings their own complications. Indirect water footprints tend to have high variability due to geographical factors.[60] For instance, One proponent of indirect water foot printing is tracing the amount of water used to extract the raw petroleum needed to transport a commodity. Since the amount of fuel used depends on the distance a shipment needs to travel, it can vary greatly between countries, depending on how far resources need to be transported.[60] The multifaceted nature of indirect water footprint sources makes it difficult to accurately assess all of the separate aspects contributing to a product, and even more so the total impact.[59]

Though these criticisms bring merit, these problems are somewhat reduced when water footprint is not used as a lone indicator, but is instead interpreted in context.[61] On the topic of grey water, adequate consideration of all possible consequences of industrial processes can do well to alleviate these issues.[62][63] When a well-rounded measurement is taken of all of the pollutants that a form of waste can introduce to the environment, it greatly enhances the accuracy of the calculation. On the issue of spatial differences, the use of water availability as a factor assists in determining the proportion of water in a given area a certain water footprint applies to. When data relevant to the specific situation is gathered, both about water and process used and different spatial factors, it becomes more feasible to extrapolate calculations using the water footprint system.[64]

The use of the term footprint can also confuse people familiar with the notion of a carbon footprint, because the water footprint concept includes sums of water quantities without necessarily evaluating related impacts. This is in contrast to the carbon footprint, where carbon emissions are not simply summarized but normalized by CO2 emissions, which are globally identical, to account for the environmental harm. The difference is due to the somewhat more complex nature of water; while involved in the global hydrological cycle, it is expressed in conditions both local and regional through various forms like river basins, watersheds, on down to groundwater (as part of larger aquifer systems). Furthermore, looking at the definition of the footprint itself, and comparing ecological footprint, carbon footprint and water footprint, we realize that the three terms are indeed legitimate.[51]

Sustainable water use

[edit]

Sustainable water use involves the rigorous assessment of all source of clean water to establish the current and future rates of use, the impacts of that use both downstream and in the wider area where the water may be used and the impact of contaminated water streams on the environment and economic well-being of the area. It also involves the implementation of social policies such as water pricing in order to manage water demand.[65] In some localities, water may also have spiritual relevance and the use of such water may need to take account of such interests. For example, the Maori believe that water is the source and foundation of all life and have many spiritual associations with water and places associated with water.[66] On a national and global scale, water sustainability requires strategic and long term planning to ensure appropriate sources of clean water are identified and the environmental and economic impact of such choices are understood and accepted.[67] The re-use and reclamation of water is also part of sustainability including downstream impacts on both surface waters and ground waters.[36]

Sustainability assessment

[edit]

Water footprint accounting has advanced substantially in recent years, however, water footprint analysis also needs sustainability assessment as its last phase.[12] One of the developments is to employ sustainable efficiency and equity ("Sefficiency in Sequity"), which present a comprehensive approach to assessing the sustainable use of water.[51][68]

Sectoral distributions of withdrawn water use

[edit]

Several nations estimate sectoral distribution of use of water withdrawn from surface and groundwater sources. For example, in Canada, in 2005, 42 billion m3 of withdrawn water were used, of which about 38 billion m3 were freshwater. Distribution of this use among sectors was: thermoelectric power generation 66.2%, manufacturing 13.6%, residential 9.0%, agriculture 4.7%, commercial and institutional 2.7%, water treatment and distribution systems 2.3%, mining 1.1%, and oil and gas extraction 0.5%. The 38 billion m3 of freshwater withdrawn in that year can be compared with the nation's annual freshwater yield (estimated as streamflow) of 3,472 billion m3.[69] Sectoral distribution is different in many respects in the US, where agriculture accounts for about 39% of fresh water withdrawals, thermoelectric power generation 38%, industrial 4%, residential 1%, and mining (including oil and gas) 1%.[70]

Within the agricultural sector, withdrawn water use is for irrigation and for livestock. Whereas all irrigation in the US (including loss in conveyance of irrigation water) is estimated to account for about 38 percent of US withdrawn freshwater use,[70] the irrigation water used for production of livestock feed and forage has been estimated to account for about 9 percent,[71] and other withdrawn freshwater use for the livestock sector (for drinking, washdown of facilities, etc.) is estimated at 0.7 percent.[70] Because agriculture is a major user of withdrawn water, changes in the magnitude and efficiency of its water use are important. In the US, from 1980 (when agriculture's withdrawn water use peaked) to 2010, there was a 23 percent reduction in agriculture's use of withdrawn water,[70] while US agricultural output increased by 49 percent over that period.[72]

In the US, irrigation water application data are collected in the quinquennial Farm and Ranch Irrigation Survey, conducted as part of the Census of Agriculture. Such data indicate great differences in irrigation water use within various agricultural sectors. For example, about 14 percent of corn-for-grain land and 11 percent of soybean land in the US are irrigated, compared with 66 percent of vegetable land, 79 percent of orchard land and 97 percent of rice land.[73][74]

See also

[edit]

References

[edit]
[edit]
Revisions and contributorsEdit on WikipediaRead on Wikipedia
from Grokipedia
The water footprint quantifies the total volume of freshwater appropriated to produce consumed by individuals, businesses, or nations, including volumes consumed through or incorporation into products as well as volumes polluted to assimilate loads of nutrients or chemicals. Introduced by hydrological engineer Arjen Hoekstra in the early 2000s, the concept extends beyond direct water use to indirect " embedded in supply chains, such as for crops or processing in manufacturing. It comprises three components: the green water footprint, representing rainwater and evaporated or transpired by plants; the blue footprint, denoting surface and withdrawn and not returned; and the grey footprint, estimating the volume of freshwater required to dilute pollutants to meet ambient standards. Globally, the human water footprint averaged 9,087 billion cubic meters per year from 1996 to 2005, with accounting for 92%—predominantly green water from rainfed crops—and domestic and industrial uses comprising the rest. The metric highlights disparities in water efficiency and trade flows, revealing that about one-fifth of the global footprint supports exports, enabling water-scarce nations to import water-intensive products like or while exporting less thirsty goods. In agriculture, which dominates due to in crop and livestock production, the footprint underscores opportunities for yield improvements and dietary shifts to reduce overall demand, as animal products carry footprints up to ten times those of cereals per caloric unit. Despite its utility in mapping consumption patterns, the water footprint has faced scrutiny for aggregating volumes without weighting by local or ecological thresholds, potentially overstating in water-abundant regions while underemphasizing depletion in stressed basins; the component, in particular, assumes fixed dilution standards that may not reflect site-specific assimilative capacities or regulatory contexts. Peer-reviewed analyses argue it serves better as a descriptive tool than a prescriptive one for policy, as unadjusted totals can mislead without integration of hydrological baselines or economic trade-offs.

Conceptual Foundations

Definition and Core Principles

The water footprint quantifies the total volume of freshwater appropriated for the production of goods and services, encompassing both direct and indirect uses across the , measured in cubic meters per unit of product, person, or economic activity. Introduced by hydrologist Arjen Y. Hoekstra in 2002 at the , it extends beyond traditional water withdrawal metrics by emphasizing consumption—water evaporated, transpired, or incorporated into products—and pollution assimilation, thereby accounting for the full hydrological impact of human activities. This consumption-based framework contrasts with production-based accounting, which often obscures trade-related water transfers, as evidenced by global flows exceeding 2,300 billion cubic meters annually in the early 2000s, primarily embedded in agricultural exports from water-scarce regions. At its core, the water footprint decomposes into three distinct components to capture the sources and types of freshwater use: , , and . The water footprint measures the volume of rainwater and consumed by crops or through , representing the largest share globally at approximately 74% of total footprints in assessments from 1996–2005. The water footprint tracks the consumption of surface and , such as diversions that are not returned to the source, comprising about 11% of global totals and critical in arid areas where overuse depletes aquifers. The water footprint estimates the dilution volume needed to restore polluted water to natural background levels, calculated as the load of pollutants (e.g., or ) divided by the maximum acceptable concentration minus ambient levels, accounting for roughly 15% of footprints and highlighting from fertilizers, industrial effluents, and . These components together provide a comprehensive volumetric indicator, enabling causal tracing of from consumption patterns back to upstream extraction and degradation. Fundamental principles underlying the water footprint include volumetric aggregation for comparability, supply-chain inclusivity to reveal hidden dependencies (e.g., a single requiring over 2,500 liters, mostly green water in rainfed cultivation), and integration with local availability thresholds for evaluation. Unlike efficiency-focused metrics that ignore or , it prioritizes empirical hydrological balances, such as equating footprints to evaporative losses plus assimilated contaminants, grounded in equations from agro-hydrological models. This approach underscores causal realism in resource use, where global amplifies local scarcities—e.g., -abundant nations importing high-footprint goods from stressed basins—without assuming equivalence across water types, as green water supports ecosystems differently from . Assessments adhering to these principles, as standardized by the Water Footprint Network, facilitate targeted reductions, such as shifting to low-grey alternatives in , but require validation against field data to avoid overgeneralization from modeled estimates.

Components of Water Footprint

The water footprint consists of three primary components: , , and , each quantifying distinct forms of water consumption and across production processes, supply chains, or consumption activities. These components, expressed in cubic meters of water per unit of product or , enable a volumetric assessment that differentiates water sources, uses, and impacts, facilitating comparisons of and efficiency. The green water footprint measures the volume of rainwater evaporated or transpired by , or retained in the as moisture for growth, primarily in rain-fed systems. It captures the productive use of that would otherwise evaporate or percolate unused, with global estimates indicating that green water constitutes about 74% of agricultural water footprints to its dominance in . This component highlights the reliance on natural rainfall, which varies regionally and is vulnerable to variability. The blue water footprint quantifies the volume of and consumed through , incorporation into products, or release in a changed form, such as return flows with reduced quality. Blue water, drawn from rivers, lakes, reservoirs, and aquifers, accounts for roughly 20-22% of total human use globally and is critical in irrigated , where it supports higher yields but risks depletion of finite resources; for instance, cotton production in arid regions often exhibits high blue footprints exceeding 10,000 cubic meters per ton. Its scarcity in water-stressed basins underscores trade-offs with domestic, industrial, and ecological demands. The grey water footprint represents the volume of freshwater needed to dilute pollutants—such as nutrients, chemicals, or sediments—to levels meeting ambient standards, based on the difference between load concentrations and natural background levels. It addresses water pollution's assimilative capacity, with calculations often using the least stringent of national or international standards; in production, grey footprints from runoff can reach 3,000-5,000 cubic meters per ton of meat, reflecting risks in freshwater systems. This component integrates quality degradation into footprint metrics, emphasizing remediation needs over mere extraction.

Measurement Methodologies

The water footprint is quantified through volumetric accounting of green, blue, and grey components, as standardized by the Water Footprint Network (WFN) in its 2011 Global Water Footprint Standard and subsequent Assessment Manual. Green water footprint measures the volume of rainwater stored in the soil and subsequently evaporated or incorporated into plant biomass, calculated via dynamic water balance models that integrate crop-specific evapotranspiration data from sources like the FAO AquaCrop model or Penman-Monteith equation, often spatially resolved at grid scales of 5-10 arc minutes. Blue water footprint quantifies the volume of surface or groundwater consumed (evaporated or incorporated), derived from irrigation requirements subtracted by non-consumptive returns, using hydrological models such as MODFLOW for groundwater or SWAT for basin-scale flows. Grey water footprint estimates the volume of freshwater needed to dilute pollutant loads to ambient water quality standards, computed as the difference between maximum allowable concentration and natural background levels divided by the pollutant load per unit product, with standards drawn from national regulations like EU Water Framework Directive thresholds or WHO guidelines for parameters such as nitrogen, phosphorus, and pesticides. These calculations employ bottom-up process-based approaches for specific products or processes, tracing water inputs across supply chains using life cycle inventory , or top-down input-output models for economy-wide estimates, where water use coefficients are multiplied by monetary intersectoral flows from matrices like EXIOBASE or . For agricultural products, which dominate global footprints (e.g., 92% of humanity's total), water footprints integrate daily simulations over growing seasons, accounting for variables like planting dates, varieties, and climate from reanalysis datasets such as ERA5. Industrial processes rely on metering for direct withdrawals and stoichiometric models for indirect in inputs, with grey components often dominated by or nutrient excretion loads. Uncertainties arise from variability, with studies reporting 10-30% ranges for models due to parameter sensitivity, necessitating sensitivity analyses and simulations in robust assessments. Complementing the volumetric WFN method, ISO 14046:2014 establishes a (LCA)-based framework for water footprinting, emphasizing over pure volumes by incorporating local and ecosystem degradation potentials. It requires defining system boundaries, inventorying water inputs/outputs (e.g., consumption, discharge), and characterizing impacts via methods like or WULCA's Available Water Remaining (AWR) indicator, which weights volumes by withdrawal-to-availability ratios at watershed scales from databases like WaterGAP. This standard mandates goal-and-scope definition, inventory analysis, , and interpretation phases, ensuring comparability with broader LCA under ISO 14040/44, but critiques note its complexity limits adoption compared to simpler volumetric metrics. Hybrid approaches combine both, as in corporate reporting where volumetric benchmarks inform scarcity-adjusted sustainability thresholds. Empirical validations, such as global crop studies, confirm methodological consistency across regions, with total footprints for products like at 10,000 m³/ton (70% , 20% , 10% ) derived from harmonized datasets.

Historical Development

Origins and Early Conceptualization

The origins of the water footprint concept lie in the precursor notion of , coined by British geographer John Anthony Allan in 1993 to quantify the freshwater embedded in the production of commodities, especially agricultural exports from water-abundant regions to arid importers. Allan's framework explained how effectively transfers , allowing water-scarce nations in the to sustain without apparent hydrological limits, though this obscured underlying dependencies on distant supplies. Arjen Y. Hoekstra introduced the water footprint in 2002, extending virtual water analysis to encompass total freshwater consumption linked to end-use rather than mere production or trade flows. Working at the UNESCO-IHE Institute for Water Education in , , Hoekstra co-authored the foundational paper with P.Q. Hung, titled "Virtual water trade: A quantification of virtual water flows between nations in relation to international crop trade," which first applied the term to define a region's or individual's footprint as the sum of domestic water use in production plus net imports minus exports. This approach, published as a Value of Water Research Report, estimated that global flows from crop trade alone exceeded 1,000 billion cubic meters per year during 1995–1999, predominantly from water-rich exporters like the and to importers in and . The early conceptualization positioned the water footprint as a consumption-based metric, analogous to the but tailored to freshwater volumes, to expose hidden hydrological pressures from globalized supply chains and encourage policy shifts toward sustainable allocation. Hoekstra's emphasized volumetric accounting of green (rainwater), blue (surface and ), and later grey ( dilution) water components, though initial focus remained on aggregate trade impacts to highlight inefficiencies in water-intensive sectors like , which accounted for over 90% of embedded flows in early estimates. This laid groundwork for broader applications by revealing that affluent consumers in water-stressed importing nations indirectly drive elsewhere through demand for low-cost imports.

Key Organizations and Standardization

The Water Footprint Network (WFN), established in 2008 by a consortium including the World Business Council for , UNESCO-IHE Institute for Water Education, and other partners, has served as the primary organization advancing the water footprint concept globally. Building on Arjen Hoekstra's initial formulation of the metric in 2002, the WFN developed and published the Water Footprint Assessment Manual in 2011, which established standardized definitions, calculation methods, and guidelines for assessing , and water footprints across processes, products, and catchments. This manual emphasized volumetric accounting of freshwater use and , prioritizing benchmarks tied to local , and has been adopted as a foundational reference for corporate, governmental, and research applications. In parallel, the (ISO) formalized water footprint assessment through ISO 14046:2014, Environmental management — Water footprint — Principles, requirements and guidelines. Released in August 2014, this standard integrates water footprinting within (LCA) frameworks, requiring evaluation of water use impacts on availability, quality, and , while allowing standalone or comparative applications for products, processes, or organizations. Unlike the WFN's primary focus on consumption volumes, ISO 14046 incorporates impact pathways, such as deprivation potential, to address criticisms of volumetric metrics' limitations in capturing scarcity effects; however, proponents of the WFN approach argue it better supports decisions without diluting focus through aggregated impact weighting. These efforts reflect ongoing tensions in , with the WFN promoting supply-chain-wide volumetric tracking for and , while ISO aligns with broader environmental systems like ISO 14001. Additional collaborations, such as those under the CEO Water Mandate, have tested WFN methodologies in corporate contexts, reinforcing the 2011 Global Water Footprint Standard's role in practical implementation. Despite these advancements, no universal consensus exists, as evidenced by debates over integrating thresholds and ambient standards into grey water calculations.

Evolution and Integration with Other Frameworks

The water footprint concept originated in 2002, developed by Arjen Y. Hoekstra at the as a volumetric indicator of freshwater use analogous to the , emphasizing consumption-based rather than production-based accounting to capture indirect water demands in global supply chains. Hoekstra's early publications, such as those quantifying national water footprints for food products, laid the groundwork by distinguishing (rainwater), (surface and groundwater), and later (pollution dilution) components, enabling assessments of humanity's total appropriation of freshwater resources. By 2008, the establishment of the Water Footprint Network (WFN) marked a pivotal shift toward institutionalization, fostering collaboration among researchers, businesses, and policymakers to refine methodologies and promote global application. Standardization accelerated with the release of the WFN's Water Footprint Assessment Manual in , which provided a comprehensive framework for calculating, mapping, and evaluating water footprints at process, product, and national scales, including criteria based on local water availability and environmental flow requirements. This manual established the Global Water Footprint Standard, influencing subsequent empirical studies, such as the 2012 PNAS mapping of humanity's water footprint at high , which revealed that agricultural production accounts for 92% of global blue and water consumption. Post-2011 developments included refinements to address criticisms of oversimplification in volumetric measures, incorporating stress-weighted indicators to better reflect regional scarcity, as seen in updated WFN guidelines by 2019. Integration with other frameworks has positioned the water footprint as a complementary tool in broader analyses, particularly (LCA), where it supplies inventory data on water consumption volumes that LCA's phase then characterizes using methods like scarcity-adjusted factors under ISO 14046 standards. Unlike pure LCA, which prioritizes endpoint impacts on human health and ecosystems, the water footprint's strength lies in its spatially explicit, consumption-oriented volumetric tracking, enabling hybrid approaches—for instance, combining WF accounting with LCA's characterization models to evaluate or agricultural products' full water-related burdens. This synergy has been applied in integrated assessments, such as those aligning WF with for freshwater use or on clean water, where WF data informs probabilistic models of resource pressures under uncertainty. In corporate ESG reporting, WF metrics are embedded alongside carbon and ecological footprints to quantify risks, as evidenced by tools from organizations like the CEO Water Mandate adopting WFN standards for holistic resource efficiency evaluations.

Applications and Empirical Assessments

Agricultural and Product-Level Footprints

constitutes the dominant component of the global footprint, accounting for approximately 92% of total anthropogenic use embedded in products consumed worldwide. This share reflects the extensive evaporative losses and assimilation associated with cultivation and rearing, with consumptive use in reaching 99% of global totals when excluding non-consumptive industrial withdrawals. production alone drives the majority, with derived animal products amplifying footprints through feed requirements that constitute up to one-third of agricultural use. At the crop level, water footprints are calculated by integrating green water (rainfall evaporated or incorporated into biomass), blue water (surface and evaporation from ), and grey water (dilution volume for ). Global assessments reveal significant variation across commodities; for instance, cereal crops average 1,644 cubic meters per ton, with at 1,827 m³/ton and lower due to higher yields in rainfed systems. exhibits a higher footprint of about 3,400 m³/ton, predominantly green water in paddy fields, though blue water dominates in irrigated regions like . lint production averages 10,000 liters per kilogram globally, with 73% green water but substantial blue contributions in arid production areas such as and . Livestock products demonstrate amplified footprints owing to inefficient feed conversion. requires an average of 15,400 m³/ton, approximately 20 times the caloric footprint of cereals, as 98% of its water use embeds in feed crops like soy and . and footprints are lower at around 6,000 and 4,300 m³/ton, respectively, reflecting better feed efficiency. These values derive from process-based models accounting for regional yield, , and loads, highlighting how production intensification in water-scarce areas can elevate blue and grey components. Illustrative examples underscore the variability in product-level water footprints. One kilogram of beef requires approximately 15,000 liters, 1 kg of chocolate about 17,000 liters due to water-intensive cocoa cultivation in certain regions, and 1 kg of almonds around 16,000 liters owing to extensive irrigation needs, particularly in California. A 125 ml cup of coffee consumes roughly 140 liters, while 1 kg of cheese ranges from 3,200 to 5,000 liters. In comparison, 1 kg of tomatoes requires about 215 liters and 1 kg of bread 1,600 liters. These figures demonstrate the disproportionately high water use of animal products and certain luxury foods such as nuts and cocoa.
ProductAverage Water Footprint (m³/ton)Dominant Component
15,400Green (feed)
3,400
(lint)10,000
Cereals (avg.)1,644
Footprints at the product level further incorporate processing stages, such as milling for or ginning for , adding minor grey water from effluents. Variability is pronounced; for example, U.S. uses about 8,000 liters per kg versus higher figures in water-stressed regions, underscoring the of local and practices in footprint magnitude. Empirical from 1996–2005 baselines, updated through dynamic modeling, confirm agriculture's outsized , with six crops—, , , soy, , and —dominating unsustainable portions in scarcity-weighted assessments.

Industrial and Corporate Applications

Industrial water footprint assessments measure direct and indirect freshwater consumption in processes, including , incorporation into products, and dilution, to evaluate environmental impacts and guide improvements. These assessments identify consumption hotspots within operations and supply chains, facilitating targeted conservation strategies such as and process optimization. For instance, in production for EUR-pallets, water footprints vary by material, with showing lower blue water use compared to composites due to reduced needs. Corporations integrate water footprint analysis into and , often combining it with life cycle assessments to quantify impacts across product lifecycles. In the apparel sector, Guess?, Inc. developed a spatially explicit water footprint for blue jeans, revealing high consumption in cotton cultivation and dyeing stages, primarily in water-scarce regions like and . Textile firms in applied corporate water footprint methodologies to reduce per-unit blue water use by 26.3% to 171 tons per ton of product through efficiency measures. Pharmaceutical companies like GlaxoSmithKline (GSK) employ water footprint mapping to assess site-specific risks, collecting data on operational and water use to prioritize interventions in high-stress basins. Beverage giants such as have conducted pilot assessments for products like and juices, identifying embedded in ingredients and informing replenishment projects that restored over 100% of operational use by 2015. In the U.S., high-resolution footprints for over 500 manufacturing goods highlight sector variations, with chemicals and metals exhibiting elevated grey footprints from . These applications support in product development and , though they require validation against local availability to avoid overemphasizing volume over scarcity.

Consumer and National-Level Analyses

Consumer-level analyses quantify the water footprint arising from an individual's daily consumption of , encompassing both direct domestic use and the dominant virtual water embedded in food, clothing, and other products. The global average water footprint stands at 1,385 cubic meters annually, with variations driven primarily by dietary habits, such as higher and intake in wealthier nations elevating footprints through water-intensive production. , the footprint reaches 2,840 cubic meters per year, of which approximately 20% is external, sourced from water-scarce regions via imported commodities like soybeans and . Breakdowns reveal that food consumption accounts for over 90% of the average consumer's in many assessments, with a single of requiring around 15,000 liters of , compared to 300 liters for a of . Domestic direct use, such as showers and , constitutes a minor fraction—typically under 5%—averaging about 138 gallons per household member daily in the U.S., underscoring the outsized role of supply-chain embedded over household taps. Tools like personal calculators enable individuals to estimate based on self-reported habits, highlighting opportunities for reduction through shifts toward plant-based diets or local sourcing, though such analyses emphasize empirical consumption data over unsubstantiated behavioral assumptions. National-level analyses aggregate consumer footprints with government expenditures to derive total volumetric consumption by country, revealing patterns of internal production versus virtual water trade. For instance, Canada's national footprint is 2,049 cubic meters annually, reflecting substantial agricultural exports that embed domestic green water in global supply chains. In the U.S., high-resolution production footprint studies complement consumption metrics, showing industrial sectors like and energy contributing disproportionately to embedded , with total national consumption exceeding domestic availability in water-stressed basins. These assessments inform policies by quantifying how net importers, such as the , offset internal through footprints shifted to exporting nations like , where soybean cultivation for animal feed drives blue water depletion. Disparities persist, with footprints in water-abundant but consumption-heavy nations far outpacing those in subsistence economies, challenging narratives of uniform global without accounting for localized hydrological capacities.

Geographic and Sectoral Variations

Globally, the water footprint of humanity totals approximately 9,087 gigameters cubed per year, with agricultural production accounting for 92% of this volume, domestic water use for 6%, and industrial processes for 2%. Of the agricultural share, crop production constitutes the majority, while livestock contributes substantially within that sector, reflecting the high water intensity of feed crops and animal husbandry. These sectoral proportions arise from the virtual water embedded in food production, where evapotranspiration from rainfed (green water) and irrigated (blue water) fields dominates, alongside grey water from pollution dilution. Sectoral distributions vary by and resource endowment. In low-income countries, often exceeds 95% of national footprints due to subsistence farming and limited industrialization, whereas in high-income nations like the , the industrial and domestic shares rise modestly to around 5-10% each, though remains predominant at over 80%. For instance, in , agricultural footprints dominate at over 90%, driven by and cultivation, while in , industrial footprints are higher relative to total due to exports. These differences stem from production structures: export-oriented economies amplify sectoral footprints through trade, concentrating industrial loads in water-abundant regions. Geographically, total national water footprints correlate with population and economic output, with , , and the recording the largest volumes at 1,207, 1,182, and 1,053 gigameters cubed per year, respectively, primarily from agricultural activities within their borders. water footprints exhibit greater variation, averaging 1,385 cubic meters annually worldwide, but reaching over 2,000 in water-scarce yet import-dependent nations like the and , compared to under 600 in densely populated, low-consumption countries such as . Arid regions, including parts of the , show elevated blue water footprints due to reliance on , while temperate zones depend more on green water from rainfall. Intra-continental variations highlight causal factors like climate and policy. In , per capita footprints average below 1,000 cubic meters, constrained by low agricultural yields and minimal processing industries, whereas North America's exceed 2,000 due to high and consumption embedding distant . Water-scarce basins amplify effective footprints when adjusted for local availability, with and experiencing amplified impacts from trade imbalances. These patterns underscore that geographic footprints are not merely volumetric but influenced by trade flows, where net importers outsource agricultural burdens to water-rich exporters like and the . Empirical assessments from 1996-2005 data confirm these disparities persist, with ongoing shifts from dietary and technological changes potentially altering future distributions.

Water Scarcity and Resource Context

Relationship to Local Water Availability

The sustainability of a water footprint depends on its magnitude relative to local water availability, which encompasses renewable water resources (surface and runoff) minus allocations for environmental flows to maintain ecosystems. Local availability varies spatially and temporally due to patterns, runoff generation, and upstream influences, with water footprints posing the greatest risk of depletion in regions where demand exceeds replenishment rates. Green water footprints, derived from rainfall, generally align more closely with local regenerative capacity and exert less pressure on finite resources, whereas grey footprints reflect assimilation capacity for pollutants, which can impair availability if exceeding dilution thresholds. Blue water scarcity is quantified as the ratio of the total blue water footprint to blue water availability within a hydrological basin, where a ratio exceeding 1 indicates overuse relative to renewable supplies after environmental needs. For instance, in assessments of global river basins from 1996 to 2005, the blue water footprint constituted 38% of total blue water availability on average, but scarcity affected 2.02 billion people in basins experiencing at least one month of high scarcity annually, highlighting temporal mismatches between footprint demands and seasonal availability. In water-stressed nations like Egypt, national water footprints have been evaluated against per capita availability of approximately 580 cubic meters per year—well below the 1,000 cubic meters threshold for physical scarcity—revealing that agricultural sectors, accounting for over 80% of blue footprints, often surpass sustainable limits without trade offsets. Methodological frameworks, such as those from the Water Footprint Network, emphasize basin-scale analysis to avoid aggregating footprints across heterogeneous availability zones, as national or product-level volumes can mask localized depletions. Exceeding local availability contributes to overdraft, reduced baseflows, and degradation, with empirical studies showing that 62% of footprints in 2000 occurred in closures exceeding 40% of availability, amplifying risks in arid or semi-arid zones. embedded in exports from scarce regions can exacerbate domestic shortfalls unless imports replenish effective availability, underscoring the need for trade-informed policies grounded in basin-specific data rather than global averages.

Virtual Water Trade and Economic Realities

Virtual water trade refers to the implicit exchange of water embedded in internationally traded commodities, predominantly agricultural products such as and , where the production-phase water consumption is transferred from exporting to importing nations. This concept, formalized in quantitative terms by the Water Footprint Network, quantifies these flows to highlight how enables water-scarce countries to meet domestic needs without fully relying on limited local supplies, effectively water-intensive production to regions with greater availability or efficiency. In 1995–1999, global virtual water exports totaled approximately 1,180 billion cubic meters annually, with over 80% linked to and , underscoring agriculture's dominance in these dynamics. Economically, aligns with comparative advantages in production, allowing water-abundant exporters like the , , and —major gross virtual water suppliers—to generate from water-intensive exports while importers such as , , and access resources that would otherwise strain domestic capacities. For net importers facing , this mitigates insecurity and supports industrialization; for instance, Middle Eastern and North African (MENA) countries avert shortages by importing virtual water embedded in grains, preserving local water for higher-value uses amid . However, net exporters, often developing nations excluding , risk if exports exceed sustainable yields, as seen in cases where outflows renounce domestic water reserves without commensurate economic returns or pricing. In 2010, emerged as the largest net importer of scarce virtual water at 9.17 cubic kilometers, primarily from partners like the , illustrating how balances hydrological deficits but can foster dependency on volatile global markets. Challenges arise from market failures where virtual water flows do not internalize local scarcity costs, leading to inefficient global allocation; land productivity drives trade more than water efficiency, potentially exacerbating stress in exporting basins. Peer-reviewed analyses indicate that while trade reduces aggregate global water stress by reallocating production, it amplifies vulnerabilities in exporters with stressed aquifers, as unpriced externalities like groundwater overdraft undermine long-term viability. Policymakers in water-stressed importers benefit from diversified sourcing to hedge against supply disruptions, yet exporters must integrate water accounting into trade strategies to avoid environmental costs outweighing gains, as evidenced by optimization models prioritizing revenue alongside minimized water use in strategic crops. Overall, virtual water trade enhances economic resilience in scarcity-prone economies but demands hydrological-economic integration to prevent maladaptive patterns.

Environmental Flow Requirements

Environmental flow requirements (EFRs) represent the volume, timing, duration, and quality of flows essential to maintain the ecological of rivers, wetlands, and associated ecosystems, including support for and downstream human uses dependent on those systems. In footprint assessments, EFRs establish the threshold for sustainable blue use by deducting reserved environmental needs from total renewable blue , ensuring that human consumption—particularly the blue component of footprints—does not lead to ecological degradation or flow regime alterations. This integration prevents overestimation of available , as failure to account for EFRs can mask unsustainable abstractions in basin-scale evaluations. Estimation of EFRs employs diverse hydrological and ecological methods, ranging from simple heuristic approaches like the Tennant method (allocating 10-30% of mean annual flow for baseflows and higher percentages for floods) to sophisticated models such as DRIFT (Downstream Response to Imposed Flow Transformation), which simulates species-specific responses to flow changes. Globally, methods vary in stringency: the Smakhtin variable flow regime approach reserves 30-50% of natural flows on average, while richer datasets enable dynamic, monthly calibrations that capture intra-annual variability. Differences in these methods can reshape maps by 20-50%, with conservative estimates (e.g., reserving over 60% in pristine basins) identifying larger unsustainable footprints than minimalist ones. Within water footprint frameworks, EFRs are incorporated by computing blue water availability as total runoff minus EFRs, often disaggregated monthly to align with footprint inventories; sustainability is then assessed via the blue water scarcity index (BWS = blue footprint / available water post-EFRs), where BWS > 1 signals violation. For example, global analyses reveal that national consumption footprints infringe EFRs in arid regions, with unsustainable trade exacerbating deficits—such as in the Basin, where agricultural abstractions routinely exceed post-EFR availability by factors of 2-3 during dry seasons. Standardized protocols, like those for SDG 6.4.2, apply presumptive EFR minima (e.g., 25-40% of mean annual flow, adjusted for basin aridity), enabling cross-country comparisons while acknowledging data gaps in ungauged regions. Challenges in application include methodological inconsistencies and enforcement barriers, as presumptive standards may underestimate site-specific needs in biodiverse or regulated systems, potentially understating footprint impacts. Peer-reviewed critiques emphasize that ignoring EFR variability leads to optimistic sustainability claims, particularly for irrigation-dominated footprints, which comprise 70-80% of use and often prioritize economic output over ecological baselines. Rigorous inclusion of EFRs thus shifts focus from volumetric footprints to impact-oriented metrics, informing policies like basin caps where footprints must remain below 20-50% of post-EFR resources to avert long-term .

Criticisms and Methodological Challenges

Scientific and Empirical Limitations

The calculation of water footprints, particularly for agricultural products which dominate global assessments, depends heavily on modeled estimates of , volumes, and yields rather than direct field measurements, resulting in significant uncertainties that can propagate through the analysis. Sensitivity analyses for the basin, for instance, show that variations in reference ET (ET0) and crop coefficients can alter water use estimates by up to 20-30%, with data errors from station measurements adding further variability. These empirical challenges stem from the reliance on gridded climate datasets like CRU-TS, which incorporate inherent measurement errors and uncertainties, limiting the precision of and water components that constitute over 90% of most footprints. Early water footprint studies employed coarse country-average , disregarding sub-national in water availability and practices, which led to systematic overestimations; for example, initial content estimates for major crops in the United States, , and were revised downward by 10-50% upon adopting finer-resolution grids. Assumptions of full coverage in bottom-up approaches exacerbate this, as partial or deficit —common in water-scarce regions—is not adequately captured without site-specific , introducing errors that undermine footprint comparability across regions. Top-down aggregation methods, while simpler for national or global scales, obscure intensive subprocesses like application, potentially truncating inventories and underestimating total by excluding upstream water uses. The water footprint, intended to quantify assimilation, faces empirical limitations in defining acceptable dilution volumes due to inconsistent natural background concentrations and varying regulatory standards for like and ; calculations often simplify to maximum allowable concentrations without accounting for specific dynamics or treatment efficacy, rendering estimates sensitive to arbitrary thresholds. For instance, reliance on emission records without detailed leads to over- or under-dilution assumptions, with studies noting that components can vary by factors of 2-5 depending on chosen standards, limiting their utility for precise . This lack of pollutant-specific , compounded by sparse monitoring in developing regions, hinders empirical validation and risks conflating volume-based dilution with actual environmental harm. Overall methodological standardization remains absent, with divergent protocols for modeling—such as ISO 14046 versus Water Footprint Network guidelines—impeding cross-study comparisons and applications; access to high-quality, disaggregated data for industrial and supply chain footprints is particularly constrained, often relying on industry self-reports prone to incompleteness. These limitations collectively constrain the water footprint's role as a robust empirical tool, as uncertainties in key parameters can exceed 50% in scarcity-weighted variants, emphasizing the need for hybrid approaches integrating direct metering where feasible.

Misinterpretation of Impacts and Scarcity Weighting

Scarcity weighting in water footprint assessments adjusts volumetric water use (typically blue consumption) by a local factor, often defined as the ratio of water withdrawal to , to reflect potential environmental or societal impacts. This approach, proposed in frameworks like those from the Water Footprint Network and integrated into (LCA), multiplies the water footprint by a stress index—such as WS = W / A, where W is consumptive use and A is —to prioritize impacts in water-stressed basins. However, proponents argue it enhances relevance by differentiating benign use in abundant regions from harmful extraction in scarce ones, yet critics contend it introduces inconsistencies that obscure true impacts. A primary misinterpretation arises when scarcity-weighted footprints are equated with absolute sustainability thresholds, ignoring hydrological variability and total basin capacities. For instance, analyses of irrigated production reveal that scarcity-weighted metrics can assign lower impact scores to unsustainable practices exceeding local renewable limits than to sustainable ones in less-stressed areas, due to weighting formulas that undervalue absolute . This stems from reliance on static scarcity indices, which fail to incorporate dynamic factors like rates or inter-annual variability, leading to flawed rankings for applications such as product labeling or restrictions. Further distortions occur in conflating scarcity weighting with broader impact pathways, such as degradation or human deprivation, without causal linkage. Hoekstra critiques this in LCA contexts, noting that weighting volumetric footprints by confounds accounting with endpoint damages, potentially overstating impacts in marginally stressed areas while underplaying them where alternatives (e.g., or efficiency gains) exist but are unmodeled. Empirical tests across global supply chains show such metrics inconsistently correlate with observed outcomes, as they overlook substitution effects—e.g., shifting production to water-abundant regions might increase total global use without proportional gains. Defenders counter that misunderstandings arise from misapplying volumetric benchmarks to weighted scores, emphasizing the need for context-specific validation, yet acknowledge data limitations in mapping exacerbate interpretive errors. In practice, these issues manifest in policy missteps, where scarcity-weighted footprints inform consumer choices or regulations without verifying against local monitoring data, such as basin-level flow requirements. For example, trade analyses weighted by scarcity may discourage imports from efficient arid producers (e.g., Israel's drip-irrigated exports) in favor of less-efficient abundant ones, inverting net welfare gains from . Rigorous assessments thus require supplementing weighting with absolute sustainability benchmarks, like those from (e.g., <4,000 km³/year global blue water use), to mitigate overreliance on relative indices that can mask systemic overappropriation.

Economic and Policy Consequences

High water footprints in water-scarce regions contribute to economic losses through reduced and higher resource competition, with global projected to cause surplus losses varying by hydrologic basin under different and development scenarios. For instance, severe river pollution has been linked to downstream GDP growth reductions of 1.4% to 2.5% in affected regions, as degraded hampers industrial and agricultural output. Economic exacerbates these impacts by increasing per capita water demand, particularly via shifts to water-intensive diets and consumption patterns, amplifying overall freshwater use without proportional efficiency gains. International trade mitigates some economic pressures by enabling virtual water flows, reducing global agricultural water use by approximately 5% as water-abundant nations export crops to scarce ones, thereby alleviating for about 2.2 billion people in higher-income countries. However, this externalization can impose hidden costs on exporting nations, where unsustainable blue extraction—accounting for 52% of global consumption footprints—strains local economies through depleted resources and . In supply chains, optimizing for lower water footprints often involves trade-offs with production costs, as demonstrated in case studies where raw material sourcing adjustments reduce embedded but elevate expenses or shift burdens elsewhere. Policy responses leveraging water footprint assessments include setting national limits on consumption and to promote , with governments encouraged to integrate data into regulations for , industry, and to align with capacities. Many countries externalize footprints by importing water-intensive goods like virtual-water-embedded crops, preserving domestic supplies for higher-value uses, though this strategy risks dependency on volatile global markets. Trade policies informed by footprints aim to discourage exports from overstressed basins, but such measures can inadvertently boost off-farm impacts like from alternative production methods, underscoring the need for context-specific evaluations over uniform reductions. Emerging initiatives, including multiparty coalitions, seek to embed footprint considerations in international agreements to curb trade-related risks, prioritizing efficient allocation over absolute volume cuts.

Debates with Alternative Approaches

The water footprint (WF) methodology, which quantifies freshwater consumption and pollution in volumetric terms across green, blue, and grey components, has faced debates regarding its emphasis on absolute volumes over localized impacts, prompting comparisons with impact-oriented alternatives such as water use assessment within (LCA). Proponents of WF, including the Water Footprint Network framework established in 2008, argue that its volumetric approach enables comprehensive tracking of flows in global supply chains, facilitating efficiency improvements and trade policy insights without requiring complex impact modeling. In contrast, LCA-based water footprinting, standardized under ISO 14046 in 2014, prioritizes characterizing water consumption's potential harm—such as human or ecosystem water deprivation—by weighting volumes according to basin-specific scarcity indices, like those in the ReCiPe 2016 method or the AWARE (Available Water Remaining) model released in 2018. Critics of standalone WF contend that unweighted volumes obscure causal differences in water stress; for instance, green water () often dominates WF tallies (up to 74% globally) but exerts minimal scarcity pressure compared to blue water withdrawals in arid regions, potentially leading to inefficient if volumes alone guide decisions. This has spurred alternative scarcity-weighted metrics, such as those proposed in a 2009 revision to WF calculation, which separate consumptive uses and apply stress factors to avoid conflating low-impact rainwater with high-impact . Empirical comparisons, including case studies on and agricultural products conducted in 2016, demonstrate that while WF and LCA often align on hotspot identification—e.g., both flagging as a key driver—they diverge in prioritization when varies spatially, with LCA better capturing marginal impacts for product substitution choices. Further debates highlight tensions between WF's bottom-up, process-specific modeling and top-down input-output () approaches, the latter aggregating national economies to estimate footprints but introducing higher uncertainty from sectoral assumptions, as shown in a 2011 analysis where IO methods overestimated consumption by 20-50% relative to process-based WF for certain nations. Advocates for IO alternatives praise their scalability for at national scales, yet WF defenders note IO's neglect of firm-level efficiencies limits actionable insights. Integration efforts, such as combining WF with LCA's endpoint damage modeling, reveal complementary roles: WF excels in absolute appropriation metrics (e.g., 70% of global blue water footprints tied to exports per 2012 data), while LCA quantifies effects like from grey water more rigorously via fate and exposure factors rather than mere dilution volumes. These methodological variances underscore ongoing refinements, with no consensus on a singular superior approach, as volumetric WF risks overgeneralization absent context, yet impact alternatives may undervalue total systemic pressures in water-abundant settings.

Sustainability and Future Directions

Criteria for Sustainable Water Use

Sustainable water use requires that the aggregate water footprint—encompassing , , and components—does not exceed the of local freshwater resources, defined as the long-term average renewable supply minus allocations for environmental flows and basic human needs. For water (surface and ), this entails comparing the water footprint to available water after reserving environmental flow requirements, which typically constitute 20-80% of mean annual flow depending on sensitivity and hydrological context, to prevent degradation of aquatic habitats and . Exceeding these limits, as quantified by a water scarcity index greater than 1 (where footprint exceeds availability), indicates unsustainability, with global assessments showing that approximately 20% of the world's population lives in basins where water use already surpasses sustainable thresholds. Grey water footprints must adhere to ambient water quality standards, ensuring that the volume required to dilute pollutants to acceptable levels does not surpass the natural assimilation capacity of the water body, thereby avoiding , , and long-term . Green water footprints, primarily from , are sustainable when they remain below the available green water flow, which represents beyond needs, preventing soil degradation and loss of productive capacity in rain-dependent systems. Empirical benchmarks from catchment-level analyses emphasize site-specific thresholds, such as maintaining rates above extraction to avoid depletion, with data from overexploited regions like parts of and the demonstrating declines in water tables exceeding 1 meter per year when criteria are violated. Resource efficiency forms a core criterion, measured as water productivity (e.g., cubic meters of water per kilogram of product or per unit GDP), where sustainable practices achieve benchmarks like less than 1,000 m³/ton for irrigated crops through optimized irrigation and crop selection. Equitable allocation ensures that water footprints do not infringe on allocations for basic human consumption (typically 1,000 m³ per capita annually for , sanitation, and minimal hygiene) or disproportionate sectoral burdens, prioritizing uses that maximize societal value while minimizing waste. These criteria, derived from hydrological balances and ecological imperatives, enable identification of hotspots for intervention, though implementation requires localized data to account for variability in renewal rates, such as global per capita renewable resources averaging 6,000 m³/year but dropping below 1,000 m³/year in water-stressed areas.

Strategies for Footprint Reduction

Agriculture constitutes approximately 70% of global freshwater withdrawals, making it the primary target for water footprint reduction efforts. Empirical studies demonstrate that enhancing water productivity through deficit irrigation and optimized scheduling can decrease crop water footprints by 10-30% without substantial yield losses, as evidenced in and production systems where sensors guide application to match rates. Similarly, adopting no- irrigation techniques in paddy fields has been shown to lower water footprints from 1,409-1,706 L/kg to 1,224-1,289 L/kg by minimizing deep drainage losses, based on field experiments controlling below zones. Crop selection plays a causal role, with shifting to less water-intensive varieties or patterns—such as replacing thirsty crops like with legumes in water-scarce regions—reducing sectoral footprints by up to 20%, per modeling of optimized agricultural practices. In industrial contexts, process modifications emphasizing water recycling and reuse circuits have empirically cut footprints; for example, closed-loop systems in recycle up to 90% of process water, averting grey water pollution from dyes and reducing total footprints by 40-60% in case studies from high-consumption facilities. against sector-specific standards, as promoted by organizations tracking , enables targeted reductions, with industries achieving 15-25% savings through audits identifying leaks and inefficiencies. Consumer-level strategies focus on virtual water embedded in products, where dietary shifts yield measurable impacts. Meta-analyses of global diets indicate that transitioning to plant-based or Mediterranean patterns decreases agricultural water use by 20-50%, primarily by curtailing consumption, which requires 15,000 L/kg compared to 300 L/kg for cereals, without altering blue water allocations significantly. Reducing food waste, which accounts for 25% of food-related footprints, and prioritizing local, seasonal produce further amplify savings, as transportation and storage inefficiencies compound embedded water. These approaches, grounded in lifecycle assessments, prioritize high-impact levers over marginal household conservation like shorter showers, which affect direct use but negligible virtual components.

Innovations and Recent Developments

In recent years, advancements in water footprint assessment tools have facilitated more granular analysis for businesses and policymakers. The Water Footprint Implementation organization released an updated version of its Water Footprint Assessment Tool, enabling users to map and analyze supply chains, business operations, and water use across countries, river basins, and products, with integration of academically grounded data for environmental, social, and governance (ESG) reporting and alignment with frameworks like the Taskforce on Nature-related Financial Disclosures (TNFD). This tool supports targeted strategies by quantifying direct and indirect water consumption, moving beyond aggregate estimates to operational-level insights. Methodological innovations have emphasized hybrid approaches to address limitations in isolated volumetric or impact-based metrics. A 2025 interdisciplinary analysis highlighted the complementary roles of water footprint assessment (WFA), which excels in evaluating freshwater appropriation, efficiency, , and total loads, and (LCA), which quantifies downstream human and impacts from water use; their integration aids decisions in , supply chains, and basin management without supplanting either method. Similarly, regionalized indicators combining water and —such as the Water Biodiversity Footprint for toxic and impacts on ecosystems and the Water Resource Footprint for resource competition—have been developed to harmonize volumetric tracking with sustainability thresholds, revealing in a 2010 case study that 15% of water demand faced stress primarily from and pesticides, with 5% of areas exceeding ecological limits. Emerging applications incorporate digital technologies for dynamic monitoring and prediction. Research published in July 2025 demonstrated IoT-driven models to compare water footprints of intensive crops (e.g., ) versus efficient alternatives (e.g., millets), informing conservation policies by simulating scenarios and optimizing allocation under , with potential reductions tied to from sensors. These developments reflect a broader shift toward regional, data-integrated assessments, as noted in a February 2025 review, prioritizing localized strategies over global averages to enhance precision in sectors like where footprints dominate global totals.

References

Add your contribution
Related Hubs
User Avatar
No comments yet.