Recent from talks
Nothing was collected or created yet.
Multivariate normal distribution
View on Wikipedia| Multivariate normal | |||
|---|---|---|---|
|
Probability density function Many sample points from a multivariate normal distribution with and , shown along with the 3-sigma ellipse, the two marginal distributions, and the two 1-d histograms. | |||
| Notation | |||
| Parameters |
μ ∈ Rk — location Σ ∈ Rk × k — covariance (positive semi-definite matrix) | ||
| Support | x ∈ μ + span(Σ) ⊆ Rk | ||
|
exists only when Σ is positive-definite | |||
| Mean | μ | ||
| Mode | μ | ||
| Variance | Σ | ||
| Entropy | |||
| MGF | |||
| CF | |||
| Kullback–Leibler divergence | See § Kullback–Leibler divergence | ||
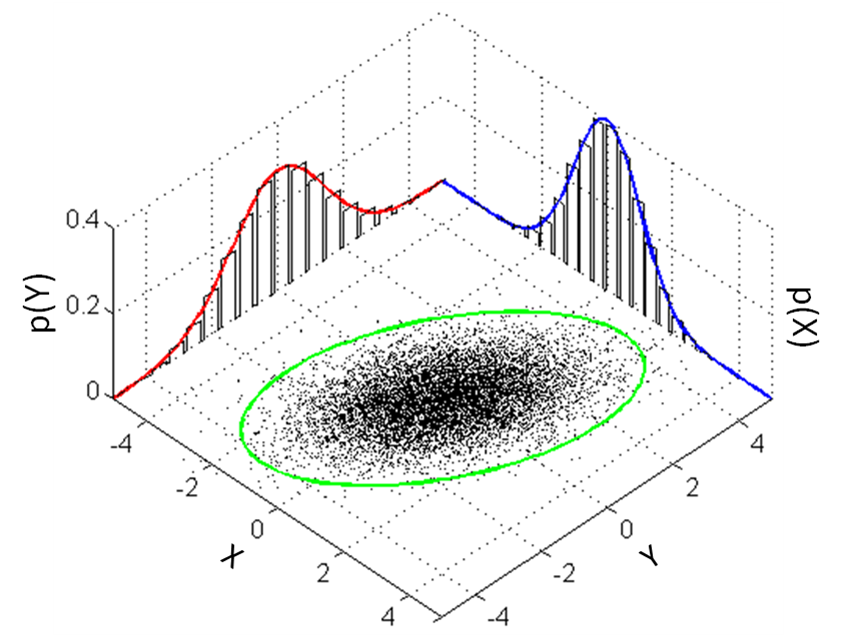
In probability theory and statistics, the multivariate normal distribution, multivariate Gaussian distribution, or joint normal distribution is a generalization of the one-dimensional (univariate) normal distribution to higher dimensions. One definition is that a random vector is said to be k-variate normally distributed if every linear combination of its k components has a univariate normal distribution. Its importance derives mainly from the multivariate central limit theorem. The multivariate normal distribution is often used to describe, at least approximately, any set of (possibly) correlated real-valued random variables, each of which clusters around a mean value.
Definitions
[edit]Notation and parametrization
[edit]The multivariate normal distribution of a k-dimensional random vector can be written in the following notation:
or to make it explicitly known that is k-dimensional,
with k-dimensional mean vector
such that and . The inverse of the covariance matrix is called the precision matrix, denoted by .
Standard normal random vector
[edit]A real random vector is called a standard normal random vector if all of its components are independent and each is a zero-mean unit-variance normally distributed random variable, i.e. if for all .[1]: p. 454
Centered normal random vector
[edit]A real random vector is called a centered normal random vector if there exists a matrix such that has the same distribution as where is a standard normal random vector with components.[1]: p. 454
Normal random vector
[edit]A real random vector is called a normal random vector if there exists a random -vector , which is a standard normal random vector, a -vector , and a matrix , such that .[2]: p. 454 [1]: p. 455
Formally:
Here the covariance matrix is .
In the degenerate case where the covariance matrix is singular, the corresponding distribution has no density; see the section below for details. This case arises frequently in statistics; for example, in the distribution of the vector of residuals in the ordinary least squares regression. The are in general not independent; they can be seen as the result of applying the matrix to a collection of independent Gaussian variables .
Equivalent definitions
[edit]The following definitions are equivalent to the definition given above. A random vector has a multivariate normal distribution if it satisfies one of the following equivalent conditions.
- Every linear combination of its components is normally distributed. That is, for any constant vector , the random variable has a univariate normal distribution, where a univariate normal distribution with zero variance is a point mass on its mean.
- There is a k-vector and a symmetric, positive semidefinite matrix , such that the characteristic function of is
The spherical normal distribution can be characterised as the unique distribution where components are independent in any orthogonal coordinate system.[3][4]
Density function
[edit]
Non-degenerate case
[edit]The multivariate normal distribution is said to be "non-degenerate" when the symmetric covariance matrix is positive definite. In this case the distribution has density[5]
where is a real k-dimensional column vector and is the determinant of , also known as the generalized variance. The equation above reduces to that of the univariate normal distribution if is a matrix (i.e., a single real number).
The circularly symmetric version of the complex normal distribution has a slightly different form.
Each iso-density locus — the locus of points in k-dimensional space each of which gives the same particular value of the density — is an ellipse or its higher-dimensional generalization; hence the multivariate normal is a special case of the elliptical distributions.
The quantity is known as the Mahalanobis distance, which represents the distance of the test point from the mean . The squared Mahalanobis distance is decomposed into a sum of k terms, each term being a product of three meaningful components.[6] Note that in the case when , the distribution reduces to a univariate normal distribution and the Mahalanobis distance reduces to the absolute value of the standard score. See also Interval below.
Bivariate case
[edit]In the 2-dimensional nonsingular case (), the probability density function of a vector is: where is the correlation between and and where and . In this case,
In the bivariate case, the first equivalent condition for multivariate reconstruction of normality can be made less restrictive as it is sufficient to verify that a countably infinite set of distinct linear combinations of and are normal in order to conclude that the vector of is bivariate normal.[7]
The bivariate iso-density loci plotted in the -plane are ellipses, whose principal axes are defined by the eigenvectors of the covariance matrix (the major and minor semidiameters of the ellipse equal the square-root of the ordered eigenvalues).

As the absolute value of the correlation parameter increases, these loci are squeezed toward the following line :
This is because this expression, with (where sgn is the sign function) replaced by , is the best linear unbiased prediction of given a value of .[8]
Degenerate case
[edit]If the covariance matrix is not full rank, then the multivariate normal distribution is degenerate and does not have a density. More precisely, it does not have a density with respect to k-dimensional Lebesgue measure (which is the usual measure assumed in calculus-level probability courses). Only random vectors whose distributions are absolutely continuous with respect to a measure are said to have densities (with respect to that measure). To talk about densities but avoid dealing with measure-theoretic complications it can be simpler to restrict attention to a subset of of the coordinates of such that the covariance matrix for this subset is positive definite; then the other coordinates may be thought of as an affine function of these selected coordinates.[9]
To talk about densities meaningfully in singular cases, then, we must select a different base measure. Using the disintegration theorem we can define a restriction of Lebesgue measure to the -dimensional affine subspace of where the Gaussian distribution is supported, i.e. . With respect to this measure the distribution has the density of the following motif:
where is the generalized inverse and is the pseudo-determinant.[10]
Cumulative distribution function
[edit]The notion of cumulative distribution function (cdf) in dimension 1 can be extended in two ways to the multidimensional case, based on rectangular and ellipsoidal regions.
The first way is to define the cdf of a random vector as the probability that all components of are less than or equal to the corresponding values in the vector :[11]
Though there is no closed form for , there are a number of algorithms that estimate it numerically.[11][12]
Another way is to define the cdf as the probability that a sample lies inside the ellipsoid determined by its Mahalanobis distance from the Gaussian, a direct generalization of the standard deviation.[13] In order to compute the values of this function, closed analytic formula exist,[13] as follows.
Interval
[edit]The interval for the multivariate normal distribution yields a region consisting of those vectors x satisfying
Here is a -dimensional vector, is the known -dimensional mean vector, is the known covariance matrix and is the quantile function for probability of the chi-squared distribution with degrees of freedom.[14] When the expression defines the interior of an ellipse and the chi-squared distribution simplifies to an exponential distribution with mean equal to two (rate equal to half).
Complementary cumulative distribution function (tail distribution)
[edit]The complementary cumulative distribution function (ccdf) or the tail distribution is defined as . When , then the ccdf can be written as a probability the maximum of dependent Gaussian variables:[15]
While no simple closed formula exists for computing the ccdf, the maximum of dependent Gaussian variables can be estimated accurately via the Monte Carlo method.[15][16]
Properties
[edit]Probability in different domains
[edit]
The probability content of the multivariate normal in a quadratic domain defined by (where is a matrix, is a vector, and is a scalar), which is relevant for Bayesian classification/decision theory using Gaussian discriminant analysis, is given by the generalized chi-squared distribution.[17] The probability content within any general domain defined by (where is a general function) can be computed using the numerical method of ray-tracing [17] (Matlab code).
Higher moments
[edit]The kth-order moments of x are given by
where r1 + r2 + ⋯ + rN = k.
The kth-order central moments are as follows
- If k is odd, μ1, ..., N(x − μ) = 0.
- If k is even with k = 2λ, then[ambiguous]
where the sum is taken over all allocations of the set into λ (unordered) pairs. That is, for a kth (= 2λ = 6) central moment, one sums the products of λ = 3 covariances (the expected value μ is taken to be 0 in the interests of parsimony):
This yields terms in the sum (15 in the above case), each being the product of λ (in this case 3) covariances. For fourth order moments (four variables) there are three terms. For sixth-order moments there are 3 × 5 = 15 terms, and for eighth-order moments there are 3 × 5 × 7 = 105 terms.
The covariances are then determined by replacing the terms of the list by the corresponding terms of the list consisting of r1 ones, then r2 twos, etc.. To illustrate this, examine the following 4th-order central moment case:
where is the covariance of Xi and Xj. With the above method one first finds the general case for a kth moment with k different X variables, , and then one simplifies this accordingly. For example, for , one lets Xi = Xj and one uses the fact that .
Functions of a normal vector
[edit]
A quadratic form of a normal vector , (where is a matrix, is a vector, and is a scalar), is a generalized chi-squared variable.[17] The direction of a normal vector follows a projected normal distribution.[18]
If is a general scalar-valued function of a normal vector, its probability density function, cumulative distribution function, and inverse cumulative distribution function can be computed with the numerical method of ray-tracing (Matlab code).[17]
Likelihood function
[edit]If the mean and covariance matrix are known, the log likelihood of an observed vector is simply the log of the probability density function:
- ,
The circularly symmetric version of the noncentral complex case, where is a vector of complex numbers, would be
i.e. with the conjugate transpose (indicated by ) replacing the normal transpose (indicated by ). This is slightly different than in the real case, because the circularly symmetric version of the complex normal distribution has a slightly different form for the normalization constant.
A similar notation is used for multiple linear regression.[19]
Since the log likelihood of a normal vector is a quadratic form of the normal vector, it is distributed as a generalized chi-squared variable.[17]
Differential entropy
[edit]The differential entropy of the multivariate normal distribution is[20]
where the bars denote the matrix determinant, k is the dimensionality of the vector space, and the result has units of nats.
Kullback–Leibler divergence
[edit]The Kullback–Leibler divergence from to , for non-singular matrices Σ1 and Σ0, is:[21]
where denotes the matrix determinant, is the trace, is the natural logarithm and is the dimension of the vector space.
The logarithm must be taken to base e since the two terms following the logarithm are themselves base-e logarithms of expressions that are either factors of the density function or otherwise arise naturally. The equation therefore gives a result measured in nats. Dividing the entire expression above by loge 2 yields the divergence in bits.
When ,
Mutual information
[edit]The mutual information of two multivariate normal distribution is a special case of the Kullback–Leibler divergence in which is the full dimensional multivariate distribution and is the product of the and dimensional marginal distributions and , such that . The mutual information between and is given by:[22]
where
If is product of one-dimensional normal distributions, then in the notation of the Kullback–Leibler divergence section of this article, is a diagonal matrix with the diagonal entries of , and . The resulting formula for mutual information is:
where is the correlation matrix constructed from .[23]
In the bivariate case the expression for the mutual information is:
Joint normality
[edit]Normally distributed and independent
[edit]If and are normally distributed and independent, this implies they are "jointly normally distributed", i.e., the pair must have multivariate normal distribution. However, a pair of jointly normally distributed variables need not be independent (would only be so if uncorrelated, ).
Two normally distributed random variables need not be jointly bivariate normal
[edit]The fact that two random variables and both have a normal distribution does not imply that the pair has a joint normal distribution. A simple example is one in which X has a normal distribution with expected value 0 and variance 1, and if and if , where . There are similar counterexamples for more than two random variables. In general, they sum to a mixture model.[citation needed]
Correlations and independence
[edit]In general, random variables may be uncorrelated but statistically dependent. But if a random vector has a multivariate normal distribution then any two or more of its components that are uncorrelated are independent. This implies that any two or more of its components that are pairwise independent are independent. But, as pointed out just above, it is not true that two random variables that are (separately, marginally) normally distributed and uncorrelated are independent.
Conditional distributions
[edit]If N-dimensional x is partitioned as follows
and accordingly μ and Σ are partitioned as follows
then the distribution of x1 conditional on x2 = a is multivariate normal[24] (x1 | x2 = a) ~ N(μ, Σ) where
and covariance matrix
Here is the generalized inverse of . The matrix is the Schur complement of Σ22 in Σ. That is, the equation above is equivalent to inverting the overall covariance matrix, dropping the rows and columns corresponding to the variables being conditioned upon, and inverting back to get the conditional covariance matrix.
Note that knowing that x2 = a alters the variance, though the new variance does not depend on the specific value of a; perhaps more surprisingly, the mean is shifted by ; compare this with the situation of not knowing the value of a, in which case x1 would have distribution .
An interesting fact derived in order to prove this result, is that the random vectors and are independent.
The matrix Σ12Σ22−1 is known as the matrix of regression coefficients.
Bivariate case
[edit]In the bivariate case where x is partitioned into and , the conditional distribution of given is[26]
where is the correlation coefficient between and .
Bivariate conditional expectation
[edit]In the general case
[edit]The conditional expectation of X1 given X2 is:
Proof: the result is obtained by taking the expectation of the conditional distribution above.
In the centered case with unit variances
[edit]The conditional expectation of X1 given X2 is
and the conditional variance is
thus the conditional variance does not depend on x2.
The conditional expectation of X1 given that X2 is smaller/bigger than z is:[27]: 367
where the final ratio here is called the inverse Mills ratio.
Proof: the last two results are obtained using the result , so that
- and then using the properties of the expectation of a truncated normal distribution.
Marginal distributions
[edit]To obtain the marginal distribution over a subset of multivariate normal random variables, one only needs to drop the irrelevant variables (the variables that one wants to marginalize out) from the mean vector and the covariance matrix. The proof for this follows from the definitions of multivariate normal distributions and linear algebra.[28]
Example
Let X = [X1, X2, X3] be multivariate normal random variables with mean vector μ = [μ1, μ2, μ3] and covariance matrix Σ (standard parametrization for multivariate normal distributions). Then the joint distribution of X′ = [X1, X3] is multivariate normal with mean vector μ′ = [μ1, μ3] and covariance matrix .
Affine transformation
[edit]If Y = c + BX is an affine transformation of where c is an vector of constants and B is a constant matrix, then Y has a multivariate normal distribution with expected value c + Bμ and variance BΣBT i.e., . In particular, any subset of the Xi has a marginal distribution that is also multivariate normal. To see this, consider the following example: to extract the subset (X1, X2, X4)T, use
which extracts the desired elements directly.
Another corollary is that the distribution of Z = b · X, where b is a constant vector with the same number of elements as X and the dot indicates the dot product, is univariate Gaussian with . This result follows by using
Observe how the positive-definiteness of Σ implies that the variance of the dot product must be positive.
An affine transformation of X such as 2X is not the same as the sum of two independent realisations of X.
Geometric interpretation
[edit]The equidensity contours of a non-singular multivariate normal distribution are ellipsoids (i.e. affine transformations of hyperspheres) centered at the mean.[29] Hence the multivariate normal distribution is an example of the class of elliptical distributions. The directions of the principal axes of the ellipsoids are given by the eigenvectors of the covariance matrix . The squared relative lengths of the principal axes are given by the corresponding eigenvalues.
If Σ = UΛUT = UΛ1/2(UΛ1/2)T is an eigendecomposition where the columns of U are unit eigenvectors and Λ is a diagonal matrix of the eigenvalues, then we have
Moreover, U can be chosen to be a rotation matrix, as inverting an axis does not have any effect on N(0, Λ), but inverting a column changes the sign of U's determinant. The distribution N(μ, Σ) is in effect N(0, I) scaled by Λ1/2, rotated by U and translated by μ.
Conversely, any choice of μ, full rank matrix U, and positive diagonal entries Λi yields a non-singular multivariate normal distribution. If any Λi is zero and U is square, the resulting covariance matrix UΛUT is singular. Geometrically this means that every contour ellipsoid is infinitely thin and has zero volume in n-dimensional space, as at least one of the principal axes has length of zero; this is the degenerate case.
"The radius around the true mean in a bivariate normal random variable, re-written in polar coordinates (radius and angle), follows a Hoyt distribution."[30]
In one dimension the probability of finding a sample of the normal distribution in the interval is approximately 68.27%, but in higher dimensions the probability of finding a sample in the region of the standard deviation ellipse is lower.[31]
| Dimensionality | Probability |
|---|---|
| 1 | 0.6827 |
| 2 | 0.3935 |
| 3 | 0.1987 |
| 4 | 0.0902 |
| 5 | 0.0374 |
| 6 | 0.0144 |
| 7 | 0.0052 |
| 8 | 0.0018 |
| 9 | 0.0006 |
| 10 | 0.0002 |
Statistical inference
[edit]Parameter estimation
[edit]The derivation of the maximum-likelihood estimator of the covariance matrix of a multivariate normal distribution is straightforward.
In short, the probability density function (pdf) of a multivariate normal is
and the ML estimator of the covariance matrix from a sample of n observations is [32]
which is simply the sample covariance matrix. This is a biased estimator whose expectation is
An unbiased sample covariance is
- (matrix form; is the identity matrix, J is a matrix of ones; the term in parentheses is thus the centering matrix)
The Fisher information matrix for estimating the parameters of a multivariate normal distribution has a closed form expression. This can be used, for example, to compute the Cramér–Rao bound for parameter estimation in this setting. See Fisher information for more details.
Bayesian inference
[edit]In Bayesian statistics, the conjugate prior of the mean vector is another multivariate normal distribution, and the conjugate prior of the covariance matrix is an inverse-Wishart distribution . Suppose then that n observations have been made
and that a conjugate prior has been assigned, where
where
and
Then[32]
where
Multivariate normality tests
[edit]Multivariate normality tests check a given set of data for similarity to the multivariate normal distribution. The null hypothesis is that the data set is similar to the normal distribution, therefore a sufficiently small p-value indicates non-normal data. Multivariate normality tests include the Cox–Small test[33] and Smith and Jain's adaptation[34] of the Friedman–Rafsky test created by Larry Rafsky and Jerome Friedman.[35]
Mardia's test
[edit]Mardia's test[36] is based on multivariate extensions of skewness and kurtosis measures. For a sample {x1, ..., xn} of k-dimensional vectors we compute
Under the null hypothesis of multivariate normality, the statistic A will have approximately a chi-squared distribution with 1/6⋅k(k + 1)(k + 2) degrees of freedom, and B will be approximately standard normal N(0,1).
Mardia's kurtosis statistic is skewed and converges very slowly to the limiting normal distribution. For medium size samples , the parameters of the asymptotic distribution of the kurtosis statistic are modified[37] For small sample tests () empirical critical values are used. Tables of critical values for both statistics are given by Rencher[38] for k = 2, 3, 4.
Mardia's tests are affine invariant but not consistent. For example, the multivariate skewness test is not consistent against symmetric non-normal alternatives.[39]
BHEP test
[edit]The BHEP test[40] computes the norm of the difference between the empirical characteristic function and the theoretical characteristic function of the normal distribution. Calculation of the norm is performed in the L2(μ) space of square-integrable functions with respect to the Gaussian weighting function . The test statistic is
The limiting distribution of this test statistic is a weighted sum of chi-squared random variables.[40]
A detailed survey of these and other test procedures is available.[41]
Classification into multivariate normal classes
[edit]
Gaussian Discriminant Analysis
[edit]Suppose that observations (which are vectors) are presumed to come from one of several multivariate normal distributions, with known means and covariances. Then any given observation can be assigned to the distribution from which it has the highest probability of arising. This classification procedure is called Gaussian discriminant analysis. The classification performance, i.e. probabilities of the different classification outcomes, and the overall classification error, can be computed by the numerical method of ray-tracing [17] (Matlab code).
Computational methods
[edit]Drawing values from the distribution
[edit]A widely used method for drawing (sampling) a random vector x from the N-dimensional multivariate normal distribution with mean vector μ and covariance matrix Σ works as follows:[42]
- Find any real matrix A such that AAT = Σ. When Σ is positive-definite, the Cholesky decomposition is typically used because it is widely available, computationally efficient, and well known. If a rank-revealing (pivoted) Cholesky decomposition such as LAPACK's dpstrf() is available, it can be used in the general positive-semidefinite case as well. A slower general alternative is to use the matrix A = UΛ1/2 obtained from a spectral decomposition Σ = UΛU−1 of Σ.
- Let z = (z1, ..., zN)T be a vector whose components are N independent standard normal variates (which can be generated, for example, by using the Box–Muller transform).
- Let x be μ + Az. This has the desired distribution due to the affine transformation property.
See also
[edit]- Chi distribution, the pdf of the 2-norm (Euclidean norm or vector length) of a multivariate normally distributed vector (uncorrelated and zero centered).
- Rayleigh distribution, the pdf of the vector length of a bivariate normally distributed vector (uncorrelated and zero centered)
- Rice distribution, the pdf of the vector length of a bivariate normally distributed vector (uncorrelated and non-centered)
- Hoyt distribution, the pdf of the vector length of a bivariate normally distributed vector (correlated and centered)
- Complex normal distribution, an application of bivariate normal distribution
- Copula, for the definition of the Gaussian or normal copula model.
- Multivariate t-distribution, which is another widely used spherically symmetric multivariate distribution.
- Multivariate stable distribution extension of the multivariate normal distribution, when the index (exponent in the characteristic function) is between zero and two.
- Mahalanobis distance
- Wishart distribution
- Matrix normal distribution
References
[edit]- ^ a b c Lapidoth, Amos (2009). A Foundation in Digital Communication. Cambridge University Press. ISBN 978-0-521-19395-5.
- ^ Gut, Allan (2009). An Intermediate Course in Probability. Springer. ISBN 978-1-441-90161-3.
- ^ Kac, M. (1939). "On a characterization of the normal distribution". American Journal of Mathematics. 61 (3): 726–728. doi:10.2307/2371328. JSTOR 2371328.
- ^ Sinz, Fabian; Gerwinn, Sebastian; Bethge, Matthias (2009). "Characterization of the p-generalized normal distribution". Journal of Multivariate Analysis. 100 (5): 817–820. doi:10.1016/j.jmva.2008.07.006.
- ^ Simon J.D. Prince(June 2012). Computer Vision: Models, Learning, and Inference Archived 2020-10-28 at the Wayback Machine. Cambridge University Press. 3.7:"Multivariate normal distribution".
- ^ Kim, M. G. (2000). "Multivariate outliers and decompositions of Mahalanobis distance". Communications in Statistics – Theory and Methods. 29 (7): 1511–1526. doi:10.1080/03610920008832559.
- ^ Hamedani, G. G.; Tata, M. N. (1975). "On the determination of the bivariate normal distribution from distributions of linear combinations of the variables". The American Mathematical Monthly. 82 (9): 913–915. doi:10.2307/2318494. JSTOR 2318494.
- ^ Wyatt, John (November 26, 2008). "Linear least mean-squared error estimation" (PDF). Lecture notes course on applied probability. Archived from the original (PDF) on October 10, 2015. Retrieved 23 January 2012.
- ^ "linear algebra - Mapping between affine coordinate function". Mathematics Stack Exchange. Retrieved 2022-06-24.
- ^ Rao, C. R. (1973). Linear Statistical Inference and Its Applications. New York: Wiley. pp. 527–528. ISBN 0-471-70823-2.
- ^ a b Botev, Z. I. (2016). "The normal law under linear restrictions: simulation and estimation via minimax tilting". Journal of the Royal Statistical Society, Series B. 79: 125–148. arXiv:1603.04166. Bibcode:2016arXiv160304166B. doi:10.1111/rssb.12162. S2CID 88515228.
- ^ Genz, Alan (2009). Computation of Multivariate Normal and t Probabilities. Springer. ISBN 978-3-642-01689-9.
- ^ a b Bensimhoun Michael, N-Dimensional Cumulative Function, And Other Useful Facts About Gaussians and Normal Densities (2006)
- ^ Siotani, Minoru (1964). "Tolerance regions for a multivariate normal population" (PDF). Annals of the Institute of Statistical Mathematics. 16 (1): 135–153. doi:10.1007/BF02868568. S2CID 123269490.
- ^ a b Botev, Z. I.; Mandjes, M.; Ridder, A. (6–9 December 2015). "Tail distribution of the maximum of correlated Gaussian random variables". 2015 Winter Simulation Conference (WSC). Huntington Beach, Calif., USA: IEEE. pp. 633–642. doi:10.1109/WSC.2015.7408202. hdl:10419/130486. ISBN 978-1-4673-9743-8.
- ^ Adler, R. J.; Blanchet, J.; Liu, J. (7–10 Dec 2008). "Efficient simulation for tail probabilities of Gaussian random fields". 2008 Winter Simulation Conference (WSC). Miami, Fla., USA: IEEE. pp. 328–336. doi:10.1109/WSC.2008.4736085. ISBN 978-1-4244-2707-9.
- ^ a b c d e f g h i Das, Abhranil; Wilson S Geisler (2020). "Methods to integrate multinormals and compute classification measures". arXiv:2012.14331 [stat.ML].
- ^ Hernandez-Stumpfhauser, Daniel; Breidt, F. Jay; van der Woerd, Mark J. (2017). "The General Projected Normal Distribution of Arbitrary Dimension: Modeling and Bayesian Inference". Bayesian Analysis. 12 (1): 113–133. doi:10.1214/15-BA989.
- ^ Tong, T. (2010) Multiple Linear Regression : MLE and Its Distributional Results Archived 2013-06-16 at WebCite, Lecture Notes
- ^ Gokhale, DV; Ahmed, NA; Res, BC; Piscataway, NJ (May 1989). "Entropy Expressions and Their Estimators for Multivariate Distributions". IEEE Transactions on Information Theory. 35 (3): 688–692. doi:10.1109/18.30996.
- ^ Duchi, J. Derivations for Linear Algebra and Optimization (PDF) (Thesis). p. 13. Archived from the original (PDF) on 2020-07-25. Retrieved 2020-08-12.
- ^ Proof: Mutual information of the multivariate normal distribution
- ^ MacKay, David J. C. (2003-10-06). Information Theory, Inference and Learning Algorithms (Illustrated ed.). Cambridge: Cambridge University Press. ISBN 978-0-521-64298-9.
- ^ Holt, W.; Nguyen, D. (2023). Essential Aspects of Bayesian Data Imputation (Thesis). SSRN 4494314.
- ^ Eaton, Morris L. (1983). Multivariate Statistics: a Vector Space Approach. John Wiley and Sons. pp. 116–117. ISBN 978-0-471-02776-8.
- ^ Jensen, J (2000). Statistics for Petroleum Engineers and Geoscientists. Amsterdam: Elsevier. p. 207. ISBN 0-444-50552-0.
- ^ Maddala, G. S. (1983). Limited Dependent and Qualitative Variables in Econometrics. Cambridge University Press. ISBN 0-521-33825-5.
- ^ An algebraic computation of the marginal distribution is shown here http://fourier.eng.hmc.edu/e161/lectures/gaussianprocess/node7.html Archived 2010-01-17 at the Wayback Machine. A much shorter proof is outlined here https://math.stackexchange.com/a/3832137
- ^ Nikolaus Hansen (2016). "The CMA Evolution Strategy: A Tutorial" (PDF). arXiv:1604.00772. Bibcode:2016arXiv160400772H. Archived from the original (PDF) on 2010-03-31. Retrieved 2012-01-07.
- ^ Daniel Wollschlaeger. "The Hoyt Distribution (Documentation for R package 'shotGroups' version 0.6.2)".[permanent dead link]
- ^ Wang, Bin; Shi, Wenzhong; Miao, Zelang (2015-03-13). Rocchini, Duccio (ed.). "Confidence Analysis of Standard Deviational Ellipse and Its Extension into Higher Dimensional Euclidean Space". PLOS ONE. 10 (3) e0118537. Bibcode:2015PLoSO..1018537W. doi:10.1371/journal.pone.0118537. ISSN 1932-6203. PMC 4358977. PMID 25769048.
- ^ a b Holt, W.; Nguyen, D. (2023). Introduction to Bayesian Data Imputation (Thesis). SSRN 4494314.
- ^ Cox, D. R.; Small, N. J. H. (1978). "Testing multivariate normality". Biometrika. 65 (2): 263. doi:10.1093/biomet/65.2.263.
- ^ Smith, S. P.; Jain, A. K. (1988). "A test to determine the multivariate normality of a data set". IEEE Transactions on Pattern Analysis and Machine Intelligence. 10 (5): 757. doi:10.1109/34.6789.
- ^ Friedman, J. H.; Rafsky, L. C. (1979). "Multivariate Generalizations of the Wald–Wolfowitz and Smirnov Two-Sample Tests". The Annals of Statistics. 7 (4): 697. doi:10.1214/aos/1176344722.
- ^ Mardia, K. V. (1970). "Measures of multivariate skewness and kurtosis with applications". Biometrika. 57 (3): 519–530. doi:10.1093/biomet/57.3.519.
- ^ Rencher (1995), pages 112–113.
- ^ Rencher (1995), pages 493–495.
- ^ Baringhaus, L.; Henze, N. (1991). "Limit distributions for measures of multivariate skewness and kurtosis based on projections". Journal of Multivariate Analysis. 38: 51–69. doi:10.1016/0047-259X(91)90031-V.
- ^ a b Baringhaus, L.; Henze, N. (1988). "A consistent test for multivariate normality based on the empirical characteristic function". Metrika. 35 (1): 339–348. doi:10.1007/BF02613322. S2CID 122362448.
- ^ Henze, Norbert (2002). "Invariant tests for multivariate normality: a critical review". Statistical Papers. 43 (4): 467–506. doi:10.1007/s00362-002-0119-6. S2CID 122934510.
- ^ Gentle, J. E. (2009). Computational Statistics. Statistics and Computing. New York: Springer. pp. 315–316. doi:10.1007/978-0-387-98144-4. ISBN 978-0-387-98143-7.
Literature
[edit]- Rencher, A.C. (1995). Methods of Multivariate Analysis. New York: Wiley.
- Tong, Y. L. (1990). The multivariate normal distribution. Springer Series in Statistics. New York: Springer-Verlag. doi:10.1007/978-1-4613-9655-0. ISBN 978-1-4613-9657-4. S2CID 120348131.
Multivariate normal distribution
View on GrokipediaDefinitions
Notation and Parametrization
The multivariate normal distribution describes the joint distribution of a -dimensional random vector , denoted as , where is the mean vector and is the covariance matrix that is symmetric and positive semi-definite.[3][5] The mean vector functions as the location parameter, specifying the center or expected value of the distribution, .[6][5] The covariance matrix serves as the dispersion parameter, quantifying the variances along the diagonal elements and the covariances off the diagonal, with .[6][5] Its positive semi-definiteness ensures that all variances and covariances are feasible, meaning for any vector .[5] The eigenvalues of provide the scaling factors along the principal components, while the corresponding eigenvectors define the rotations or orientations of these components, shaping the ellipsoidal level sets of the distribution.[6] The trace of , , represents the total variance across all dimensions, serving as a measure of the overall scale of dispersion.[3] In the non-degenerate case, where is positive definite and thus invertible, the precision matrix is introduced, which inversely weights the variances and covariances and facilitates analysis of conditional dependencies.[6][5]Standard Multivariate Normal Vector
The standard multivariate normal vector, denoted , is a -dimensional random vector whose components are independent and each distributed as a standard univariate normal .[7] This distribution represents the canonical form of the multivariate normal with zero mean and unit variances along the diagonal, along with zero covariances between distinct components.[8] The probability density function of is where .[7] The components of are independent and identically distributed (i.i.d.) as , reflecting the diagonal structure of the identity covariance matrix .[7] Consequently, the expected value is , and the second-moment matrix satisfies , confirming the orthogonality of the components.[8] This standard form acts as a foundational reference distribution, enabling the construction of general multivariate normals through affine transformations of , such as where .[9] It is commonly used for standardization in statistical inference and simulation, leveraging the simplicity of i.i.d. standard normals to model more complex correlated structures.[7]General Multivariate Normal Vector
The general multivariate normal vector with mean and positive definite covariance matrix is constructed via an affine transformation of a standard multivariate normal vector , where denotes the identity matrix.[10] Specifically, , where is a matrix satisfying . This representation ensures that , as the transformation preserves the normality while adjusting the location and scale.[10] The matrix can be obtained through decompositions such as the Cholesky decomposition, where is the lower triangular Cholesky factor of , or the spectral decomposition, leveraging the eigenvalues and eigenvectors of .[7] In the non-degenerate case, is positive definite, guaranteeing that has full rank and the distribution is absolutely continuous with respect to the Lebesgue measure on .[10] A key property is that if and only if is an affine transformation of the standard normal vector .[10] When , this reduces to the centered multivariate normal , a special instance focusing solely on the covariance structure.[7]Equivalent Characterizations
The multivariate normal distribution admits several equivalent mathematical characterizations that highlight its fundamental properties and distinguish it from other distributions. These characterizations provide alternative ways to define the distribution without relying solely on the affine transformation of a standard multivariate normal vector, emphasizing its uniqueness and structural features. One key characterization is based on linear combinations of the random vector. A -dimensional random vector follows a multivariate normal distribution with mean vector and covariance matrix if and only if, for every non-zero vector , the scalar random variable is univariate normal with mean and variance . This property stems from the Cramér-Wold theorem, which asserts that the joint distribution of is uniquely determined by the one-dimensional distributions of all its linear projections. Consequently, verifying univariate normality for all such projections suffices to establish multivariate normality for . Another equivalent characterization uses the characteristic function of . The distribution is multivariate normal with parameters and if and only if its characteristic function is for all . This exponential quadratic form in uniquely identifies the multivariate normal among all distributions, as characteristic functions determine distributions uniquely under mild conditions, and this specific form corresponds precisely to the affine structure of the normal family. The multivariate normal distribution also possesses a uniqueness property with respect to its first two moments. It is the unique distribution with given mean and covariance such that all linear combinations of its components are normally distributed; among elliptical distributions sharing these moments, only the multivariate normal satisfies this projection property, as other elliptical distributions (e.g., multivariate ) yield non-normal univariate projections despite matching means and covariances. This uniqueness underscores why the multivariate normal is fully specified by and , unlike broader classes where higher-order moments vary independently. Finally, joint normality of components serves as a defining property. A random vector is multivariate normal if and only if every finite-dimensional subvector (i.e., any selection of its components) follows a multivariate normal distribution with the corresponding sub-mean and sub-covariance matrix derived from and . This recursive property ensures consistency across marginals and reinforces the equivalence to the linear combination characterization, as subvectors correspond to specific projections onto coordinate subspaces.Probability Density Function
The probability density function (PDF) for a -dimensional random vector following a non-degenerate multivariate normal distribution , where is the mean vector and is a positive definite covariance matrix, is given by [11] The exponent involves the quadratic form , which represents the squared Mahalanobis distance from to and measures a scaled Euclidean distance that accounts for the correlations encoded in .[11] For the bivariate case (), with mean and covariance matrix where is the correlation coefficient, the PDF simplifies to [11] The level sets of constant density, where for some constant , form ellipsoids centered at with orientation and shape determined by the eigenvectors and eigenvalues of , providing a geometric interpretation of the distribution's spread and dependence structure.[11]Cumulative and Tail Distributions
The cumulative distribution function (CDF) of a random vector is defined as where denotes the probability density function of .[12] In general, for , this -dimensional integral lacks a closed-form expression and requires numerical methods for evaluation.[12] However, explicit expressions exist for the univariate () and bivariate () cases.[12] For the univariate case (), the CDF of the standard normal distribution is where is the error function. For a general univariate normal , the CDF is . For the bivariate case (), the CDF can be expressed in explicit integral form as where is the univariate standard normal CDF and is the correlation coefficient (assuming standardized marginals with means 0 and variances 1). A closed-form expression is available specifically for orthant probabilities, such as the probability that both components are positive: for standardized with correlation , This formula, known as Sheppard's formula, applies to the positive orthant and extends to other orthants by symmetry.[13] The tail distribution, or complementary CDF, is given by , which quantifies upper tail probabilities and is particularly relevant in applications like risk assessment where extreme events are of interest.[12] More generally, probabilities over rectangular intervals can be computed as the difference . Orthant probabilities represent a special case of interval probabilities where the bounds are in all but one direction per dimension.[12]Properties
Moments and Expectations
The multivariate normal random vector with mean vector and covariance matrix has first moment .[14] Element-wise, the expected value of the -th component is .[14] The second central moment, or variance-covariance matrix, is given by , with the covariance between the -th and -th components satisfying .[14] Due to the symmetry of the density function, all odd-order central moments vanish, so the third central moment tensor is zero and the distribution exhibits no skewness.[14] For even-order central moments, particularly the fourth, Isserlis' theorem provides a recursive structure: the expectation of a product of an even number of centered components equals the sum over all perfect matchings (pairings) of the product of pairwise covariances for each pair.[15] This theorem fully characterizes higher raw moments as , where the sum is over multi-index matrices , counts paired indices, and is a combinatorial coefficient.[14] The multivariate normal distribution is mesokurtic, with excess kurtosis equal to zero in the sense of Mardia's measure , where for the standardized case.[16] In estimation contexts, the sample mean is unbiased for , and the unbiased sample covariance has expectation .[17]Marginal and Conditional Distributions
One fundamental property of the multivariate normal distribution is that both its marginal and conditional distributions are also multivariate normal. Consider a random vector partitioned into subvectors , where is -dimensional and is -dimensional with , and correspondingly and , with .[18] The marginal distribution of is , and similarly the marginal distribution of is . This follows from integrating the joint density over the other subvector, yielding a density that matches the multivariate normal form with the corresponding sub-mean and sub-covariance matrix.[18][19] The conditional distribution of given is , assuming is invertible. This result is derived by completing the square in the exponent of the joint density function, which separates the conditional density as a multivariate normal with the specified parameters. The conditional mean represents the best linear predictor of based on , aligning with the linear regression interpretation in the multivariate normal framework.[18] In the special case of the bivariate normal distribution, where and is the correlation coefficient, the conditional expectation is , and the conditional variance is . These expressions specialize the general formulas, highlighting the linear dependence in the mean and the role of correlation in reducing variance.[20] A key feature of these conditional distributions is homoscedasticity: the conditional covariance matrix (or in the bivariate case) is constant and does not depend on the observed value . This constant variance property underscores the multivariate normal's utility in regression models where prediction errors have uniform dispersion.[18][20]Joint Normality and Independence
A random vector in is said to follow a multivariate normal distribution if every linear combination , for any fixed vector , follows a univariate normal distribution. This characterization ensures that the joint distribution captures the full structure of normality across dimensions, as univariate normality of all such combinations implies the vector's joint normality.[21] Equivalently, the distribution is multivariate normal if all finite-dimensional projections onto linear subspaces preserve normality, providing a foundational property for many statistical applications. In the context of multivariate normal distributions, uncorrelatedness between subvectors implies statistical independence, a property unique to the normal family among common continuous distributions. Specifically, for a partitioned vector following a multivariate normal distribution with covariance matrix , the subvectors and are independent if and only if .[22] This equivalence holds because the joint density factors into the product of the marginal densities when the covariance block is zero, reflecting the absence of linear dependence that would otherwise couple the components.[23] Consequently, zero correlation suffices for independence under joint normality, simplifying analyses in fields like finance and signal processing where such assumptions facilitate model tractability.[22] Marginal normality does not guarantee joint multivariate normality, highlighting the need for explicit checks on dependence structures. A classic counterexample involves two random variables and where , are independent, , and if or if ; here, both and are marginally standard normal, but their joint distribution is not bivariate normal since , which exceeds the probability under a zero-covariance bivariate normal.[24] More generally, copulas allow construction of joint distributions with normal marginals but non-normal joints by pairing normal marginals with non-Gaussian copulas, such as Clayton or Gumbel copulas, which introduce tail dependencies absent in the multivariate normal.[25] These examples underscore that nonlinear dependencies can violate joint normality even when marginals are normal. When components of a random vector are independent and each marginally normal, the joint distribution is multivariate normal with a diagonal covariance matrix, and the joint probability density function equals the product of the individual marginal densities.[26] For instance, if independently for , then where is diagonal with entries , and the density .[22] This factorization property reinforces the role of independence in generating multivariate normals from univariate ones, central to simulation and modeling techniques.[26]Transformations and Functions
One key property of the multivariate normal distribution is its closure under affine transformations. If , where is the mean vector and is the positive definite covariance matrix, then for any invertible matrix and vector , the transformed vector follows a multivariate normal distribution . This result holds because the transformation preserves the normality through the linearity of expectation and the quadratic nature of the exponent in the density function. A special case of the affine transformation arises with linear combinations of the components of . For a vector , the scalar random variable is univariate normal, distributed as . This univariate marginal follows directly from setting and in the affine result, highlighting how individual projections of multivariate normals remain normal. Such linear combinations are fundamental in deriving moments and in applications like regression coefficients. Quadratic forms involving multivariate normal vectors yield more complex distributions, specifically generalized chi-squared distributions when related to the covariance structure. If and is a symmetric matrix, then can be decomposed into a linear combination of independent (non-central) chi-squared random variables, where the weights are the eigenvalues of and non-centrality parameters depend on . This generalized chi-squared arises because diagonalizing the form via the spectral decomposition of transforms the variables into independent normals, each contributing a scaled chi-squared term. For instance, when and , the form simplifies to a central chi-squared with degrees of freedom. The likelihood function for parameters and based on a single observed vector from is derived directly from the probability density function evaluated at : This expression encapsulates the joint contribution of the mean and covariance to the data fit, with the quadratic term measuring deviation in Mahalanobis distance.Information-Theoretic Measures
The differential entropy of a -dimensional multivariate normal random vector is given by where denotes the determinant of the covariance matrix .[27] This expression arises from integrating the negative log-density over the probability density function of the multivariate normal.[27] Among all continuous distributions with fixed covariance matrix , the multivariate normal achieves the maximum differential entropy, reflecting its maximal uncertainty or spread under the given second-moment constraints.[28] The Kullback-Leibler (KL) divergence between two -dimensional multivariate normals and is This closed-form measure quantifies the information loss when approximating the first distribution by the second, incorporating both mean and covariance differences.[29] The divergence is always nonnegative and equals zero if and only if the two distributions are identical.[29] For jointly normal random vectors and with correlation matrix , the mutual information is This formula derives from the difference between the joint entropy and the sum of marginal entropies, leveraging the Gaussian property that mutual information depends solely on the correlation structure.[30] Under independence, is block-diagonal with zero off-blocks, yielding and additivity of the differential entropy: .[30]Geometric Interpretation
The level sets of the probability density function of the multivariate normal distribution, defined by the equation for constant , form ellipsoids in .[31] These ellipsoids are centered at the mean vector and represent surfaces of constant density, with the density decreasing as increases.[31] The orientation of these ellipsoids is determined by the eigenvectors of the covariance matrix , which define the principal axes along the directions of maximum variance.[31] The lengths of these axes are scaled by the square roots of the corresponding eigenvalues of , reflecting the spread of the distribution in those directions; larger eigenvalues correspond to longer axes.[31][32] The Mahalanobis distance, given by , quantifies the deviation of a point from the mean in a space standardized by the covariance structure.[31] This distance generalizes the standard deviation measure from the univariate case, where the "1-sigma" interval covers approximately 68% of the probability mass.[33] In the -dimensional case, the ellipsoid corresponding to a squared Mahalanobis distance of encloses 68% of the probability, with denoting the cumulative distribution function of the chi-squared distribution with degrees of freedom.[32] When the covariance matrix is singular with rank , the distribution is degenerate, and the ellipsoids collapse onto lower-dimensional affine subspaces of dimension embedded in .[7] In this case, the support of the distribution lies entirely within these subspaces, and the density is undefined with respect to the full -dimensional Lebesgue measure.[7] In the bivariate case (), the density contours appear as tilted ellipses when the components are correlated, with the tilt angle determined by the off-diagonal elements of that capture the correlation.[33] For zero correlation, the ellipses align with the coordinate axes; positive or negative correlations rotate them accordingly, illustrating the elliptical symmetry of the distribution.[32]Statistical Inference
Parameter Estimation
Given a random sample of -dimensional vectors independently and identically distributed as multivariate normal , the classical frequentist estimators for the mean vector and covariance matrix are derived from moment-based and likelihood-based approaches.[34] The sample mean vector is defined as . This estimator is unbiased, satisfying , and follows an exact multivariate normal distribution .[34] It is also consistent, converging in probability to as .[34] The unbiased sample covariance matrix is , which satisfies and is independent of .[34] This estimator is consistent for as .[34] The maximum likelihood estimators (MLEs), obtained by maximizing the likelihood function of the multivariate normal, are and .[34] While is unbiased, is biased downward for (with bias ), but both are consistent as .[34] Additionally, is asymptotically normal under the true model.[34] Under the multivariate normal assumption, the scaled sample covariance follows a Wishart distribution , which describes the sampling variability of the covariance estimator and was originally derived for samples from a normal multivariate population.[35][34]Bayesian Analysis
In Bayesian analysis, the mean vector and covariance matrix of the multivariate normal distribution are assigned prior distributions to incorporate uncertainty and prior knowledge. The conjugate prior, which ensures that the posterior distribution belongs to the same family, is the normal-inverse-Wishart (NIW) distribution. This prior was originally developed by Ando and Kaufman (1965) for the analysis of independent multinormal processes with unknown mean and precision.[36] Under the NIW prior, the conditional distribution of given is multivariate normal: , where is the prior mean vector and scales the prior precision relative to . Independently, follows an inverse Wishart distribution: , with degrees of freedom (where is the dimension) and scale matrix a positive definite matrix.[37] Given independent observations , the posterior distribution is also NIW, with updated hyperparameters derived from the sufficient statistics: the sample mean and the sum of squared deviations . The updates are: Thus, the conditional posterior is and . The posterior mean of is , which coincides with its mode due to the normality of the conditional posterior. For , the posterior mean is (provided ), while the posterior mode is . These expressions weight the prior toward the sample estimates as increases, reflecting the conjugate structure's shrinkage properties.[37] The posterior predictive distribution for a new observation integrates out the uncertainty in and , yielding a multivariate Student-t distribution: with degrees of freedom adjusted for the dimension (requiring ). This distribution captures both parameter uncertainty and sampling variability, with heavier tails than the normal due to the inverse Wishart component.[37] To select the NIW hyperparameters when substantive prior information is unavailable, empirical Bayes approaches estimate them by maximizing the marginal likelihood of the data, treating the hyperparameters as nuisance parameters. This method, which balances prior informativeness with data fit, has been applied in high-dimensional settings using Wishart-based priors to induce sparsity or shrinkage in covariance estimates.[38]Normality Testing
Testing whether a sample arises from a multivariate normal distribution is crucial in many statistical analyses, as violations can affect inference validity. Several formal and graphical methods exist for this purpose, focusing on deviations in skewness, kurtosis, or overall shape. These tests are particularly important in high-dimensional settings where univariate checks may overlook joint dependencies.[39] Mardia's test assesses multivariate normality by evaluating sample skewness and kurtosis measures, which under the null hypothesis of normality follow chi-squared distributions. The skewness statistic quantifies asymmetry and is approximated by a distribution with degrees of freedom, where is the dimension; the kurtosis statistic measures tail heaviness and is assessed via the z-statistic , which approximately follows a standard normal distribution for large . These measures extend univariate moments to the multivariate case and are affine-invariant, making the test robust to linear transformations. The test rejects normality if either statistic exceeds critical values at a chosen significance level.[40][41] The Henze-Zirkler test provides an omnibus approach by integrating a smoothed empirical characteristic function against the normal characteristic function, yielding a statistic that is invariant under affine transformations and consistent against a broad class of alternatives. This method avoids reliance on moments, offering advantages in detecting subtle departures from normality without assuming finite moments. It is computed via numerical integration and has shown competitive performance in simulation studies across various dimensions and sample sizes. Graphical methods, such as multivariate quantile-quantile (Q-Q) plots, offer visual diagnostics by plotting ordered squared Mahalanobis distances against quantiles of the distribution; deviations from the diagonal line indicate non-normality, particularly in tails or clusters. Extensions of the Shapiro-Wilk test to multivariate data, such as those adapting the W statistic via canonical correlations or projection pursuits, provide empirical p-values for formal assessment, though they are computationally intensive for high dimensions. These tools complement formal tests by highlighting specific violation types, like outliers or asymmetry. Regarding power, these tests vary in sensitivity: Mardia's excels at detecting skewness and kurtosis excesses but may underperform against symmetric heavy-tailed alternatives, while the Henze-Zirkler test demonstrates robust power for departures in tails, dependence structures, or mixtures, often outperforming moment-based methods in moderate to high dimensions. Simulation studies indicate that power improves with sample size but can degrade in very high dimensions without adjustments.[39]Discriminant Analysis
Gaussian discriminant analysis (GDA) is a probabilistic classification method that assumes observations from each class follow a multivariate normal distribution, leveraging Bayes' theorem to compute posterior class probabilities. Given an observation and classes, the posterior probability for class is , where is the prior probability of class and is the class-conditional density, modeled as the probability density function of a multivariate normal distribution . Classification assigns to the class with the maximum posterior probability, equivalent to minimizing expected misclassification risk under 0-1 loss. When class-conditional covariance matrices are equal across all classes ( for all ), GDA simplifies to linear discriminant analysis (LDA), where decision boundaries between classes are linear hyperplanes in the feature space. LDA derives from maximizing the separation between class means relative to within-class variability, assuming multivariate normality and equal covariances, as originally formulated by Fisher for taxonomic classification using iris measurements. The linear discriminant function takes the form , leading to linear boundaries since the quadratic terms cancel out.[42] In contrast, quadratic discriminant analysis (QDA) relaxes the equal covariance assumption, allowing each class to have its own , resulting in quadratic decision boundaries that better capture differing class spreads and orientations. The discriminant function becomes , where the quadratic form in arises from the inverse covariance terms. QDA, as an extension of the Bayesian framework for multivariate normals, provides greater flexibility for datasets where class covariances vary but increases parameter estimation demands, potentially leading to overfitting in small samples. The performance of these methods is evaluated through misclassification probabilities, which quantify the overlap between class-conditional densities. The overall error rate is , where denotes the decision region for class ; for multivariate normals, this integral reflects the degree of separation between means relative to covariance structures, with lower overlap yielding smaller error rates. In LDA, equal covariances promote linear separability, while QDA can achieve lower error rates when covariances differ but may estimate error rates less reliably due to higher variance in covariance estimates.[43]Computational Methods
Sampling from the Distribution
Generating random samples from a multivariate normal distribution , where is the mean vector and is the covariance matrix, relies on linear transformations of independent standard normal variables. This approach leverages the property that if , then for any matrix such that . For the non-degenerate case where is positive definite, the Cholesky decomposition provides an efficient method to obtain . Specifically, compute the lower triangular matrix satisfying , then generate and set . This factorization is numerically stable and computationally efficient, requiring operations for the decomposition followed by per sample.[12] An alternative is the eigenvalue decomposition , where is orthogonal and is diagonal with positive eigenvalues; here, , with the diagonal matrix of square roots. This method is useful when eigendecomposition aids in further analysis, though it is generally more expensive than Cholesky.[12] When is singular (rank ), the distribution is degenerate, concentrating on an -dimensional affine subspace. Sampling involves projecting to the range of , generating samples in the reduced space using a full-rank factorization, and setting components in the null space to match the mean. The Moore-Penrose pseudoinverse can facilitate this by identifying the effective dimensions. Implementations in statistical software handle these cases automatically. In R, themvrnorm function from the MASS package generates samples via Cholesky decomposition for positive definite , with options for handling near-singularity. Python's NumPy library provides numpy.random.multivariate_normal, which uses similar linear algebra techniques and raises errors for non-positive semi-definite matrices.
