.svg/250px-European_countries_by_population_(2025).svg.png "Demographics of Europe")
.svg/2000px-European_countries_by_population_(2025).svg.png)
Community hub
Recent from talks
Contribute something
Nothing was collected or created yet.
Demographics of Europe
View on Wikipedia
.svg)

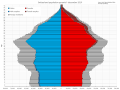
Figures for the population of Europe vary according to the particular definition of Europe's boundaries. In 2018, Europe had a total population of over 751 million people.[1][2] 448 million of them lived in the European Union and 110 million in European Russia; Russia is the most populous country in Europe.
Europe's population growth is low, and its median age high. Most of Europe is in a mode of sub-replacement fertility, which means that each new(-born) generation is less populous than the one before.[3] Nonetheless, most West European countries still have growing populations, mainly due to immigration within Europe and from outside Europe and some due to increases in life expectancy and population momentum. Some current and past factors in European demography have included emigration, ethnic relations, economic immigration, a declining birth rate and an ageing population.
History
[edit]Prehistory
[edit]Approximately 5,000–130,000 people lived in Europe during the Last Glacial Maximum about 20,000 years ago.[4][5]
According to Volker Heyd, an archaeologist at the University of Helsinki, up to 7 million people lived in Neolithic Europe in 3000 BC.[6]
According to archaeologist Johannes Müller, the European population was about 1 million around 6500 BC, but increased to 8 million in 2000 BC.[7]
The following table shows estimates of historical population sizes of Europe (including Central Asia, listed under "former USSR") based on Maddison (2007),[8] in millions, with an estimated percentage of world population:
| Year | Population (millions) | Percentage of world total |
|---|---|---|
| AD 1 | 34 | 15% |
| 1000 | 40 | 15% |
| 1500 | 78 | 18% |
| 1600 | 112 | 20% |
| 1700 | 127 | 21% |
| 1820 | 224 | 21% |
| 1913 | 498 | 28% |
| 2000 | 742 | 13% |
Past populations of Europe in modern national borders, AD 1–2020
[edit]| Country/region | 1 | 1000 | 1500 | 1600 | 1700 | 1820 | 1870 | 1913 | 1950 | 1973 | 1998 | 2020 |
|---|---|---|---|---|---|---|---|---|---|---|---|---|
| Austria | 500[9] | 705[9] | 2000[9] | 2500[9] | 2500[9] | 3369[9] | 4520[9] | 6767[9] | 6935[9] | 7586[9] | 8078[9] | 8901[9] |
| Belgium | 300[9] | 400[9] | 1400[9] | 1600[9] | 2000[9] | 3424[9] | 5096[9] | 7666[9] | 8640[9] | 9738[9] | 10197[9] | 11493[9] |
| Denmark | 180[9] | 360[9] | 600[9] | 650[9] | 700[9] | 1155[9] | 1888[9] | 2983[9] | 4269[9] | 5022[9] | 5303[9] | 5823[9] |
| Finland | 20[9] | 40[9] | 300[9] | 400[9] | 400[9] | 1169[9] | 1754[9] | 3027[9] | 4009[9] | 4666[9] | 5153[9] | 5536[9] |
| France | 5000[9] | 6500[9] | 15000[9] | 18500[9] | 21471[9] | 31246[9] | 38440[9] | 41463[9] | 41836[9] | 52118[9] | 58805[9] | 67287[9] |
| Germany | 3000[9] | 3500[9] | 12000[9] | 16000[9] | 15000[9] | 24905[9] | 39231[9] | 65058[9] | 68371[9] | 78956[9] | 82029[9] | 83191[9] |
| Italy | 7000[9] | 5000[9] | 10500[9] | 13100[9] | 13300[9] | 20176[9] | 27888[9] | 37248[9] | 47105[9] | 54751[9] | 57592[9] | 59258[9] |
| Netherlands | 200[9] | 300[9] | 950[9] | 1500[9] | 1900[9] | 2355[9] | 3615[9] | 6164[9] | 10114[9] | 13438[9] | 15700[9] | 17425[9] |
| Norway | 100[9] | 200[9] | 300[9] | 400[9] | 500[9] | 970[9] | 1735[9] | 2447[9] | 3265[9] | 3961[9] | 4432[9] | 5368[9] |
| Sweden | 200[9] | 400[9] | 550[9] | 760[9] | 1260[9] | 2585[9] | 4164[9] | 5621[9] | 7015[9] | 8137[9] | 8851[9] | 10379[9] |
| Switzerland | 300[9] | 300[9] | 650[9] | 1000[9] | 1200[9] | 1829[9] | 2664[9] | 3864[9] | 4694[9] | 6441[9] | 7130[9] | 8667[9] |
| United Kingdom | 800[9] | 2000[9] | 3942[9] | 6170[9] | 8565[9] | 21226[9] | 31393[9] | 45649[9] | 50363[9] | 56223[9] | 59237[9] | 67886[9] |
| Portugal | 500[9] | 600[9] | 1000[9] | 1100[9] | 2000[9] | 3297[9] | 4353[9] | 6004[9] | 8512[9] | 8634[9] | 9968[9] | 10305[9] |
| Spain | 4500[9] | 4000[9] | 6800[9] | 8240[9] | 8770[9] | 12203[9] | 16201[9] | 20263[9] | 27868[9] | 34810[9] | 39371[9] | 48692[9] |
| Greece | 2000[9] | 1000[9] | 1000[9] | 1500[9] | 1500[9] | 2312[9] | 7554[9] | 8929[9] | 10835[9] | 10689[9] | ||
| 13 small countries | 100[9] | 113[9] | 276[9] | 358[9] | 394[9] | 657[9] | ||||||
| Total Western Europe | 24700[9] | 25413[9] | 57268[9] | 73778[9] | 81460[9] | 132888[9] | 187532[9] | 261007[9] | 305060[9] | 358390[9] | 388399[9] | 419639[9] |
| Albania | 200[9] | 200[9] | 200[9] | 200[9] | 300[9] | 437 | 1215[9] | 2296[9] | 3108[9] | 2878[9] | ||
| Bulgaria | 500[9] | 800[9] | 800[9] | 1250[9] | 1250[9] | 2187[9] | 4200[9] | 7251[9] | 8621[9] | 8257[9] | 6917[9] | |
| Czechoslovakia | 1000[9] | 1250[9] | 3000[9] | 4500[9] | 4500[9] | 7190[9] | 12393[9] | 14563[9] | 15686[9] | 16366[9] | ||
| - Czech Rep. | 10221[9] | 8930[9] | 10295[9] | 10702[9] | ||||||||
| - Slovakia | 3463[9] | 4642[9] | 5391[9] | 5460[9] | ||||||||
| Hungary | 300[9] | 500[9] | 1250[9] | 1250[9] | 1500[9] | 4571[9] | 9338[9] | 10432[9] | 10237[9] | 9770[9] | ||
| Poland | 450[9] | 1200[9] | 4000[9] | 5000[9] | 6000[9] | 10426[9] | 25753[9] | 33363[9] | 38666[9] | 38268[9] | ||
| Romania | 800[9] | 800[9] | 2000[9] | 2000[9] | 2500[9] | 6389[9] | 7360[9] | 16311[9] | 20828[9] | 22503[9] | 19266[9] | |
| Yugoslavia | 1500[9] | 1750[9] | 2250[9] | 2750[9] | 2750[9] | 5215[9] | 16578[9] | 21088[9] | ||||
| Eastern Europe | 4750[9] | 6500[9] | 13500[9] | 16950[9] | 18800[9] | 36415[9] | 52182[9] | 79604[9] | 139428[9] | 173037[9] | 164513[9] | 151529[9] |
| Former USSR | 3900[9] | 7100[9] | 16950[9] | 20700[9] | 26550[9] | 54765[9] | 88672[9] | 156192[9] | 180050[9] | 249748[9] | 290866[9] | 299173[9] |
| - Russia | 102833[9] | 132434[9] | 147671[9] | 146171[9] | ||||||||
| - Ukraine | 31142[9] | 36905[9] | 48274[9] | 50370[9] | 41902[9] | |||||||
| World | 230820[9] | 268273[9] | 437818[9] | 555828[9] | 603410[9] | 1041092[9] | 1270014[9] | 1791020[9] | 2524531[9] | 3913482[9] | 5907680[9] | 7800000[9] |
| Country/region | 1 | 1000 | 1500 | 1600 | 1700 | 1820 | 1870 | 1913 | 1950 | 1973 | 1998 | 2018 |
|---|---|---|---|---|---|---|---|---|---|---|---|---|
| Austria | 0.2[9] | 0.3[9] | 0.5[9] | 0.4[9] | 0.4[9] | 0.3[9] | 0.4[9] | 0.4[9] | 0.3[9] | 0.2[9] | 0.1[9] | |
| Belgium | 0.1[9] | 0.1[9] | 0.3[9] | 0.3[9] | 0.3[9] | 0.3[9] | 0.4[9] | 0.4[9] | 0.3[9] | 0.2[9] | 0.2[9] | |
| Denmark | 0.1[9] | 0.1[9] | 0.1[9] | 0.1[9] | 0.1[9] | 0.1[9] | 0.1[9] | 0.2[9] | 0.2[9] | 0.1[9] | 0.1[9] | |
| Finland | 0.0[9] | 0.0[9] | 0.1[9] | 0.1[9] | 0.1[9] | 0.1[9] | 0.1[9] | 0.2[9] | 0.2[9] | 0.1[9] | 0.1[9] | |
| France | 2.2[9] | 2.4[9] | 3.4[9] | 3.3[9] | 3.6[9] | 3.0[9] | 3.0[9] | 2.3[9] | 1.7[9] | 1.3[9] | 1.0[9] | |
| Germany | 1.3[9] | 1.3[9] | 2.7[9] | 2.9[9] | 2.5[9] | 2.4[9] | 3.1[9] | 3.6[9] | 2.7[9] | 2.0[9] | 1.4[9] | |
| Italy | 3.0[9] | 1.9[9] | 2.4[9] | 2.4[9] | 2.2[9] | 1.9[9] | 2.2[9] | 2.1[9] | 1.9[9] | 1.4[9] | 1.0[9] | |
| Netherlands | 0.1[9] | 0.1[9] | 0.2[9] | 0.3[9] | 0.3[9] | 0.2[9] | 0.3[9] | 0.3[9] | 0.4[9] | 0.3[9] | 0.3[9] | |
| Norway | 0.0[9] | 0.1[9] | 0.1[9] | 0.1[9] | 0.1[9] | 0.1[9] | 0.1[9] | 0.1[9] | 0.1[9] | 0.1[9] | 0.1[9] | |
| Sweden | 0.1[9] | 0.1[9] | 0.1[9] | 0.1[9] | 0.2[9] | 0.2[9] | 0.3[9] | 0.3[9] | 0.3[9] | 0.2[9] | 0.1[9] | |
| Switzerland | 0.1[9] | 0.1[9] | 0.1[9] | 0.2[9] | 0.2[9] | 0.2[9] | 0.2[9] | 0.2[9] | 0.2[9] | 0.2[9] | 0.1[9] | |
| United Kingdom | 0.3[9] | 0.7[9] | 0.9[9] | 1.1[9] | 1.4[9] | 2.0[9] | 2.5[9] | 2.5[9] | 2.0[9] | 1.4[9] | 1.0[9] | |
| Portugal | 0.2[9] | 0.2[9] | 0.2[9] | 0.2[9] | 0.3[9] | 0.3[9] | 0.3[9] | 0.3[9] | 0.3[9] | 0.2[9] | 0.2[9] | |
| Spain | 1.9[9] | 1.5[9] | 1.6[9] | 1.5[9] | 1.5[9] | 1.2[9] | 1.3[9] | 1.1[9] | 1.1[9] | 0.9[9] | 0.7[9] | |
| Other | 0.9[9] | 0.4[9] | 0.3[9] | 0.3[9] | 0.3[9] | 0.3[9] | 0.4[9] | 0.4[9] | 0.5[9] | 0.4[9] | 0.3[9] | |
| Total Western Europe | 10.7[9] | 9.5[9] | 13.1[9] | 13.3[9] | 13.5[9] | 12.8[9] | 14.8[9] | 14.6[9] | 12.1[9] | 9.2[9] | 6.6[9] | |
| Eastern Europe | 2.1[9] | 2.4[9] | 3.1[9] | 3.0[9] | 3.1[9] | 3.5[9] | 4.1[9] | 4.4[9] | 3.5[9] | 2.8[9] | 2.0[9] | |
| Former USSR | 1.7[9] | 2.6[9] | 3.9[9] | 3.7[9] | 4.4[9] | 5.3[9] | 7.0[9] | 8.7[9] | 7.1[9] | 6.4[9] | 4.9[9] | |
| Total Europe | 14.5[9] | 14.5[9] | 20.1[9] | 20.0[9] | 21.0[9] | 21.6[9] | 25.9[9] | 27.7[9] | 22.7[9] | 18.4[9] | 13.5[9] | 9.8[10] |
| World | 100.0[9] | 100.0[9] | 100.0[9] | 100.0[9] | 100.0[9] | 100.0[9] | 100.0[9] | 100.0[9] | 100.0[9] | 100.0[9] | 100.0[9] | 100.0[9] |
- Note: These numbers do not include the population of European countries' colonies, only the population within Europe.
Total population
[edit]

330,000,000 people lived in Europe in 1916.[11] In 1950 there were 549,000,000.[12] The population of Europe in 2015 was estimated to be 741 million according to the United Nations,[12] which was slightly less than 11% of the world population. The precise figure depends on the exact definition of the geographic extent of Europe. The population of the European Union (EU) was 509 million as of 2015.[13] Non-EU countries situated in Europe in their entirety[14] account for another 90 million. Five transcontinental countries[15] have a total of 247 million people, of which about half reside in Europe proper.
As it stands now, around 10% of the world's people live in Europe. If demographic trends keep their pace, its share may fall to around 7% in 2050, but still amounting to 716 million people in absolute numbers, according to the United Nations estimate.[12] (The decline in the percentage is partly due to high fertility rates in Africa and South America.) The sub-replacement fertility and high life expectancy in most European states mean a declining and aging population. High immigration and emigration levels within and from outside the continent are taking place and quickly changing countries, specifically in Western Europe, from a single ethnic group to a multicultural society. These trends can change societies' economies as well as their political and social institutions. [how?][citation needed]
Vital statistics
[edit]| Year | Average population |
Live births | Deaths | Natural change |
Crude rates (per 1000) | Total fertility rate |
Life expectancy | |||
|---|---|---|---|---|---|---|---|---|---|---|
| Births | Deaths | Natural change |
Migration change | |||||||
| 1950 | 549,721,718 | 12,202,220 | 6,473,233 | 5,728,987 | 22.2 | 11.8 | 10.4 | -1.6 | 2.70 | 62.8 |
| 1951 | 554,559,502 | 12,112,425 | 6,609,794 | 5,502,631 | 21.8 | 11.9 | 9.9 | -0.8 | 2.66 | 62.8 |
| 1952 | 559,609,904 | 12,142,368 | 6,265,135 | 5,877,233 | 21.7 | 11.2 | 10.5 | -0.8 | 2.66 | 64.0 |
| 1953 | 565,058,633 | 12,120,826 | 6,220,937 | 5,899,889 | 21.5 | 11.0 | 10.4 | -0.5 | 2.64 | 64.7 |
| 1954 | 570,670,994 | 12,151,779 | 6,072,645 | 6,079,134 | 21.3 | 10.6 | 10.7 | -0.8 | 2.64 | 65.5 |
| 1955 | 576,304,974 | 12,134,270 | 5,987,151 | 6,147,119 | 21.1 | 10.4 | 10.7 | -0.9 | 2.63 | 66.0 |
| 1956 | 581,975,516 | 12,133,583 | 5,899,594 | 6,233,989 | 20.8 | 10.1 | 10.7 | -0.8 | 2.62 | 66.9 |
| 1957 | 587,711,635 | 12,194,100 | 5,963,269 | 6,230,831 | 20.7 | 10.1 | 10.6 | -0.5 | 2.62 | 66.9 |
| 1958 | 593,669,297 | 12,177,600 | 5,647,571 | 6,530,029 | 20.5 | 9.5 | 11.0 | -0.9 | 2.60 | 68.2 |
| 1959 | 599,684,870 | 12,178,245 | 5,816,056 | 6,362,189 | 20.3 | 9.7 | 10.6 | -0.7 | 2.60 | 68.1 |
| 1960 | 605,629,870 | 12,098,378 | 5,783,828 | 6,314,550 | 20.0 | 9.6 | 10.4 | -0.4 | 2.58 | 68.8 |
| 1961 | 611,711,020 | 11,990,399 | 5,749,292 | 6,241,107 | 19.6 | 9.4 | 10.2 | -0.5 | 2.56 | 69.1 |
| 1962 | 617,672,206 | 11,784,056 | 6,023,706 | 5,760,350 | 19.1 | 9.8 | 9.3 | -0.1 | 2.53 | 68.9 |
| 1963 | 623,335,994 | 11,654,646 | 6,031,219 | 5,623,427 | 18.7 | 9.7 | 9.0 | 0 | 2.52 | 69.2 |
| 1964 | 628,944,878 | 11,467,618 | 5,843,514 | 5,624,104 | 18.2 | 9.3 | 8.9 | -0.4 | 2.50 | 69.9 |
| 1965 | 634,267,606 | 11,141,596 | 6,058,752 | 5,082,844 | 17.6 | 9.6 | 8.0 | -0.1 | 2.45 | 69.8 |
| 1966 | 639,264,461 | 10,950,076 | 6,074,808 | 4,875,268 | 17.1 | 9.5 | 7.6 | 0 | 2.42 | 70.0 |
| 1967 | 644,114,436 | 10,969,039 | 6,204,646 | 4,764,393 | 17.0 | 9.6 | 7.4 | -0.4 | 2.42 | 70.0 |
| 1968 | 648,610,191 | 10,821,004 | 6,427,622 | 4,393,382 | 16.7 | 9.9 | 6.8 | -0.4 | 2.38 | 69.9 |
| 1969 | 652,740,596 | 10,685,498 | 6,652,543 | 4,032,955 | 16.4 | 10.2 | 6.2 | -0.4 | 2.33 | 69.6 |
| 1970 | 656,521,426 | 10,568,071 | 6,602,177 | 3,965,894 | 16.1 | 10.1 | 6.0 | 0 | 2.28 | 70.0 |
| 1971 | 660,476,010 | 10,662,541 | 6,675,051 | 3,987,490 | 16.1 | 10.1 | 6.0 | 0.5 | 2.27 | 70.1 |
| 1972 | 664,799,679 | 10,499,844 | 6,699,913 | 3,799,931 | 15.8 | 10.1 | 5.7 | 0.5 | 2.21 | 70.3 |
| 1973 | 668,909,022 | 10,322,172 | 6,814,598 | 3,507,574 | 15.4 | 10.2 | 5.2 | 0.8 | 2.14 | 70.4 |
| 1974 | 672,912,941 | 10,406,013 | 6,818,259 | 3,587,754 | 15.5 | 10.1 | 5.3 | 0.4 | 2.13 | 70.6 |
| 1975 | 676,770,845 | 10,285,047 | 7,009,188 | 3,275,859 | 15.2 | 10.4 | 4.8 | 0.5 | 2.07 | 70.5 |
| 1976 | 680,361,150 | 10,242,399 | 7,085,837 | 3,156,562 | 15.1 | 10.4 | 4.6 | 0.5 | 2.03 | 70.6 |
| 1977 | 683,848,710 | 10,171,264 | 7,039,667 | 3,131,597 | 14.9 | 10.3 | 4.6 | 0.2 | 1.99 | 70.9 |
| 1978 | 687,149,553 | 10,143,418 | 7,183,531 | 2,959,887 | 14.8 | 10.5 | 4.3 | 0.3 | 1.96 | 70.9 |
| 1979 | 690,287,705 | 10,159,933 | 7,268,744 | 2,891,189 | 14.7 | 10.5 | 4.2 | 0.4 | 1.95 | 71.0 |
| 1980 | 693,437,228 | 10,156,371 | 7,422,720 | 2,733,651 | 14.6 | 10.7 | 3.9 | 0.4 | 1.93 | 70.9 |
| 1981 | 696,429,190 | 10,053,030 | 7,404,116 | 2,648,914 | 14.4 | 10.6 | 3.8 | 0.2 | 1.89 | 71.2 |
| 1982 | 699,220,370 | 10,102,647 | 7,373,734 | 2,728,913 | 14.4 | 10.5 | 3.9 | 0.1 | 1.89 | 71.5 |
| 1983 | 702,014,774 | 10,078,184 | 7,562,097 | 2,516,087 | 14.4 | 10.8 | 3.6 | 0.4 | 1.87 | 71.5 |
| 1984 | 704,798,623 | 10,050,688 | 7,584,914 | 2,465,774 | 14.3 | 10.8 | 3.5 | 0.4 | 1.86 | 71.6 |
| 1985 | 707,516,287 | 9,969,920 | 7,702,883 | 2,267,037 | 14.1 | 10.9 | 3.2 | 0.9 | 1.84 | 71.7 |
| 1986 | 710,385,076 | 9,987,274 | 7,423,641 | 2,563,633 | 14.1 | 10.5 | 3.6 | 0.7 | 1.84 | 72.5 |
| 1987 | 713,465,338 | 9,966,304 | 7,407,417 | 2,558,887 | 14.0 | 10.4 | 3.6 | 0.6 | 1.84 | 72.7 |
| 1988 | 716,444,431 | 9,840,567 | 7,475,880 | 2,364,687 | 13.7 | 10.4 | 3.3 | 0.4 | 1.82 | 72.8 |
| 1989 | 719,107,883 | 9,495,117 | 7,527,904 | 1,967,213 | 13.2 | 10.5 | 2.7 | 0.6 | 1.76 | 72.9 |
| 1990 | 721,497,282 | 9,235,425 | 7,681,197 | 1,554,228 | 12.8 | 10.6 | 2.2 | 0.7 | 1.72 | 72.9 |
| 1991 | 723,602,898 | 8,888,909 | 7,796,555 | 1,092,354 | 12.3 | 10.8 | 1.5 | 0.8 | 1.66 | 72.9 |
| 1992 | 725,259,493 | 8,523,515 | 7,935,829 | 587,686 | 11.8 | 10.9 | 0.8 | 0.8 | 1.60 | 72.7 |
| 1993 | 726,441,892 | 8,138,793 | 8,412,609 | -273,816 | 11.2 | 11.6 | -0.4 | 1.4 | 1.53 | 72.1 |
| 1994 | 727,063,162 | 7,913,453 | 8,492,472 | -579,019 | 10.9 | 11.7 | -0.8 | 1.1 | 1.50 | 72.1 |
| 1995 | 727,300,408 | 7,663,831 | 8,553,348 | -889,517 | 10.5 | 11.8 | -1.2 | 1.4 | 1.46 | 72.2 |
| 1996 | 727,453,566 | 7,581,575 | 8,394,631 | -813,056 | 10.4 | 11.5 | -1.1 | 1.3 | 1.45 | 72.7 |
| 1997 | 727,566,480 | 7,476,674 | 8,240,385 | -763,711 | 10.3 | 11.3 | -1.0 | 0.8 | 1.43 | 73.2 |
| 1998 | 727,445,606 | 7,369,527 | 8,193,143 | -823,616 | 10.1 | 11.3 | -1.1 | 0.6 | 1.42 | 73.6 |
| 1999 | 727,100,016 | 7,264,382 | 8,402,774 | -1,138,392 | 10.0 | 11.6 | -1.6 | 1.4 | 1.40 | 73.4 |
| 2000 | 726,968,473 | 7,325,763 | 8,401,888 | -1,076,125 | 10.1 | 11.6 | -1.5 | 1.4 | 1.42 | 73.5 |
| 2001 | 726,878,371 | 7,277,594 | 8,364,598 | -1,087,004 | 10.0 | 11.5 | -1.5 | 1.6 | 1.41 | 73.8 |
| 2002 | 726,939,358 | 7,330,526 | 8,520,890 | -1,190,364 | 10.1 | 11.7 | -1.6 | 2.3 | 1.42 | 73.8 |
| 2003 | 727,424,988 | 7,442,475 | 8,655,471 | -1,212,996 | 10.2 | 11.9 | -1.7 | 2.7 | 1.45 | 73.8 |
| 2004 | 728,163,243 | 7,558,652 | 8,381,363 | -822,711 | 10.4 | 11.5 | -1.1 | 2.2 | 1.47 | 74.4 |
| 2005 | 728,950,486 | 7,568,637 | 8,494,391 | -925,754 | 10.4 | 11.7 | -1.3 | 2.5 | 1.47 | 74.5 |
| 2006 | 729,857,708 | 7,703,029 | 8,237,212 | -534,183 | 10.6 | 11.3 | -0.7 | 2.8 | 1.50 | 75.2 |
| 2007 | 731,393,136 | 7,886,129 | 8,187,820 | -301,691 | 10.8 | 11.2 | -0.4 | 2.9 | 1.54 | 75.6 |
| 2008 | 733,256,182 | 8,169,398 | 8,195,293 | -25,895 | 11.1 | 11.2 | 0.0 | 2.2 | 1.59 | 75.8 |
| 2009 | 734,902,805 | 8,208,268 | 8,099,043 | 109,225 | 11.2 | 11.0 | 0.1 | 1.8 | 1.60 | 76.3 |
| 2010 | 736,276,813 | 8,227,484 | 8,128,387 | 99,097 | 11.2 | 11.0 | 0.1 | 1.7 | 1.61 | 76.5 |
| 2011 | 737,589,666 | 8,132,980 | 7,958,960 | 174,020 | 11.0 | 10.8 | 0.2 | 1.6 | 1.60 | 77.1 |
| 2012 | 738,907,594 | 8,178,804 | 8,078,292 | 100,512 | 11.1 | 10.9 | 0.1 | 1.4 | 1.62 | 77.3 |
| 2013 | 740,013,806 | 8,039,791 | 8,033,963 | 5,828 | 10.9 | 10.9 | 0.0 | 1.4 | 1.60 | 77.6 |
| 2014 | 741,014,147 | 8,067,454 | 7,955,740 | 111,714 | 10.9 | 10.7 | 0.2 | 1.3 | 1.62 | 77.9 |
| 2015 | 742,107,449 | 8,004,465 | 8,177,599 | -173,134 | 10.8 | 11.0 | -0.2 | 1.8 | 1.62 | 78.0 |
| 2016 | 743,318,582 | 7,950,684 | 8,009,194 | -58,510 | 10.7 | 10.8 | -0.1 | 1.6 | 1.62 | 78.4 |
| 2017 | 744,449,361 | 7,617,755 | 8,076,159 | -458,404 | 10.2 | 10.8 | -0.6 | 1.8 | 1.56 | 78.7 |
| 2018 | 745,359,130 | 7,375,157 | 8,112,356 | -737,199 | 9.9 | 10.9 | -1.0 | 2.1 | 1.53 | 78.8 |
| 2019 | 746,189,645 | 7,108,392 | 8,020,246 | -911,854 | 9.5 | 10.7 | -1.2 | 1.2 | 1.49 | 79.1 |
| 2020 | 746,225,356 | 6,938,739 | 9,119,281 | -2,180,542 | 9.3 | 12.2 | -2.9 | 1.5 | 1.47 | 77.7 |
| 2021 | 745,173,774 | 6,879,818 | 9,656,398 | -2,776,580 | 9.2 | 13.0 | -3.7 | 1.48 | 77.0 | |
| 2022 | 746,964,593 | 6,520,637 | 8,811,692 | -2,291,055 | 8.7 | 11.8 | -3.1 | 1.41 | 78.2 | |
| 2023 | 745,602,875 | 6,337,695 | 8,293,264 | -1,955,569 | 8.5 | 11.1 | -2.6 | 1.40 | 79.1 | |
| 2024 | 745,083,824 | 6,345,992 | 8,431,000 | −2,085,008 | 8.5 | 11.4 | -3.0 | 1.40 | 79.5 | |
| 2025(p) | 744,398,832 | 1.41 | ||||||||
Population by country
[edit]Parts of this article (those related to Population by country: Several censuses have been taken, starting with Albania, with vastly different/lower population numbers; Serbia, Netherlands (15 August 2024 18 mill. inh.), etc.) need to be updated. (August 2024) |
.svg)
According to different definitions, such as consideration of the concept of Central Europe, the following territories and regions may be subject to various other categorisations aside from geographic conventions.
| Country (or territory) | Population [1][2][17] |
Area (km2)[18] |
Density (per km2) |
|---|---|---|---|
| 2,854,710 | 28,748 | 99 | |
| 79,034 | 468 | 169 | |
| 2,790,974 | 29,743 | 94 | |
| 8,922,082 | 83,871 | 106 | |
| 10,312,992 | 86,600 | 119 | |
| 9,578,167 | 207,600 | 46 | |
| 11,611,419 | 30,528 | 380 | |
| 3,270,943 | 51,209 | 64 | |
| 6,520,314 | 110,900 | 59 | |
| 4,060,135 | 56,594 | 72 | |
| 1,244,188 | 9,251 | 134 | |
| 10,510,751 | 78,866 | 133 | |
| 6,025,603 | 43,094 | 140 | |
| 1,328,701 | 45,227 | 29 | |
| 49,709 | 1,399 | 35.6 | |
| 5,535,992 | 336,852 | 16 | |
| 64,531,444 | 551,500 | 117 | |
| 3,757,980 | 69,700 | 54 | |
| 83,408,554 | 357,137 | 234 | |
| 32,669 | 6 | 5,445 | |
| 10,445,365 | 131,957 | 79 | |
| 65,345 | 63 | 1,037 | |
| 9,709,786 | 93,026 | 104 | |
| 370,335 | 103,000 | 4 | |
| 4,986,526 | 69,825 | 71 | |
| 84,263 | 572 | 147 | |
| 59,240,329 | 301,339 | 197 | |
| 97,857 | 116 | 844 | |
| 1,859,203 | 10,887 | 171 | |
| 1,873,919 | 64,562 | 29 | |
| 39,039 | 160 | 244 | |
| 2,786,651 | 65,300 | 43 | |
| 639,321 | 2,586 | 247 | |
| 526,748 | 316 | 1,667 | |
| 3,061,506 | 33,846 | 90 | |
| 36,686 | 2 | 18,343 | |
| 627,859 | 13,812 | 45 | |
| 17,501,696 | 37,354 | 469 | |
| 2,103,330 | 25,713 | 82 | |
| 5,403,021 | 323,787 | 17 | |
| 38,307,726 | 311,888 | 123 | |
| 10,290,103 | 92,212 | 112 | |
| 19,328,560 | 238,391 | 81 | |
| 145,102,755 | 17,098,246 | 8 | |
| 33,745 | 61 | 553 | |
| 7,296,769 | 88,361 | 83 | |
| 5,447,622 | 49,036 | 111 | |
| 2,119,410 | 20,273 | 105 | |
| 47,486,935 | 505,992 | 94 | |
| 2,868 | 62,422 | 0 | |
| 10,467,097 | 450,295 | 23 | |
| 8,691,406 | 41,285 | 211 | |
| 505,000 | 4,163 | 121.3 | |
| 84,775,404 | 783,562 | 108 | |
| 43,531,422 | 603,500 | 72 | |
| 67,281,039 | 242,495 | 277 | |
| 842 | 0.4 | 1,913.6 | |
| 28,666 | 1,580 | 18 |
* indicates link goes to article on demographics of the country (or territory), not just the country itself.
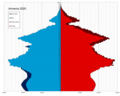
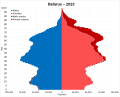
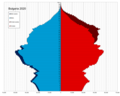
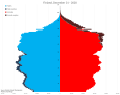
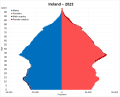
Age
[edit]
Mirroring their mostly sub-replacement fertility and high life expectancy, European countries tend to have older populations overall. They had nine of the top ten highest median ages in national populations in 2005. Only Japan had an older population.[19]
-

-
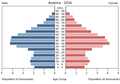 Andorra (2016)
 -
-

-

-
-

-

-
-

-

-
 Czech Republic (2024)
 -

-
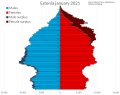 Estonia (2021)
 -
 Finland (2020)
 -
 France (2021)
 -

-
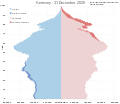 Germany (2020)
 -

-

-

-
-

-

-

-
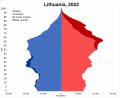 Lithuania (2022)
 -

-

-

-
-
-

-
 Norway (2021)
 -

-
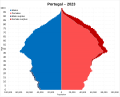 Portugal (2020)
 -

-

-

-

-

-

-

-
 Switzerland (and foreigners)
 -

-

-

-

-
-

-


Fertility
[edit]
According to Eurostat, the average birth rate in the European Union was 1.5 children per woman in 2020. The EU countries with the highest rates were France (1.83 live births per woman), Romania (1.80) and Czechia (1.71). The lowest rates were found in Malta (1.13), Spain (1.19) and Italy (1.24).[21]
The reasons that Italian citizens give for not having children are economic costs, fear of losing their jobs, and lack of services for families.[22]
Eurostat says that the proportion of children born to foreign mothers, including both from other EU member states and from non-EU countries, has been increasing in the EU since 2013 and stood at 21% in 2020.[21]
Religion
[edit]religious_group_by_EU_member_state_-_Eurobarometer_2019.svg)

Over the last several centuries, religious practice has been on the decline in a process of secularization. Several European countries have experienced a decline in church attendance as well as a decline in the number of people professing a religious belief. The 2010 Eurobarometer survey found that, on average, 51% of the citizens of the European Union that they believe there is a God, 26% believe there is some sort of spirit or life force and 20% don't believe there is any sort of spirit, God or life force. 3% declined to answer.[24] The Eurobarometer survey must be taken with caution, however, as there are discrepancies between it and national census results. For example, in the United Kingdom, the 2001 census revealed that over 70% of the population regarded themselves as "Christians" with only 15% professing to have no religion, though the wording of the question has been criticized as "misleading" by the British Humanist Association.[25] The 2011 census showed a dramatic reduction to less than 60% of the population regarding themselves as "Christians".[26]
Despite its decline, Christianity is still the largest religion in Europe. According to a survey published in 2010, 76.2% of Europeans identified themselves as Christians.[27][28] Catholics were the largest Christian group in Europe, accounting for more than 48% of European Christians.[29] The second-largest Christian group in Europe was the Orthodox, who made up 32% of European Christians.[29] And about 19% of European Christians were part of the Protestant tradition. Europe constitutes in absolute terms the world's largest Christian population.[30] According to Scholars, in 2017, Europe's population was 77.8% Christian (up from 74.9% 1970),[31][32] these changes were largely result of the collapse of Communism and switching to Christianity in the former Soviet Union and Eastern Bloc countries.[31]
According to a 2003 study,[33] 47% of French people declared themselves as agnostics in 2003. This situation is often called "Post-Christian Europe". A decrease in religiousness and church attendance in western Europe (especially in Belgium, the Czech Republic, Finland, France, Germany, the United Kingdom, Norway, the Netherlands and Sweden) has been noted. According to a survey published in 2012, atheists and agnostics make up about 18.2% of the European population.[34] According to the same survey the religiously unaffiliated make up the majority of the population only in two European countries: Czech Republic (75%) and Estonia (60%).[34]
According to another survey about Religiosity in the European Union from 2012 by Eurobarometer, Christianity was the largest religion in the Union (accounting for 72% of the total population), Catholics were with 48% the largest Christian group in the Union, Protestants made up 12%, Eastern Orthodox made up 8% and other Christians accounted for 4% of the total population.[35] non-believers/agnostics accounted for 16%, atheists accounted for 7% and Muslims accounted for 2%.[36]
Ethnic groups
[edit]Pan and Pfeil (2004) count 87 distinct "peoples of Europe", of which 33 form the majority population in at least one sovereign state, while the remaining 54 constitute ethnic minorities. The total number of national minority populations in Europe is estimated at 105 million people, or 14% of 770 million Europeans. (including Europeans in Siberia)[37]
The largest ethnic groups are the Russians, with 117 million, and the Germans, with 72 million. In some countries such as the United Kingdom, France and Spain, the designation of nationality may controversially take on ethnic aspects, subsuming smaller ethnic groups such as Scots, Welsh, Cornish, Northern Irish, Bretons, Catalans, and Basques, making it difficult to quantify a "British" or "French" ethnicity, for example.
There are an estimated 10 million Romani people in Europe.[38]
Overview map of the peoples of Europe | |
|---|---|
Size and geographic distribution of the 87 peoples of Europe, according to Pan & Pfeil (2003).[39]
Font size reflects population size (groups smaller than 2 million not to scale) Groups not shown due to lack of geographic concentration: Romani (3.8 million), Jews (1.3 million), Karaim (4,600). Small Finnic and Caucasian groups (<0.2 million) not shown in map: Votes, Ludes, Setos, Võros; Balkars, Karachays, Laks, Lazs, Nogais, Rutuls, Tabasarans, Tats, Tsakhurs. | |

|
Language
[edit]
Most of the languages of Europe belong to the Indo-European language family. This family is divided into a number of branches, including Romance, Germanic, Baltic, Slavic, Albanian, Celtic, Armenian and Greek. The Uralic languages, which include Hungarian, Finnish, Estonian, Udmurt, Mordvin and Sami also have a significant presence in Europe. The Turkic family also has several European members, while the North Caucasian and Kartvelian families which include Georgian, Circassian, Chechen and Abkhaz anong others are important in the southeastern extremity of geographical Europe. The Basque language of the western Pyrenees is an isolate unrelated to any other group, while Maltese is the only Semitic language in Europe with national language status, although Arabic, Hebrew and Neo-Aramaic dialects are spoken by migrant populations. The Kalmyk language, is a Mongolic language, spoken in Kalmykia, located directly north of the North Caucasus in Eastern Europe. The most spoken language of Europe is Russian, which belongs to the group of Slavic languages.
Languages that are not official state languages are protected in many European countries by the European Charter for Regional or Minority Languages. These can include languages spoken by relatively many people, such as Catalan and Basque in Spain, Frisian in the Netherlands, as well as languages spoken by relatively few such as Cornish, Manx and Scottish Gaelic in the United Kingdom, and Romansch in Switzerland.
Genetic origins
[edit]
Homo sapiens appeared in Europe roughly 40,000 years ago, with the settlement of the Cro-Magnons, followed by European hunter-gatherers and Early European Farmers (EEF). Over the prehistoric period there was continuous settlement in Europe, notably by the immediate descendants of the Proto-Indo-Europeans who migrated west after the advent of the Neolithic Revolution.[40]
Mitochondrial DNA and Y-chromosome DNA
[edit]Studies of mitochondrial DNA (mtDNA) have suggested substantial genetic homogeneity of European populations,[41] with only a few geographic or linguistic isolates appearing to be genetic isolates as well.[42] On the other hand, analyses of the Y chromosome[43][44] and of autosomal diversity[45] have shown a general gradient of genetic similarity running from the southeast to the northwest of the continent.
Autosomal DNA
[edit]
According to geneticist David Reich, based on ancient human genomes that his laboratory sequenced in 2016, Europeans formed from four West-Eurasian ancestral components in varying degrees: Western Hunter-Gatherers (WHG), Eastern Hunter-Gatherers (EHG), Neolithic Levant farmers and Neolithic Iranian farmers respectively.[47]
Population structure
[edit]A study in May 2009[48] that examined 19 populations from Europe using 270,000 single nucleotide polymorphisms (SNPs) highlighted the genetic diversity of European populations corresponding to the northwest to southeast gradient and distinguished "several distinct regions" within Europe:
- Finland
- the Baltic states (Estonia, Latvia and Lithuania), western Russia and Poland
- Central and Western Europe
- Italy, South-Eastern Europe, Southern Russia
In this study, Fst (fixation index) was found to correlate considerably with geographic distances ranging from ≤0.0010 for neighbouring populations to 0.0230 for Southern Italy and Finland. For comparisons, pair-wise Fst of non-European samples were as follows: Europeans – Yoruba (West Africans) 0.1530; Europeans – Chinese 0.1100; Yoruba (West Africans) – Chinese 0.1900.[48]: Table S2
See also
[edit]- Area and population of European countries
- Classical demography
- Demographics of the European Union
- Ethnic groups in Europe
- European diasporas
- European Union statistics
- Migration from Latin America to Europe
- List of cities in the European Union by population within city limits
- List of urban areas of the European Union
- List of European countries by population growth rate
- List of European countries by population
- List of metropolitan areas in Europe
- Medieval demography
- Demographics of the world
- List of countries by fertility rate
Notes
[edit]^ a: Continental regions as per UN categorisations/map. Depending on definitions, various territories cited below may be in one or both of Europe and Asia, or Africa.
^ b: Includes Transnistria, a region that has declared, and de facto achieved, independence; however, it is not recognised de jure by sovereign states.
^ c: Russia is considered a transcontinental country in Eastern Europe and Northern Asia. However, the population and area figures include the entire state.
^ d: Guernsey, the Isle of Man and Jersey are Crown Dependencies of the United Kingdom. Other Channel Islands in the Bailiwick of Guernsey include Alderney and Sark.
^ e: Cyprus is physiographically entirely in Western Asia, but it has strong historical and sociopolitical connections with Europe. The population and area figures refer to the entire state, including the de facto independent part Northern Cyprus.
^ f: Figures for Portugal include the Azores and Madeira archipelagos, both in Northern Atlantic.
^ g: Area figure for Serbia includes Kosovo, a province that unilaterally declared its independence from Serbia on 17 February 2008, and whose sovereign status is unclear. Population and density figures are 2010 estimates and are given without the disputed territory of Kosovo.
^ h: Figures for France include metropolitan France but not overseas departments and territories as they are not part of the European continent.
^ j: Kazakhstan is physiographically considered a transcontinental country in Central Asia (UN region) and Eastern Europe, with European territory west of the Ural Mountains and both the Ural and Emba rivers. However, area and population figures refer to the entire country.
^ k: Armenia is physiographically entirely in Western Asia, but it has strong historical and sociopolitical connections with Europe. The population and area figures include the entire state respectively.
^ m: Georgia is often considered a transcontinental country in Western Asia and Eastern Europe. However, the population and area figures include the entire state. This also includes Georgian estimates for Abkhazia and South Ossetia, two regions that have declared and de facto achieved independence. The International recognition, however, is limited.
^ o: The total figures for area and population includes the whole of the transcontinental countries. The precision of these figure is compromised by the ambiguous geographical extend of Europe and the lack of references for European portions of transcontinental countries.
^ p: Kosovo unilaterally declared its independence from Serbia on 17 February 2008. Its sovereign status is unclear. Its population is a 2007 estimate.
^ r: Abkhazia and South Ossetia unilaterally declared their independence from Georgia on 25 August 1990 and 28 November 1991 respectively. Their sovereign status is unclear. Population figures stated as of 2003 census and 2000 estimates respectively.
References
[edit]- ^ a b "World Population Prospects 2022". United Nations Department of Economic and Social Affairs, Population Division. Retrieved 17 July 2022.
- ^ a b "World Population Prospects 2022: Demographic indicators by region, subregion and country, annually for 1950–2100" (XSLX) ("Total Population, as of 1 July (thousands)"). United Nations Department of Economic and Social Affairs, Population Division. Retrieved 17 July 2022.
- ^ "Figure 8: Population by Total Fertility (millions)" in World Population Prospects, the 2010 Revision. United Nations, Department of Economic and Social Affairs, Population Division (2011)
- ^ Bocquet-Appel, Jean-Pierre; Demars, Pierre-Yves; Noiret, Lorette; Dobrowsky, Dmitry (November 2005). "Estimates of Upper Palaeolithic meta-population size in Europe from archaeological data". Journal of Archaeological Science. 32 (11): 1656–1668. Bibcode:2005JArSc..32.1656B. doi:10.1016/j.jas.2005.05.006.
- ^ Tallavaara, Miikka; Luoto, Miska; Korhonen, Natalia; Järvinen, Heikki; Seppä, Heikki (22 June 2015). "Human population dynamics in Europe over the Last Glacial Maximum". Proceedings of the National Academy of Sciences of the United States of America. 112 (27): 8232–8237. Bibcode:2015PNAS..112.8232T. doi:10.1073/pnas.1503784112. PMC 4500234. PMID 26100880.
- ^ "The first Europeans weren't who you might think". National Geographic. August 2019. Archived from the original on 19 March 2021.
- ^ Müller, Johannes (2015). "Eight Million Neolithic Europeans: Social Demography and Social Archaeology on the Scope of Change – Ffom the Near East to Scandinavia". Paradigm Found: Archaeological Theory – Present, Past and Future. Essays in Honour of Evžen Neustupný. Oxbow Books. doi:10.2307/j.ctvh1dpc1. ISBN 978-1-78297-770-4. JSTOR j.ctvh1dpc1.
- ^ a b Angus Maddison, The World Economy: Historical Statistics, Statistical Appendix (2007, ggdc.net). Estimates cited are for the beginning of the 1st millennium ("year 0"), the beginning of the 2nd millennium ("year 1000"), and for the beginning each century since the 16th (years 1820 and 1913 are given for the 19th and 20th century, respectively, as Maddison presents detailed estimates for these years), and a projection for the year 2030.
- ^ a b c d e f g h i j k l m n o p q r s t u v w x y z aa ab ac ad ae af ag ah ai aj ak al am an ao ap aq ar as at au av aw ax ay az ba bb bc bd be bf bg bh bi bj bk bl bm bn bo bp bq br bs bt bu bv bw bx by bz ca cb cc cd ce cf cg ch ci cj ck cl cm cn co cp cq cr cs ct cu cv cw cx cy cz da db dc dd de df dg dh di dj dk dl dm dn do dp dq dr ds dt du dv dw dx dy dz ea eb ec ed ee ef eg eh ei ej ek el em en eo ep eq er es et eu ev ew ex ey ez fa fb fc fd fe ff fg fh fi fj fk fl fm fn fo fp fq fr fs ft fu fv fw fx fy fz ga gb gc gd ge gf gg gh gi gj gk gl gm gn go gp gq gr gs gt gu gv gw gx gy gz ha hb hc hd he hf hg hh hi hj hk hl hm hn ho hp hq hr hs ht hu hv hw hx hy hz ia ib ic id ie if ig ih ii ij ik il im in io ip iq ir is it iu iv iw ix iy iz ja jb jc jd je jf jg jh ji jj jk jl jm jn jo jp jq jr js jt ju jv jw jx jy jz ka kb kc kd ke kf kg kh ki kj kk kl km kn ko kp kq kr ks kt ku kv kw kx ky kz la lb lc ld le lf lg lh li lj lk ll lm ln lo lp lq lr ls lt lu lv lw lx ly lz ma mb mc md me mf mg mh mi mj mk ml mm mn mo mp mq mr ms mt mu mv mw mx my mz na nb nc nd ne nf ng nh ni nj nk nl nm nn no np nq nr ns nt nu nv nw nx ny nz oa ob oc od oe of og oh oi oj ok ol om on oo op oq or os ot ou ov ow ox oy oz pa pb pc pd pe pf pg ph pi pj pk pl pm pn po pp pq pr ps pt pu pv pw px py pz qa qb qc qd qe qf qg qh qi qj qk ql qm qn qo qp qq qr qs qt qu qv qw qx qy qz ra rb rc rd re rf rg rh ri rj rk rl rm rn ro rp rq rr rs rt ru rv rw rx ry rz sa sb sc sd se sf sg sh si sj sk sl sm sn so sp sq sr ss st su sv sw sx sy sz ta tb tc td te tf tg th ti tj tk tl tm tn to tp tq tr ts Maddison. "Growth of World Population, GDP and GDP Per Capita before 1820" (PDF). Archived from the original (PDF) on 28 June 2007. Retrieved 27 July 2016.
- ^ "Europe Population (LIVE)". worldometers.info.
- ^ Charles Morris, ed. (1916). Winston's Cumulative ...: Encyclopedia; a Comprehensive Reference Book, Volume 4. John C. Winston Company. Retrieved 17 May 2014.
- ^ a b c "World Population Prospects: The 2017 Revision". UN – Department of Economic and Social Affairs. Retrieved 27 January 2018.
- ^ "Eurostat: Population on 1 January". European Commission. Retrieved 27 January 2018.
- ^ Population in million: Albania 2.9, Belarus 9.5, Bosnia and Herzegovina 3.5, Iceland 0.3, Moldova 4.1, North Macedonia 2.1, Norway 5.2, Serbia and Kosovo 8.9, Switzerland 8.3, Ukraine 44.7.
- ^ Population in million: Armenia 2.9, Georgia 4.0, Kazakhstan 17.8, Russia 144, Turkey 78.3.
- ^ "World Population Prospects – Population Division – United Nations". Population Division – United Nations. Retrieved 13 July 2022.
- ^ "FOLK1AM: Population at the first day of the month by region, sex and age". Statistics Denmark. Retrieved 25 November 2025. Click on "SHOW TABLE" at lower right to execute search.
- ^ "United Nations Statistics Division – Demographic and Social Statistics". United Nations. Retrieved 18 July 2021.
- ^ United Nations Population Division, World Population Prospects: The 2004 Revision Highlights. 2005
- ^ "Record drop in children being born in the EU in 2023". Eurostat (official website of the European Union). 7 March 2025. Archived from the original on 6 September 2025. ● Direct link to data: Eurostat (2022). "Fertility indicators". Eurostat. doi:10.2908/DEMO_FIND. Retrieved 13 December 2025.
- ^ a b "How many children were born in 2020?". Eurostat. 28 April 2022. Retrieved 22 February 2023.
- ^ "Italia, crollo natalità – In dieci anni i nuovi nati scendono del 25%. Ecco i motivi" [Italy, birth rate collapse – In ten years, newborns drop by 25%. The study]. Torino News 24 (in Italian).
- ^ "Discrimination in the European Union". Special Eurobarometer. 493. European Commission. 2019. Retrieved 2 June 2020.
- ^ "Special Eurobarometer, biotechnology, page 204" (PDF). 2010. Archived from the original (PDF) on 15 December 2010.
- ^ "Census 2011". Humanism.org.uk. 17 September 2012. Retrieved 19 January 2014.
- ^ "BBC News – At-a-glance: Census 2011 findings". BBC. 11 December 2012. Retrieved 19 January 2014.
- ^ "Global Christianity". Pewforum.org. 19 December 2011. Archived from the original on 26 December 2018. Retrieved 19 January 2014.
- ^ "The Global Religious Landscape: Christians". Pewforum.org. 18 December 2012. Retrieved 19 January 2014.
- ^ a b Christianity in Europe Archived 4 January 2012 at the Wayback Machine, excluding the Asian part of Russia, including the European part of Turkey
- ^ "The Global Religious Landscape" (PDF). Pewforum.org. Archived from the original (PDF) on 25 January 2017. Retrieved 7 May 2020.
- ^ a b Zurlo, Gina; Skirbekk, Vegard; Grim, Brian (2019). Yearbook of International Religious Demography 2017. BRILL. p. 85. ISBN 978-90-04-34630-7.
- ^ Ogbonnaya, Joseph (2017). African Perspectives on Culture and World Christianity. Cambridge Scholars Publishing. pp. 2–4. ISBN 978-1-4438-9159-2.
- ^ Dogan, Mattei, Religious Beliefs in Europe: Factors of Accelerated Decline, 2003
- ^ a b "Religiously Unaffiliated". Pewforum.org. 18 December 2012. Archived from the original on 30 July 2013. Retrieved 11 January 2018.
- ^ "Discrimination in the EU in 2012" (PDF). Special Eurobarometer. 383. European Union: European Commission: 233. 2012. Archived from the original (PDF) on 2 December 2012. Retrieved 14 August 2013.
- ^ "Discrimination in the EU in 2012" (PDF), Special Eurobarometer, 383, European Union: European Commission, p. 233, 2012, archived from the original (PDF) on 2 December 2012, retrieved 14 August 2013 The question asked was "Do you consider yourself to be...?" With a card showing: Catholic, Orthodox, Protestant, Other Christian, Jewish, Muslim, Sikh, Buddhist, Hindu, Atheist, and Non-believer/Agnostic. Space was given for Other (SPONTANEOUS) and DK. Jewish, Sikh, Buddhist, Hindu did not reach the 1% threshold.
- ^ Christoph Pan, Beate Sibylle Pfeil,Minderheitenrechte in Europa. Handbuch der europäischen Volksgruppen (2002). [missing], English translation 2004.
- ^ "Roma integration in the EU". European Commission.
- ^ Pan, Christoph; Pfeil, Beate S. (2003). "The Peoples of Europe by Demographic Size, Table 1". National Minorities in Europe: Handbook. Wien: Braumueller. p. 11f. ISBN 978-3-7003-1443-1. (a breakdown by country of these 87 groups is given in Table 5, pp. 17–31.)
- ^ Encyclopædia Britannica, s.v. "Europe : The people".
- ^ Torroni A, Achilli A, Macaulay V, Richards M, Bandelt HJ (2006): "Harvesting the fruit of the human mtDNA tree". Trends in Genetics 22: 339–345.
- ^ Simoni L, Calafell F, Pettener D, Bertranpetit J, Barbujani G (2000): "Geographic patterns of mtDNA diversity in Europe". American Journal of Human Genetics 66: 262–278.
- ^ Chikhi L, Nichols RA, Barbujani G, Beaumont MA (2002): "Y genetic data support the Neolithic demic diffusion model". Proceedings of the National Academy of Sciences of the United States of America 99: 11008–11013.
- ^ Roewer L, Croucher PJ, Willuweit S, Lu TT, Kayser M, et al. (2005): "Signature of recent historical events in the European Y-chromosomal STR haplotype distribution". Human Genetics 116: 279–291.
- ^ Barbujani G, Goldstein DB (2004): "Africans and Asians abroad: genetic diversity in Europe". Annual Review of Genomics and Human Genetics 5: 119–150.
- ^ The HUGO Pan-Asian SNP Consortium; Abdulla, Mahmood Ameen; Ahmed, Ikhlak; Assawamakin, Anunchai; Bhak, Jong; et al. (11 December 2009). "Mapping Human Genetic Diversity in Asia". Science. 326 (5959): 1541–1545. Bibcode:2009Sci...326.1541.. doi:10.1126/science.1177074. ISSN 0036-8075. PMID 20007900. S2CID 34341816.
- ^ Lazaridis, Iosif; et al. (2016). "Genomic insights into the origin of farming in the ancient Near East" (PDF). Nature. 536 (7617): 419–424. Bibcode:2016Natur.536..419L. doi:10.1038/nature19310. PMC 5003663. PMID 27459054. Retrieved 18 April 2018.
bottom-left: Western Hunter Gatherers (WHG), top-left: Eastern Hunter Gatherers (EHG), bottom-right: Neolithic Levant and Natufians, top-right: Neolithic Iran. This suggests the hypothesis that diverse ancient West Eurasians can be modelled as mixtures of as few as four streams of ancestry related to these population
- ^ a b Nelis, Mari; Esko, Tõnu; Mägi, Reedik; Zimprich, Fritz; Zimprich, Alexander; et al. (8 May 2009). "Genetic Structure of Europeans: A View from the North–East". PLOS ONE. 4 (5) e5472. Bibcode:2009PLoSO...4.5472N. doi:10.1371/journal.pone.0005472. ISSN 1932-6203. PMC 2675054. PMID 19424496.
| Authority control databases: National |
|---|
Demographics of Europe
View on GrokipediaGeographical and Total Population Overview
Current Total Population and Regional Variations
As of 2026, Europe's total population is estimated at approximately 743 million people, encompassing 51 sovereign states and several dependencies, with transcontinental nations such as Russia included in full despite partial Asian territory.[2] Live estimates elaborated from United Nations data indicate 743,944,150 as of February 28, 2026.[2] The United Nations World Population Prospects (2024 Revision, medium variant) projects 743,482,361 for July 1, 2026.[3] This figure reflects a slight decline from previous years due to sub-replacement fertility and aging demographics across the continent, though net migration has partially offset natural decrease in some areas.[9] Population distribution exhibits significant regional variations, with Eastern Europe holding the largest share at approximately 284 million inhabitants (38% of the total), driven primarily by Russia's 144 million residents.[9] Western Europe accounts for about 200 million (27%), Southern Europe around 151 million (20%), and Northern Europe roughly 109 million (15%), highlighting denser concentrations in the west and south compared to sparser northern and eastern peripheries excluding Russia.[10] The European Union, a subset excluding non-members like Russia and the United Kingdom, numbered 449 million as of January 2024, with projections indicating minimal growth into 2025.[4] The most populous countries underscore these disparities:| Rank | Country | Population (2025 est.) |
|---|---|---|
| 1 | Russia | 143,997,393 |
| 2 | Germany | 84,075,075 |
| 3 | United Kingdom | 69,551,332 |
| 4 | France | 66,650,804 |
| 5 | Italy | 58,653,529 |
| 6 | Spain | 47,889,958 |
| 7 | Ukraine | 37,921,642 |
| 8 | Poland | 37,636,159 |
| 9 | Romania | 18,908,650 |
| 10 | Netherlands | 17,614,682 |
Population Density, Urbanization, and Settlement Patterns
Europe exhibits significant variations in population density, influenced by geography, historical settlement, and economic development. The European Union (EU) recorded an average density of 109 persons per square kilometer in 2023, ranging from 18 inhabitants per km² in Finland to 1,766 in Malta.[4] For the broader European continent, including non-EU countries like Russia and Norway, the average density approximates 70 persons per km², lowered by vast low-density regions in northern and eastern Europe such as Siberia's European portion and Scandinavian interiors.[12] High-density zones concentrate in the Benelux countries, the Po Valley, and the Rhine-Ruhr area, exceeding 400 persons per km², while mountainous and Arctic areas remain under 10 persons per km².[13] Urbanization in Europe has progressed rapidly since the Industrial Revolution, with about 75% of the EU population living in urban areas as of 2023.[14] This figure reflects a blend of densely populated cities (39% of EU residents), surrounding towns and suburbs (around 37%), and rural areas (24%), per Eurostat's degree of urbanization classification in 2021.[15] Urban growth continues, driven by migration to economic hubs, though rates vary: Belgium reaches 98% urbanization, while Romania and Latvia hover below 55%.[16] Across Europe, urbanization stands similarly high at roughly 74%, with slower rural depopulation in eastern and southern peripheries compared to western cores.[17] Settlement patterns in Europe display regional diversity shaped by terrain, climate, and agrarian history. In northwestern Europe, dispersed farmsteads predominate in countries like Denmark and Ireland, facilitating individual land holdings. Central Europe features nucleated villages with clustered housing around communal facilities, as seen in Germany's large rural agglomerations housing thousands.[18] Southern Europe often shows linear settlements along coastlines or rivers, with compact hilltop towns in Italy and Spain for defense and water access. Urban patterns emphasize polycentric networks, with primate cities like Paris (12.6 million metro) and Moscow (20 million) dominating, alongside secondary clusters in the Randstad and Ruhr Valley; recent trends include suburban expansion and counter-urbanization in affluent regions, though overall rural populations decline due to aging and out-migration.[19]Historical Population Development
Prehistoric and Ancient Population Foundations
The earliest modern human (Homo sapiens) populations in Europe trace back to migrations from Africa via the Near East, with evidence of settlement around 45,000 years ago, coinciding with the regional extinction of Neanderthals through competition, assimilation, or displacement.[20] These Upper Paleolithic hunter-gatherers, adapted to Ice Age conditions, exhibited genetic profiles distinct from later groups, with low population densities estimated at fewer than 10,000 individuals continent-wide during glacial maxima due to harsh climates limiting foraging.[21] Post-Last Glacial Maximum repopulation around 15,000–10,000 years ago involved westward expansions from refugia in southern Europe (e.g., Franco-Cantabrian and Balkan regions), establishing Western Hunter-Gatherer (WHG) ancestry that contributed 10–20% to modern European genomes, primarily through dark-skinned, blue-eyed adaptations suited to low-light northern latitudes.[22] The Neolithic Revolution transformed Europe's demographic foundations starting approximately 8,000 years ago, as Early European Farmers (EEF) migrated northwest from Anatolia and the Levant, introducing agriculture, domesticated animals, and sedentary villages that supported population growth from sparse hunter-gatherer bands to densities of up to 1–5 individuals per square kilometer in fertile zones.[23] Genetic analyses reveal EEF replaced or admixed with ~70–90% of local WHG in central and southern Europe, evidenced by Y-chromosome haplogroups like G2a and mitochondrial DNA shifts, though interbreeding occurred along migration fronts, with farmer ancestry now comprising 40–60% of southern European heritage but less in the north due to later overlays.[24] This influx, driven by technological superiority in food production rather than conquest alone, laid the groundwork for denser settlements but also introduced selection pressures for lactose tolerance and lighter skin via gene flow.[25] By the Bronze Age, around 5,000–4,000 years ago, a third ancestral wave from Yamnaya steppe herders of the Pontic-Caspian region—mobile pastoralists with wheeled vehicles, horses, and metalworking—profoundly reshaped northern and central European demographics through rapid expansions correlating with Indo-European language dispersal.[26] Ancient DNA indicates these migrants contributed 30–50% of ancestry to Corded Ware cultures in Germany and Scandinavia, often via male-biased replacement (e.g., R1b haplogroup dominance), with models estimating influxes of thousands replacing up to 75% of local male lineages in some areas, reflecting violent or competitive dynamics over resource-rich pastures.[27] This steppe component, blending Eastern Hunter-Gatherer and Caucasus elements, established patrilineal clans that influenced social structures and genetic diversity, forming the tripartite foundation (WHG, EEF, Steppe) underlying most modern European populations, with variations by region—higher steppe input northward, farmer dominance southward.[28] These prehistoric shifts underscore migration as the primary driver of Europe's genetic heterogeneity, rather than in situ evolution.[29]Medieval to Early Modern Expansions and Shifts
The population of Europe following the collapse of the Western Roman Empire in the 5th century underwent significant contraction and reorganization, with estimates placing the total at roughly 25-35 million by around 1000 AD, reflecting depopulation in former imperial heartlands and the integration of migrant groups such as Germanic tribes into rural economies.[30] Large-scale migrations, including Slavic expansions into Central and Eastern Europe during the 6th-7th centuries, introduced genetic and linguistic shifts that homogenized populations in regions like Poland and the Balkans, displacing or assimilating earlier Indo-European groups and contributing to a more fragmented demographic mosaic.[31] These movements, combined with Viking raids and settlements in the North and Magyar incursions in the 9th-10th centuries, facilitated localized population redistributions but did not substantially alter overall continental numbers, as warfare and instability limited net growth.[32] From the 11th to early 14th centuries, the High Middle Ages saw robust expansion driven by agricultural innovations—including the heavy plow, three-field rotation, and assarting of forests—which boosted caloric output and supported population growth to an estimated 70-80 million by 1300, with density increasing particularly in fertile river valleys and cleared uplands.[33] Internal colonizations, such as the German Ostsiedlung into Slavic-held territories east of the Elbe from the 12th century onward, redistributed millions of settlers, fostering ethnic German enclaves in Prussia, Silesia, and Pomerania while altering land use from subsistence to commercial farming.[32] Urban nucleation accelerated modestly, with cities like Paris and London surpassing 50,000 inhabitants by 1300, though over 90% of the population remained rural and agrarian, vulnerable to climatic fluctuations like the Medieval Warm Period's end.[34] The arrival of the Black Death in 1347-1351 triggered the most acute demographic reversal in European history, exterminating approximately 40% of the population—equating to 25-30 million deaths—through Yersinia pestis transmission via fleas and trade routes, with mortality rates exceeding 50% in densely settled areas like Tuscany and England.[35] Successive plague waves until the early 15th century compounded labor shortages, eroded feudal structures by elevating surviving peasants' bargaining power, and spurred short-term shifts toward pastoralism over arable farming in affected regions.[36] Recovery commenced unevenly in the 15th century, hampered by the Little Ice Age's cooler temperatures from circa 1450, which reduced harvests and amplified famine risks, yet southern Europe—less ravaged by recurrent outbreaks—rebounded faster than the north.[30] By 1500, Europe's population had partially reconstituted to about 60-70 million, setting the stage for early modern acceleration as New World introductions like the potato and maize enhanced food security post-1492, while declining plague virulence and proto-industrial trade networks mitigated mortality.[30] From 1500 to 1750, numbers nearly doubled to over 140 million, propelled by falling infant mortality in northwestern Europe due to wet-nursing and sanitation improvements, alongside enclosure movements that intensified agricultural productivity.[30] Ottoman advances into the Balkans during the 14th-17th centuries displaced Christian populations northward, inducing refugee flows and ethnic stratifications, such as Albanian migrations, that persisted into modern border configurations.[32] These shifts underscored a transition from medieval stasis to dynamic growth, laying foundations for urbanization and overseas emigration, though wars like the Thirty Years' War (1618-1648) inflicted localized depopulation exceeding 20% in the Holy Roman Empire.[37]Industrial Revolution and 19th-20th Century Growth
The population of Europe experienced rapid expansion during the Industrial Revolution and the subsequent 19th and early 20th centuries, marking the onset of the demographic transition characterized by declining mortality rates amid sustained high fertility. In 1800, Europe's population stood at approximately 180 million, more than doubling to 390 million by 1900.[38] This growth averaged around 0.7% annually, outpacing previous centuries and driven primarily by internal factors rather than net immigration. Key contributors included agricultural innovations from the prior Agricultural Revolution, such as crop rotation, enclosure movements, and the widespread adoption of nutrient-dense staples like the potato, which enhanced food security and reduced famine frequency across regions from Britain to Eastern Europe.[39] [40] The spread of industrialization from Britain in the 1760s to continental Europe by the mid-19th century further accelerated demographic shifts through economic expansion and urbanization. Factory-based production created demand for labor, drawing rural populations into burgeoning cities; by 1900, urban dwellers comprised about 30-40% of Europe's population in Western countries like Germany and Britain, up from under 20% in 1800.[39] Public health measures, including smallpox vaccination campaigns starting in the 1790s and urban sanitation reforms post-1850s cholera epidemics, significantly lowered infant and child mortality—falling from over 200 per 1,000 live births in early 19th-century England to around 100 by 1900.[41] Fertility rates remained elevated at 4-6 children per woman until the late 19th century, sustaining natural increase despite initial industrial hardships like overcrowding and poor working conditions.[38] Into the 20th century, growth persisted at a moderated pace, reaching roughly 450 million by 1914, though interrupted by World War I (1914-1918), which caused 15-20 million excess deaths from combat, disease, and famine, and the 1918-1919 influenza pandemic, which killed an estimated 50 million globally but disproportionately affected Europe.[40] Post-war recovery, bolstered by medical advances like antibiotics in the 1920s-1930s and ongoing fertility above replacement levels in much of Southern and Eastern Europe, restored momentum; by 1939, the population neared 550 million.[42] Regional disparities emerged, with Northwestern Europe transitioning earlier to lower fertility (e.g., France's rate dropping below 3 by 1900), while Eastern Europe maintained higher growth until mid-century.[38] This era's net increase reflected causal links between technological progress, reduced epidemiological pressures, and demographic momentum, rather than exogenous shocks.Post-World War II Recovery and Division
World War II resulted in approximately 40 million deaths across Europe, including military and civilian casualties, with the Soviet Union alone losing around 27 million people and Poland about 6 million.[43] These losses, combined with wartime destruction, temporarily halted population growth in many regions.[43] Between 1944 and 1950, Europe experienced the largest forced population movements in its history, with roughly 12 million ethnic Germans expelled from territories in Poland, Czechoslovakia, and other Eastern European countries, primarily resettling in West Germany.[44] Additional displacements included about 2 million Poles relocated from eastern areas annexed by the Soviet Union to former German territories in western Poland, contributing to ethnic homogenization along new post-war borders.[44] These transfers, often involving violence and hardship, reshaped national demographics, with West Germany absorbing over 8 million expellees, increasing some local populations by more than 20 percent.[45][46] In Western Europe, recovery accelerated through a post-war baby boom, with total fertility rates rising to an average of about 2.6 children per woman by the mid-1950s, driven by economic optimism, delayed marriages from the war, and improved living standards aided by the Marshall Plan.[47] This natural increase, alongside limited immigration, offset war losses and supported population growth rates exceeding 1 percent annually in many countries during the 1950s.[43] Eastern Europe saw a similar but more muted fertility rebound, hampered by ongoing reconstruction challenges, male shortages from war deaths, and early communist policies emphasizing industrialization over family support, resulting in stagnation or slower growth in nations like Hungary and Romania from 1939 to 1950.[43] The Iron Curtain's division from 1947 onward entrenched demographic divergences: Western economies experienced rapid urbanization and workforce expansion, fostering sustained growth, while Eastern Bloc countries faced emigration pressures—over 3 million left East Germany for the West before the 1961 Berlin Wall—exacerbating labor shortages and constraining population dynamics until the 1970s.[43] By 1960, Europe's total population had recovered to approximately 604 million, reflecting the combined effects of high birth rates and stabilized mortality, though with persistent East-West disparities in age structures and growth trajectories.[43]Vital Statistics and Natural Population Change
Birth Rates, Fertility Trends, and Native Declines
The total fertility rate (TFR) across the European Union averaged 1.38 live births per woman in 2023, well below the replacement level of 2.1 required for long-term population stability absent migration.[48] [4] This marked a decline from 1.53 in 2019 and reflected 3.67 million live births, the lowest since 1961 and a 5.4% drop from 2022.[49] [48] Postponement of childbearing contributed to the trend, with the mean age at first birth reaching 29.8 years in 2023, up from earlier decades and correlating with fewer overall births due to compressed reproductive windows.[48] Fertility trends since 2000 show initial stability or slight recovery in some regions—peaking near 1.6 in parts of the EU around 2008—followed by consistent declines amid economic pressures, rising child-rearing costs, and cultural shifts toward smaller families.[48] By 2022, EU-wide variation persisted, with France at 1.79 and Malta at 1.08, while Southern and Eastern European countries like Italy (1.24) and Spain (1.16) recorded among the lowest rates.[50] United Nations projections for Europe indicate sustained sub-replacement fertility through 2050, with regional TFR estimates around 1.5 by mid-century, driven by persistent low completed cohort fertility among women born after 1970.[51] Native European populations exhibit even lower fertility than aggregate figures, as total TFRs incorporate higher rates among immigrants from high-fertility origins, masking steeper declines among indigenous groups.[52] In France, for example, native-born women averaged 1.8 children in 2017 versus 2.6 for immigrants, yet the national total remained propped up by the latter's contributions despite comprising only 13% of the female population.[53] Across 31 European countries, native-born natural population change stood at -29 per 10,000 inhabitants, reflecting fertility insufficient to offset aging-related mortality, while foreign-born groups showed positive balances.[54] This disparity results in absolute native declines: without net immigration, core European populations would contract by 0.5-1% annually in many nations, as births fall short of deaths among natives aged 45 and older.[54] [3] Such trends accelerate native cohort shrinkage, with second- and third-generation descendants of post-1960s cohorts projected to dwindle by 20-30% per generation in low-fertility states like Germany and Italy, based on observed completed fertility below 1.5.[55] Empirical data from national registries confirm this, as native women in Western Europe increasingly forgo second or third births, with period TFRs for non-immigrant groups dipping under 1.4 in countries like Sweden and the Netherlands by 2020.[56] Policies aimed at boosting native fertility—such as child allowances or parental leave—have yielded marginal gains, insufficient to reverse declines, as evidenced by stalled rebounds post-2008 financial crisis.[48] Consequently, native Europeans face intergenerational contraction, heightening reliance on younger cohorts for labor and care systems.[54]| Country/Region | Total TFR (2022) | Estimated Native TFR (Recent) |
|---|---|---|
| EU Average | 1.46 | ~1.3-1.4 |
| France | 1.79 | 1.8 (2017) |
| Italy | 1.24 | <1.3 |
| Sweden | 1.52 | ~1.5 (2020) |
Mortality Rates, Life Expectancy, and Health Factors
In the European Union, life expectancy at birth reached 81.5 years in 2023, an increase of 0.9 years from 2022, surpassing pre-pandemic levels from 2019.[57] This figure breaks down to 84.0 years for women and 78.7 years for men, reflecting a persistent gender gap of 5.3 years driven by higher male mortality from cardiovascular diseases, accidents, and external causes.[57] Across broader Europe, including non-EU countries, life expectancy varies significantly, with Western nations like Spain and Italy exceeding 83 years while Eastern countries such as Bulgaria and Latvia lag below 75 years, attributable to differences in healthcare access and lifestyle risks.[58] The crude death rate in the EU stood at 10.8 deaths per 1,000 population in 2023, down from 11.9 in 2021 amid COVID-19 peaks but above the 10.4 recorded in 2019.[59] Infant mortality averaged 3.2 deaths per 1,000 live births, with the lowest rates in Slovenia and Estonia (under 2.0) and highest in Romania and Slovakia (5.6), highlighting disparities in neonatal care and socioeconomic conditions.[59] [60] Circulatory diseases accounted for 32.7% of EU deaths in 2022, followed by cancers at 22.3%, underscoring non-communicable diseases as dominant mortality drivers.[61] Behavioral factors exert substantial influence: smoking reduces male life expectancy by up to 3.4 years on average, obesity by 1.3 years, and alcohol by 1.8 years, with combined effects potentially adding 5.8 years for men and 2.3 years for women absent these risks.[62] Eastern Europe's lower life expectancy partly stems from higher prevalence of these factors, including elevated smoking rates among men and poorer obesity management, though improvements in Western Europe have narrowed some gaps through public health interventions.[63] Healthy life years at birth averaged 63.1 years in the EU in 2023, indicating that while total lifespan has extended, quality-adjusted expectancy remains constrained by chronic conditions linked to aging populations and modifiable risks.[64]Natural Population Increase: Patterns and Disparities
In the European Union, natural population increase—calculated as the excess of births over deaths—has been negative since 2012, with deaths exceeding births by 1.3 million in 2024 (3.56 million births versus 4.82 million deaths).[65][66] This pattern reflects a broader continental trend where low fertility rates, averaging below the replacement level of 2.1 children per woman, combine with elevated mortality from an aging population structure.[13][7] The EU's total fertility rate stood at 1.46 live births per woman in 2022, with provisional data indicating further declines in most member states by 2023.[48][13] Temporal patterns reveal a post-2010 acceleration in negative natural change, exacerbated by the COVID-19 pandemic's temporary mortality spike, though the underlying drivers predate it: sustained sub-replacement fertility since the 1970s and cohort aging leading to higher death rates among post-World War II baby boomers.[66][67] Across Europe, crude birth rates hover around 8-10 per 1,000 population, while crude death rates range from 10-14 per 1,000, yielding net natural decrease rates of -0.2% to -1% annually in most countries.[68] Positive exceptions persist in select Western and Northern states, such as Ireland (0.4% natural increase rate) and Iceland (0.5%), supported by relatively higher fertility (e.g., Ireland's total fertility rate near 1.7) and robust family support policies.[68][13] Disparities are stark along regional lines, with Eastern and Southern Europe experiencing the most severe negative natural change due to compounded low fertility (often below 1.3 children per woman) and rapid aging.[7] In 2024, only six EU countries—Ireland, Spain, Cyprus, Luxembourg, Malta, and Sweden—recorded positive natural increases, while nations like Latvia (-0.7%), Lithuania (-0.8%), and Bulgaria faced declines exceeding -1% of their populations.[66][68] These gaps correlate with economic development and policy variances: higher-fertility outliers like France (1.79 total fertility rate in 2022) benefit from pronatalist measures such as child allowances and parental leave, whereas Eastern states grapple with emigration-driven labor shortages amplifying demographic strain.[13][67] Projections indicate Eastern and Southern regions will see the sharpest natural decreases through 2050, potentially -20% or more without migration offsets.[7]| Region/Example Countries | Approx. Natural Increase Rate (Recent Annual Avg.) | Key Factors |
|---|---|---|
| Western/Northern (e.g., Ireland, France, Sweden) | +0.1% to +0.5% | Higher fertility (1.6-1.8 TFR), family policies |
| Eastern (e.g., Latvia, Lithuania, Bulgaria) | -0.7% to -1.0% | Very low fertility (<1.4 TFR), high mortality from aging |
| Southern (e.g., Italy, Greece) | -0.3% to -0.6% | Sub-1.3 TFR, increasing death rates |
International Migration Dynamics
Recent Net Migration Flows and Policy Contexts
In the European Union, net migration has been the primary driver of population stability and modest growth since the mid-2010s, offsetting persistent negative natural change. Eurostat data indicate net migration of +1.2 million in 2021, increasing to levels around +2.3 million by 2024, with intermediate years reflecting heightened inflows. This net positive balance stems from immigration exceeding emigration by substantial margins, particularly after disruptions from the COVID-19 pandemic reduced flows in 2020-2021.[66][69] Immigration from non-EU countries surged to 5.1 million in 2022—more than double the 2.4 million in 2021—before easing to 4.3 million in 2023, excluding certain temporary protections but inclusive of broader asylum and labor entries. Emigration to non-EU destinations totaled about 1.5 million in 2023, up 25% from 2022, yielding a net migration estimate of approximately +2.9 million when accounting for intra-EU movements (1.5 million each way) and minor unknown origins. Major contributors included over 4 million Ukrainians granted temporary protection following Russia's February 2022 invasion, alongside asylum seekers from Syria, Afghanistan, and sub-Saharan Africa, and economic migrants from India, Morocco, and Turkey. Principal destinations were Germany (1.3 million immigrants in 2023), Spain, France, and Italy, with rates highest in Malta and Cyprus.[70][69] Policy responses have increasingly emphasized restriction and externalization to manage these flows, reflecting political shifts in several member states toward prioritizing border security and integration enforcement. The EU's Pact on Migration and Asylum, adopted in May 2024, mandates faster screening at borders (within 7 days), accelerated asylum decisions, mandatory solidarity mechanisms for relocating or funding migrant reception, and enhanced returns, with phased implementation beginning in 2026. Nationally, Denmark has limited family reunifications and migrant benefits since 2021; Sweden reversed expansive policies post-2022 elections by tightening asylum criteria; Italy secured deals with Tunisia and Libya in 2023-2024 to reduce Mediterranean crossings via patrol funding; and Germany suspended subsidiary protections and expanded deportations in 2024. These efforts, combined with external partnerships like aid to Egypt and Mauritania, correlated with irregular arrivals peaking at over 380,000 in 2023 before falling sharply—by over 50% in some routes—through 2025.[71][72][73]Migrant Origins, Destinations, and Demographic Contributions
In 2023, the European Union received 4.3 million immigrants from non-EU countries, representing the primary sources of external inflows, with additional intra-EU mobility contributing to total immigration of 5.9 million.[74][4] Major origin countries included Ukraine (driven by the ongoing conflict), Syria, Afghanistan, Morocco, India, and Turkey, reflecting a mix of conflict-related displacement, economic migration, and family reunification.[6] Among non-EU citizens residing in the EU as of January 2024, Ukrainians, Turks, and Moroccans formed the largest groups, underscoring concentrations from Eastern Europe, the Middle East, North Africa, and South Asia.[6] These patterns align with broader trends where sub-Saharan Africa and Muslim-majority nations in the Middle East and North Africa have increasingly contributed to flows since the 2010s, often via irregular routes across the Mediterranean.[75] Primary destinations for these migrants are concentrated in Western and Northern Europe, with Germany receiving the largest absolute number of immigrants in 2023, followed by France, Spain, and Italy.[69] As of January 2024, Germany hosted 16.9 million foreign-born residents, France 9.3 million, and these countries accounted for over half of the EU's 44.7 million non-EU-born individuals, who comprised 9.9% of the total EU population.[6][76] Smaller nations like Malta and Luxembourg exhibited the highest immigration rates relative to population size, at 76 and elevated levels per 1,000 residents, respectively, often due to labor demands and geographic positioning.[74] Eastern European countries, such as Poland, have seen surges primarily from Ukrainian refugees, hosting over 1.5 million by 2023, though net migration remains lower compared to Western hubs.[75]| Country | Foreign-Born Population (millions, 2024) | Share of National Population (%) |
|---|---|---|
| Germany | 16.9 | ~20 |
| France | 9.3 | ~14 |
| Spain | ~8 (est.) | ~17 |
| Italy | ~6 (est.) | ~10 |
| EU Total Non-EU Born | 44.7 | 9.9 |
Long-Term Impacts on Total Population Growth
International migration sustains Europe's total population levels amid structural natural decline, with net inflows projected to offset an estimated 57 million excess of deaths over births by 2050 across the continent.[81] Under the United Nations' medium-variant assumptions in World Population Prospects 2024, which incorporate continued moderate net migration alongside rising life expectancy and slowly converging fertility among migrant descendants, Europe's population—estimated at approximately 748 million in 2024—reaches a peak around mid-century before a gradual decline to roughly 710 million by 2100.[3] Without net migration, projections indicate a sharper contraction exceeding one-third, potentially to under 600 million by century's end, highlighting migration's role as the dominant factor in averting absolute depopulation.[82] For the European Union specifically, Eurostat's deterministic projections assume fertility stabilizing near 1.5 children per woman, mortality improvements extending life expectancy to 87 years by 2100, and net migration averaging levels observed over prior decades, yielding a cumulative migrant contribution of 98.1 million persons against a natural decrease of about 125 million, for an overall EU population reduction of 27.3 million over the projection horizon.[83] These inflows, predominantly from non-EU origins including Africa, Asia, and the Middle East, prevent steeper declines but do not fully counteract aging, as second-generation migrant fertility trends toward native lows, limiting long-term demographic momentum.[84] The United Nations' Replacement Migration analysis underscores that maintaining Europe's 1995 population size would require annual net inflows escalating to hundreds of thousands, rising to millions for preserving working-age ratios, a scale deemed unsustainable given integration challenges and potential policy restrictions on low-skilled entries.[85] Consequently, while migration has enabled modest net growth in recent decades—such as the EU's addition of 1.07 million residents in 2024, driven by 2.3 million net migrants—projections forecast reliance on volatile flows, vulnerable to geopolitical shifts, economic pull factors, and domestic restrictions, potentially amplifying future declines if inflows diminish.[86][3]Age and Dependency Structure
Current Age Pyramids and Cohort Distributions
Europe's population age pyramid in the mid-2020s displays a constricted base, reflecting sustained sub-replacement fertility rates averaging below 1.5 children per woman since the late 20th century, coupled with a pronounced bulge in the middle-to-upper working-age and early elderly cohorts from the post-World War II baby boom.[3] This structure transitions into an expanding apex among the oldest age groups, driven by life expectancies exceeding 78 years across much of the continent.[87] The United Nations World Population Prospects 2024 estimates Europe's median age at approximately 43 years, with subregional variations: Northern and Western Europe around 41-42 years, while Southern and Eastern Europe exceed 44 years.[3] In the European Union specifically, which accounts for over half of Europe's total population, the median age stood at 44.7 years on January 1, 2024, up from 42.6 years a decade prior.[87] Broad age group distributions underscore the aging trend: 14.6% aged 0-14, 63.8% aged 15-64, and 21.6% aged 65 and over.[87] The baby boom generation, born primarily between 1946 and 1964 and now aged 60-78, constitutes one of the largest cohorts, forming a rhomboid expansion in the pyramid around ages 55-75, with their high survival rates amplifying the elderly segment.[87] Younger cohorts, particularly those born after 1990 (now under 35), are markedly smaller, comprising less than 30% of the population combined, due to fertility declines post-1970s.[3] Net immigration has partially offset the narrow base by augmenting working-age cohorts (ages 20-50), often introducing younger profiles from higher-fertility regions, though this effect diminishes over time as migrants age.[3] Country-level disparities are stark: Ireland's median age remains below 40 years, buoyed by recent fertility and inflows, while Italy's approaches 49 years, with over 24% aged 65+.[87] Eastern European nations like Bulgaria exhibit similar aging, with baby boom cohorts now dominating the 60+ segment amid outmigration of youth.[87] These distributions signal prospective cohort shrinkage without policy interventions to elevate native births or sustain selective immigration.[3]Dependency Ratios and Intergenerational Imbalances
The old-age dependency ratio in the European Union reached 33.9% in 2024, indicating 33.9 individuals aged 65 and older per 100 persons aged 15-64.[88] This metric highlights the growing burden on the working-age population to support retirees through pensions and healthcare. Youth dependency ratios, conversely, remain low at around 21-22% across the EU, reflecting sub-replacement fertility rates that fail to replenish cohorts adequately.[89] The total dependency ratio, combining both, thus trends upward primarily due to elevated old-age shares. Significant regional and national variations exist within Europe. In 2022, southern and eastern countries exhibited the highest old-age dependency ratios, with Portugal at 37.2%, Croatia and Greece at 35.6% each, and Germany at 34.7%.[90] Northern and western nations like Ireland and Sweden reported lower figures, around 22-25%, bolstered by relatively higher fertility in recent decades or migration inflows.[91] Subnational disparities are pronounced; in 2023, multiple regions in Italy, Finland, Portugal, Bulgaria, Greece, and Spain surpassed 50%, straining local fiscal resources.[91] These imbalances stem from post-World War II baby booms now retiring en masse, juxtaposed against smaller millennial and Generation Z cohorts due to sustained fertility declines below 1.5 children per woman in most countries since the 1990s.[89] Projections underscore escalating intergenerational strains. Eurostat forecasts the EU old-age dependency ratio to nearly double to 59.7% by 2100, implying fewer than two workers per retiree.[89] United Nations data align, anticipating Europe's working-age population share to shrink further, with advanced economies facing ratios exceeding 50% by mid-century in over 30 OECD members, including Italy, Spain, and Poland above 75%.[92] [93] Causal factors include extended life expectancy—now averaging 80-82 years in Western Europe—coupled with fertility stagnation, amplifying pay-as-you-go pension system pressures where current contributions fund prior generations.[94] This dynamic risks intergenerational inequity, as younger cohorts face higher taxes, delayed retirement, and reduced public goods allocation, evidenced by rising public debt-to-GDP ratios tied to aging demographics.[94] Such imbalances manifest in economic drag and fiscal unsustainability. Population aging is projected to lower Euro area potential growth by curtailing labor supply and elevating pension expenditures to 12-15% of GDP by 2050 in high-debt nations.[94] Intergenerational transfers, predominantly downward from workers to elderly via mandatory systems, intensify without offsetting measures like immigration or productivity surges, though empirical evidence questions migration's long-term efficacy in reversing native cohort shrinkage.[93] Policy responses, including raised retirement ages to 67-70 across much of Europe, aim to mitigate but cannot fully counteract demographic inertia rooted in behavioral fertility choices and longevity gains.[89]Economic and Social Consequences of Aging
The aging of Europe's population, characterized by a rising old-age dependency ratio, imposes significant strains on public finances, as fewer working-age individuals (aged 15-64) support a growing number of retirees aged 65 and older. In the European Union, this ratio reached 33.9% in 2024, with projections estimating it will climb to 56.7% by 2050 and nearly 60% by 2100, reflecting sustained low fertility rates combined with extended life expectancies.[87][95] This demographic shift is anticipated to drive up expenditures on pensions and healthcare, potentially accounting for a substantial portion of GDP growth erosion; for instance, euro area population growth is expected to turn negative from 2035 onward, amplifying fiscal deficits unless offset by productivity gains or policy adjustments.[94] Economically, the contraction of the working-age population—projected to decline in 22 of 27 EU countries by 2050—threatens labor shortages, reduced human and physical capital accumulation, and slower overall growth.[7] Sectors reliant on manual or skilled labor, such as manufacturing and care services, face intensified recruitment challenges, contributing to wage pressures and potential inflationary spirals in tight labor markets.[96] Rising social security costs, including pensions strained by pay-as-you-go systems, could crowd out investments in infrastructure and education, with studies indicating that higher dependency ratios correlate with diminished productivity through resource reallocation toward elderly support rather than innovation or capital formation.[97][98] Socially, the intergenerational imbalance fosters heightened dependency burdens, where working-age cohorts bear disproportionate responsibility for elderly care, potentially eroding family structures and increasing reliance on state-funded services amid shrinking familial support networks.[99] This dynamic exacerbates inequalities, particularly in regions with rapid aging, as the share of those aged 85 and older surges, demanding expanded long-term care facilities and healthcare infrastructure that strain public resources and contribute to youth emigration from high-dependency areas.[7] Consumption patterns shift toward healthcare and retirement services, altering market demands and possibly intensifying social isolation among the elderly due to smaller family sizes and geographic mobility of younger generations.[100] Policymakers have responded with measures like raising retirement ages, yet these address symptoms rather than underlying fertility declines, highlighting the need for structural reforms to mitigate long-term societal cohesion risks.[101]Ethnic and Genetic Composition
Native Ethnic Groups and Historical Continuities
Europe's native ethnic groups consist predominantly of Indo-European-speaking populations whose ancestors arrived through successive migrations beginning in the late Neolithic and Bronze Age periods, around 4500–2500 BCE, introducing pastoralist ancestry from the Pontic-Caspian steppe that intermixed with indigenous hunter-gatherers and early farmers.[102] These groups form the core demographic structure of the continent, with the three largest ethno-linguistic branches—Slavic, Germanic, and Romance—accounting for the bulk of the pre-modern population and exhibiting continuity through shared linguistic descent, cultural practices, and regional genetic profiles stable since at least the Iron Age.[103][104] Smaller indigenous groups, such as the Basques and Sami, represent pre-Indo-European holdouts with distinct non-Indo-European languages and elevated continuity from mesolithic or neolithic substrates.[105] The Slavic peoples, comprising over 200 million individuals today, trace their ethnogenesis to proto-Slavic communities in the forest-steppe zones of present-day Ukraine and southern Belarus around the 5th–6th centuries CE, followed by rapid expansions southward into the Balkans and westward into Central Europe amid the collapse of Roman provincial structures and Hunnic incursions.[106] Genetic evidence confirms substantial population replacements in regions like the Balkans and East-Central Europe during the 6th–7th centuries, with up to 50–70% steppe-derived ancestry shifts incompatible with mere cultural diffusion, establishing lasting demographic dominance in countries such as Poland (38 million Poles), Russia (111 million ethnic Russians), and Ukraine (35 million Ukrainians).[107][108] Historical continuity is maintained via the Slavic language family, Orthodox or Catholic religious traditions, and village-based agrarian customs that persisted through medieval state formations like Kievan Rus' and the Polish-Lithuanian Commonwealth. Germanic peoples, numbering around 200 million speakers of Germanic languages, originated in southern Scandinavia and the Jutland Peninsula during the late Nordic Bronze Age (circa 1200–500 BCE), with tribal confederations expanding during the Roman Iron Age and Migration Period (4th–6th centuries CE) to supplant or assimilate Celtic and Romanized populations across northern and western Europe.[109] This resulted in foundational ethnic groups including Germans (83 million in Germany as of 2023), English (56 million in the UK), Dutch (17 million), and Scandinavians (e.g., 5.5 million Swedes, 5.9 million Danes), whose continuity is evidenced by linguistic evolution from proto-Germanic and genetic clustering distinct from southern European profiles, with minimal external admixture until recent centuries.[104] Post-Roman kingdoms like the Franks and Anglo-Saxons preserved tribal legal codes, runic alphabets, and heroic sagas, linking modern identities to ancient Teutonic assemblies described in Tacitus's Germania (98 CE). Romance ethnic groups, exceeding 200 million in total, emerged from the Roman Empire's Latinization of diverse pre-Roman substrates—including Celts in Gaul, Iberians in Hispania, and Italics in the peninsula—between the 3rd century BCE and 5th century CE, fostering hybrid identities centered on Vulgar Latin derivatives rather than direct Roman settler descent.[103] Key populations include French (67 million ethnic French), Italians (56 million), Spaniards (47 million), Portuguese (10 million), and Romanians (17 million), with genetic continuity reflecting 60–80% Neolithic farmer ancestry augmented by minor Germanic overlays in the north.[110] Cultural persistence is seen in Roman-derived civil law traditions, Catholic liturgy, and feudal manorial systems that evolved from late antique coloni estates, underscoring resilience despite barbarian invasions and medieval feudal fragmentation. Other native groups demonstrate deeper pre-Indo-European roots: the Basques, isolated in the western Pyrenees with a language unrelated to any known family, maintain genetic continuity from Paleolithic hunter-gatherers, comprising about 2.5 million people and resisting Roman, Visigothic, and later assimilations through endogamy and montane geography.[105] Similarly, the Sami of northern Fennoscandia, numbering around 80,000–100,000, preserve Uralic linguistic and shamanistic traditions from circa 2000 BCE migrations, with genomic isolation until medieval Norse contacts.[105] These minorities highlight Europe's layered demographic history, where core Indo-European majorities overlay relict indigenous strata, with overall population structures showing fine-scale stability from the Middle Ages onward despite episodic upheavals like the Black Death (1347–1351, reducing numbers by 30–60%) and religious wars.[111]Immigrant Inflows and Ethnic Demographic Shifts
In 2023, approximately 4.3 million individuals immigrated to the European Union from non-EU countries, marking an 18% decline from the 5.1 million recorded in 2022, though inflows remained elevated compared to pre-2020 levels.[69] Net migration to the EU surged to +2.3 million in 2024, offsetting negative natural population change and comprising the dominant factor in overall demographic expansion.[112] These inflows, predominantly from Africa, the Middle East, and Asia, have accelerated the incorporation of non-European ethnic groups into Europe's population structure.[70] The foreign-born population in the EU reached 14.1% of the total in 2024, up from 13.6% in 2023, with 71.4% of these migrants originating from outside the EU and thus typically representing non-European ethnic backgrounds.[113] [80] Non-EU-born residents numbered 44.7 million as of January 1, 2024, equating to 9.9% of the EU population, concentrated in western and northern member states where shares exceed 15%.[6] Eastern European countries maintain lower proportions below 5%, reflecting divergent policy and economic pull factors.[77] Among EU nations, Luxembourg hosted the highest foreign-born share at 50.4% in 2023, followed by Malta (28.3%) and Cyprus (22.7%), while Germany accommodated the largest absolute number.[114] [115]| Country | Foreign-Born Share (2023) |
|---|---|
| Luxembourg | 50.4% |
| Malta | 28.3% |
| Cyprus | 22.7% |
| Sweden | ~20% |
| Germany | ~18% |
| Poland | 3% |
| Romania | 3% |
Genetic Evidence: Ancestry, Admixture, and Population Structure
Genetic studies of ancient and modern DNA have established that the ancestry of present-day Europeans predominantly derives from admixture among three primary ancient population components: Western Hunter-Gatherers (WHG), who inhabited Europe during the Upper Paleolithic and Mesolithic; Early European Farmers (EEF), migrants from Anatolia and the Near East associated with the Neolithic expansion around 8,000 years ago; and Western Steppe Herders (WSH), pastoralists from the Pontic-Caspian steppe linked to Bronze Age migrations circa 5,000 years ago, carrying Ancient North Eurasian (ANE) ancestry.[118] This tripartite model, supported by genome-wide analyses using methods like qpAdm and ADMIXTURE, accounts for the bulk of autosomal variation in European populations, with minimal contributions from other sources prior to historical periods.[119] Proportions of these components exhibit marked geographic variation, reflecting differential admixture histories. Northern and Eastern Europeans, such as Scandinavians and Balts, typically carry 40-50% WSH ancestry, 30-40% EEF, and 10-20% WHG, with WHG peaking near 50% in Baltic populations due to Mesolithic continuity. In contrast, Southern Europeans, particularly Sardinians, retain high EEF fractions exceeding 70%, with lower WSH input (under 20%) and variable WHG. Central Europeans occupy an intermediate position, often modeled at approximately 45% EEF, 35% WSH, and 20% WHG.[118] These estimates derive from fitting modern genomes against ancient reference panels, revealing clinal gradients: WSH ancestry decreases southward and westward, while EEF increases in Mediterranean regions.[32] Population structure analyses, including principal component analysis (PCA) and FST metrics, demonstrate that Europeans form a relatively tight genetic cluster globally, with subcontinental differentiation driven by these ancient admixtures and subsequent Bronze Age expansions.[120] PCA plots reveal a north-south cline correlating with EEF-WHG gradients and an east-west axis influenced by WSH diffusion, with outliers like Finns showing Siberian-related admixture from Uralic speakers.[32] Fine-scale structure persists from isolation-by-distance in Mesolithic times, modulated by Neolithic demic diffusion and Indo-European migrations, but overall FST values within Europe remain low (0.005-0.01), indicating high homogeneity compared to intercontinental scales.[105] Recent ancient DNA from medieval contexts confirms continuity from Iron Age baselines, with limited gene flow from external regions until post-Roman mobility.[32] Uniparental markers reinforce autosomal patterns: Y-chromosome haplogroups R1a and R1b, dominant in 50-80% of males across Europe, trace largely to WSH expansions, with R1b prevalent in Western Europe and R1a in Eastern; I2 derives from WHG persistence in refugia like the Balkans. Mitochondrial DNA shows U5 as a WHG signature (up to 20% in northern groups) and widespread H subclades from both EEF and WSH.[118] These lineages underscore male-biased steppe admixture and regional matrilineal retentions, aligning with archaeological evidence of patrilocal migrations.[119]Religious Landscape
Traditional Christian Dominance and Historical Roots
Christianity's establishment as the predominant religion in Europe began with its legalization and elevation within the Roman Empire. Emperor Constantine I's Edict of Milan in 313 AD granted tolerance to Christians, marking a shift from persecution to favor, while the Edict of Thessalonica in 380 AD, issued by Theodosius I alongside Gratian and Valentinian II, declared Nicene Christianity the empire's official state religion, suppressing pagan practices and heretical sects.[121][122] By the late 4th century, urban centers across the empire, from Britain to the Balkans, featured Christian majorities, with rural areas following through missionary activity and imperial enforcement.[123] Following the Western Roman Empire's collapse around 476 AD, Germanic kingdoms adopted Christianity, often through royal initiative. Clovis I, king of the Franks, underwent baptism around 496 AD (or possibly 508 AD) in Reims, aligning his realm with Catholic orthodoxy rather than Arianism prevalent among other Germanic groups, which facilitated alliances with the Gallo-Roman population and set a model for top-down conversion.[124][125] This event spurred Christianization among the Franks, Visigoths (who converted from Arianism by 589 AD at the Third Council of Toledo), and Lombards in Italy by the late 6th century, integrating pagan warriors into a Christian framework that emphasized baptism as entry into the community.[126] In the early Middle Ages, papal missions extended dominance northward and eastward. Pope Gregory the Great dispatched Augustine of Canterbury in 597 AD, leading to the baptism of King Æthelberht of Kent and subsequent Anglo-Saxon conversions, though Viking raids later required reconversion efforts.[123] Charlemagne's campaigns from 772 to 804 AD against the Saxons enforced baptism under threat of death, culminating in the Massacre of Verden in 782 AD where 4,500 resistors were executed, solidifying Christianity in central Europe.[126] By the 9th-10th centuries, Slavic states followed: Bulgaria under Boris I in 864 AD, Poland via Mieszko I's baptism in 966 AD for political ties to Bohemia, and Kievan Rus' under Vladimir I from 988 AD, adopting Byzantine Orthodoxy.[126] Northern Europe's Christianization lagged but completed the continental dominance by the 11th-14th centuries. Scandinavia saw gradual royal adoptions, with Denmark's Harald Bluetooth claiming conversion around 965 AD and Iceland's Althing legislating it in 1000 AD to avert civil war.[126] Lithuania, the last pagan stronghold in Europe, accepted Christianity in 1387 AD under Grand Duke Jogaila to secure a dynastic union with Poland.[126] These processes—combining voluntary missions, political expediency, and coercion—resulted in Christianity's demographic hegemony, where by the High Middle Ages, adherence defined European identity, with ecclesiastical structures embedding the faith in birth, marriage, and death rituals across populations estimated at near-universal nominal affiliation in Christianized realms.[123] Lingering pagan elements persisted in folklore, but institutional dominance ensured intergenerational transmission, shaping Europe's religious demography until the Reformation.[127]Secularization Trends and Declining Practice
Secularization in Europe, characterized by diminishing religious affiliation and practice, accelerated after World War II, with public ritual participation declining first, followed by reduced perceived importance of religion, and eventually widespread disaffiliation.[128] Between 2010 and 2020, the share of Europe's population identifying as Christian decreased by 8 percentage points to 67%, while the religiously unaffiliated rose by 7 points to 25%, reflecting net losses through switching and lower retention among younger cohorts.[129] Absolute numbers of Christians fell 9% to 505 million, driven by disaffiliation in Western and Northern Europe, where countries like the United Kingdom saw Christian identification drop below 50% and unaffiliated rates climb to 40%.[129] France lost its Christian majority, and the Netherlands gained an unaffiliated majority during this period.[129] Church attendance rates underscore the gap between nominal affiliation and active practice, remaining low across much of the continent. In a 2018 Pew survey of 15 European countries, weekly worship attendance averaged under 20%, with Nordic countries like Sweden and Denmark at 5-10%, while Southern and Eastern outliers such as Italy (23-27%) and Poland (around 35-36% as of recent national data) reported higher figures.[130] [131] These patterns persist into the 2020s, with generational divides evident: in Denmark, 79% of older adults remain affiliated, but affiliation among those under 40 is substantially lower.[132] Institutional exits further illustrate declining practice; in Germany, over 500,000 individuals left the Catholic Church in 2022 alone, pushing the unaffiliated to outnumber both Catholics and Protestants.[133] Regional variations highlight uneven secularization, with Western Europe leading the trend due to earlier industrialization and cultural shifts, while Eastern Europe shows slower declines but similar trajectories post-communism. Poland and Greece maintain relatively higher attendance (26-35%), yet even there, younger generations exhibit lower religiosity.[134] Data from the European Values Study confirm that Europeans increasingly report no church attendance and disbelief in God, with secularization affecting public rituals before core beliefs.[135] Although some surveys note a recent slowing in disaffiliation rates in select Western countries since 2020, overall trends indicate continued erosion of traditional Christian practice, unmitigated by countervailing factors in demographic projections.[136][132]Migration-Driven Religious Pluralism and Conflicts
Large-scale immigration to Europe, particularly from Muslim-majority countries in the Middle East, North Africa, and South Asia since the early 2010s, has substantially increased religious diversity by elevating the share of non-Christian faiths, with Islam experiencing the most pronounced growth.[137][138] By 2023, Europe's Muslim population reached approximately 46 million, constituting about 6% of the total population, up 16% from prior estimates, driven primarily by net migration rather than conversions or native births.[129][139] This influx, including over 3 million Muslim migrants during the 2010-2016 period alone, has introduced pluralism in countries like Germany, France, and Sweden, where Muslim communities now exceed 5-10% of the population in urban areas, contrasting with Europe's historical Christian dominance and accelerating secularization.[137][137] Migrants from these regions often arrive with higher levels of religiosity than native Europeans, perpetuating distinct religious practices and institutions that challenge Europe's secular norms and foster parallel societies in enclaves with limited interfaith interaction.[140] For instance, surveys indicate that Muslim immigrants maintain stronger adherence to practices like daily prayer and mosque attendance compared to the declining Christian observance among natives, exacerbating cultural divides over issues such as gender roles, halal requirements, and public religious expression.[140][141] Smaller non-Muslim migrant faiths, such as Hinduism (rising to 2 million, up 30%), have added marginal pluralism but lack the scale or visibility of Islamic growth.[129] This demographic shift has correlated with heightened religious conflicts, most acutely manifested in jihadist terrorism, which Europol identifies as the primary terrorist threat across the EU due to its scale, lethality, and ideological motivation rooted in Islamist extremism.[142] Between 2015 and 2016, Islamist attacks caused over 200 fatalities in the EU, peaking with incidents like the Paris Bataclan massacre and Brussels bombings, linked to migration-enabled networks from Syria and Libya.[143] In 2023, EU member states reported dozens of jihadist plots foiled and arrests, with 34 completed or failed attacks out of 58 total terrorist incidents, underscoring persistent risks from radicalized migrant or second-generation communities.[144][145] Beyond terrorism, migration-driven pluralism has fueled broader tensions, including communal violence, honor-based abuses, and demands for Sharia-influenced autonomy in migrant-heavy neighborhoods, as documented in integration failure reports from countries like the UK and Sweden.[146] Native populations in Western Europe exhibit growing resistance to perceived cultural impositions, with surveys showing lower acceptance of Muslim practices in secular contexts compared to Eastern Europe, where migration volumes remain lower.[141][147] These frictions, amplified by events like the 2023-2024 riots in France and spikes in antisemitic incidents following Middle East conflicts, highlight causal links between unchecked inflows and eroded social cohesion, as higher migrant religiosity resists assimilation into Europe's post-Christian framework.[148][140]Linguistic Diversity
Indo-European Language Families and Distributions
The Indo-European language family dominates Europe's linguistic landscape, with its branches spoken natively by approximately 94 percent of the continent's inhabitants. This family originated from a common proto-language estimated to have been spoken around 8100 years ago, spreading through migrations and conquests across Europe from the Bronze Age onward. The primary branches in Europe—Romance, Germanic, and Slavic—collectively account for the vast majority of speakers, reflecting historical Roman, Germanic tribal, and Slavic expansions. Smaller branches, such as Baltic, Hellenic, Albanian, and Celtic, occupy more restricted territories, often as linguistic relics amid dominant neighbors. Romance languages, evolving from Vulgar Latin following the Roman Empire's collapse, are concentrated in southwestern and southern Europe. They predominate in France (primarily French, ~67 million speakers), Italy (Italian, ~60 million), Spain (Spanish, ~47 million), Portugal (Portuguese, ~10 million), and Romania (Romanian, ~24 million), with minorities in Belgium, Switzerland, and Moldova. Overall, Romance languages claim about 215 million native speakers in Europe, underscoring their role in post-Roman cultural continuity despite regional divergences driven by geography and invasions.[149] Germanic languages, tracing to proto-Germanic speakers in northern Europe around 500 BCE, extend across northwestern and northern regions. German (~95 million speakers) anchors central Europe in Germany, Austria, and Switzerland; English (~70 million in the UK and Ireland) defines the British Isles; Dutch (~24 million) prevails in the Netherlands and Belgium; and Scandinavian tongues—Swedish (~10 million), Danish (~6 million), Norwegian (~5 million)—cover Denmark, Norway, and Sweden. This branch totals roughly 200-220 million European speakers, bolstered by medieval migrations and trade but fragmented by Viking-era splits and later national boundaries.[149] Slavic languages, emerging from proto-Slavic in the early medieval period, form a broad arc through central, eastern, and southeastern Europe. Russian (~110 million in European Russia), Polish (~40 million), Ukrainian (~30 million), and Serbo-Croatian variants (~17 million across former Yugoslavia) lead, with others like Czech (~10 million) and Bulgarian (~7 million) filling gaps in Poland, Ukraine, Belarus, the Czech Republic, Slovakia, and the Balkans. The branch exceeds 300 million speakers globally, with over 90 percent in Europe, shaped by 6th-century migrations and subsequent Orthodox and Catholic influences dividing East, West, and South Slavic groups.[150] Among minor branches, Baltic languages (Latvian ~1.5 million, Lithuanian ~3 million) persist in Latvia and Lithuania, resisting Slavic assimilation despite proximity. Hellenic (Greek ~13 million) confines to Greece and Cyprus, preserving ancient roots amid Byzantine and Ottoman overlays. Albanian (~6 million native speakers) clusters in Albania, Kosovo, and North Macedonia, an isolate branch with Illyrian ties. Celtic languages, once widespread, now marginalize to Ireland (Irish ~1.7 million L1/L2, few daily fluent), Wales (Welsh ~500,000), Scotland (Gaelic ~60,000), and France's Brittany (Breton ~200,000), totaling under 2 million active speakers due to centuries of anglicization and industrialization. Indo-Iranian offshoots like Romani (~1-2 million across Europe) reflect nomadic Roma dispersals from India circa 1000 years ago. These distributions highlight how conquests, isolations, and state policies have preserved or eroded Indo-European diversity.[151]Non-Indo-European Languages and Regional Minorities
Europe's linguistic landscape includes several non-Indo-European languages, primarily from the Uralic family, alongside isolates such as Basque and the Semitic Maltese, spoken by regional populations that constitute minorities in broader national contexts or maintain distinct cultural identities.[152] These languages persist despite pressures from dominant Indo-European tongues, with speaker numbers reflecting both national majorities in isolated cases (e.g., Hungarian in Hungary) and smaller minority communities elsewhere.[153] The Uralic family, encompassing about 25 million speakers in Europe, features the Finno-Ugric branch as its most prominent element, with Hungarian boasting approximately 13 million speakers, the majority in Hungary but significant minorities in Romania (over 1 million ethnic Hungarians) and Slovakia.[153] Finnish, with around 5.4 million speakers primarily in Finland, and Estonian, spoken by about 1.1 million in Estonia, represent national languages but also extend to cross-border minorities, such as Finnish-related dialects in Sweden's Torne Valley. Smaller Uralic groups include the Saami languages, spoken by roughly 30,000 individuals among the indigenous Saami peoples across northern Norway, Sweden, Finland, and Russia's Kola Peninsula, where they form ethnic minorities facing historical assimilation efforts.[154][155] Basque (Euskara), a linguistic isolate predating Indo-European arrivals, is spoken by approximately 900,000 people in the Basque Country spanning northern Spain and southwestern France, where Basques represent a regional minority with strong cultural autonomy movements.[156] Maltese, the sole Semitic language native to Europe, derives from Siculo-Arabic and is spoken by over 500,000 residents of Malta, forming the national language but incorporating heavy Romance influences from Italian and English.[157] These non-Indo-European tongues highlight pockets of linguistic diversity amid Europe's otherwise uniform Indo-European substrate, often tied to ethnic minorities whose vitality depends on educational policies and community preservation efforts.[152]Language Policy, Assimilation, and Erosion Pressures
The European Union maintains 24 official languages, reflecting its commitment to linguistic diversity, with policies encouraging citizens to acquire proficiency in their mother tongue plus two others to foster integration and mobility.[158] However, implementation varies, as English has emerged as the dominant working language in EU institutions despite formal multilingualism, exerting pressure on smaller languages through practical usage in business, education, and diplomacy.[159] At the national level, policies diverge between assimilationist approaches, which mandate host-language acquisition for citizenship and social cohesion, and multicultural models that tolerate parallel linguistic communities; for instance, France enforces French as the sole medium in public education to promote republican unity, while Sweden's emphasis on multiculturalism has correlated with slower immigrant language uptake.[160] [161] Immigrant assimilation into host languages remains incomplete, with Eurostat data from 2021 indicating that only 61.9% of foreign-born residents across the EU reported proficiency or native-level command of the host-country language, varying sharply by origin and destination—higher among Europeans (e.g., 80-90% in intra-EU migrants) but lower for non-EU groups from regions like the Middle East and North Africa, where rates often fall below 50% after a decade of residence.[158] In high-immigration nations such as Germany and Sweden, this gap contributes to linguistic enclaves, where non-assimilation sustains heritage languages in schools and communities, indirectly straining native-language dominance in public spheres; for example, in parts of Sweden, Arabic or Somali has supplanted Swedish as the primary language in certain urban classrooms, reflecting policy tolerance for multiculturalism over enforced integration.[162] Assimilationist policies, as in Denmark's mandatory language and civics tests for residency, yield higher proficiency (around 70-80% for long-term residents), linking linguistic competence to economic outcomes and reduced welfare dependency, per studies on returns to language skills.[163] Erosion pressures afflict both regional minority languages and, increasingly, national tongues amid globalization and migration. Historical assimilation policies have accelerated the decline of indigenous minorities, such as Breton in France or Sámi in Scandinavia, with UNESCO estimating over 40 European minority languages at risk of extinction by 2100 due to intergenerational transmission failure and state prioritization of majority languages.[164] Immigration amplifies this by diluting linguistic homogeneity; in the UK, the proportion of households speaking English as the main language dropped from 92% in 2001 to 86% in 2021, correlating with non-EU inflows favoring heritage languages at home.[165] English's global ascent further erodes non-dominant European languages, as seen in the Netherlands where 90% youth proficiency in English reduces incentives for regional dialects like Frisian, while unassimilated migrant communities resist host-language norms, fostering parallel societies that challenge causal links between shared language and social trust.[166] These dynamics underscore tensions between preserving diversity and ensuring functional cohesion, with empirical evidence favoring policies tying integration to language mastery for demographic stability.[167]Projections and Demographic Challenges
Long-Term Population Forecasts and Scenarios
The European Union's population is projected to peak at 453 million in 2026 before declining to 420 million by 2100 under Eurostat's EUROPOP2023 baseline scenario, which incorporates assumptions of fertility rates converging toward 1.6 children per woman across member states—remaining below the replacement level of 2.1—and annual net migration of approximately 1 million people, primarily from non-EU origins.[168] This trajectory reflects a natural population decrease, with 291 million projected births offset by 417 million deaths over the period, sustained only by immigration inflows.[168] The United Nations World Population Prospects 2024 medium variant extends similar declines to the broader European region (encompassing 50 countries), estimating a reduction from around 740 million in 2024 to approximately 630 million by 2100, driven by total fertility rates averaging 1.5 and net migration stabilizing at levels insufficient to reverse aging momentum.[3] These projections assume partial fertility recovery from current lows but acknowledge persistent sub-replacement levels, with migration variants showing that zero net migration would accelerate shrinkage to levels comparable to early 20th-century populations in high-decline scenarios.[51] Alternative scenarios underscore migration's pivotal role: Eurostat-derived models without immigration forecast an EU population drop to 295 million by 2100—a 34% decline from 2022 baselines—highlighting fertility's inadequacy to sustain numbers absent external inflows, while high-migration variants mitigate but do not eliminate decline, projecting stability only in select northern states like Sweden and Germany under optimistic fertility assumptions.[82] Research from the European Commission's Joint Research Centre indicates that long-term population stability requires either fertility rebound to near-replacement or sustained high migration, neither of which aligns with observed trends of declining native birth rates below 1.5 in most countries and variable migrant integration outcomes.[169] Policy-based projections exploring fertility variants from 1.4 to 2.0 confirm that even replacement-level fertility would yield only modest stabilization post-2050 due to prior low-fertility cohorts' aging effects.[170]| Scenario | Key Assumptions | EU Population in 2100 (millions) |
|---|---|---|
| Baseline (Eurostat) | Fertility ~1.6, net migration ~1M/year | 420[168] |
| Zero Migration | No net inflows, baseline fertility | 295[82] |
| High Fertility | Fertility to 2.0, baseline migration | ~450 (modest growth post-2050)[170] |
| Low Migration/Fertility | Fertility ~1.4, reduced inflows | <400[7] |