
Community hub
Recent from talks
Contribute something
Nothing was collected or created yet.
Early world maps
View on Wikipedia
The earliest known world maps date to classical antiquity, the oldest examples of the 6th to 5th centuries BCE still based on the flat Earth paradigm. World maps assuming a spherical Earth first appear in the Hellenistic period. The developments of Greek geography during this time, notably by Eratosthenes and Posidonius culminated in the Roman era, with Ptolemy's world map (2nd century CE), which would remain authoritative throughout the Middle Ages. Since Ptolemy, knowledge of the approximate size of the Earth allowed cartographers to estimate the extent of their geographical knowledge, and to indicate parts of the planet known to exist but not yet explored as terra incognita.
With the Age of Discovery, during the 15th to 18th centuries, world maps became increasingly accurate; exploration of Antarctica, Australia, and the interior of Africa by western mapmakers was left to the 19th and early 20th century.
Antiquity
[edit]Bronze Age Saint-Bélec slab
[edit]The Saint-Bélec slab discovered in 1900 by Paul du Châtellier, in Finistère, France, is dated to between 1900 BCE and 1640 BCE. A recent analysis, published in the Bulletin of the French Prehistoric Society, has shown that the slab is a three-dimensional representation of the River Odet valley in Finistère, France. This would make the Saint-Bélec slab the oldest known map of a territory in the world. According to the authors, the map probably was not used for navigation, but rather to show the political power and territorial extent of a local ruler's domain of the early Bronze Age.[1][2][3][4]
Babylonian Imago Mundi (c. 6th c. BCE)
[edit]
A Babylonian world map, known as the Imago Mundi, is commonly dated to the 6th century BCE.[5] The map as reconstructed by Eckhard Unger shows Babylon on the Euphrates, surrounded by a circular landmass including Assyria, Urartu (Armenia)[6] and several cities, in turn surrounded by a "bitter river" (Oceanus), with eight outlying regions (nagu) arranged around it in the shape of triangles, so as to form a star. The accompanying text mentions a distance of seven beru between the outlying regions. The descriptions of five of them have survived:[7]
- The third region is where "the winged bird ends not his flight", i.e., cannot reach.
- On the fourth region "the light is brighter than that of sunset or stars": it lay in the northwest, and after sunset in summer was practically in semi-obscurity.
- The fifth region, due north, lay in complete darkness, a land "where one sees nothing", and "the sun is not visible".
- The sixth region, "where a horned bull dwells and attacks the newcomer".
- The seventh region lay in the east and is "where the morning dawns".
Anaximander (c. 610–546 BCE)
[edit].svg)
Anaximander (died c. 546 BCE) is credited with having created one of the first maps of the world,[8] which was circular in form and showed the known lands of the world grouped around the Aegean Sea at the center. This was all surrounded by the ocean.
Hecataeus of Miletus (c. 550–476 BCE)
[edit]
Hecataeus of Miletus is credited with a work entitled Periodos Ges ("Travels round the Earth" or "World Survey"), in two books each organized in the manner of a periplus, a point-to-point coastal survey. One, on Europe, is essentially a periplus of the Mediterranean, describing each region in turn, reaching as far north as Scythia. The other book, on Asia, is arranged similarly to the Periplus of the Erythraean Sea of which a version of the 1st century CE survives. Hecataeus described the countries and inhabitants of the known world, the account of Egypt being particularly comprehensive; the descriptive matter was accompanied by a map, based upon Anaximander's map of the Earth, which he corrected and enlarged. The work only survives in some 374 fragments, by far the majority being quoted in the geographical lexicon the Ethnica, compiled by Stephanus of Byzantium.
Eratosthenes (276–194 BCE)
[edit]
Eratosthenes (276–194 BCE) drew an improved world map, incorporating information from the campaigns of Alexander the Great and his successors. Asia became wider, reflecting the new understanding of the actual size of the continent. Eratosthenes was also the first geographer to incorporate parallels and meridians within his cartographic depictions, attesting to his understanding of the spherical nature of the Earth.
Posidonius (c. 135–51 BCE)
[edit]
Posidonius (or Poseidonius) of Apameia (c. 135–51 BCE) was a Greek Stoic philosopher[10] who traveled throughout the Roman world and beyond and was a celebrated polymath throughout the Greco-Roman world, like Aristotle and Eratosthenes. His work "about the ocean and the adjacent areas" was a general geographical discussion, showing how all the forces had an effect on each other and applied also to human life. He measured the Earth's circumference by reference to the position of the star Canopus. His measure of 240,000 stadia translates to 24,000 miles (39,000 km), close to the actual circumference of 24,901 miles (40,074 km).[11] He was informed in his approach by Eratosthenes, who a century earlier used the elevation of the Sun at different latitudes. Both men's figures for the Earth's circumference were uncannily accurate, aided in each case by mutually compensating errors in measurement. However, the version of Posidonius' calculation popularised by Strabo was revised by correcting the distance between Rhodes and Alexandria to 3,750 stadia, resulting in a circumference of 180,000 stadia, or 18,000 miles (29,000 km).[12] Ptolemy discussed and favored this revised figure of Posidonius over Eratosthenes in his Geographia, and during the Middle Ages scholars divided into two camps regarding the circumference of the Earth, one side identifying with Eratosthenes' calculation and the other with Posidonius' 180,000 stadion measure, which is now known to be about 33% too low. This was the number used by Christopher Columbus to underestimate the distance to India as 70,000 stades.[13]
Strabo (c. 64 BCE – 24 CE)
[edit]Strabo is mostly famous for his 17-volume work Geographica, which presented a descriptive history of people and places from different regions of the world known to his era.[14] The Geographica first appeared in Western Europe in Rome as a Latin translation issued around 1469. Although Strabo referenced the antique Greek astronomers Eratosthenes and Hipparchus and acknowledged their astronomical and mathematical efforts towards geography, he claimed that a descriptive approach was more practical. Geographica provides a valuable source of information on the ancient world, especially when this information is corroborated by other sources. Within the books of Geographica is a map of Europe. Whole world maps according to Strabo are reconstructions from his written text.
Pomponius Mela (c. 43 CE)
[edit]
Pomponius is unique among ancient geographers in that, after dividing the Earth into five zones, of which two only were habitable, he asserts the existence of antichthones, people inhabiting the southern temperate zone inaccessible to the folk of the northern temperate regions due to the unbearable heat of the intervening torrid belt. On the divisions and boundaries of Europe, Asia and Africa, he repeats Eratosthenes; like all classical geographers from Alexander the Great (except Ptolemy) he regards the Caspian Sea as an inlet of the Northern Ocean, corresponding to the Persian (Persian Gulf) and Arabian (Red Sea) gulfs on the south.
Marinus of Tyre (c. 120 CE)
[edit]Marinus of Tyre's world maps were the first in the Roman Empire to show China. Around 120 CE, Marinus wrote that the habitable world was bounded on the west by the Fortunate Islands. The text of his geographical treatise however is lost. He also invented the equirectangular projection, which is still used in map creation today. A few of Marinus' opinions are reported by Ptolemy. Marinus was of the opinion that the Okeanos was separated into an eastern and a western part by the continents (Europe, Asia and Africa). He thought that the inhabited world stretched in latitude from Thule (Shetland) to Agisymba (Tropic of Capricorn) and in longitude from the Isles of the Blessed to Shera (China). Marinus also coined the term Antarctic, referring to the opposite of the Arctic Circle. His chief legacy is that he first assigned to each place a proper latitude and longitude; he used a "Meridian of the Isles of the Blessed (Canary Islands or Cape Verde Islands)" as the zero meridian.
Ptolemy (c. 150)
[edit]
_(cropped).jpg)
Surviving texts of Ptolemy's Geography, first composed c. 150, note that he continued the use of Marinus's equirectangular projection for its regional maps while finding it inappropriate for maps of the entire known world. Instead, in Book VII of his work, he outlines three separate projections of increasing difficulty and fidelity. Ptolemy followed Marinus in underestimating the circumference of the world; combined with accurate absolute distances, this led him to also overestimate the length of the Mediterranean Sea in terms of degrees. His prime meridian at the Fortunate Isles was therefore around 10 actual degrees further west of Alexandria than intended, a mistake that was corrected by Al-Khwārizmī following the translation of Syriac editions of Ptolemy into Arabic in the 9th century. The oldest surviving manuscripts of the work date to Maximus Planudes's restoration of the text a little before 1300 at Chora Monastery in Constantinople (Istanbul); surviving manuscripts from this era seem to preserve separate recensions of the text which diverged as early as the 2nd or 4th century. A passage in some of the recensions credits an Agathodaemon with drafting a world map, but no maps seem to have survived to be used by Planude's monks. Instead, he commissioned new world maps calculated from Ptolemy's thousands of coordinates and drafted according to the text's 1st[15] and 2nd projections,[16] along with the equirectangular regional maps. A copy was translated into Latin by Jacobus Angelus at Florence around 1406 and soon supplemented with maps on the 1st projection. Maps using the 2nd projection were not made in Western Europe until Nicolaus Germanus's 1466 edition.[17] Ptolemy's 3rd (and hardest) projection does not seem to have been used at all before new discoveries expanded the known world beyond the point where it provided a useful format.[17]
Cicero's Dream of Scipio described the Earth as a globe of insignificant size in comparison to the remainder of the cosmos. Many medieval manuscripts of Macrobius' Commentary on the Dream of Scipio include maps of the Earth, including the antipodes, zonal maps showing the Ptolemaic climates derived from the concept of a spherical Earth and a diagram showing the Earth (labeled as globus terrae, the sphere of the Earth) at the center of the hierarchically ordered planetary spheres.[18][19]
Tabula Peutingeriana (4th century)
[edit]The Tabula Peutingeriana (Peutinger table) is an itinerarium showing the cursus publicus, the road network in the Roman Empire. It is a 13th-century copy of an original map dating from the 4th century, covering Europe, parts of Asia (India) and North Africa. The map is named after Konrad Peutinger, a German 15th–16th century humanist and antiquarian. The map was discovered in a library in Worms by Conrad Celtes, who was unable to publish his find before his death, and bequeathed the map in 1508 to Peutinger. It is conserved at the Österreichische Nationalbibliothek, Hofburg, Vienna.

Middle Ages
[edit]Cosmas Indicopleustes' Map (6th century)
[edit]
Around 550 Cosmas Indicopleustes wrote the copiously illustrated Christian Topography, a work partly based on his personal experiences as a merchant on the Red Sea and Indian Ocean in the early 6th century. Though his cosmogony is refuted by modern science, he has given a historic description of India and Sri Lanka during the 6th century, which is invaluable to historians. Cosmas seems to have personally visited the Kingdom of Axum in modern Ethiopia and Eritrea, as well as India and Sri Lanka. In 522 CE, he visited the Malabar Coast (South India). A major feature of his Topography is Cosmas' worldview that the world is flat, and that the heavens form the shape of a box with a curved lid, a view he took from unconventional interpretations of Christian scripture. Cosmas aimed to prove that pre-Christian geographers had been wrong in asserting that the earth was spherical and that it was in fact modelled on the Tabernacle, the house of worship described to Moses by God during the Jewish Exodus from Egypt.
Isidore of Sevilla's T and O map (c. 636)
[edit]
The medieval T and O maps originate with the description of the world in the Etymologiae of Isidore of Seville (died 636). This qualitative and conceptual type of medieval cartography represents only the top-half of a spherical Earth.[20] It was presumably tacitly considered a convenient projection of the inhabited portion of the world known in Roman and medieval times (that is, the northern temperate half of the globe). The T is the Mediterranean, dividing the three continents, Asia, Europe and Africa, and the O is the surrounding Ocean. Jerusalem was generally represented in the center of the map. Asia was typically the size of the other two continents combined. Because the sun rose in the east, Paradise (the Garden of Eden) was generally depicted as being in Asia, and Asia was situated at the top portion of the map.
Albi Mappa Mundi (8th century)
[edit]
The Mappa mundi of Albi is a medieval map of the world, included in a manuscript of the second half of the 8th century, preserved in the old collection of the library Pierre-Amalric in Albi, France.[21] This manuscript comes from the chapter library of the Sainte-Cécile Albi Cathedral. The Albi Mappa Mundi was inscribed in October 2015 in the Memory of the World Programme of UNESCO.[22]
The manuscript bearing the card contains 77 pages. It is named in the eighteenth century "Miscellanea" (Latin word meaning "collection"). This collection contains 22 different documents, which had educational functions. The manuscript, a Parchment probably made from a goat or sheep skin, is in a very good state of preservation.
The map itself is 27 cm high by 22.5 wide. It represents 23 countries on 3 continents and mentions several cities, islands, rivers and seas.[23] The known world is represented in the form of a horseshoe, opening at the level of the Strait of Gibraltar, and surrounding the Mediterranean, with the Middle East at the top, Europe on the left and North Africa on the right.
Ibn Hawqal's map (10th century)
[edit]
Ibn Hawqal was an Arab scientist of the 10th century who developed a world map, based on his own travel experience and probably the works of Ptolemy. Another such cartographer was Istakhri.[24]
Anglo-Saxon Cotton World Map (c. 1040)
[edit]
This map appears in a copy of a classical work on geography, the Latin version by Priscian of the Periegesis, that was among the manuscripts in the Cotton library (MS. Tiberius B.V., fol. 56v), now in the British Library. It is not intended purely as an illustration to that work, for it contains much material gathered from other sources, including some which would have been the most up-to-date available, although it is based on a distant Roman original (similar to the source of another 11th-century world map, illustrating an edition of Isidore of Seville) – on which the network of lines appears to indicate the boundaries of imperial provinces. The date of drawing was formerly estimated at c. 992–994 CE, based on suggested links to the journey of Archbishop Sigeric of Canterbury from Rome[25] but more recent analysis indicates that, although the information was revised about that time, the map was probably drawn between 1025 and 1050.[26]
Like the later map by al-Idrisi (see below) this map is clearly outside the largely symbolic early medieval mapping tradition, but equally it is not based on the famous Ptolemaic co-ordinate system. East is at the top, but Jerusalem is not in the centre, and the Garden of Eden is nowhere to be seen. Unusually, all the waterways of Africa, not just the Red Sea, are depicted in red (mountains are green). The depiction of the far East is ambitious, including India and Taprobane (Sri Lanka) – the latter depicted according to the exaggerated classical conception of its size. Unsurprisingly, Britain itself is depicted in some detail. Great Britain, unusually by medieval standards, is shown as one island, albeit with an exaggerated Cornish promontory, and Mona, Ireland and the many Scottish islands are all indicated. The cartographer is slightly confused by Iceland, depicting it both by a version of its classical name 'Thule', north-west of Britain, and as 'Island', logically linked with Scandinavia.
An open-access high-resolution digital image of the map with place and name annotations is included among the thirteen medieval maps of the world edited in the Virtual Mappa project.
Beatus Mappa Mundi (1050)
[edit]
Beatus of Liébana (c. 730–798) was an Asturian monk and theologian. He corresponded with Alcuin, and took part in the Adoptionist controversy, criticizing the views of Felix of Urgel and Elipandus of Toledo. He is best remembered today as the author of his Commentary on the Apocalypse, published in 776. An illustrated manuscript known as the Saint-Sever Beatus, featuring the Commentary, was produced around 1050 at the Abbey of Saint-Sever, Aquitaine, France. It contains one of the oldest Christian world maps as an illustration of the Commentary. Although the original manuscript and map has not survived, copies of the map survive in several of the extant manuscripts.
Mahmud al-Kashgari's Map (1072)
[edit]
Kara-Khanid scholar Mahmud al-Kashgari compiled a Dīwān Lughāt al-Turk (Compendium of the languages of the Turks) in the 11th century. The manuscript is illustrated with a 'Turkocentric' world map, oriented with east (or rather, perhaps, the direction of midsummer sunrise) on top, centered on the ancient city of Balasagun in what is now Kyrgyzstan, showing the Caspian Sea to the north, and Iraq, Armenia, Yemen and Egypt to the west, China and Japan to the east, Hindustan, Kashmir, Gog and Magog to the south. Conventional symbols are used throughout – blue lines for rivers, red lines for mountain ranges etc. The world is shown as encircled by the ocean.[27] The map is now kept at the Pera Museum in Istanbul.
Al-Idrisi's Tabula Rogeriana (1154)
[edit]
The Arab geographer, Muhammad al-Idrisi, incorporated the knowledge of Africa, the Indian Ocean and the Far East gathered by Arab merchants and explorers with the information inherited from the classical geographers to create the most accurate map of the world at the time. It remained the most accurate world map for the next three centuries. The Tabula Rogeriana was drawn by Al-Idrisi in 1154 for the Norman King Roger II of Sicily, after a stay of eighteen years at his court, where he worked on the commentaries and illustrations of the map. The map, written in Arabic, shows the Eurasian continent in its entirety, but only shows the northern part of the African continent.
Ebstorf Mappa Mundi (1235)
[edit]
The Ebstorf Map was an example of a European mappa mundi, made by Gervase of Ebstorf, who was possibly the same man as Gervase of Tilbury,[28] some time in the thirteenth century. It was a very large map: painted on 30 goatskins sewn together, it measured about 3.6 m × 3.6 m (12 ft × 12 ft). The head of Christ was depicted at the top of the map, with his hands on either side and his feet at the bottom.[29] The Map was a greatly elaborated version of the medieval tripartite or T and O map; it was centred on Jerusalem with east at the top of the map. It represented Rome in the shape of a lion, and had an evident interest in the distribution of bishoprics.[30] The original was destroyed in the bombing of Hanover in 1943 during World War II, but some photographs and colour copies remain.
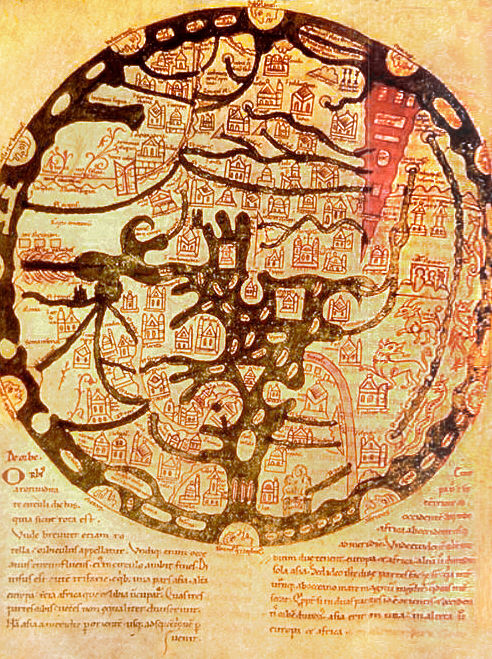
Hereford Mappa Mundi (1300)
[edit]
The Hereford Mappa Mundi is a detailed mappa mundi based on the T and O map style, dating to c. 1300. The map is signed by one "Richard of Haldingham or Lafford". Drawn on a single sheet of vellum, it measures 158 by 133 cm (62 by 52 in). The writing is in black ink, with additional red and gold, and blue or green for water (with the Red Sea coloured red). The captions demonstrate clearly the multiple functions of these large medieval maps, conveying a mass of information on Biblical subjects and general history, in addition to geography.
Jerusalem is drawn at the centre of the circle, east is on top, showing the Garden of Eden in a circle at the edge of the world (1). Great Britain is drawn at the northwestern border (bottom left, 22 & 23). Curiously, the labels for Africa and Europe are reversed, with Europe scribed in red and gold as 'Africa', and vice versa.
An open-access high-resolution digital image of the map with more than 1,000 place and name annotations is included among the thirteen medieval maps of the world edited in the Virtual Mappa project.
Pietro Vesconte's World Map (1321)
[edit]
Italian geographer Pietro Vesconte was a pioneer of the field of the portolan chart. His nautical charts are among the earliest to map the Mediterranean and Black Sea regions accurately. He also produced progressively more accurate depictions of the coastlines of northern Europe. In his world map of 1321 he brought his experience as a maker of portolans to bear; the map introduced a previously unheard of accuracy to the mappa mundi genre.[31] The world map, as well as a map of the Holy Land and plan of Acre and Jerusalem were made for inclusion in Marino Sanuto's Liber Secretorum Fidelium Crucis.[32]
Catalan World Atlas (1375)
[edit]
The Catalan World Atlas was produced by the Majorcan cartographic school and is attributed to Cresques Abraham. It has been in the royal library of France (now the Bibliothèque nationale de France) since the time of Charles V. The Catalan Atlas originally consisted of six vellum leaves folded down the middle, painted in various colours including gold and silver. The first two leaves contain texts in the Catalan language covering cosmography, astronomy, and astrology. These texts are accompanied by illustrations. The texts and illustration emphasize the Earth's spherical shape and the state of the known world. They also provide information to sailors on tides and how to tell time at night.
Unlike many other nautical charts, the Catalan Atlas is read with the north at the bottom. As a result of this the maps are oriented from left to right, from the Far East to the Atlantic. The first two leaves, forming the oriental portion of the Catalan Atlas, illustrate numerous religious references as well as a synthesis of medieval mappae mundi (Jerusalem located close to the centre) and the travel literature of the time, notably The Travels of Marco Polo and the Travels of Sir John Mandeville. Many Indian and Chinese cities can be identified.
"Da Ming Hunyi Tu" world map (after 1389)
[edit]
The Da Ming Hunyi Tu (Chinese: 大明混一图; lit. 'Amalgamated Map of the Great Ming Empire') world map, likely made in the late 14th or the 15th century,[33] shows China at the centre and Europe, half-way round the globe, depicted very small and horizontally compressed at the edge. The coast of Africa is also mapped from an Indian Ocean perspective, showing the Cape of Good Hope area. It is believed that maps of this type were made since about the 1320s, but all earlier specimens have been lost, so the earliest survivor is the elaborate, colourful Da Ming Hunyi Tu, painted on 17 m2 (180 sq ft) of silk.
Gangnido world map (1402)
[edit]
The Gangnido ("Map of Integrated Lands and Regions of Historical Countries and Capitals (of China)")[34] is a world map and historical map of China, made in Korea in 1402, although extant copies, all in Japan, were created much later. It plays a key role in reconstructing the content of the now-lost 14th-century Chinese map of the world named Shengjiao Guangbei Tu, which was based on Chinese cartographic techniques with additional input from western sources, via Islamic scholarship in the Mongol Empire. It also demonstrates the post-Mongol era stagnation of East Asian cartography as geographic information about the West was not updated until the introduction of European knowledge in the 16th and 17th centuries.[35] Superficially similar to the Da Ming Hun Yi Tu (which has been less well known in the West because it is kept in closed archive storage), the Gangnido shows its Korean origin in the enlargement of that country, and incorporates vastly improved (though wrongly positioned, scaled and oriented) mapping of Japan. Elsewhere, the map betrays a decorative rather than practical purpose, particularly in the portrayal of river systems, which form unnatural loops rarely seen on Chinese maps. Nonetheless, it is considered as "superior to anything produced in Europe prior to the end of the fifteenth century".[36]
De Virga world map (1411–1415)
[edit]
The De Virga world map was made by Albertinus de Virga between 1411 and 1415. Albertin de Virga, a Venetian, is also known for a 1409 map of the Mediterranean, also made in Venice. The world map is circular, drawn on a piece of parchment 69.6 cm × 44 cm (27.4 in × 17.3 in). It consists of the map itself, about 44 cm (17 in) in diameter, and an extension containing a calendar and two tables.
Bianco's world map (1436)
[edit]
Andrea Bianco's atlas of 1436 comprises ten leaves of vellum, measuring 29 cm × 38 cm (11 in × 15 in), in an 18th-century binding. The first leaf contains a description of the Rule of marteloio for resolving the course, with the "circle and square", two tables and two other diagrams. The next eight leaves contain various navigation charts. The ninth leaf contains a circular world map measuring 25 cm (9.8 in) in circumference. And the final leaf contains the Ptolemaic world map on Ptolemy's first projection, with graduation. Some believe Bianco's maps were the first to correctly portray the coast of Florida, as a macro-peninsula is attached to a large island labeled Antillia. Bianco also collaborated with Fra Mauro on the Fra Mauro world map of 1459.
Borgia world map (early 15th century)
[edit]
Mainly a decoration piece, the Borgia map is a world map made sometime in the early 15th century, and engraved on a metal plate.
Genoese map (1457)
[edit]
The Genoese map of 1457 is a world map that relied extensively on the account of the traveller to Asia Niccolo da Conti, rather than the usual source of Marco Polo.[37] The author is unknown, but is a more modern development than the Fra Mauro world map, less intricate and complete, with fairly good proportions given to each of the continents. The map depicts the main landmarks of the time, and figures such as the legendary Prester John in Africa, the Great Khan in China, "Xilam" (Ceylon) and Sumatra, and the design of a three-masted European ship in the Indian Ocean, something which had not occurred, suggesting that a sea-lane was a possibility.[37]
Fra Mauro world map (1459)
[edit]
The Fra Mauro map was made between 1457 and 1459 by the Venetian monk Fra Mauro. It is a circular planisphere drawn on parchment and set in a wooden frame, about 2 metres (6 ft 7 in) in diameter. The original world map was made by Fra Mauro and his assistant Andrea Bianco, a sailor-cartographer, under a commission by king Afonso V of Portugal. The map was completed on April 24, 1459, and sent to Portugal, but did not survive to the present day. Fra Mauro died the next year while he was making a copy of the map for the Seignory of Venice, and the copy was completed by Andrea Bianco.
The map is preserved in the Museo Correr in Venice.
Martellus world map (1490)
[edit]
The world map of Henricus Martellus Germanus (Heinrich Hammer), c. 1490, was remarkably similar to the terrestrial globe later produced by Martin Behaim in 1492, the Erdapfel. Both show heavy influences from Ptolemy, and both possibly derive from maps created around 1485 in Lisbon by Bartolomeo Columbus. Although Martellus is believed to have been born in Nuremberg, Behaim's home town, he lived and worked in Florence from 1480 to 1496.
Behaim's Erdapfel globe (1492)
[edit]

The Erdapfel (German: earth apple) produced by Martin Behaim in 1492 is considered to be the oldest surviving terrestrial globe. It is constructed of a laminated linen ball reinforced with wood and overlaid with a map painted on gores by Georg Glockendon.[38] The Americas are not included yet, as Columbus returned to Spain no sooner than March 1493. It shows a rather enlarged Eurasian continent and an empty ocean between Europe and Asia. It includes the mythical Saint Brendan's Island. Japan and Asian islands are disproportionately large. The idea to call the globe "apple" may be related to the Reichsapfel ("Imperial Apple", Globus cruciger) which was also kept in Nuremberg along with the Imperial Regalia (Reichskleinodien). In 1907, it was transferred to the Germanic Museum in Nuremberg.
After 1492
[edit]Juan de la Cosa Map (1500)
[edit]
Juan de la Cosa, a Spanish cartographer, explorer and conquistador, born in Santoña in what was then the Kingdom of Castille, made several maps of which the only survivor is the Mappa Mundi of 1500. It is the first known European cartographic representation of the Americas. It is now in the Museo Naval in Madrid. Reproductions of it are given by Humboldt in his Atlas géographique et physique.
Cantino Planisphere (1502)
[edit].jpg)
The Cantino planisphere or Cantino world map is the earliest surviving map showing Portuguese discoveries in the east and west. It is named after Alberto Cantino, an agent for the Duke of Ferrara, who successfully smuggled it from Portugal to Italy in 1502. It shows the islands of the Caribbean, as well as Africa, Europe and Asia. The map is particularly notable for portraying a fragmentary record of the Brazilian coast, discovered in 1500 by Portuguese explorer Pedro Álvares Cabral who conjectured whether it was merely an island[39] or part of the continent that several Spanish expeditions had just encountered farther north (cf. Amerigo Vespucci).
Caverio Map (c. 1505)
[edit]
The Caverio Map, also known as the Caveri Map or Canerio Map, is a map drawn by Nicolay de Caveri, c. 1505. It is hand drawn on parchment and coloured, being composed of ten sections or panels, measuring 2.25 by 1.15 metres (7.4 by 3.8 ft). Historians believe that this undated map signed with "Nicolay de Caveri Januensis" was completed in 1504–05. It was probably either made in Lisbon by the Genoese Canveri, or copied by him in Genoa from the very similar Cantino map. It was one of the primary sources used to make the Waldseemüller map in 1507. The Caverio map is currently at the Bibliothèque Nationale de France in Paris.
Ruysch World Map (1507)
[edit]
Johannes Ruysch an explorer, cartographer, astronomer and painter from the Low Countries produced the second oldest known printed representation of the New World.[40] The Ruysch map was published and widely distributed in 1507. It uses Ptolemy's coniform projection, as does the Contarini-Rosselli 1506 map. Both document Christopher Columbus' discoveries as well as that of John Cabot, including information from Portuguese sources and Marco Polo's account. There are notes on his map that clearly were from Portuguese sources. Newfoundland and Cuba are shown connected to Asia, as Columbus and Cabot believed. “Sipganus” (Marco Polo's Japan) is identical with “Spagnola” (Hispaniola) on the Ruysch map. The presence of codfish is noted on the Ruysch map in the area of the Grand Banks of Newfoundland and shows the discoveries the Portuguese had made along the African coast and shows India as a triangular peninsula with Ceylon in the correct proportion and position. Greenland is shown connected to Newfoundland and Asia on Ruysch's map, and not Europe as earlier maps had shown. Around the north pole, Ruysch drew islands, based on reports in the book Inventio Fortunata of the English friar Nicholas of Lynne. The island above Norway is labeled 'European Hyberborea' and has similarities to Svalbard. The peninsula stretching out towards it is marked with the church of 'Sancti Odulfi', St Olaf's church in Vardø on the Finnmark coast.
Waldseemüller and Ringmann map (1507)
[edit]
The cartographers Martin Waldseemüller and Matthias Ringmann from southern Germany, supported by the mapping friend René II, Duke of Lorraine, collected map data over several years, including information on the most recent discoveries, to build up a new collective work of geography and cartography. Along with a book they further incorporated, for the first time in history, the name America on a map, holding the strong opinion that it was a new continent that Amerigo Vespucci had discovered on his voyage and not only a few smaller islands as Christopher Columbus did in the West Indies.
Piri Reis Map (1513)
[edit]
The Piri Reis map is a famous world map created by 16th-century Ottoman Turkish admiral and cartographer Piri Reis. The surviving third of the map shows part of the western coasts of Europe and North Africa with reasonable accuracy, and the coast of Brazil is also easily recognizable. Various Atlantic islands including the Azores and Canary Islands are depicted, as is the mythical island of Antillia. The map is noteworthy for its apparent south-eastward extension of the American continent to depict a southern landmass that some controversially claim is evidence for early awareness of the existence of Antarctica. Alternatively, it has been suggested that this is actually a record of the coast as far as Cape Horn, bent south-eastward simply to fit on the parchment.
Pietro Coppo Map (1520)
[edit]
The map by Pietro Coppo was one of the last world maps to feature the "Dragon's Tail" extending southwards from the far eastern extremity of Asia, the last vestige of Ptolemy's landlocked depiction of the Indian Ocean, nearly 1,500 years earlier.
Padrón Real (1527)
[edit]The editions of the Spanish royal standard map (Padrón Real or General) overseen by Diogo Ribeiro in the 1520s and 1530s are considered to be the first scientific world maps based on empiric latitude observations. Europe and Central and South America are very precisely delineated, although Portuguese control of the African trade routes limited the accuracy of information on the Indian Ocean. Incorporating information from the Magellan, Gomes, and Loaysa expeditions and geodesic research undertaken to establish the demarcation line of the 1494 Treaty of Tordesillas, the maps show for the first time the real extension of the Pacific Ocean and the continuous coast of North America.
The originals are now lost but six copies of known provenance have survived.[41] The 1525 Castiglione Map is now held by the Estense Library in Modena, Italy; the 1526 Salviati Planisphere is held by the Biblioteca Medicea Laurenziana in Florence; the 1527 Weimar Map is held by the Anna Amalia Bibliothek in Weimar, Germany; and the 1529 Propaganda Map is held by the Vatican Library.[41] Detailed copies of the Propaganda Map were made in the 19th century by William Griggs.
-
 1525 Castiglione Map
 -
 1526 Salviati Planisphere
 -
 1527 Weimar Map
 -
 1529 Propaganda Map


Mercator world map (1569)
[edit]
Flemish geographer and cartographer Gerardus Mercator world map of 1569 introduced a cylindrical map projection that became the standard map projection known as the Mercator projection. It was a large planisphere measuring 202 by 124 cm (80 by 49 in), printed in eighteen separate sheets. While the linear scale is constant in all directions around any point, thus preserving the angles and the shapes of small objects (which makes the projection conformal), the Mercator projection distorts the size and shape of large objects, as the scale increases from the Equator to the poles, where it becomes infinite. The title (Nova et Aucta Orbis Terrae Descriptio ad Usum Navigatium Emendate: "new and augmented description of Earth corrected for the use of navigation") and the map legends show that the map was expressly conceived for the use of marine navigation. The principal feature of the projection is that rhumb lines, sailing courses at a constant bearing, are mapped to straight lines on the map. The development of the Mercator projection represented a major breakthrough in the nautical cartography of the 16th century although it was only slowly adopted by seafaring nations.
Theatrum Orbis Terrarum by Abraham Ortelius (1570)
[edit]
The Theatrum Orbis Terrarum (or "Theatre of the World") is considered to be the first true modern atlas. Prepared by Abraham Ortelius and originally printed on May 20, 1570, in Antwerp, it consisted of a collection of uniform map sheets and sustaining texts bound to form a book for which copper printing plates were specifically engraved. The Ortelius atlas is sometimes referred to as the summary of sixteenth-century cartography. Many of his atlas's maps were based upon sources that no longer exist or are extremely rare. Ortelius appended a unique source list (the "Catalogus Auctorum") identifying the names of contemporary cartographers, some of whom would otherwise have remained obscure. Three Latin editions of this (besides a Dutch, a French and a German edition) appeared before the end of 1572; twenty-five editions came out before Ortelius's death in 1598; and several others were published subsequently, as the atlas continued to be in demand until approximately 1612.
Die ganze Welt in einem Kleberblat by Heinrich Bünting (1581)
[edit]
The Bünting Clover Leaf Map, also known as The World in a Cloverleaf (German title: Die ganze Welt in einem Kleberblat/Welches ist der Stadt Hannover meines lieben Vaterlandes Wapen) is an historic mappa mundi drawn by the German Protestant pastor, theologist, and cartographer Heinrich Bünting. The map was published in his book Itinerarium Sacrae Scripturae (Travel through Holy Scripture) in 1581.
Today the map is found within the Eran Laor maps collection in the National Library of Israel in Jerusalem. A mosaic model of the map is installed on the fence of Safra Square at the site of Jerusalem's city hall.
The map is a figurative illustration, in the manner of the medieval mappa mundi format, depicting the world via a clover shape.[42] The shape is a symbolisation of the Christian Trinity and a component at the symbolisation of the German city Hanover, where Bünting was born. The city of Jerusalem is represented as the centre, surrounded by three central continents, with some more areas of the world being accordingly illustrated separately from the clover.
"Kunyu Wanguo Quantu" by Matteo Ricci (1602)
[edit].jpg)
Kunyu Wanguo Quantu (Chinese: 坤輿萬國全圖; lit. 'A Map of the Myriad Countries of the World'; Italian: Carta Geografica Completa di tutti i Regni del Mondo, "Complete Geographical Map of all the Kingdoms of the World"), printed by Italian Jesuit missionary Matteo Ricci at the request by Wanli Emperor in 1602, is the first known European-styled Chinese world map (and the first Chinese map to show the Americas). The map is in Classical Chinese, with detailed annotations and descriptions of various regions of the world, a brief account of the discovery of the Americas, polar projections, scientific explanation of parallels and meridians, and proof that the Sun is bigger than the Moon. Following Chinese cartographical convention, Ricci placed China ("the Middle Kingdom") at the centre of the world. This map is a significant mark of the expansion of Chinese knowledge of the world, and an important example of cultural syncretism directly between Europe and China. It was also exported to Korea and Japan as well.[43]
Hendrik Hondius map (1630)
[edit]_balanced.jpg)
Nova Totius Terrarum Orbis Geographica ac Hydrographica Tabula is a map of the world created by Hendrik Hondius in 1630, and published the following year at Amsterdam, in the atlas Atlantis Maioris Appendix. Illustrations of the four elements of fire, air, water, and land are included. In the four corners, there are portraits of Julius Caesar, Claudius Ptolemy, and the atlas's first two publishers, Gerard Mercator and Jodocus Hondius, the father of Hendrik.[44] Among its claims to notability is the fact that it was the first dated map published in an atlas, and therefore the first widely available map, to show any part of Australia, the only previous map to do so being Hessel Gerritsz' 1627 Caert van't Landt van d'Eendracht ("Map of the Land of Eendracht"), which was not widely distributed or recognised. The Australian coastline shown is part of the west coast of Cape York Peninsula, discovered by Jan Carstensz in 1623. Curiously, the map does not show the west coast features shown in Gerritsz' Caert.
Shahid-i Sadiq (1647)
[edit]
The Shahid-i Sadiq was an atlas composed by Sadiq Isfahani in Jaunpur.[45] This included the Inhabited Quarter, a map of the parts of the world which he held to be suitable for human life.[46] This is one of the only surviving maps made in India. The map stretched from the Insulae Fortunatae (Canary Islands) in the top right to Andalusia (Europe) to Sus al Aqsa (Western Africa) in the left.[45] The Shahid-i Sadiq included The 32 sheet atlas—with maps oriented towards the south as was the case with Islamic works of the era—is part of a larger scholarly work compiled by Isfahani during 1647.[46] This map measures 661 cm × 645 cm (260 in × 254 in; 21.69 ft × 21.16 ft).[47]
Nicolaes Visscher map (1658)
[edit]
This engraved double hemisphere map, Orbis Terrarum Nova et Accuratissima Tabula, was created by Nicolaes Visscher in 1658 in Amsterdam. It also contains smaller northern and southern polar projections. The border is decorated with mythological scenes, one in each corner, drawn by the painter Nicolaes Berchem, showing Zeus, Neptune, Persephone and Demeter. It is an early example of highly decorated Dutch world maps.[48][49]
Gerard van Schagen's Map of the World (1689)
[edit]
Gerard van Schagen (c. 1642–1724?) was a cartographer from Amsterdam, known for his exquisite reproductions of maps, particularly of those by Nicolaes Visscher I and Frederick de Wit.[50][51][52] The map is of 1689. The original size is 48.3 cm × 56.0 cm (19.0 in × 22.0 in) and was produced using copper engraving. There is only one known example, which is in the Amsterdam University.
Tovmas Vanandetsi world map (1695)
[edit]
Hamatarats Ashkharhatsuyts (Geographic Map of the World),[53] was produced in 1695 in Amsterdam by the Armenian printing firm founded by Tovmas Vanandetsi. At the time, one of the most reliable maps of the two hemispheres was the first large-scale map drawn in Armenian.[54] The world map was created in a Western cartographic style. To engrave the map's copper plates, the Schoonebeek brothers, who were considered the best masters, were employed. The map is divided into eight sections, totaling 150 × 120 cm in size. The different portions of the map were adhered to a thin canvas to guard against damage during folding. The map has conventional, astrological, and mythical symbols representing the four seasons in each of its four corners.
Samuel Dunn's map of the world (1794)
[edit]
Samuel Dunn (died 1794) was a British mathematician and amateur astronomer. His map covers the entire world in a double hemisphere projection. This map follows shortly after the explorations of Captain Cook in the Arctic and Pacific Northwest, so the general outline of North America is known. However, when this map was made, few inland expeditions had extended westward beyond the Mississippi River.[55] A southern continent is noticeably absent; earlier maps had depicted the hypothetical continent Terra Australis. These southern continents were speculative, as Antarctica had not yet been discovered.
See also
[edit]- Cylcon, Aboriginal Australian cylindro-conical stones some of which are thought to contain maps
- Dieppe maps, a series of 16th-century world maps produced in Dieppe, France
- "Here be dragons", a phrase indicating uncharted areas
- History of cartography
- Jambudvīpa, a geographic idea originated in India
- Johannes Schöner globe, made in 1520
- Mappa mundi, medieval European maps of the world
- Nebra sky disc, a Bronze Age "map" of the cosmos
- Terra incognita, uncharted territories documented in early maps
- Vinland Map, a claimed 15th-century map later confirmed as a 20th-century forgery
- Virtual Mappa, a project to digitise medieval mappa mundi
- Mao Kun map, also called Zheng He's navigation map, a world map dated to the 17th century but thought to be a copy of an early 15th-century map
Notes
[edit]- ^ Gershon, Livia. "Is This 4,000-Year-Old Bronze Age Slab the Oldest Known Map in Europe?". Smithsonian Magazine. Retrieved 9 April 2021.
- ^ "La plus ancienne carte d'Europe ?". Inrap (in French). 6 April 2021. Retrieved 9 April 2021.
- ^ "Bronze Age slab found in France is oldest 3D map in Europe". BBC News. 6 April 2021. Retrieved 14 April 2021.
- ^ Nicolas, C.; Pailler, Y.; Stephan, P.; Pierson, J.; Aubry, L.; Le Gall, B.; Lacombe, V.; Rolet, J. (April 2021). "La carte et le territoire : la dalle gravée du Bronze ancien de Saint-Bélec (Leuhan, Finistère)". Bulletin de la Société préhistorique française (in French). 118 (1): 99–146. doi:10.3406/bspf.2021.15173. Retrieved 14 April 2021.
- ^ British Museum Inv. No. 92687: "6th C BC approx". See also: Siebold, Jim. Slide 103. Archived 2016-11-09 at the Wayback Machine. Via henry-davis.com – accessed 2008-02-04. First published 1899, formerly also dated to an earlier period, c. 900 BCE. Raaflaub, Kurt A.; Talbert, Richard J. A. (2009). Geography and Ethnography: Perceptions of the World in Pre-Modern Societies. John Wiley & Sons. p. 147. ISBN 978-1-4051-9146-3.
- ^ Smith, Catherine Delano (1996). "Imago Mundi's Logo the Babylonian Map of the World". Imago Mundi. 48: 209–211. doi:10.1080/03085699608592846. JSTOR 1151277.
- ^ Finkel, Irving (1995). A join to the map of the world: A notable discovery. pp. 26–27.
- ^ "Timechart of historical cartography: Antiquity". Archived from the original on 25 February 2021.
- ^ "World map according to Eratosthenes (194 B.C.)". Archived from the original on 13 August 2021.
- ^ "Poseidonius". Encyclopædia Britannica. "Greek philosopher, considered the most learned man of his time and, possibly, of the entire Stoic school."
- ^ Poseidonius, fragment 202
- ^ Brown, Lloyd Arnold (1979). The Story of Maps. Dover Publications. pp. 29–31.
- ^ Freely, John (2013). Before Galileo: The Birth of Modern Science in Medieval Europe. ISBN 978-1468308501.
- ^ Strabonis Geographica, Book 17, Chapter 7.
- ^ Vat. Urbinas Graecus 82.
- ^ Codex Seragliensis GI 57
- ^ a b Snyder, John P. (1993), Flattening the Earth: Two Thousand Years of Map Projections, Chicago: University of Chicago Press, p. 14, ISBN 978-0226767475
- ^ Eastwood, B., and Graßhoff, G. (2004). "Planetary Diagrams for Roman Astronomy in Medieval Europe, ca. 800–1500". Transactions of the American Philosophical Society 94:3. pp. 49–50.
- ^ Macrobius, Commentary on the Dream of Scipio, transl. W. H. Stahl, (New York: Columbia University Press, 1952), chapters v-vii (pp. 200–212).
- ^ Michael Livingston, Modern Medieval Map Myths: The Flat World, Ancient Sea-Kings, and Dragons Archived 2006-02-09 at the Wayback Machine, 2002.
- ^ "Focus sur... La Mappa mundi d'Albi". mediatheques.grand-albigeois.fr (in French).
- ^ "La " Mappa mundi d'Albi " a rejoint en octobre 2015 le registre " Mémoire du monde " de l'Unesco". culture.fr (in French)..
- ^ "Présentation de la Mappa Mundi d'Albi". www.youtube.com (in French). 4 February 2016. Archived from the original on 21 December 2021.
- ^ The History of cartography by John Brian Harley, David Woodward pp. 120ff
- ^ Siebold, Jim Slide 210 monograph: Cottoniana or Anglo-Saxon Map Archived 2018-07-30 at the Wayback Machine, via henry-davis.com - accessed 2008-02-04
- ^ British Library Collect Britain Archived 2009-04-28 at the Wayback Machine, accessed 2008-03-14
- ^ 81 – The First Turkish World Map, by Kashgari (1072) « Strange Maps
- ^ Gervase of Tilbury, Otia Imperialia, (Oxford Medieval Texts), Oxford, 2002, p. xxxiv.
- ^ Edson, Evelyn (1997). Mapping Time and Space: How Medieval Mapmakers viewed their World. London: British Library. p. 138. ISBN 0-7123-4535-3.
- ^ Gervase of Tilbury, Otia Imperialia, (Oxford Medieval Texts), Oxford, 2002, p. xxxv
- ^ "Vesconte World Maps". Archived from the original on 17 February 2020.
- ^ Harley, John Brian; Woodward, David, eds. (1987). The History of Cartography. Chicago: University of Chicago Press. ISBN 0-226-31633-5.[permanent dead link]
- ^ The place names on the map reflect the political situation in 1389, or the 22nd year of the reign of the Hongwu Emperor. Thus some Chinese scholars concluded that it was indeed created in 1389 or little later (Wang et al., Juanben caihui Daming Hunyi Tu yanjiu 绢本彩绘大明混一图研究 (As Regards the Da Ming Hun Yi Tu Drawn in Colours on Stiff Silk), in: Zhongguo gudai dituji: Ming dai 中國古代地图集 明代 (An Atlas of Ancient Maps in China: The Ming dynasty (1368–1644)), Beijing, 1994, pp. 51–55). Others maintain that this reflects an earlier source and that the Da Ming Hun Yi Tu itself was created much later (Miya Noriko, "Kon'itsu Kyōri Rekidai Kokuto no Zu" he no michi 「混一疆理歴代国都之図」への道, Mongoru jidai no shuppan bunka モンゴル時代の出版文化, 2006, 487–651 (pp. 511–512).
- ^ a b Robinson, Kenneth R. (2007). "Chosŏn Korea in the Ryukoku Kangnido: Dating the Oldest Extant Korean Map of the World (15th Century)". Imago Mundi. 59 (2): 177–192. doi:10.1080/03085690701300964. S2CID 128416415.
- ^ Miya Noriko 宮紀子 (2006). "Kon'itsu Kyōri Rekidai Kokuto no Zu" he no michi 「混一疆理歴代国都之図」への道". Mongoru jidai no shuppan bunka モンゴル時代の出版文化 (in Japanese). pp. 487–651.
- ^ Jackson, Peter (2005). The Mongols and the West. New York: Pearson Longman. p. 330. ISBN 0-582-36896-0.
- ^ a b Whitfield, Peter (1998). New Found Lands: Maps in the History of Exploration. New York: Routledge. p. 36. ISBN 0-415-92026-4.
- ^ Behaim Globe at Bayern-online
- ^ Letter of Pero Vaz de Caminha, beijo as maãos de vosa alteza. deste porto seguro da vosa jlha da vera cruz (see original letter in archaic Portuguese, in the Portuguese Wikisource project): I kiss Your Majesty's Hands, from this safe haven of your island of Vera Cruz
- ^ McGuirk, Donald L. Jr. (1989). "Ruysch World Map: Census and Commentary". Imago Mundi. 41 (1): 133–141. doi:10.1080/03085698908592674.
- ^ a b Ribero, Diego. "Carta Universal". Archived from the original on 9 November 2020.
- ^ Genevieve Carlton (2015). Worldly Consumers: The Demand for Maps in Renaissance Italy. University of Chicago Press. p. 42. ISBN 978-0-226-25545-3.
- ^ Rothstein, Edward (19 January 2010). "Map That Shrank the World". New York Times, Arts, Exhibition Review. New York: New York Times Company. Retrieved 20 January 2010.
- ^ "Nova totius terrarum orbis geographica ac hydrographica tabula". Norman B. Leventhal Map Center.
- ^ a b Isfahani, Sadiq (1647). "Map of the "Inhabited Quarter"" (PDF).
- ^ a b Schwartzberg, 1302
- ^ Schwartzberg, 1303
- ^ "Visscher, Nicolaes (1618–1679). Orbis Terrarum Nova et Accuratissima Tabula. Amsterdam: 1658". Christie's.
- ^ "Orbis Terrarum Nova et Accuratissima Tabula, 1658". Commonwealth Bank.
- ^ "van Schagen 1680 World & Continents". Archived from the original on 10 April 2016. Retrieved 9 October 2016.
- ^ Catalog of van Schagen's maps Archived 7 November 2023 at the Wayback Machine at the University of Amsterdam
- ^ Biographical sketch Archived 7 November 2023 at the Wayback Machine (in Dutch)
- ^ "RareMaps.com".
- ^ "Art-A-Tsolum". 21 August 2023.
- ^ Gordon Goodwin: "Dunn, Samuel (d.1794)" in Leslie Stephen, Dictionary of National Biography, 16, London, 1888, 211–213.
Further reading
[edit]- Brodersen, Kai (2012). "Chapter 4: Cartography". Geography in Classical Antiquity. By Dueck, Daniela. Cambridge: Cambridge Univ. Press. pp. 99–110. ISBN 9780521197885.
- Edson, Evelyn (1993). "The Oldest World Maps: Classical Sources of Three Eighth Century Mappaemundi". Ancient World. 24 (2): 169–184.
- Fox, Michael; Reimer, Stephen R (2008). Mappae Mundi: Representing the World and Its Inhabitants In Texts, Maps, and Images In Medieval and Early Modern Europe. Edmonton: Department of English and Film Studies, University of Alberta. ISBN 9781551951874. OCLC 227019112.
- Goffart, Walter (2003). Historical Atlases: The First Three Hundred Years, 1570–1870. Chicago: Univ. of Chicago Press. ISBN 9780226300726. OCLC 727367115.
- Harwood, Jeremy; Bendall, A. Sarah (2006). To the Ends of the Earth: 100 Maps That Changed the World. Cincinnati, OH: David & Charles. ISBN 9781582974644. OCLC 75546416.
- Harvey, Paul D.A., ed. (2006). The Hereford World Map: Medieval World Maps and their Context. London: British Library. ISBN 9780712347600. OCLC 0712347607.
- Shirley, Rodney W. (1993). The Mapping of the World: Early Printed World Maps 1472–1700. London: Holland Press. ISBN 9781853682711. OCLC 29389647.
- Talbert, Richard J.A., ed. (2000). Barrington Atlas of the Greek and Roman World. Princeton, NJ: Princeton Univ. Press. ISBN 9780691031699. OCLC 43970336.
- Wendt, Henry; Delaney, John; Bowles, Alex (2010). Envisioning the World: The First Printed Maps 1472–1700. Santa Rosa, CA: Sonoma County Museum. OCLC 617728973.
- Woodward, David (1985). "Reality, Symbolism, Time, and Space in Medieval World Maps". Annals of the Association of American Geographers. 75 (4): 510–521. doi:10.1111/j.1467-8306.1985.tb00090.x.
External links
[edit]![]() Media related to Maps of the world before Columbus at Wikimedia Commons
Media related to Maps of the world before Columbus at Wikimedia Commons
- Index of Maps of the Early Medieval Period – HenryDavis.com Archived 2007-03-12 at the Wayback Machine
- Mapping History – resource from the British Library
- Geography and Map Reading Room at the Library of Congress
- Ancient World Maps
- The Peutinger Map
- Virtual Mappa: Digital Editions of Early Medieval Maps of the World, edit. Martin Foys, Heather Wacha, et al. (Philadelphia, PA: Schoenberg Institute of Manuscript Studies, 2018): doi:10.21231/ef21-ev82
- Medieval Maps and Mapping Resources
| International | |
|---|---|
| National | |
| Other | |