

Community hub
Recent from talks
Contribute something
Nothing was collected or created yet.
World population
View on Wikipedia

In world demographics, the world population is the total number of humans currently alive. It was estimated by the United Nations to have exceeded eight billion in mid-November 2022. It took around 300,000 years of human prehistory and history for the human population to reach a billion and only 218 more years to reach 8 billion.
The human population has experienced continuous growth following the Great Famine of 1315–1317 and the end of the Black Death in 1350, when it was nearly 370,000,000.[2] The highest global population growth rates, with increases of over 1.8% per year, occurred between 1955 and 1975, peaking at 2.1% between 1965 and 1970.[3] The growth rate declined to 1.1% between 2015 and 2020 and is projected to decline further in the 21st century.[4] The global population is still increasing, but there is significant uncertainty about its long-term trajectory due to changing fertility and mortality rates.[5] The UN Department of Economics and Social Affairs projects between 9 and 10 billion people by 2050 and gives an 80% confidence interval of 10–12 billion by the end of the 21st century,[1] with a growth rate by then of zero. Other demographers predict that the human population will begin to decline in the second half of the 21st century.[6]
The total number of births globally is currently (2015–2020) 140 million/year, which is projected to peak during the period 2040–2045 at 141 million/year and then decline slowly to 126 million/year by 2100.[7] The total number of deaths is currently 57 million/year and is projected to grow steadily to 121 million/year by 2100.[8]
The median age of human beings as of 2020[update] is 31 years.[9]
History
[edit]
Estimates of world population by their nature are an aspect of modernity, possible only since the Age of Discovery. Early estimates for the population of the world[10] date to the 17th century: William Petty, in 1682, estimated the world population at 320 million (current estimates ranging close to twice this number); by the late 18th century, estimates ranged close to one billion (consistent with current estimates).[11] More refined estimates, broken down by continents, were published in the first half of the 19th century, at 600 million to 1 billion in the early 1800s and 800 million to 1 billion in the 1840s.[12]
It is difficult for estimates to be better than rough approximations, as even current population estimates are fraught with uncertainties from 3% to 5%.[13]
Prehistoric patterns
[edit]The history of the world's population involves a great deal of speculation. Before 9000 BC, all humans were hunter-gatherers living in small bands that usually verged on the edge of extinction. Survival depended on the capture of hunted animals; if supply of animals dwindled for any reason, humans would starve; if the human population grew too large the number of surviving animals would shrink, leading to starvation the next year for the hunters. (Humans had not yet invented the technique of domesticating and herding animals.) The hunting cultures sometimes fished, and usually gathered wild seeds and nuts, but they did not plant or grow vegetables or any other crops. One very rough estimate is 8 million hunters lived circa 9000 BC when the first of several "agricultural revolutions" occurred in the eastern hemisphere. (The dates are very conjectural.) About the year 9000 BC in the Middle East, for reasons unknown, some groups began to domesticate and graze sheep. The practice of cultivating plants was invented independently in three places: in the Middle East and Europe (wheat, 6500–3500 BC), in Southeast Asia (rice, 6800–4000 BC), and in Central America and Peru (corn, about 2500 BC).[14]
Agriculture provided a steady food supply that could be stored for a year or longer in order to minimize the risk of famine. Farm production could be expanded by systematic human exertion. The new technology of farming meant that the food supply was proportional to the number of workers who could plant and harvest the crops. Every new pair of hands meant more food for the community, so children were valued in agricultural societies. Later, additional workers found useful work in building irrigation canals and systems that provided a stable water supply for crops, especially in Egypt, Mesopotamia, India, China, Peru and Mexico. The population could now grow because new people paid their own way. (It would take many centuries before the arable land supply became a limiting factor.) However, death rates were high, especially for infants and children, so even with high birth rates growth was slow. The same amount of land could support either 1,000 hunters or 100,000 farmers, and it is easy to see which side ultimately would win a fight for the land. Farmers gathered in permanent villages, and through a process of warfare consolidated into much larger states, including those in China, India, Egypt and Mesopotamia. From 300 to 1400 AD large agricultural states also existed throughout the eastern United States, called the "Hopewell tradition" and "Mississippian cultures". They are most famous as Mound Builders, but their culture collapsed (for unknown reasons) by 1500. The natives encountered by the English and French were nomadic hunters who supplemented their meat diet with cultivated vegetables.[15][16]
Ancient and post-classical history
[edit]Estimates of the population of the world at the time agriculture emerged in around 10,000 BC have ranged between 1 million and 15 million.[17][18] Even earlier, genetic evidence suggests humans may have gone through a population bottleneck of between 1,000 and 10,000 people about 70,000 BC, according to the now largely discredited Toba catastrophe theory. By contrast, it is estimated that around 50–60 million people lived in the combined eastern and western Roman Empire in the 4th century AD.[19]
The Plague of Justinian caused Europe's population to drop by around 50% between the 6th and 8th centuries AD.[20] The population of Europe was more than 70 million in 1340.[21] From 1340 to 1400, the world's population fell from an estimated 443 million to 350–375 million,[22] with the Indian subcontinent suffering the most tremendous loss and Europe suffering the Black Death pandemic;[23] it took 200 years for European population figures to recover.[24] The population of China decreased from 123 million in 1200 to 65 million in 1393,[25] presumably from a combination of Mongol invasions, famine, and plague.[26]
Starting in AD 2, the Han dynasty of ancient China kept consistent family registers to properly assess the poll taxes and labor service duties of each household.[27] In that year, the population of Western Han was recorded as 57,671,400 individuals in 12,366,470 households, decreasing to 47,566,772 individuals in 9,348,227 households by AD 146, towards the end of the Han dynasty.[27] From 200 to 400, the world population fell from an estimated 257 million to 206 million, with China suffering the greatest loss.[23] At the founding of the Ming dynasty in 1368, China's population was reported to be close to 60 million; toward the end of the dynasty in 1644, it may have approached 150 million.[28] England's population reached an estimated 5.6 million in 1650, up from an estimated 2.6 million in 1500.[29] New crops that were brought to Asia and Europe from the Americas by Portuguese and Spanish colonists in the 16th century are believed to have contributed to population growth.[30][31][32] Since their introduction to Africa by Portuguese traders in the 16th century,[33] maize and cassava have similarly replaced traditional African crops as the most important staple food crops grown on the continent.[34]
The pre-Columbian population of the Americas is uncertain; historian David Henige called it "the most unanswerable question in the world."[35] By the end of the 20th century, scholarly consensus favored an estimate of roughly 55 million people, but numbers from various sources have ranged from 10 million to 100 million.[36] Encounters between European explorers and populations in the rest of the world often introduced local epidemics of extraordinary virulence.[37] According to the most extreme scholarly claims, as many as 90% of the Native American population of the New World died of Old World diseases such as smallpox, measles, and influenza.[38] Over the centuries, the Europeans had developed high degrees of immunity to these diseases, while the indigenous peoples had no such immunity.[39]
Modern history
[edit]
During the European Agricultural and Industrial Revolutions, the life expectancy of children increased dramatically.[41] The percentage of the children born in London who died before the age of five decreased from 74.5% in 1730–1749 to 31.8% in 1810–1829.[42][43] Between 1700 and 1900, Europe's population increased from about 100 million to over 400 million.[44] Altogether, the areas populated by people of European descent comprised 36% of the world's population in 1900.[45]
Population growth in the Western world became more rapid after the introduction of vaccination and other improvements in medicine and sanitation.[46] Improved material conditions led to the population of Britain increasing from 10 million to 40 million in the 19th century.[47] The population of the United Kingdom reached 60 million in 2006.[48] The United States saw its population grow from around 5.3 million in 1800 to 106 million in 1920, exceeding 307 million in 2010.[49]
20th century
[edit]The first half of the 20th century in Imperial Russia and the Soviet Union was marked by a succession of major wars, famines and other disasters which caused large-scale population losses (approximately 60 million excess deaths).[50][51] After the collapse of the Soviet Union, Russia's population declined significantly – from 150 million in 1991 to 143 million in 2012[52] – but by 2013 this decline appeared to have halted.[53]
Many countries in the developing world have experienced extremely rapid population growth since the early 20th century, due to economic development and improvements in public health. China's population rose from approximately 430 million in 1850 to 580 million in 1953,[54] and now stands at over 1.3 billion. The population of the Indian subcontinent, which was about 125 million in 1750, increased to 389 million in 1941;[55] today, India, Pakistan and Bangladesh are collectively home to about 1.63 billion people.[56] Java, an island in Indonesia, had about 5 million inhabitants in 1815; it had a population of over 139 million in 2020.[57] In just one hundred years, the population of Brazil decupled (x10), from about 17 million in 1900, or about 1% of the world population in that year, to about 176 million in 2000, or almost 3% of the global population in the very early 21st century. Mexico's population grew from 13.6 million in 1900 to about 112 million in 2010.[58][59] Between the 1920s and 2000s, Kenya's population grew from 2.9 million to 37 million.[60]
Milestones by the billions
[edit]| Population | 1 | 2 | 3 | 4 | 5 | 6 | 7 | 8 | 9 | 10 |
|---|---|---|---|---|---|---|---|---|---|---|
| Year | 1804 | 1927 | 1960 | 1974 | 1987 | 1999 | 2011 | 2022 | 2037 | 2057 |
| Years elapsed | – | 123 | 33 | 14 | 13 | 12 | 12 | 11 | 15 | 20 |
The UN estimated that the world population reached one billion for the first time in 1804. It was another 123 years before it reached two billion in 1927, but it took only 33 years to reach three billion in 1960.[62] Thereafter, it took 14 years for the global population to reach four billion in 1974, 13 years to reach five billion in 1987, 12 years to reach six billion in 1999 and, according to the United States Census Bureau, 13 years to reach seven billion in March 2012.[63] The United Nations, however, estimated that the world population reached seven billion in October 2011.[64][65][66]
According to the UN, the global population reached eight billion in November 2022,[67] but because the growth rate is slowing, it will take another 15 years to reach around 9 billion by 2037 and 20 years to reach 10 billion by 2057.[68] Alternative scenarios for 2050 range from a low of 7.4 billion to a high of more than 10.6 billion.[69] Projected figures vary depending on underlying statistical assumptions and the variables used in projection calculations, especially the fertility and mortality variables. Long-range predictions to 2150 range from a population decline to 3.2 billion in the "low scenario", to "high scenarios" of 24.8 billion.[69] One extreme scenario predicted a massive increase to 256 billion by 2150, assuming the global fertility rate remained at its 1995 level of 3.04 children per woman; however, by 2010 the global fertility rate had declined to 2.52.[70][71]
There is no estimation for the exact day or month the world's population surpassed one or two billion. The points at which it reached three and four billion were not officially noted, but the International Database of the United States Census Bureau placed them in July 1959 and April 1974 respectively. The United Nations did determine, and commemorate, the "Day of 5 Billion" on 11 July 1987, and the "Day of 6 Billion" on 12 October 1999. The Population Division of the United Nations declared the "Day of Seven Billion" to be 31 October 2011.[72] The United Nations marked the birth of the eight billionth person on 15 November 2022.[73][67]
Global demographics
[edit]
- >80
- 77.5–80
- 75–77.5
- 72.5–75
- 70–72.5
- 67.5–70
- 65–67.5
- 60–65
- 55–60
- 50–55
As of 2020, the global sex ratio is approximately 1.01 males to 1 female.[75] Approximately 24.7% of the global population is aged under 15, while 65.2% is aged 15–64 and 10.1% is aged 65 or over.[75] The median age of the world's population is estimated to be 31 years in 2020,[9] and is expected to rise to 37.9 years by 2050.[76]
According to the World Health Organization, the global average life expectancy is 73.3 years as of 2020, with women living an average of 75.9 years and men approximately 70.8 years.[77] In 2010, the global fertility rate was estimated at 2.44 children per woman.[78] In June 2012, British researchers calculated the total weight of Earth's human population as approximately 287 million tonnes (630 billion pounds), with the average person weighing around 62 kilograms (137 lb).[79]
The IMF estimated nominal 2021 gross world product at US$94.94 trillion, giving an annual global per capita figure of around US$12,290.[80] Around 9.3% of the world population live in extreme poverty, subsisting on less than US$1.9 per day;[81] around 8.9% are malnourished.[82] 87% of the world's over-15s are considered literate.[83] As of January 2024, there were about 5 billion global Internet users, constituting 66% of the world population.[84]
The Han Chinese are the world's largest single ethnic group, constituting over 19% of the global population in 2011.[85] The world's most-spoken languages[a] are English (1.132B), Mandarin Chinese (1.117B), Hindi (615M), Spanish (534M) and French (280M). More than three billion people speak an Indo-European language, which is the largest language family by number of speakers. Standard Arabic is a language with no native speakers, but the total number of speakers is estimated at 274 million people.[86]
The largest religious categories in the world as of 2020 are estimated as follows: Christianity (31%), Islam (25%), Unaffiliated (16%) and Hinduism (15%).[87]
Population by region
[edit]Six of the Earth's seven continents are permanently inhabited on a large scale. Asia is the most populous continent, with its 4.64 billion inhabitants accounting for 60% of the world population. The world's two most populated countries, India and China, together constitute about 36% of the world's population. Africa is the second most populated continent, with around 1.34 billion people, or 17% of the world's population. Europe's 747 million people make up 10% of the world's population as of 2020, while the Latin American and Caribbean regions are home to around 653 million (8%). Northern America, primarily consisting of the United States and Canada, has a population of around 368 million (5%), and Oceania, the least populated region, has about 42 million inhabitants (0.5%).[88] Antarctica only has a very small, fluctuating population of about 1200 people based mainly in polar science stations.[89]

| Region | 2022 (percent) | 2030 (percent) | 2050 (percent) |
|---|---|---|---|
| Sub-Saharan Africa | 1,152 (14.51%) | 1,401 (16.46%) | 2,094 (21.62%) |
| Northern Africa and Western Asia | 549 (6.91%) | 617 (7.25%) | 771 (7.96%) |
| Central Asia and Southern Asia | 2,075 (26.13%) | 2,248 (26.41%) | 2,575 (26.58%) |
| Eastern Asia and Southeastern Asia | 2,342 (29.49%) | 2,372 (27.87%) | 2,317 (23.92%) |
| Europe and Northern America | 1,120 (14.10%) | 1,129 (13.26%) | 1,125 (11.61%) |
| Latin America and the Caribbean | 658 (8.29%) | 695 (8.17%) | 749 (7.73%) |
| Australia and New Zealand | 31 (0.39%) | 34 (0.40%) | 38 (0.39%) |
| Oceania | 14 (0.18%) | 15 (0.18%) | 20 (0.21%) |
| World | 7,942 | 8,512 | 9,687 |
| Region | Density (inhabitants/km2) |
Population (millions) |
Most populous country | Most populous city (metropolitan area) |
|---|---|---|---|---|
| Asia | 104.1 | 4,641 | 1,439,090,595 – |
13,515,000 – (37,400,000 – |
| Africa | 44.4 | 1,340 | 211,401,000 – |
9,500,000 – (20,076,000 – |
| Europe | 73.4 | 747 | 146,171,000 – |
13,200,000 – (20,004,000 – |
| Latin America | 24.1 | 653 | 214,103,000 – |
12,252,000 – (21,650,000 – |
| Northern America[note 1] | 14.9 | 368 | 332,909,000 – |
8,804,000 – (23,582,649 – |
| Oceania | 5 | 42 | 25,917,000 – |
5,367,000 – |
| Antarctica | ~0 | 0.004[89] | N/A[note 2] | 1,258 – |
Largest populations by country
[edit]
.png)

Ten most populous countries
[edit]| Country / Dependency | Population | % of world |
Date | Source (official or from the United Nations) |
|---|---|---|---|---|
| 1,425,775,850 | 17.4% | 14 Apr 2023 | UN projection[92] | |
| 1,409,670,000 | 17.2% | 17 Jan 2024 | National annual estimate[93] | |
| 338,540,722 | 4.12% | 1 Nov 2025 | National population clock[94] | |
| 278,696,200 | 3.39% | 1 Jul 2023 | National annual estimate[95] | |
| 229,488,994 | 2.80% | 1 Jul 2022 | UN projection[96] | |
| 219,873,815 | 2.68% | 1 Nov 2025 | National population clock[97] | |
| 216,746,934 | 2.64% | 1 Jul 2022 | UN projection[96] | |
| 168,220,000 | 2.05% | 1 Jul 2020 | Annual Population Estimate[98] | |
| 147,190,000 | 1.79% | 1 Oct 2021 | 2021 preliminary census results[99] | |
| 128,271,248 | 1.56% | 31 Mar 2022 |
Approximately 4.6 billion people live in these ten countries, representing around 57% of the world's population as of July 2023.
| # | Most populous countries | 2000 | 2015 | 2030[A] | |
|---|---|---|---|---|---|
| 1 | 1,270 | 1,376 | 1,416 | ||
| 2 | 1,053 | 1,311 | 1,528 | ||
| 3 | 283 | 322 | 356 | ||
| 4 | 212 | 258 | 295 | ||
| 5 | 136 | 208 | 245 | ||
| 6 | 176 | 206 | 228 | ||
| 7 | 123 | 182 | 263 | ||
| 8 | 131 | 161 | 186 | ||
| 9 | 146 | 146 | 149 | ||
| 10 | 103 | 127 | 148 | ||
| World total | 6,127 | 7,349 | 8,501 | ||
| Notes: | |||||
Most densely populated countries
[edit]The tables below list the world's most densely populated countries, both in absolute terms and in comparison to their total populations, as of November 2022. All areas and populations are from The World Factbook, unless otherwise noted.
.jpg)
| Rank | Country | Population | Area (km2) |
Density (pop/km2) |
|---|---|---|---|---|
| 1 | 5,921,231 | 719 | 8,235 | |
| 2 | 165,650,475 | 148,460 | 1,116 | |
| 3 | 5,223,000 | 6,025 | 867 | |
| 4 | 23,580,712 | 35,980 | 655 | |
| 5 | 51,844,834 | 99,720 | 520 | |
| 6 | 5,296,814 | 10,400 | 509 | |
| 7 | 13,173,730 | 26,338 | 500 | |
| 8 | 12,696,478 | 27,830 | 456 | |
| 9 | 9,402,617 | 21,937 | 429 | |
| 10 | 1,389,637,446 | 3,287,263 | 423 |
| Rank | Country | Population | Area (km2) |
Density (pop/km2) |
Population trend[citation needed] |
|---|---|---|---|---|---|
| 1 | 1,389,637,446 | 3,287,263 | 423 | Growing | |
| 2 | 242,923,845 | 796,095 | 305 | Rapidly growing | |
| 3 | 165,650,475 | 148,460 | 1,116 | Growing | |
| 4 | 124,214,766 | 377,915 | 329 | Declining[103] | |
| 5 | 114,597,229 | 300,000 | 382 | Growing | |
| 6 | 103,808,319 | 331,210 | 313 | Growing | |
| 7 | 67,791,400 | 243,610 | 278 | Growing | |
| 8 | 51,844,834 | 99,720 | 520 | Steady | |
| 9 | 23,580,712 | 35,980 | 655 | Steady | |
| 10 | 23,187,516 | 65,610 | 353 | Growing |
Fluctuation
[edit].svg)
Population size fluctuates at differing rates in differing regions. Nonetheless, population growth has been the long-standing trend on all inhabited continents, as well as in most individual states. During the 20th century, the global population saw its greatest increase in known history, rising from about 1.6 billion in 1900 to over 6 billion in 2000[104] as the whole world entered the early phases of what has come to be called the "demographic transition". Some of the key factors contributing to this increase included the lessening of the mortality rate in many countries by improved sanitation and medical advances, and a massive increase in agricultural productivity attributed to the Green Revolution.[105][106] By 2000, there were approximately ten times as many people on Earth as there had been in 1700.
However, this rapid growth did not last. During the period 2000–2005, the United Nations estimates that the world's population was growing at an annual rate of 1.3% (equivalent to around 80 million people), down from a peak of 2.1% during the period 1965–1970.[4] Globally, although the population growth rate has been steadily declining from its peak in 1968,[107] growth still remains high in Sub-Saharan Africa.[108]

_001.jpg)
In fact, during the 2010s, Japan and some countries in Europe began to reduce in population, due to sub-replacement fertility rates.[103]
In 2019, the United Nations reported that the rate of population growth continues to decline due to the ongoing global demographic transition. If this trend continues, the rate of growth may diminish to zero by 2100, concurrent with a world population plateau of 10.9 billion.[4][68] However, this is only one of many estimates published by the UN; in 2009, UN population projections for 2050 ranged between around 8 billion and 10.5 billion.[109] An alternative scenario is given by the statistician Jorgen Randers, who argues that traditional projections insufficiently take into account the downward impact of global urbanization on fertility. Randers' "most likely scenario" reveals a peak in the world population in the early 2040s at about 8.1 billion people, followed by decline.[110] Adrian Raftery, a University of Washington professor of statistics and of sociology, states that "there's a 70 percent probability the world population will not stabilize this century. Population, which had sort of fallen off the world's agenda, remains a very important issue."[111]
-
 Estimated world population figures, 10,000 BC – AD 2000
 -
 Estimated world population figures, 10,000 BC – AD 2000 (in log y scale)
 -
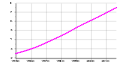 World population figures, 1950–2017

.png)

Annual population growth
[edit]| Year | Population | Yearly growth | Density (pop/km2) | |
|---|---|---|---|---|
| % | Number | |||
| 1951 | 2,543,130,380 | 1.75% | 43,808,223 | 17 |
| 1952 | 2,590,270,899 | 1.85% | 47,140,519 | 17 |
| 1953 | 2,640,278,797 | 1.93% | 50,007,898 | 18 |
| 1954 | 2,691,979,339 | 1.96% | 51,700,542 | 18 |
| 1955 | 2,746,072,141 | 2.01% | 54,092,802 | 18 |
| 1956 | 2,801,002,631 | 2.00% | 54,930,490 | 19 |
| 1957 | 2,857,866,857 | 2.03% | 56,864,226 | 19 |
| 1958 | 2,916,108,097 | 2.04% | 58,241,240 | 20 |
| 1959 | 2,970,292,188 | 1.86% | 54,184,091 | 20 |
| 1960 | 3,019,233,434 | 1.65% | 48,941,246 | 20 |
| 1961 | 3,068,370,609 | 1.63% | 49,137,175 | 21 |
| 1962 | 3,126,686,743 | 1.90% | 58,316,134 | 21 |
| 1963 | 3,195,779,247 | 2.21% | 69,092,504 | 21 |
| 1964 | 3,267,212,338 | 2.24% | 71,433,091 | 22 |
| 1965 | 3,337,111,983 | 2.14% | 69,899,645 | 22 |
| 1966 | 3,406,417,036 | 2.08% | 69,305,053 | 23 |
| 1967 | 3,475,448,166 | 2.03% | 69,031,130 | 23 |
| 1968 | 3,546,810,808 | 2.05% | 71,362,642 | 24 |
| 1969 | 3,620,655,275 | 2.08% | 73,844,467 | 24 |
| 1970 | 3,695,390,336 | 2.06% | 74,735,061 | 25 |
| 1971 | 3,770,163,092 | 2.02% | 74,772,756 | 25 |
| 1972 | 3,844,800,885 | 1.98% | 74,637,793 | 26 |
| 1973 | 3,920,251,504 | 1.96% | 75,450,619 | 26 |
| 1974 | 3,995,517,077 | 1.92% | 75,265,573 | 27 |
| 1975 | 4,069,437,231 | 1.85% | 73,920,154 | 27 |
| 1976 | 4,142,505,882 | 1.80% | 73,068,651 | 28 |
| 1977 | 4,215,772,490 | 1.77% | 73,266,608 | 28 |
| 1978 | 4,289,657,708 | 1.75% | 73,885,218 | 29 |
| 1979 | 4,365,582,871 | 1.77% | 75,925,163 | 29 |
| 1980 | 4,444,007,706 | 1.80% | 78,424,835 | 30 |
| 1981 | 4,524,627,658 | 1.81% | 80,619,952 | 30 |
| 1982 | 4,607,984,871 | 1.84% | 83,357,213 | 31 |
| 1983 | 4,691,884,238 | 1.82% | 83,899,367 | 32 |
| 1984 | 4,775,836,074 | 1.79% | 83,951,836 | 32 |
| 1985 | 4,861,730,613 | 1.80% | 85,894,539 | 33 |
| 1986 | 4,950,063,339 | 1.82% | 88,332,726 | 33 |
| 1987 | 5,040,984,495 | 1.84% | 90,921,156 | 34 |
| 1988 | 5,132,293,974 | 1.81% | 91,309,479 | 34 |
| 1989 | 5,223,704,308 | 1.78% | 91,410,334 | 35 |
| 1990 | 5,316,175,862 | 1.77% | 92,471,554 | 36 |
| 1991 | 5,406,245,867 | 1.69% | 90,070,005 | 36 |
| 1992 | 5,492,686,093 | 1.60% | 86,440,226 | 37 |
| 1993 | 5,577,433,523 | 1.54% | 84,747,430 | 37 |
| 1994 | 5,660,727,993 | 1.49% | 83,294,470 | 38 |
| 1995 | 5,743,219,454 | 1.46% | 82,491,461 | 39 |
| 1996 | 5,825,145,298 | 1.43% | 81,925,844 | 39 |
| 1997 | 5,906,481,261 | 1.40% | 81,335,963 | 40 |
| 1998 | 5,987,312,480 | 1.37% | 80,831,219 | 40 |
| 1999 | 6,067,758,458 | 1.34% | 80,445,978 | 41 |
| 2000 | 6,148,898,975 | 1.34% | 81,140,517 | 41 |
| 2001 | 6,230,746,982 | 1.33% | 81,848,007 | 42 |
| 2002 | 6,312,407,360 | 1.31% | 81,660,378 | 42 |
| 2003 | 6,393,898,365 | 1.29% | 81,491,005 | 43 |
| 2004 | 6,475,751,478 | 1.28% | 81,853,113 | 43 |
| 2005 | 6,558,176,119 | 1.27% | 82,424,641 | 44 |
| 2006 | 6,641,416,218 | 1.27% | 83,240,099 | 45 |
| 2007 | 6,725,948,544 | 1.27% | 84,532,326 | 45 |
| 2008 | 6,811,597,272 | 1.27% | 85,648,728 | 46 |
| 2009 | 6,898,305,908 | 1.27% | 86,708,636 | 46 |
| 2010 | 6,985,603,105 | 1.27% | 87,297,197 | 47 |
| 2011 | 7,073,125,425 | 1.25% | 87,522,320 | 47 |
| 2012 | 7,161,697,921 | 1.25% | 88,572,496 | 48 |
| 2013 | 7,250,593,370 | 1.24% | 88,895,449 | 49 |
| 2014 | 7,339,013,419 | 1.22% | 88,420,049 | 49 |
| 2015 | 7,426,597,537 | 1.19% | 87,584,118 | 50 |
| 2016 | 7,513,474,238 | 1.17% | 86,876,701 | 50 |
| 2017 | 7,599,822,404 | 1.15% | 86,348,166 | 51 |
| 2018 | 7,683,789,828 | 1.10% | 83,967,424 | 52 |
| 2019 | 7,764,951,032 | 1.06% | 81,161,204 | 52 |
| 2020 | 7,840,952,880 | 0.98% | 76,001,848 | 53 |
| 2021 | 7,909,295,151 | 0.87% | 68,342,271 | 53 |
| 2022 | 7,975,105,156 | 0.83% | 65,810,005 | 54 |
| 2023 | 8,045,311,447 | 0.88% | 70,206,291 | 54 |
Population growth by region
[edit]The table below shows historical and predicted regional population figures in millions.[113][114][115] The availability of historical population figures varies by region.
| Region | 1500 | 1600 | 1700 | 1750 | 1800 | 1850 | 1900 | 1950 | 1999 | 2008 | 2010 | 2012 | 2050 | 2150 |
|---|---|---|---|---|---|---|---|---|---|---|---|---|---|---|
| World | 585 | 660 | 710 | 791 | 978 | 1,262 | 1,650 | 2,521 | 6,008 | 6,707 | 6,896 | 7,052 | 9,725 | 9,746 |
| Africa | 86 | 114 | 106 | 106 | 107 | 111 | 133 | 221 | 783 | 973 | 1,022 | 1,052 | 2,478 | 2,308 |
| Asia | 282 | 350 | 411 | 502 | 635 | 809 | 947 | 1,402 | 3,700 | 4,054 | 4,164 | 4,250 | 5,267 | 5,561 |
| Europe | 168 | 170 | 178 | 190 | 203 | 276 | 408 | 547 | 675 | 732 | 738 | 740 | 734 | 517 |
| Latin America[Note 1] | 40 | 20 | 10 | 16 | 24 | 38 | 74 | 167 | 508 | 577 | 590 | 603 | 784 | 912 |
| Northern America[Note 1] | 6 | 3 | 2 | 2 | 7 | 26 | 82 | 172 | 312 | 337 | 345 | 351 | 433 | 398 |
| Oceania | 3 | 3 | 3 | 2 | 2 | 2 | 6 | 13 | 30 | 34 | 37 | 38 | 57 | 51 |
| Region | 1500 | 1600 | 1700 | 1750 | 1800 | 1850 | 1900 | 1950 | 1999 | 2008 | 2010 | 2012 | 2050 | 2150 |
|---|---|---|---|---|---|---|---|---|---|---|---|---|---|---|
| Africa | 14.7 | 17.3 | 14.9 | 13.4 | 10.9 | 8.8 | 8.1 | 8.8 | 13.0 | 14.5 | 14.8 | 15.2 | 25.5 | 23.7 |
| Asia | 48.2 | 53.0 | 57.9 | 63.5 | 64.9 | 64.1 | 57.4 | 55.6 | 61.6 | 60.4 | 60.4 | 60.3 | 54.2 | 57.1 |
| Europe | 28.7 | 25.8 | 25.1 | 20.6 | 20.8 | 21.9 | 24.7 | 21.7 | 11.2 | 10.9 | 10.7 | 10.5 | 7.6 | 5.3 |
| Latin America[Note 1] | 6.8 | 3.0 | 1.4 | 2.0 | 2.5 | 3.0 | 4.5 | 6.6 | 8.5 | 8.6 | 8.6 | 8.6 | 8.1 | 9.4 |
| Northern America[Note 1] | 1.0 | 0.5 | 0.3 | 0.3 | 0.7 | 2.1 | 5.0 | 6.8 | 5.2 | 5.0 | 5.0 | 5.0 | 4.5 | 4.1 |
| Oceania | 0.5 | 0.5 | 0.4 | 0.3 | 0.2 | 0.2 | 0.4 | 0.5 | 0.5 | 0.5 | 0.5 | 0.5 | 0.6 | 0.5 |
Past population
[edit]The following table gives estimates, in millions, of population in the past. The data for 1750 to 1900 are from the UN report "The World at Six Billion"[114][118] whereas the data from 1950 to 2015 are from a UN data sheet.[100]
| Year | World | Africa | Asia | Europe | Latin America & Carib.[Note 1] |
North America [Note 1] |
Oceania | Notes |
|---|---|---|---|---|---|---|---|---|
| 70,000 BC | < 0.015 | [119] | ||||||
| 10,000 BC | 4 | [120] | ||||||
| 8000 BC | 5 | |||||||
| 6500 BC | 5 | |||||||
| 5000 BC | 5 | |||||||
| 4000 BC | 7 | |||||||
| 3000 BC | 14 | |||||||
| 2000 BC | 27 | |||||||
| 1000 BC | 50 | 7 | 33 | 9 | [citation needed] | |||
| 500 BC | 100 | 14 | 66 | 16 | ||||
| AD 1 | 200 | 23 | 141 | 28 | ||||
| 1000 | 400 | 70 | 269 | 50 | 8 | 1 | 2 | |
| 1500 | 458 | 86 | 243 | 84 | 39 | 3 | 3 | |
| 1600 | 580 | 114 | 339 | 111 | 10 | 3 | 3 | |
| 1700 | 682 | 106 | 436 | 125 | 10 | 2 | 3 | |
| 1750 | 791 | 106 | 502 | 163 | 16 | 2 | 2 | |
| 1800 | 1,000 | 107 | 656 | 203 | 24 | 7 | 3 | |
| 1850 | 1,262 | 111 | 809 | 276 | 38 | 26 | 2 | |
| 1900 | 1,650 | 133 | 947 | 408 | 74 | 82 | 6 | |
| 1950 | 2,525 | 229 | 1,394 | 549 | 169 | 172 | 12.7 | [121] |
| 1955 | 2,758 | 254 | 1,534 | 577 | 193 | 187 | 14.2 | |
| 1960 | 3,018 | 285 | 1,687 | 606 | 221 | 204 | 15.8 | |
| 1965 | 3,322 | 322 | 1,875 | 635 | 254 | 219 | 17.5 | |
| 1970 | 3,682 | 366 | 2,120 | 657 | 288 | 231 | 19.7 | |
| 1975 | 4,061 | 416 | 2,378 | 677 | 326 | 242 | 21.5 | |
| 1980 | 4,440 | 478 | 2,626 | 694 | 365 | 254 | 23.0 | |
| 1985 | 4,853 | 550 | 2,897 | 708 | 406 | 267 | 24.9 | |
| 1990 | 5,310 | 632 | 3,202 | 721 | 447 | 281 | 27.0 | |
| 1995 | 5,735 | 720 | 3,475 | 728 | 487 | 296 | 29.1 | |
| 2000 | 6,127 | 814 | 3,714 | 726 | 527 | 314 | 31.1 | |
| 2005 | 6,520 | 920 | 3,945 | 729 | 564 | 329 | 33.4 | |
| 2010 | 6,930 | 1,044 | 4,170 | 735 | 600 | 344 | 36.4 | |
| 2015 | 7,349 | 1,186 | 4,393 | 738 | 634 | 358 | 39.3 |
Using the above figures, the change in population from 2010 to 2015 was:
- World: +420 million
- Africa: +142 million
- Asia: +223 million
- Europe: +3 million
- Latin America and Caribbean: +35 million
- Northern America: +14 million
- Oceania: +2.9 million
Projections
[edit]This section needs additional citations for verification. (April 2020) |

Long-term global population growth is difficult to predict. The United Nations and the US Census Bureau both give different estimates – according to the UN, the world population reached seven billion in late 2011,[113] while the USCB asserted that this occurred in March 2012.[123] Since 1951, the UN has issued multiple projections of future world population, based on different assumptions. From 2000 to 2005, the UN consistently revised these projections downward, until the 2006 revision, issued on 14 March 2007, revised the 2050 mid-range estimate upwards by 273 million.[citation needed]
Complicating the UN's and others' attempts to project future populations is the fact that average global birth rates, as well as mortality rates, are declining rapidly, as the nations of the world progress through the stages of the demographic transition, but both vary greatly between developed countries (where birth rates and mortality rates are often low) and developing countries (where birth and mortality rates typically remain high). Different ethnicities also display varying birth rates.[124] Birth rate and mortality rates can change rapidly due to disease epidemics, wars and other mass catastrophes, or advances in medicine and public health.
The UN's first report in 1951 showed that during the period 1950–55 the crude birth rate was 36.9/1,000 population and the crude death rate was 19.1/1,000. By the period 2015–20, both numbers had dropped significantly to 18.5/1,000 for the crude birth rate and 7.5/1,000 for the crude death rate. UN projections for 2100 show a further decline in the crude birth rate to 11.6/1,000 and an increase in the crude death rate to 11.2/1,000.[8][68]
The total number of births globally is currently (2015–20) 140 million/year, is projected to peak during the period 2040–45 at 141 million/year and thereafter decline slowly to 126 million/year by 2100.[7] The total number of deaths is currently 57 million/year and is projected to grow steadily to 121 million/year by 2100.[8]
2012 United Nations projections show a continued increase in population in the near future with a steady decline in population growth rate; the global population is expected to reach between 8.3 and 10.9 billion by 2050.[125][126] 2003 UN Population Division population projections for the year 2150 range between 3.2 and 24.8 billion.[70] One of many independent mathematical models supports the lower estimate,[127] while a 2014 estimate forecasts between 9.3 and 12.6 billion in 2100, and continued growth thereafter.[128][129] The 2019 Revision of the UN estimates gives the "medium variant" population as; nearly 8.6 billion in 2030, about 9.7 billion in 2050 and about 10.9 billion in 2100.[130] In December 2019, the German Foundation for World Population projected that the global population will reach 8 billion by 2023 as it increases by 156 every minute.[131] In a modeled future projection by the Institute for Health Metrics and Evaluation, the global population was projected to peak in 2064 at 9.73 billion people and decline to 8.79 billion in 2100.[132] Some analysts have questioned the sustainability of further world population growth, highlighting the growing pressures on the environment,[133][134] global food supplies, and energy resources.[135][136][137]
Some scholars have argued that a form of "cultural selection" may be occurring due to significant differences in fertility rates between cultures, and it can therefore be expected that fertility rates and rates of population growth may rise again in the future.[138][139][140] An example is certain religious groups that have a higher birth rate that is not accounted for by differences in income. In his book Shall the Religious Inherit the Earth?, Eric Kaufmann argues that demographic trends point to religious fundamentalists greatly increasing as a share of the population over the next century.[141][142] From the perspective of evolutionary psychology, it is expected that selection pressure should occur for whatever psychological or cultural traits maximize fertility.[143][144][145]
| Year | UN est. (millions) |
Difference | USCB est. (millions) |
Difference |
|---|---|---|---|---|
| 2005 | 6,542 | – | 6,473 | – |
| 2010 | 6,957 | 415 | 6,866 | 393 |
| 2015 | 7,380 | 423 | 7,256 | 390 |
| 2020 | 7,795 | 415 | 7,643 | 380 |
| 2025 | 8,184 | 390 | 8,007 | 363 |
| 2030 | 8,549 | 364 | 8,341 | 334 |
| 2035 | 8,888 | 339 | 8,646 | 306 |
| 2040 | 9,199 | 311 | 8,926 | 280 |
| 2045 | 9,482 | 283 | 9,180 | 254 |
| 2050 | 9,735 | 253 | 9,408 | 228 |
| Year | World | Asia | Africa | Europe | Latin Am./ Caribbean |
Northern America |
Oceania |
|---|---|---|---|---|---|---|---|
| 2000 | 6,144 | 3,741 (60.9%) |
811 (13.2%) |
726 (11.8%) |
522 (8.5%) |
312 (5.1%) |
31 (0.5%) |
| 2024 | 8,160 | 4,810 (58.9%) |
1,520 (18.6%) |
745 (9.1%) |
663 (8.1%) |
385 (4.7%) |
46 (0.6%) |
| 2050 | 9,660 | 5,280 (54.7%) |
2,470 (25.6%) |
703 (7.3%) |
730 (7.6%) |
426 (4.4%) |
57 (0.6%) |
| 2075 | 10,250 | 5,100 (49.8%) |
3,290 (32.1%) |
636 (6.2%) |
698 (6.8%) |
452 (4.4%) |
66 (0.6%) |
| 2100 | 10,180 | 4,610 (45.3%) |
3,810 (37.4%) |
592 (5.8%) |
613 (6.0%) |
475 (4.7%) |
73 (0.7%) |
Mathematical approximations
[edit]In 1975, Sebastian von Hoerner proposed a formula for population growth which represented hyperbolic growth with an infinite population in 2025.[147] The hyperbolic growth of the world population observed until the 1970s was later correlated to a non-linear second-order positive feedback between demographic growth and technological development. This feedback can be described as follows: technological advance → increase in the carrying capacity of land for people → demographic growth → more people → more potential inventors → acceleration of technological advance → accelerating growth of the carrying capacity → faster population growth → accelerating growth of the number of potential inventors → faster technological advance → hence, the faster growth of the Earth's carrying capacity for people, and so on.[148] The transition from hyperbolic growth to slower rates of growth is related to the demographic transition.
According to the Russian demographer Sergey Kapitsa,[149] the world population grew between 67,000 BC and 1965 according to the following formula:

where
- N is current population,
- T is the current year,
- C = (1.86 ± 0.01)·1011,
- T0 = 2007 ± 1,
- = 42 ± 1.

Years for world population to double
[edit]According to linear interpolation and extrapolation of UNDESA population estimates, the world population has doubled, or will double, in the years listed in the tables below (with two different starting points). During the 2nd millennium, each doubling took roughly half as long as the previous doubling, fitting the hyperbolic growth model mentioned above. However, after 2024, it is unlikely that there will be another doubling of the global population in the 21st century.[150]

| Population (in billions) |
0.5 | 1 | 2 | 4 | 8 | 16 | ||||||
|---|---|---|---|---|---|---|---|---|---|---|---|---|
| Year | 1500 | 1804 | 1927 | 1974 | 2022 | n/a | ||||||
| Years elapsed | — | 304 | 123 | 47 | 48 | — | ||||||
| Population (in billions) |
0.375 | 0.75 | 1.5 | 3 | 6 | 12 | ||||||
|---|---|---|---|---|---|---|---|---|---|---|---|---|
| Year | 1171 | 1715 | 1881 | 1960 | 1999 | c. 2100[151] | ||||||
| Years elapsed | — | 544 | 166 | 79 | 39 | c. 100+ | ||||||
Number of humans who have ever lived
[edit]The total number of humans who have ever lived is estimated to be approximately 100 billion. Such estimates can only be rough approximations, as even modern population estimates are subject to uncertainty of around 3% to 5%.[13] Kapitsa (1996) cites estimates ranging between 80 and 150 billion.[152] The PRB puts the figure at 117 billion as of 2020, estimating that the current world population is 6.7% of all the humans who have lived since 190,000 BCE.[153] Haub (1995) prepared another figure, updated in 2002 and 2011; the 2011 figure was approximately 107 billion.[154][155][156] Haub characterized this figure as an estimate that required "selecting population sizes for different points from antiquity to the present and applying assumed birth rates to each period".[155]
Robust population data only exist for the last two or three centuries. Until the late 18th century, few governments had ever performed an accurate census. In many early attempts, such as in Ancient Egypt and the Persian Empire, the focus was on counting merely a subset of the population for purposes of taxation or military service.[157] Thus, there is a significant margin of error when estimating ancient global populations.
Pre-modern infant mortality rates are another critical factor for such an estimate; these rates are very difficult to estimate for ancient times due to a lack of accurate records. Haub (1995) estimates that around 40% of those who have ever lived did not survive beyond their first birthday. Haub also stated that "life expectancy at birth probably averaged only about ten years for most of human history",[155] which is not to be mistaken for the life expectancy after reaching adulthood. The latter equally depended on period, location and social standing, but calculations identify averages from roughly 30 years upward.
The National Institute of Corrections estimates that the number of people who have ever lived will rise to 121 billion by 2050, 4 billion more than their 2021 estimate.[158]
Human population as a function of food availability
[edit]Individuals from a wide range of academic fields and political backgrounds have proposed that, like all other animal populations, any human population (and, by extension, the world population) predictably grows and shrinks according to available food supply, growing during an abundance of food and shrinking in times of scarcity.[159] This idea may run counter to the popular thinking that, as population grows, food supply must also be increased to support the growing population; instead, the claim here is that growing population is the result of a growing food supply. Notable proponents of this notion include: agronomist and insect ecologist David Pimentel,[160] behavioral scientist Russell Hopfenberg (the former two publishing a study on the topic in 2001),[161] anthropologist and activist Virginia Abernethy,[162] ecologist Garrett Hardin,[163] science writer and anthropologist Peter Farb, journalist Richard Manning,[164] environmental biologist Alan D. Thornhill,[165] cultural critic and writer Daniel Quinn,[166] and anarcho-primitivist John Zerzan.[167]
Scientists generally acknowledge that at least one significant factor contributing to population growth (or overpopulation) is that as agriculture advances in creating more food, the population consequently increases—the Neolithic Revolution and Green Revolution often specifically provided as examples of such agricultural breakthroughs.[168][169][170][171][172][173] Furthermore, certain scientific studies do lend evidence to food availability in particular being the dominant factor within a more recent timeframe.[174][175][160] Other studies take it as a basic model from which to make broad population conjectures.[168] The idea became taboo following the United Nations' 1994 International Conference on Population and Development, where framing human population growth as negatively impacting the natural environment became regarded as "anti-human".[176]
Most human populations throughout history validate this theory, as does the overall current global population. Populations of hunter-gatherers fluctuate in accordance with the amount of available food. The world human population began consistently and sharply to rise, and continues to do so, after sedentary agricultural lifestyles became common due to the Neolithic Revolution and its increased food supply.[177][170][173] This was, subsequent to the Green Revolution starting in the 1940s, followed by even more severely accelerated population growth. Often, wealthier countries send their surplus food resources to the aid of starving communities; however, some proponents of this theory argue that this seemingly beneficial strategy only results in further harm to those communities in the long run. Anthropologist Peter Farb, for example, has commented on the paradox that "intensification of production to feed an increased population leads to a still greater increase in population."[178] Environmental writer Daniel Quinn has also focused on this phenomenon, which he calls the "food race", coining a term he felt was comparable, in terms of both escalation and potential catastrophe, to the nuclear arms race.
Criticism of this theory can come from multiple angles, for example by demonstrating that human population is not solely an effect of food availability, but that the situation is more complex. For instance, other relevant factors that can increase or limit human population include access to birth control, fresh water availability, arable land availability, energy consumed per person, heat removal, forest products, and various nonrenewable resources like fertilizers.[179] Another criticism is that, in the modern era, birth rates are lowest in the developed nations, which also have the highest access to food. In fact, some developed countries have both a diminishing population and an abundant food supply. The United Nations projects that the population of 51 countries or areas, including Germany, Italy, Japan, and most of the states of the former Soviet Union, is expected to be lower in 2050 than in 2005.[180] This shows that, limited to the scope of the population living within a single given political boundary, particular human populations do not always grow to match the available food supply. However, the global population as a whole still grows in accordance with the total food supply and many of these wealthier countries are major exporters of food to poorer populations, so that, according to Hopfenberg and Pimentel's 2001 research, "it is through exports from food-rich to food-poor areas... that the population growth in these food-poor areas is further fueled.[160] Their study thus suggests that human population growth is an exacerbating feedback loop in which food availability creates a growing population, which then causes the misimpression that food production must be consequently expanded even further.[181]
Regardless of criticisms against the theory that population is a function of food availability, the human population is, on the global scale, undeniably increasing,[182] as is the net quantity of human food produced—a pattern that has been true for roughly 10,000 years, since the human development of agriculture. The fact that some affluent countries demonstrate negative population growth fails to discredit the theory as a whole, since the world has become a globalized system with food moving across national borders from areas of abundance to areas of scarcity. Hopfenberg and Pimentel's 2001 findings support both this[160] and Daniel Quinn's direct accusation, in the early 2010s, that "First World farmers are fueling the Third World population explosion".[183]
See also
[edit]- Demographics of the world
- Anthropocene
- Birth control
- Coastal population growth
- Doomsday argument
- Family planning
- Food security
- Human overpopulation
- Megacity
- Natalism
- One-child policy
- Population decline
- Population dynamics
- Population growth
- Two-child policy
Lists:
- List of countries and dependencies by population
- List of countries by past and projected future population
- List of countries by population growth rate
- List of countries by population in 1900
- List of countries and dependencies by population density
- List of largest cities
- Lists of organisms by population – for non-human global populations
- List of population concern organizations
- List of religious populations
- List of sovereign states and dependencies by total fertility rate
Historical:
Explanatory notes
[edit]- ^ This is by total speakers, not first-language or native speakers.
- ^ Excludes Mexico, Central America and the Caribbean, which are included here under Latin America.
- ^ The Antarctic Treaty System limits the nature of national claims in Antarctica. Of the territorial claims in Antarctica, the Ross Dependency has the largest population.
- ^ Has limited international recognition as a country. Area for the purposes of these calculations is that claimed, not controlled, by the State of Palestine.
- ^ Has limited international recognition as a country. Area for the purposes of these calculations is that controlled, not claimed, by Taiwan.
References
[edit]Citations
[edit]- ^ a b "World Population Prospects 2022, Graphs / Profiles". United Nations Department of Economic and Social Affairs, Population Division. 2022.
- ^ Jean-Noël Biraben (1980), "An Essay Concerning Mankind's Evolution". Population, Selected Papers. Vol. 4. pp. 1–13. Original paper in French:(b) Jean-Noël Biraben (1979)."Essai sur l'évolution du nombre des hommes". Population. Vol. 34 (no. 1). pp. 13–25.
- ^ "World Population Prospects". United Nations. Archived from the original on 19 September 2016. Retrieved 15 September 2016.
- ^ a b c "World Population Prospects, Standard Projections, Archive, 2019 Revision". United Nations Department of Economic and Social Affairs, Population Division. 2019. Archived from the original on 3 March 2020. Retrieved 25 March 2023.
- ^ Ortiz-Ospina, Esteban; Roser, Max (9 May 2013). "World Population Growth". Our World in Data. Archived from the original on 13 October 2016. Retrieved 13 October 2016.
- ^ Cave, Damien; Bubola, Emma; Sang-Hun, Choe (22 May 2021). "Long Slide Looms for World Population, With Sweeping Ramifications". The New York Times. ISSN 0362-4331. Archived from the original on 28 December 2021. Retrieved 23 May 2021.
- ^ a b "World Population Prospects 2019, Births file". United Nations Department of Economic and Social Affairs. 2019. Archived from the original on 22 October 2018. Retrieved 23 May 2022.
- ^ a b c "World Population Prospects 2019, Deaths file". United Nations Department of Economic and Social Affairs. 2019.
- ^ a b "World", The World Factbook, Central Intelligence Agency, 19 October 2021, retrieved 1 November 2021
- ^ The compound "world population" becomes common from c. the 1930s, adapted from early 20th-century "world's population"; pre-20th century authors use "population of the world".
- ^ "The population of the world, which Sir W. P. in 1682, stated at only 320 millions, has been estimated by some writers at about 730 million, by others, at upwards of 900 million; Mr. Wallace, of Edinburgh, conjectured it might amount to 1 billion, and this number has since generally been adopted who have noticed the subject;" The Monthly Magazine 4 (July–December 1797), p. 167.
- ^ 600 million: Simon Gray, The Happiness of States (1818), p. 356 Archived 6 June 2019 at the Wayback Machine. 800 million: Gordon Hall, Samuel Newell, The Conversion of the World (1818), p. 10 Archived 6 June 2019 at the Wayback Machine. 800 to 1000 million: John Redman Coxe, Considerations Respecting the Recognition of Friends in Another World (1845), p. 21 (footnote with references).
- ^ a b "[E]ven recent demographic data is accurate only from 3 to 5%, although in demography traditionally more digits are indicated than those having a meaning. This is partially due to the ethical difficulty in rounding off numbers that supposedly represent real people, officially counted during a census". Sergei P. Kapitza, "The phenomenological theory of world population growth", Physics-Uspekhi 39(1) 57–71 (1996).
- ^ Peter Bellwood, First Farmers: The Origins of Agricultural Societies (Blackwell, (2004).
- ^ Fekri A. Hassan, "Population dynamics" in Companion Encyclopedia of Archaeology (Routledge, 2002), pp. 672–713.
- ^ Mark Nathan Cohen, The Food Crisis in Prehistory: Overpopulation and the Origins of Agriculture (Yale University Press, 1977).
- ^ Luc-Normand Tellier (2009). Urban world history: an economic and geographical perspective. p. 26. ISBN 978-2-7605-1588-8.
- ^ Ralph Thomlinson, 1975, Demographic Problems: Controversy over population control, 2nd Ed., Dickenson Publishing Company, Ecino, CA, ISBN 0-8221-0166-1.
- ^ Dr. Kenneth W. Harl (1998). "Population estimates of the Roman Empire". Tulane.edu. Archived from the original on 7 May 2016. Retrieved 8 December 2012.
- ^ "Plague, Plague Information, Black Death Facts, News, Photos". National Geographic. Archived from the original on 22 July 2013. Retrieved 3 November 2008.
- ^ "History of Europe – Demographic and agricultural growth". Encyclopædia Britannica. 2012. Archived from the original on 20 December 2012. Retrieved 17 December 2012.
- ^ "Historical Estimates of World Population". Census.gov. Archived from the original on 9 July 2012. Retrieved 12 November 2016.
- ^ a b Biraben, Jean-Noël (1979). "Essai sur l'évolution du nombre des hommes". Population. 34 (1): 13–25. doi:10.2307/1531855. ISSN 0032-4663. JSTOR 1531855. S2CID 143406315.
- ^ Jay, Peter (17 July 2000). "A Distant Mirror". TIME Europe. 156 (3). Archived from the original on 25 July 2008. Retrieved 9 August 2014.
- ^ Horst R. Thieme (2003). Mathematics in population biology. Princeton University Press. p. 285. ISBN 978-0-691-09291-1.
- ^ Graziella Caselli; Gillaume Wunsch & Jacques Vallin (2005). Demography: Analysis and Synthesis, Four Volume Set: A Treatise in Population. Academic Press. p. 34. ISBN 978-0-12-765660-1.
- ^ a b Nishijima, Sadao (1986), "The economic and social history of Former Han", in Twitchett, Denis; Loewe, Michael, Cambridge History of China: Volume I: the Ch'in and Han Empires, 221 B.C. – A.D. 220, Cambridge: Cambridge University Press, pp 595–96.
- ^ "Qing China's Internal Crisis: Land Shortage, Famine, Rural Poverty". Columbia University: Asia for Educators. 2009. Archived from the original on 8 July 2011. Retrieved 9 July 2013.
- ^ "History of Europe – Demographics". Encyclopædia Britannica. Archived from the original on 23 July 2013. Retrieved 9 July 2013.
- ^ "China's Population: Readings and Maps". Columbia University: East Asian Curriculum Project. Archived from the original on 19 July 2011. Retrieved 18 December 2012.
- ^ "The Columbian Exchange". University of North Carolina. Archived from the original on 26 July 2011. Retrieved 18 December 2012.
- ^ Collingham, Lizzie (2006). Vindaloo: the Portuguese and the chilli pepper. Curry: A Tale of Cooks and Conquerors. Oxford: Oxford University Press. pp. 47–73. ISBN 978-0-19-988381-3.
- ^ "Super-Sized Cassava Plants May Help Fight Hunger in Africa". Ohio State University. 24 May 2006. Archived from the original on 8 December 2013. Retrieved 9 July 2013.
- ^ Brabazon, James (2000). Albert Schweitzer: a biography. Syracuse University Press. p. 242. ISBN 978-0-8156-0675-8.
- ^ "U.S. News & World Report: How many people were here before Columbus? Pick a number". 18 August 1997. Archived from the original on 5 March 2008. Retrieved 9 August 2019.
- ^ Snow, D. R (16 June 1995). "Microchronology and Demographic Evidence Relating to the Size of Pre-Columbian North American Indian Populations". Science. 268 (5217): 1601–1604. Bibcode:1995Sci...268.1601S. doi:10.1126/science.268.5217.1601. PMID 17754613. S2CID 8512954.
- ^ Arthur C. Aufderheide; Conrado Rodríguez-Martín & Odin Langsjoen (1998). The Cambridge encyclopedia of human paleopathology. Cambridge University Press. p. 205. ISBN 978-0-521-55203-5.
- ^ "The Story Of... Smallpox – and other Deadly Eurasian Germs". Public Broadcasting Service. 2005. Archived from the original on 29 January 2018. Retrieved 24 April 2013.
- ^ Austin Alchon, Suzanne (2003). A pest in the land: new world epidemics in a global perspective. University of New Mexico Press. p. 31. ISBN 978-0-8263-2871-7. Archived from the original on 18 May 2016. Retrieved 15 November 2015.
- ^ "World Demographics Profile 2012". Index Mundi. Archived from the original on 7 June 2012. Retrieved 22 May 2012.
- ^ Population crises and cycles in history – A review by Claire Russell and W.M.S. Russell, Vicnet.net.au, archived from the original on 5 April 2011, retrieved 26 March 2015
- ^ Buer, Mabel C. (1926). Health, Wealth and Population in the Early Days of the Industrial Revolution. London: George Routledge & Sons. p. 30. ISBN 978-0-415-38218-2.
{{cite book}}: ISBN / Date incompatibility (help) - ^ "The Foundling Hospital". BBC History. 5 October 2012. Archived from the original on 17 June 2013. Retrieved 22 April 2013.
- ^ "Modernization – Population Change". Encyclopædia Britannica. Archived from the original on 6 April 2009. Retrieved 6 February 2013.
- ^ Graziella Caselli; Gillaume Wunsch & Jacques Vallin (2005). Demography: Analysis and Synthesis, Four Volume Set: A Treatise in Population. Academic Press. p. 42. ISBN 978-0-12-765660-1.
- ^ "Victorian Medicine – From Fluke to Theory". BBC History. 1 February 2002. Archived from the original on 5 March 2013. Retrieved 17 February 2013.
- ^ "A portrait of Britain in 2031". The Independent. 24 October 2007. Archived from the original on 9 December 2017. Retrieved 17 February 2013.
- ^ "UK population breaks through 60m". BBC News. 24 August 2006. Archived from the original on 8 February 2009. Retrieved 14 April 2012.
- ^ "US population through history". About.com. Archived from the original on 13 January 2012. Retrieved 14 April 2012.
- ^ Jay Winter, Emmanuel Sivan (2000). War and Remembrance in the Twentieth Century. Cambridge University Press. p. 64. ISBN 978-0-521-79436-7. Archived from the original on 4 September 2015. Retrieved 20 July 2015.
- ^ Mark Harrison (2002). Accounting for War: Soviet Production, Employment, and the Defence Burden, 1940–1945. Cambridge University Press. p. 167. ISBN 978-0-521-89424-1.
- ^ "Vladimir Putin vows to reverse Russian population decline". The Daily Telegraph. 13 February 2012. Archived from the original on 24 April 2012. Retrieved 13 April 2012.
- ^ "Russia's Population Decline Said To Have 'Stopped'". Radio Free Europe/Radio Liberty. 27 May 2013. Retrieved 15 June 2013.
- ^ Schran, Peter (1978). "China's demographic evolution 1850–1953 reconsidered". The China Quarterly. 75 (75): 639–646. doi:10.1017/S0305741000042594. JSTOR 652987. S2CID 154294204.
- ^ "Reintegrating India with the World Economy" (PDF). Peterson Institute for International Economics. 2003. Archived (PDF) from the original on 4 March 2012. Retrieved 8 November 2012.
- ^ "The World Factbook – Central Intelligence Agency". cia.gov. Archived from the original on 27 September 2011. Retrieved 8 January 2017.
- ^ "Java (island, Indonesia)". Encyclopædia Britannica. Archived from the original on 10 November 2022. Retrieved 16 November 2022.
- ^ Jorge Durand (March 2004). "From Traitors to Heroes: 100 Years of Mexican Migration Policies". University of Guadalajara. Archived from the original on 5 May 2011. Retrieved 16 July 2013.
- ^ "Population and Housing Census: Mexico 2010" (PDF). University of Minnesota. 3 March 2011. Archived (PDF) from the original on 3 November 2013. Retrieved 16 July 2013.
- ^ Heinsohn, Gunnar (7 January 2008). "Kenya's Violence: Exploding population". The New York Times. Archived from the original on 15 July 2014. Retrieved 7 July 2013.
- ^ Nations, United. "World population to reach 8 billion on 15 November 2022". United Nations. Retrieved 14 November 2022.
- ^ a b c "UN report – 2004 data" (PDF). Archived from the original (PDF) on 5 February 2016. Retrieved 1 August 2010.
- ^ "U.S. Census Bureau – World POPClock Projection". July 2013. Archived from the original on 18 November 2011. Retrieved 18 February 2018. The number on this page is automatically updated daily.
- ^ "Population seven billion: UN sets out challenges". BBC News. 26 October 2011. Archived from the original on 26 October 2011. Retrieved 27 October 2011.
- ^ Coleman, Jasmine (31 October 2011). "World's 'seven billionth baby' is born". The Guardian. London. Archived from the original on 30 September 2013. Retrieved 31 October 2011.
- ^ "7 billion people is a 'serious challenge". United Press International. 31 October 2011. Archived from the original on 3 November 2011. Retrieved 9 November 2011.
- ^ a b "World set to reach 8 billion people on 15 November 2022". United Nations Population Fund. Retrieved 8 October 2022.
- ^ a b c "World Population Prospects 2019, Total Population – Both Sexes file, Medium Variant tab". United Nations Department of Economic and Social Affairs. 2019. Archived from the original on 4 June 2020. Retrieved 23 May 2022.
- ^ a b *"Ch. 5: Population Size and Composition" (PDF). World Population Prospects, the 2000 Revision. Vol. III. United Nations Population Division. p. 171. Retrieved 3 July 2010.
- "Executive Summary" (PDF). World Population Prospects: The 2002 Revision Volume III: Analytical Report. 2002. Retrieved 3 July 2010.
- "World Population to 2300" (PDF). New York: United Nations Department of Economic and Social Affairs: Population Division. 2004. pp. 3, 14. Archived (PDF) from the original on 19 September 2018. Retrieved 3 July 2010.
- "World Population: 1950–2050". United States Census Bureau. June 2010. Archived from the original on 5 October 2013. Retrieved 3 July 2010.
- "2009 World Population Data Sheet" (PDF). Washington, DC: Population Reference Bureau. 2009. Archived (PDF) from the original on 22 April 2010. Retrieved 3 July 2010.
- ^ a b "Key Findings" (PDF). Long-Range Population Projections. New York: United Nations: Department of Economic and Social Affairs. 2003. Retrieved 3 July 2010.
{{cite book}}:|work=ignored (help)CS1 maint: publisher location (link) - ^ "Total fertility estimates, 1950–2010". UN Population Division. April 2011. Archived from the original on 7 June 2012. Retrieved 14 June 2012.
- ^ "World Population Prospects, the 2008 Revision – Frequently Asked Questions". Population Division of the Department of Economic and Social Affairs of the United Nations Secretariat. 10 November 2010. Archived from the original on 24 February 2015. Retrieved 26 March 2015.
- ^ "World population to reach 8 billion this year, as growth rate slows" Archived 16 July 2022 at the Wayback Machine, UN News, 11 July 2022.
- ^ "World Health Statistics 2016: Monitoring health for the SDGs Annex B: tables of health statistics by country, WHO region and globally" (PDF). World Health Organization. 2016. p. 110. Archived (PDF) from the original on 17 May 2018. Retrieved 3 August 2018.
- ^ a b "World - The World Factbook". CIA World Fact Book. Central Intelligence Agency. 20 February 2024. Retrieved 24 February 2024.
- ^ Janneh, Abdoulie (April 2012). "General debate on national experience in population matters: adolescents and youth" (PDF). United Nations Economic Commission for Africa. Archived (PDF) from the original on 10 November 2013. Retrieved 19 February 2014.
- ^ "WHO, 2020 Life Expectancy". World Health Organization. Retrieved 27 July 2022.
- ^ "Children per woman". Our World in Data. Retrieved 1 November 2021.
- ^ "Global weight gain more damaging than rising numbers". BBC. 18 June 2012. Archived from the original on 4 February 2013. Retrieved 12 February 2013.
- ^ "World Economic Outlook (October 2021)". Imf.org. Retrieved 1 November 2021.
- ^ "Poverty headcount ratio at $1.90 a day (2011 PPP) (% of population) | Data". World Bank. Retrieved 1 November 2021.
- ^ Food and Agriculture Organization of the United Nations, The State of Food Insecurity in the World Archived 11 June 2014 at the Wayback Machine. WorldHunger.org. 2012. Retrieved 26 April 2012.
- ^ "Literacy Rate, Adult Total (% of people ages 15 and above)". The World Bank. September 2021.
- ^ "Number of internet and social media users worldwide as of January 2024". Statista. 31 January 2024. Archived from the original on 12 February 2024.
- ^ Chin, Josh (4 March 2011). "World's Most Typical Person: Han Chinese Man". Wall Street Journal. Archived from the original on 6 June 2019. Retrieved 18 November 2011.
- ^ Ghosh, Iman (15 February 2020). "Ranked: The 100 Most Spoken Languages Around the World". Visual Capitalist. Retrieved 1 November 2021.
- ^ "Religious Composition by Country, 2010–2050". Pew Research Center. 2 April 2015. Archived from the original on 21 December 2021.
- ^ "Regions in the world by population (2020)". Worldometer. Retrieved 5 October 2020.
- ^ a b "Antarctica". The World Factbook. CIA. 19 June 2014. Retrieved 18 March 2015.
- ^ World Population Prospects 2022: Summary of Results (PDF). New York: United Nations Department of Economic and Social Affairs. 2022.
- ^ "USA: Combined Metropolitan Areas". City Population. August 2021. Retrieved 19 November 2021.
- ^ York, Joanna (14 April 2023). "Spotlight on family planning as India surpasses China as world's most populous country". France 24. Retrieved 14 April 2023.
- ^ "2023年国民经济回升向好 高质量发展扎实推进" [Economy continues to recover in 2023, high-quality development progress steadily]. National Bureau of Statistics of China (in Chinese). 17 January 2024. Retrieved 17 January 2024.
- ^ "Population Clock". Census.gov. Archived from the original on 17 November 2015. Retrieved 18 April 2020.
- ^ "Mid Year Population (Thousand People)". Badan Pusat Statistik – Indonesia. Retrieved 22 November 2023.
- ^ a b c "World Population Prospects 2019". United Nations. Archived from the original on 27 February 2021. Retrieved 8 July 2019.
- ^ "Projeção da população". IBGE. Archived from the original on 4 February 2020. Retrieved 22 November 2019.
- ^ "Monthly Statidtical Bulletin – Bangladesh" (PDF). 2022-05-12-10-42-55414488d843db66462b5410cb439c22.pdf. Bangladesh Bureau of Statistics. February 2022. Archived (PDF) from the original on 8 June 2022. Retrieved 8 June 2022.
- ^ "Russia Reports 147M Population in 2021". Moscow Times. 30 May 2022. Retrieved 2 June 2022.
- ^ a b "World Population Prospects: The 2015 Revision". UN Population Division. Archived from the original on 22 December 2015. Retrieved 19 January 2016.. Linked to at Download Files, where it states that the figures are for 1 July of the given year.
- ^ a b "Countries – The World Factbook". cia.gov. Retrieved 15 November 2022.
- ^ "UNData app". United Nations. Retrieved 15 November 2022.
- ^ a b Demetriou, Danielle (17 April 2013). "Japan's population suffers biggest fall in history". The Daily Telegraph. London. Archived from the original on 21 May 2013. Retrieved 22 July 2013.
- ^ "World Population Clock (under World Pop Milestone section)". Worldometer. 2022.
- ^ "The limits of a Green Revolution?". BBC News. 29 March 2007. Archived from the original on 28 July 2011. Retrieved 1 August 2010.
- ^ "The Real Green Revolution". Energybulletin.net. Archived from the original on 22 April 2008. Retrieved 1 August 2010.
- ^ Roser, Max (18 June 2019). "Two centuries of rapid global population growth will come to an end". Our World in Data.
- ^ Ron Nielsen (2006). The Little Green Handbook. New York: Picador. ISBN 978-0-312-42581-4.
- ^ "UN population estimates and projections, database query, August 2009". United Nations. 11 March 2009. Archived from the original on 19 August 2010. Retrieved 1 August 2010.
- ^ Randers, Jorgen (2012). 2052: A Global Forecast for the Next Forty Years. Vermont: Chelsea Green Publishing. p. 62.
{{cite book}}: CS1 maint: publisher location (link) - ^ World population to keep growing this century, hit 11 billion by 2100 Archived 4 December 2016 at the Wayback Machine. UWToday. 18 September 2014
- ^ "World Population by Year". Worldometers.info. Retrieved 18 July 2023.
- ^ a b "World Population Prospects: The 2008 Revision" (PDF). Population Division of the Department of Economic and Social Affairs of the United Nations Secretariat. June 2009. Archived (PDF) from the original on 19 March 2013. Retrieved 20 June 2013.
- ^ a b "The World at Six Billion". United Nations. 12 October 1999. Archived from the original on 9 July 2013. Retrieved 1 August 2010.
- ^ "Population Growth over Human History". University of Michigan. 4 January 2006. Archived from the original on 24 July 2011. Retrieved 9 March 2013.
- ^ a b Figures include the former Soviet countries in Europe. Caselli, Graziella; Gillaume Wunsch; Jacques Vallin (20 December 2005). Demography: Analysis and Synthesis, Four Volume Set: A Treatise in Population. Academic Press. p. 42. ISBN 978-0-12-765660-1.
- ^ "World Population Prospects The 2015 Revision". Archived from the original (PDF) on 20 March 2014.
- ^ Table 2
- ^ Fewer than 15,000 individuals, according to the Toba catastrophe theory, though this theory has been criticized by some scientists. See: "Toba super-volcano catastrophe idea "dismissed"". BBC News. 30 April 2013. Archived from the original on 7 January 2015. Retrieved 21 March 2015.
- ^ An approximation based on figures from different sources as listed at the US Census Bureau's Historical Estimates of World Population Archived 2 May 2019 at the Wayback Machine; see also *Kremer, Michael (1993). "Population Growth and Technological Change: One Million B.C. to 1990". The Quarterly Journal of Economics. 108 (3): 681–716. doi:10.2307/2118405. JSTOR 2118405.
- ^ a b An approximation based on figures from different sources as listed at the US Census Bureau's Total Midyear Population for the World: 1950–2050 Archived 21 May 2017 at the Wayback Machine
- ^ "Population by age group". Our World in Data. Retrieved 26 January 2025.
- ^ "Notes on the World POPClock and World Vital Events". US Census Bureau. Archived from the original on 2 October 2013. Retrieved 12 February 2013.
- ^ Sweeney, Megan M.; Raley, R. Kelly (1 July 2014). "Race, Ethnicity, and the Changing Context of Childbearing in the United States". Annual Review of Sociology. 40: 539–558. doi:10.1146/annurev-soc-071913-043342. ISSN 0360-0572. PMC 4618673. PMID 26504262.
- ^ "World Population Prospects, the 2012 Revision – "Low variant" and "High variant" values". UN. 2012. Archived from the original on 1 July 2014. Retrieved 15 June 2013.
- ^ "World population projected to reach 9.6 billion by 2050 – UN report". UN News Centre. 14 June 2013. Archived from the original on 23 August 2013. Retrieved 16 June 2013.
- ^ "A model predicts that the world's populations will stop growing in 2050". ScienceDaily.com. 4 April 2013. Archived from the original on 2 January 2020. Retrieved 3 June 2013.
- ^ Carrington, Damien (18 September 2014). "World population to hit 12bn in 2100 – with 70% chance of continuous rise". The Guardian. Archived from the original on 20 September 2014. Retrieved 21 September 2014.
- ^ Gerland, P.; Raftery, A. E.; Ev Ikova, H.; Li, N.; Gu, D.; Spoorenberg, T.; Alkema, L.; Fosdick, B. K.; Chunn, J.; Lalic, N.; Bay, G.; Buettner, T.; Heilig, G. K.; Wilmoth, J. (14 September 2014). "World population stabilization unlikely this century". Science. 346 (6206). AAAS: 234–7. Bibcode:2014Sci...346..234G. doi:10.1126/science.1257469. ISSN 1095-9203. PMC 4230924. PMID 25301627.
- ^ "World Population Prospects 2019: Highlights" (PDF). Archived (PDF) from the original on 3 July 2019. Retrieved 8 July 2019.
- ^ Silk, John (21 December 2019). "World's population to hit 7.75 billion in 2019". Deutsche Welle. Retrieved 17 July 2020.
- ^ "World population in 2100 could be 2 billion below UN forecasts, study suggests". The Guardian. 15 July 2020. Retrieved 15 July 2020.
- ^ Stokstad, Erik (5 May 2019). "Landmark analysis documents the alarming global decline of nature". Science. AAAS. Retrieved 19 July 2020.
Driving these threats are the growing human population, which has doubled since 1970 to 7.6 billion, and consumption. (Per capita of use of materials is up 15% over the past 5 decades.)
- ^ Crist, Eileen; Ripple, William J.; Ehrlich, Paul R.; Rees, William E.; Wolf, Christopher (2022). "Scientists' warning on population" (PDF). Science of the Total Environment. 845 157166. Bibcode:2022ScTEn.84557166C. doi:10.1016/j.scitotenv.2022.157166. PMID 35803428. S2CID 250387801.
- ^ Peter P. Rogers; Kazi F. Jalal & John A. Boyd (2008). An Introduction To Sustainable Development. Earthscan. p. 53. ISBN 978-1-84977-047-7.
- ^ "Overpopulation's Real Victim Will Be the Environment". Time. 26 October 2011. Archived from the original on 18 February 2013. Retrieved 18 February 2013.
- ^ Zehner, Ozzie (2012). Green Illusions. Lincoln and London: University of Nebraska Press. pp. 187–331. Archived from the original on 29 November 2019. Retrieved 10 April 2020.
- ^ Kolk, M.; Cownden, D.; Enquist, M. (29 January 2014). "Correlations in fertility across generations: can low fertility persist?". Proceedings of the Royal Society B: Biological Sciences. 281 (1779) 20132561. doi:10.1098/rspb.2013.2561. PMC 3924067. PMID 24478294.
- ^ Burger, Oskar; DeLong, John P. (28 March 2016). "What if fertility decline is not permanent? The need for an evolutionarily informed approach to understanding low fertility". Philosophical Transactions of the Royal Society B: Biological Sciences. 371 (1692) 20150157. doi:10.1098/rstb.2015.0157. PMC 4822437. PMID 27022084.
- ^ "Population paradox: Europe's time bomb". The Independent. 9 August 2008. Retrieved 31 March 2019.
- ^ "Shall the religious inherit the earth?". Mercator Net. 6 April 2010. Archived from the original on 23 June 2019. Retrieved 27 February 2020.
- ^ McClendon, David (Autumn 2013). "Shall the Religious Inherit the Earth? Demography and Politics in the Twenty-First Century, by ERIC KAUFMANN". Sociology of Religion. 74 (3): 417–9. doi:10.1093/socrel/srt026.
- ^ Clarke, Alice L.; Low, Bobbi S. (2001). "Testing evolutionary hypotheses with demographic data" (PDF). Population and Development Review. 27 (4): 633–660. doi:10.1111/j.1728-4457.2001.00633.x. hdl:2027.42/74296.
- ^ Daly, Martin; Wilson, Margo I (26 June 1998). "Human evolutionary psychology and animal behaviour" (PDF). Animal Behaviour. 57 (3). Department of Psychology, McMaster University: 509–519. doi:10.1006/anbe.1998.1027. PMID 10196040. S2CID 4007382. Retrieved 14 November 2018.
- ^ Can we be sure the world's population will stop rising?, BBC News, 13 October 2012
- ^ Our World in Data (11 July 2024). "Peak global population and other key findings from the 2024 UN World Population Prospects". Our World in Data. Retrieved 27 July 2024.
- ^ Sebastien von Hoerner (1975). "Population Explosion and Interstellar Expansion". Journal of the British Interplanetary Society. 28 (28): 691–712. Bibcode:1975JBIS...28..691V.
- ^ Introduction to Social Macrodynamics. Archived 10 February 2012 at the Wayback Machine. Andrey Korotayev et al. For a rigorous mathematical analysis of this issue, see "A Compact Mathematical Model of the World System Economic and Demographic Growth, 1 CE – 1973 CE". Archived 17 February 2019 at the Wayback Machine.
- ^ Kapitsa, Sergei P. (1996). "The phenomenological theory of world population growth". Physics-Uspekhi. 39 (1): 57–71. Bibcode:1996PhyU...39...57K. doi:10.1070/pu1996v039n01abeh000127. S2CID 250877833. Archived from the original on 11 May 2009. Retrieved 26 July 2013.
- ^ Lutz, Wolfgang; Sanderson, Warren; Scherbov, Sergei (19 June 1997). "Doubling of world population unlikely" (PDF). Nature. 387 (6635): 803–805. Bibcode:1997Natur.387..803L. doi:10.1038/42935. PMID 9194559. S2CID 4306159.
- ^ "No way to stop human population growth?". www.science.org.
- ^ Sergei P. Kapitza, "The phenomenological theory of world population growth", Physics-Uspekhi 39(1) 57–71 (1996), citing K. M. Weiss, Human Biology 56637 (1984) and N. Keyfitz, Applied Mathematical Demography (New York: Wiley, 1977).
- ^ "How Many People Have Ever Lived on Earth?". PRB. Retrieved 1 November 2021.
- ^ Curtin, Ciara (1 March 2007). "Fact or Fiction?: Living People Outnumber the Dead". Scientific American. 297 (3). Scientific American, Inc. (published September 2007): 126. Bibcode:2007SciAm.297c.126C. doi:10.1038/scientificamerican0907-126. PMID 17784634. Retrieved 4 August 2008. Note: text of paper publication slightly different from text of on-line publication.
- ^ a b c Haub, Carl (November–December 2002). "How Many People Have Ever Lived on Earth?" (PDF). Population Today. 30 (8). Population Reference Bureau: 3–4. Archived (PDF) from the original on 12 August 2011. Retrieved 4 August 2008.
- ^ Haub, Carl (October 2011). "How Many People Have Ever Lived on Earth?". Population Reference Bureau. Archived from the original on 24 April 2013. Retrieved 29 April 2013.
- ^ Kuhrt, A. (1995). The Ancient Near East, c. 3000–330 BCE. Vol. 2. London: Routledge. p. 695.
- ^ "How Many People Have Ever Lived on Earth?". National Institute of Corrections. Retrieved 4 March 2024.
- ^ Bystroff, Christopher (2021). "Footprints to singularity: A global population model explains late 20th century slow-down and predicts peak within ten years". PLoS ONE 16(5): e0247214. doi:10.1371/journal.pone.0247214
- ^ a b c d Hopfenberg, Russell and Pimentel, David, "Human Population Numbers as a Function of Food Supply", Environment, Development and Sustainability, vol. 3, no. 1, March 2001, pp. 1–15
- ^ "Human Carrying Capacity is Determined by Food Availability" (PDF). Russel Hopfenberg, Duke University. Archived from the original (PDF) on 21 September 2020. Retrieved 10 January 2023.
- ^ Abernathy, Virginia, Population Politics ISBN 0-7658-0603-7
- ^ Hardin, Garrett (1974). "Lifeboat Ethics: the Case Against Helping the Poor". Psychology Today. 8: 38–43.
- ^ Manning, Richard (7 September 2011). "Richard Manning on the Green Revolution and the End of Cheap Oil" (Interview). Interviewed by Sally Erickson and Timothy Scott Bennett. Retrieved 15 October 2013 – via YouTube.
- ^ Food Production & Population Growth, video with Daniel Quinn and Alan Thornhill
- ^ Quinn, Daniel, Ishmael Bantam/Turner, 1995, ISBN 0613080939
- ^ Zerzan, John (2 April 2008). On Modernity and the Technosphere (Speech). Binghamton University.
- ^ a b Gilland, Bernard (2006). "Population, nutrition and agriculture". Population and Environment, 28(1), 1.
- ^ Bocquet-Appel, Jean-Pierre (2011). "When the world's population took off: the springboard of the Neolithic Demographic Transition". Science, 333(6042), 560–561.
- ^ a b Li, Xiaoqiang; Dodson, John; Zhou, Jie; Zhou, Xinying (1 June 2009). "Increases of population and expansion of rice agriculture in Asia, and anthropogenic methane emissions since 5000BP". Quaternary International. Great Arc of Human Dispersal. 202 (1): 41–50. Bibcode:2009QuInt.202...41L. doi:10.1016/j.quaint.2008.02.009.
- ^ Kopnina, Helen; Washington, Haydn (2016). "Discussing why population growth is still ignored or denied". Chinese Journal of Population Resources and Environment. 14 (2): 133–143. Bibcode:2016CJPRE..14..133K. doi:10.1080/10042857.2016.1149296. hdl:1887/44662. Archived from the original on 4 January 2023.
- ^ "What Causes Overpopulation?" Euroscientist. Euroscience: "When agriculture advances, and it becomes easier to feed the population, it continues to grow."
- ^ a b "The Development of Agriculture". National Geographic. 2022.
- ^ Cohen, Joel E. (1995). Population growth and earth's human carrying capacity. Science, 269(5222), 341–346.
- ^ Fanta, V., Šálek, M., Zouhar, J., Sklenicka, P., & Storch, D. (2018). Equilibrium dynamics of European pre-industrial populations: the evidence of carrying capacity in human agricultural societies. Proceedings of the Royal Society B: Biological Sciences, 285(1871), 20172500.
- ^ Henderson, Kirsten, & Loreau, Michel (2019). "An ecological theory of changing human population dynamics". People and Nature, 1(1), 32.
- ^ GJ Armelagos, AH Goodman, KH Jacobs Population and environment – 1991 link.springer.com
- ^ Farb, Peter: 1978, Humankind. Boston, Houghton Mifflin.
- ^ Van Den Bergh, Jeroen, & Rietveld, Piet (2004). "Reconsidering the limits to world population: meta-analysis and meta-prediction". BioScience, 54(3), 195–204.
- ^ Rosa, Daniele (2019). "Nel 2050 gli italiani saranno 20 milioni meno secondo l'Onu [Translation: In 2050 the Italians will be 20 million less, according to the UN]". Affaritaliani. Uomini & Affari Srl.
- ^ Salmony, Steven E. (2006). "The Human Population: Accepting Species Limits". Environmental Health Perspectives, 114(1), A 17. doi:10.1289/ehp.114-a17.
- ^ Daniel Quinn (1996). The Story of B, pp. 304–305, Random House Publishing Group, ISBN 0553379011.
- ^ Quinn, Daniel: "The Question (ID Number 122)". Retrieved October 2014 from "Archived copy". Archived from the original on 4 March 2016. Retrieved 18 October 2014.
{{cite web}}: CS1 maint: archived copy as title (link).
General and cited sources
[edit] This article incorporates public domain material from The World Factbook. CIA.
Further reading
[edit]- Cohen, Joel E. (1995). How Many People Can the Earth Support?. New York: W. W. Norton. ISBN 978-0-393-31495-3.
- Guinnane, Timothy W. (2023). "We Do Not Know the Population of Every Country in the World for the Past Two Thousand Years". The Journal of Economic History 83(3): 912–938. ISSN 0022-0507.
- Hopfenberg, Russell, and David Pimentel. "Human population numbers as a function of food supply." Environment, development and sustainability 3 (2001): 1–15. online
- Kiple, Kenneth F. amd Kriemhild Coneè Ornelas, eds. The Cambridge World History of Food (2000)
External links
[edit]- "World Population Prospects, the 2010 Revision". United Nations Population Division. Retrieved 25 June 2013.
- "World Population Prospects, the 2012 Revision". United Nations Population Division. Retrieved 19 May 2014.
- "World Population History Graph" World population graph 10,000 BC – AD 1950.
- "World". The World Factbook. US Central Intelligence Agency (CIA). Retrieved 6 November 2012.
- "The World in Balance" (transcript). Two-part PBS Nova episode on world population. 20 April 2004. Retrieved 19 July 2013.
- "Global population: Faces of the future". The Economist. 22 June 2013. Retrieved 25 June 2013.
| External videos | |
|---|---|
Organizations
- The Day of 6 Billion and 7 Billion – Official homepages maintained by UNFPA
- Population Reference Bureau – News and issues related to population
- Berlin Institute for Population and Development
Statistics and maps
- Woods et al. 2025 - Global gridded multi-temporal datasets to support human population distribution modelling
- HiveGroup.com – World population statistics presented in a treemap interface
- Win.tue.nl – World countries mapped by population size
Population clocks
| Major topics | |
|---|---|
| Society and population | |
| Publications | |
| Lists | |
Events and organizations |
|
| Related topics | |
World population
View on GrokipediaThe world population is the total number of living humans on Earth, estimated at approximately 8.27 billion as of January 2026.[1]
This total has expanded dramatically over the past two centuries, increasing from roughly 1 billion in the early 1800s to the current level, driven primarily by reductions in mortality from advancements in medicine, sanitation, and agriculture that outpaced initial declines in fertility rates.[2][3]
The global annual growth rate peaked above 2 percent in the 1960s before falling to under 1 percent by the 2020s, coinciding with fertility rates dropping from nearly 5 children per woman in the mid-20th century to 2.3 in 2023 as societies progressed through the demographic transition toward lower birth and death rates.[4][5]
United Nations projections forecast continued expansion at diminishing rates, with the population reaching a peak of about 10.3 billion in the mid-2080s before plateauing or contracting in the medium variant scenario, reflecting fertility below the 2.1 replacement level in an increasing share of countries.[6][7]
Notable disparities characterize the trajectory, as high-fertility regions like sub-Saharan Africa account for nearly all net growth while low-fertility areas in Europe, East Asia, and elsewhere experience stagnation or decline without substantial immigration, raising concerns over aging populations and rising dependency ratios.[7][8]
Early 20th-century apprehensions of resource collapse from rapid population increase have not materialized at scale, attributable to innovations such as the Green Revolution that enhanced food production capacities far beyond Malthusian limits.[8][3]
Current Status
Total Population Estimate
The world's total population reached 8 billion in November 2022 and is estimated at approximately 8.27 billion as of January 2026, with projections indicating around 8.30 billion by mid-2026 under the medium variant.[1][2] This current figure reflects an annual growth rate of approximately 0.84%, driven primarily by births exceeding deaths in developing regions, though the pace has slowed from mid-20th-century peaks above 2%.[9] These estimates originate from the United Nations Population Division's World Population Prospects 2024 revision, which aggregates data from over 1,900 national censuses conducted since 1950, alongside vital registration systems, household surveys, and sample-based demographic analyses for areas lacking complete records.[2] The methodology employs cohort-component modeling, projecting population changes via age-specific fertility, mortality, and international migration rates, with medium-variant assumptions balancing observed trends against potential policy or behavioral shifts.[2] Uncertainty intervals are wider for countries with infrequent or unreliable censuses, such as parts of sub-Saharan Africa and South Asia, where underreporting of births and migration can introduce errors of several million.[2] Alternative estimates from bodies like the U.S. Census Bureau project a slightly lower 8.1 billion for 2025, reflecting conservative assumptions on fertility declines, but converge toward the UN benchmark when updated with recent vital statistics.[10] Independent aggregators like Worldometer extrapolate UN baselines in real-time using daily net change rates (births minus deaths plus net migration), yielding figures within 0.1-0.5% of official mid-year tallies.[1] Such cross-verification underscores the robustness of the ~8.3 billion estimate, though absolute precision remains elusive absent global real-time enumeration.[1]Recent Growth Trends
The global population reached the milestone of 8 billion people on November 15, 2022.[11] By 2024, estimates place the total at 8.2 billion, reflecting continued absolute increases despite a marked deceleration in the growth rate.[12] The annual growth rate, which peaked at approximately 2.1% in the late 1960s, has declined to around 0.9% in the early 2020s, driven by fertility rates falling below the replacement level of 2.1 children per woman in most regions.[13] [2] This slowdown manifests in reduced momentum from prior high-fertility decades, compounded by rising life expectancy and aging populations that limit net gains.[13] Between 2020 and 2025, global additions averaged about 70-80 million people annually, down from over 100 million in the 1980s and 1990s, with sub-Saharan Africa accounting for roughly half of recent growth due to persistently higher fertility there (averaging 4.5 children per woman).[14] In contrast, Europe, East Asia, and North America have experienced near-zero or negative natural increase, offset only by immigration.[15] The COVID-19 pandemic caused a temporary dip in 2020-2021 through excess mortality and deferred births, but growth resumed without long-term structural reversal.[16] Projections from the United Nations' World Population Prospects 2024 indicate sustained but tapering expansion, with the population expected to reach 9.7 billion by 2050 and peak at 10.3 billion in the mid-2080s before a gradual decline to 10.2 billion by 2100.[2] This revised timeline reflects lower-than-expected fertility declines in some developing regions, though critics note that UN models have historically overestimated growth by underweighting socioeconomic drivers like urbanization and female education that accelerate fertility drops.[17] Key causal factors include expanded access to contraception, delayed childbearing amid economic pressures, and cultural shifts prioritizing smaller families, which have halved global fertility from 5 children per woman in 1950 to 2.3 in 2024.[16] Regional disparities persist, with 48 countries (10% of current population) projected to peak between 2025 and 2054, signaling early demographic transitions in parts of Asia and Latin America.[15]Key Milestones
The global human population remained under one billion individuals for nearly the entire approximately 300,000-year span of Homo sapiens, reaching this milestone around 1804 following millennia of slow growth constrained by high mortality rates from disease, famine, and conflict.[18][19] This estimate derives from historical demographic reconstructions integrating census data, vital statistics, and archaeological evidence.[20] Subsequent growth accelerated dramatically due to advancements in agriculture, medicine, and sanitation during the Industrial Revolution and beyond. The population doubled to two billion by 1927, a span of 123 years.[21] It then reached three billion in 1960 (33 years later), four billion in 1974 (14 years), five billion in 1987 (13 years), and six billion in 1999 (12 years).[21] These intervals reflect declining death rates and sustained high birth rates, particularly in developing regions.[22] The United Nations designated October 31, 2011, as the Day of Seven Billion, marking the arrival at seven billion amid continued fertility declines in many areas.[6] On November 15, 2022, the world population hit eight billion, as projected by the UN Population Division based on medium-variant fertility assumptions and updated vital registration data.[11] This milestone underscores a slowing growth rate, with annual increases dropping from over 2% in the 1960s to about 0.9% in the 2020s.[23] Projections indicate nine billion around 2037 and potential stabilization near 10 billion by mid-century, though estimates vary with socioeconomic and policy factors.[1]Historical Evolution
Prehistoric and Early Human Expansion
Homo sapiens emerged in Africa approximately 300,000 years ago, with the earliest fossil evidence from sites such as Jebel Irhoud in Morocco and Omo Kibish in Ethiopia supporting an African origin for anatomically modern humans.[24][25] Initial populations were small, consisting of hunter-gatherer groups adapted to diverse African environments, with effective population sizes estimated in the range of 10,000 to 30,000 individuals around 130,000 years ago, implying a census population likely numbering in the low hundreds of thousands due to high mortality and limited carrying capacity.[25] These early humans expanded across the continent, developing behavioral modernity including advanced tool use and symbolic culture by around 100,000 years ago, though global population growth remained negligible, constrained by predation, disease, and resource scarcity. The major dispersal of Homo sapiens out of Africa occurred in waves, with the most successful expansion beginning around 70,000 to 100,000 years ago, primarily via the Levant corridor and southern coastal routes along the Arabian Peninsula.[26][27] This migration enabled settlement across Eurasia, where modern humans interbred with Neanderthals in the west and Denisovans in the east, contributing 1-4% Neanderthal DNA to non-African populations today.[26] By 50,000 years ago, humans had reached Europe and much of Asia, adapting to varied climates through innovations like clothing and fire management, yet total world population estimates for this period hover below 1 million, reflecting slow growth rates of less than 0.01% annually amid frequent bottlenecks from climatic events like the Toba supervolcano eruption around 74,000 years ago.[28][20] Further expansions included the peopling of Sahul (Australia and New Guinea) by seafaring migrants around 65,000 years ago, evidenced by archaeological sites like Madjedbebe rock shelter, and the Americas via Beringia between 25,000 and 16,000 years ago, with footprint and artifact evidence from White Sands, New Mexico, dating to 23,000-21,000 years ago challenging earlier Clovis-first models.[29][30][31] These migrations completed the global distribution of Homo sapiens by approximately 15,000 years ago, replacing or absorbing archaic hominins, while prehistoric populations worldwide remained sparse, estimated at 1-10 million by 10,000 BCE just prior to the Neolithic Revolution.[20] The low density—often fewer than 0.1 persons per square kilometer—stemmed from reliance on foraging economies, where birth rates were offset by high infant mortality and environmental pressures.[32]Ancient Civilizations to Medieval Periods
The emergence of the first civilizations around 3500–3000 BCE, centered in river valleys with advanced agriculture and irrigation, facilitated localized population increases amid a global total of approximately 14 million people.[20] In Mesopotamia, Sumerian city-states like Uruk supported up to 80,000 inhabitants at their peak around 2900 BCE, with the broader region's population estimated at 800,000 to 1.5 million, sustained by barley cultivation and early urbanization.[33][34] Ancient Egypt, unified under the pharaohs by circa 3100 BCE, maintained 2 to 4 million people through Nile-dependent farming, with densities highest in the Delta and Middle Egypt during the Old and Middle Kingdoms.[35] The Indus Valley Civilization, flourishing from 2600 BCE, encompassed major sites like Mohenjo-daro and Harappa, each housing 30,000–60,000, for a total of 1 to 5 million across its extent, reliant on monsoon-fed wheat and cotton agriculture.[36] Early Chinese societies along the Yellow River, by the Shang Dynasty (1600–1046 BCE), supported perhaps 5–10 million, setting the stage for later dynastic expansions.[37] By the classical era, around 500 BCE to 200 CE, world population reached 100–300 million, driven by imperial consolidations and technological advances like iron tools and aqueducts, though estimates vary due to sparse censuses and reliance on archaeological proxies such as settlement sizes.[20] The Roman Empire at its height under Trajan (circa 117 CE) governed 45–76 million across Europe, North Africa, and the Near East, with Italy alone holding 6–7 million amid urban centers like Rome (up to 1 million).[38][39] In China, the Han Dynasty's census of 2 CE recorded 57.7 million, reflecting bureaucratic efficiency and agricultural surplus from rice and millet, comprising perhaps a quarter of global humanity.[37] Indian subcontinental populations under the Maurya and Gupta empires are estimated at 30–50 million, concentrated in the Ganges plain with rice-based economies, though data derives indirectly from texts like the Arthashastra. Greece and Persia added smaller but dense clusters, with Athens peaking at 250,000–300,000 in the 5th century BCE. These hubs contrasted with sparse hunter-gatherer remnants elsewhere, underscoring how state formation correlated with demographic concentration. The transition to medieval periods (circa 500–1500 CE) saw global population stagnate or decline initially due to empire collapses, invasions, and climate shifts like the Late Antique Little Ice Age, before recovering to around 300 million by 1000 CE and 450–500 million by 1500 CE.[20] Europe's population fell from Roman-era highs of 30–40 million to 25–30 million by 600 CE amid barbarian migrations and reduced trade, recovering gradually through feudal manorialism to 60–80 million by 1300 CE.[40] In Asia, China's Tang and Song dynasties sustained 50–100 million via canal networks and double-cropping, while Islamic caliphates in the Middle East and North Africa integrated former Roman and Persian territories with 20–30 million. The Black Death (1347–1351 CE), a Yersinia pestis outbreak originating in Central Asia, reduced Europe's population by 30–50% (killing 25–50 million) and caused comparable losses in China and the Middle East, totaling perhaps 75–200 million globally, though exact figures remain debated due to uneven records.[40] Recovery by 1500 reflected resilient agrarian systems, but overall growth remained modest at 0.1–0.2% annually, limited by famine, warfare, and disease absent modern sanitation or medicine.[20]Early Modern and Industrial Transformations
The global population stood at approximately 500 million in 1500, following recovery from medieval pandemics, and grew slowly to around 791 million by 1750 and nearly 1 billion by 1800, reflecting regional variations driven by agricultural enhancements and transoceanic exchanges rather than uniform expansion.[20][41] In Europe, the population doubled from about 65 million to 127.5 million between 1500 and 1750, primarily before 1625, due to reduced mortality from fewer large-scale plagues and wars, alongside improvements in crop yields from techniques like crop rotation and the introduction of New World staples such as potatoes and maize via the Columbian Exchange.[42] These American crops provided higher caloric density and nutritional resilience, enabling population increases in famine-prone areas of Europe and Asia without proportional land expansion, though initial European settlement in the Americas caused an 80-95% collapse in indigenous populations from introduced diseases like smallpox, offsetting global gains temporarily.[43] The Industrial Revolution, commencing in Britain around 1760 with mechanized textile production and steam power, initiated a phase of accelerated growth by expanding food production capacity through innovations like the seed drill and enclosure movements, which reduced Malthusian constraints on population by increasing agricultural output per worker.[44] This marked the onset of the demographic transition in industrialized regions, where mortality rates declined first—due to better nutrition, sanitation, and public health measures like smallpox vaccination from 1796—while fertility remained high, yielding net growth rates rising from near zero to over 1% annually in Europe by the early 19th century.[45] Globally, these changes were initially confined to Europe and North America, with Asia and Africa experiencing slower integration until later colonial influences, but the revolution's productivity surges laid the foundation for sustained expansion beyond subsistence limits, as per capita income and caloric availability rose, decoupling population from pre-industrial oscillations.[46][47]20th and Early 21st Century Developments
The world population experienced unprecedented growth during the 20th century, increasing from approximately 1.65 billion in 1900 to 6.1 billion by 2000, driven primarily by sharp declines in mortality rates outpacing reductions in fertility.[22] This expansion was fueled by medical advancements including vaccines, antibiotics, and improved sanitation, which drastically reduced infant and child mortality; for instance, smallpox eradication alone prevented hundreds of millions of deaths.[48] Public health measures, such as better hygiene and nutrition, further extended life expectancy globally from around 32 years in 1900 to over 66 years by 2000.[49] Agricultural innovations, including the Green Revolution's high-yield crops, supported food production to sustain larger populations without widespread famine.[50] Annual population growth rates peaked at 2.2% in the early 1960s, reflecting the global demographic transition where death rates fell rapidly in the mid-20th century due to these factors, while birth rates remained high in most regions initially.[23] In developed nations, post-World War II baby booms temporarily boosted fertility, but overall, the mismatch between declining mortality and slower fertility declines propelled the surge; for example, the global population doubled from 3 billion in 1960 to 6 billion in 1999.[2] Key milestones included reaching 2 billion in 1927, 4 billion in 1974, and 5 billion in 1987, with intervals between billion-person increments shortening dramatically compared to prior centuries.[51] In the early 21st century, growth continued but at decelerating rates, with the population hitting 7 billion in 2011 and 8 billion on November 15, 2022, as fertility rates began declining worldwide due to urbanization, education, and access to contraception.[6] By 2024, the global population stood at about 8.2 billion, with annual growth falling below 1%, projected to reach approximately 8.23 billion by mid-2025 according to medium-variant estimates.[2] This slowdown aligns with the later stages of the demographic transition in many developing countries, where fertility has dropped from over 5 children per woman in 1950 to around 2.3 by 2020, though sub-Saharan Africa continues higher growth.[45] Unlike earlier eras, 21st-century increases are concentrated in lower-income regions, straining resources but also contributing to a potential peak near 10.3 billion by the 2080s before stabilization or decline.[52]Demographic Composition
Age and Dependency Structures
The age structure of the global population reflects the ongoing demographic transition, where declining fertility rates following reductions in mortality have resulted in a contracting base of young cohorts and an expanding elderly segment in many regions. In 2023, approximately 24 percent of the world's population was under age 15, 66 percent was between ages 15 and 64, and 10 percent was aged 65 and older, yielding a median age of 31 years.[53] [2] This distribution underscores a youthful momentum embedded in developing regions, driving continued population growth despite sub-replacement fertility in much of the world.[7] Dependency structures quantify the economic burden on the working-age population (typically ages 15-64), defined as the ratio of dependents—youth under 15 and elderly over 64—to every 100 individuals in that cohort. The global total age dependency ratio stood at approximately 52 in 2023, comprising a youth dependency ratio of 37 (reflecting higher birth rates in Africa and parts of Asia) and an old-age dependency ratio of 15 (elevated in Europe, Japan, and North America due to low fertility and extended lifespans).[54] [55] These ratios vary starkly: sub-Saharan Africa exhibits youth dependency exceeding 80, straining resources amid limited infrastructure, while Japan's old-age ratio surpasses 50, challenging pension systems and labor markets with shrinking workforces.[56] [57] Projections from the United Nations indicate that global aging will intensify, with the elderly proportion rising to 16 percent by 2050 and the total dependency ratio climbing above 60 by 2100 as youth dependency falls further but old-age dependency doubles.[2] This shift arises causally from sustained low fertility below replacement levels (around 2.1 children per woman globally) combined with life expectancy gains to over 73 years, inverting traditional pyramid shapes in high-income countries and pressuring productivity unless offset by immigration, technological productivity increases, or policy adjustments like raising retirement ages.[58] Empirical data highlight that conventional dependency metrics may overstate burdens in contexts of high youth unemployment or elderly labor participation, yet they signal fiscal strains in entitlements like healthcare and social security, particularly where birth rates have decoupled from economic needs without corresponding adaptations.[59]Sex Ratios and Gender Imbalances
The global sex ratio, measured as the number of males per 100 females in the total population, was approximately 101 as of 2025, reflecting a slight male majority driven by higher male births offset by greater male mortality over the lifespan.[60] At birth, the natural biological ratio averages 105 to 107 males per 100 females worldwide, a pattern observed across human populations absent significant intervention, attributable to evolutionary factors favoring slightly more male conceptions to compensate for higher prenatal and early-life male mortality.[61][62] However, this baseline has been distorted in various regions by human actions, resulting in imbalances that deviate markedly from biological norms and carry long-term demographic consequences. The most pronounced gender imbalances stem from prenatal sex selection, particularly through selective abortion favoring males in societies with strong cultural son preference rooted in patrilineal inheritance, land rights, and perceived economic burdens of daughters such as dowry systems.[63] In China and India, which together account for over a third of the world's population, sex ratios at birth peaked at 118 and 111 males per 100 females, respectively, during the 2000s, leading to an estimated 30 to 70 million "missing" females cumulatively due to these practices combined with historical female infanticide.[64][65] China's one-child policy from 1979 to 2015 amplified the distortion by constraining family sizes, though the underlying driver was cultural valuation of sons for elder care and lineage continuation, persisting even after policy relaxation.[66] In India, similar preferences, exacerbated by ultrasound technology availability and uneven enforcement of bans on sex determination, have sustained elevated ratios in states like Haryana and Punjab, exceeding 120 in some periods.[63] These imbalances manifest in adult populations as surpluses of unmarried males, correlating with heightened social risks including increased violent crime, organized unrest, and human trafficking for brides.[67][65] In China, the cohort of excess males born in the 1980s–2000s—projected at 15–20% over females in marriageable ages—has driven up bride prices, cross-border abductions from neighboring countries, and rural bachelor communities prone to instability.[66][68] India faces analogous pressures, with surplus males contributing to inter-regional bride migrations and reported rises in sexual violence amid competition for partners.[64] Conversely, regions like Russia and parts of Eastern Europe exhibit female-majority ratios (around 86 males per 100 females overall) due to elevated male mortality from alcohol-related diseases, industrial accidents, and conflicts, rather than birth distortions.[69] Temporary imbalances also arise from labor migration, as in Gulf states like Qatar, where ratios exceed 200 males per 100 females owing to male-dominated expatriate workforces in construction and oil sectors.[69] United Nations projections anticipate gradual global convergence toward sex ratio parity by 2050, as aging populations in high-imbalance countries normalize through reduced selection and higher female survival, though persistent cultural factors may prolong distortions in South Asia and East Asia.[70] Empirical evidence from declining birth ratios in China (to about 111 by 2020) following legal crackdowns and awareness campaigns underscores that policy interventions can mitigate but not eradicate imbalances without addressing root preferences.[61]Urban vs. Rural Distributions
In 2022, 57% of the global population, or approximately 4.6 billion people, lived in urban areas, while 43%, or 3.4 billion, resided in rural areas.[71] This marked a continuation of the trend where the urban population surpassed the rural population in 2007, driven by sustained migration to cities for economic opportunities and infrastructure development.[71] By 2024, the urban share had risen to 57.7%, reflecting an annual urban population growth rate exceeding that of rural areas.[72] [73] By 2026, the urban share is projected to reach 58.5%, or approximately 4.85 billion people.[74] Urbanization rates vary sharply across regions, with higher-income areas exhibiting greater proportions of urban dwellers due to earlier industrialization and service-sector dominance. In Northern America, 83% of the population was urban in 2022, followed by Latin America and the Caribbean at 81% and Europe at 75%.[71] In contrast, Asia had 51% urban residency, while Africa remained the least urbanized major region at 46%, where rural agrarian economies and limited infrastructure continue to retain larger rural populations.[71] These disparities highlight how developing regions, particularly in sub-Saharan Africa and South Asia, lag behind, with rural shares often exceeding 60% amid slower economic transitions.[75]| Region | Urban Population Share (2022) |
|---|---|
| Northern America | 83% |
| Latin America/Caribbean | 81% |
| Europe | 75% |
| Asia | 51% |
| Africa | 46% |
Spatial Distributions
By Continent and Region
Asia contains the largest continental population, estimated at 4.81 billion people as of 2024, representing over 59% of the global total.[76] This dominance stems from dense settlement in countries like India and China, which alone account for over 2.8 billion residents.[77] Africa's population reached approximately 1.5 billion in 2024, comprising about 18% of the world and exhibiting the highest growth rate among continents at around 2.5% annually, primarily due to sustained high fertility rates exceeding replacement levels in most subregions.[78][2] Europe's population stood at roughly 744 million in 2025 estimates, or about 9% of the global figure, with near-zero or negative growth in many areas reflecting fertility rates below 1.5 children per woman and net emigration in Eastern Europe.[79] Latin America and the Caribbean hosted around 670 million people in 2025, approximately 8% of the world total, with growth slowing to under 0.5% annually amid urbanization and declining birth rates.[80] Northern America, including the United States, Canada, and Bermuda, had about 370 million residents, supported by immigration offsetting low native fertility.[81] Oceania, encompassing Australia, New Zealand, and Pacific islands, counted nearly 46 million, with modest growth driven by migration to Australia.[79] Antarctica maintains a transient population of 1,000 to 5,000 researchers seasonally, with no permanent inhabitants. (Note: While Wikipedia is not cited directly, this fact is corroborated across governmental sources.)| Continent/Region Aggregate | Population (2024 estimate, millions) | Share of World (%) | Annual Growth Rate (%) |
|---|---|---|---|
| Asia | 4,810 | 59 | 0.5 |
| Africa | 1,500 | 18 | 2.5 |
| Europe | 740 | 9 | -0.1 |
| Latin America & Caribbean | 660 | 8 | 0.4 |
| Northern America | 370 | 5 | 0.7 |
| Oceania | 45 | 0.6 | 1.0 |
Largest National Populations
As of mid-2025, India is the world's most populous country with an estimated 1,445,088,000 inhabitants, having surpassed China two years prior amid divergent demographic trajectories: India's sustained fertility above replacement levels contrasting China's sharp decline triggered by the one-child policy enforced from 1979 to 2015, which has led to accelerated aging and population contraction.[2] The top ten nations account for approximately 55% of global population, with eight in Asia, reflecting the region's historical and ongoing dominance in human numbers due to favorable agrarian conditions and lower mortality from public health improvements.[2] The following table presents the estimated mid-year populations for these countries based on the United Nations' medium-variant scenario:
| Rank | Country | Population (2025) |
|---|---|---|
| 1 | India | 1,445,088,000 |
| 2 | China | 1,416,933,000 |
| 3 | United States | 345,964,000 |
| 4 | Indonesia | 286,548,000 |
| 5 | Pakistan | 261,697,000 |
| 6 | Nigeria | 233,957,000 |
| 7 | Brazil | 211,999,000 |
| 8 | Bangladesh | 175,283,000 |
| 9 | Mexico | 164,169,000 |
| 10 | Ethiopia | 135,750,000 |
Density Patterns and Habitation
The global population density stood at approximately 62.6 people per square kilometer in 2024, calculated over land area excluding inland water bodies.[82] The projected global population density for 2026 is 56 people per square kilometer (based on UN medium-variant projections).[2] This is calculated from an estimated world population of 8,300,678,395 and a total land area of 148,940,000 square kilometers. Equivalently, this is approximately 0.000056 people per square meter. This average reflects extreme disparities in habitation, with over 90% of the world's population concentrated on roughly 10% of the land surface, primarily in regions offering favorable physical and economic conditions.[83] High-density patterns cluster in lowland plains, river deltas, and coastal zones where arable land, water access, and navigable waterways historically supported intensive agriculture and trade.[84] South and East Asia exhibit the most pronounced density patterns, driven by fertile alluvial soils in valleys like the Ganges and Yangtze, which sustain large-scale rice cultivation and dense settlements.[85] Among sovereign states, Bangladesh records the highest national density at 1,350 people per square kilometer, followed by Taiwan at 653 and Rwanda at 602, where limited land area combines with high fertility and agricultural reliance.[86] In contrast, habitation thins dramatically in arid interiors, such as the Australian Outback or Namib Desert, and high-altitude plateaus like the Tibetan Plateau, where water scarcity, poor soils, and extreme temperatures restrict viable settlement.[87] The lowest densities occur in vast, resource-poor territories; Greenland maintains just 0.1 people per square kilometer due to its ice-covered expanse and subarctic climate, while Mongolia follows at around 2 people per square kilometer amid steppe and desert dominance.[82][86] Human factors amplify these physical constraints: economic opportunities draw populations to resource-rich or industrialized zones, leaving hinterlands sparsely inhabited, as seen in Canada's northern territories or Russia's Siberian expanse with densities below 5 per square kilometer.[84] Temperate climates with reliable precipitation correlate strongly with higher densities, underscoring how environmental habitability—rather than uniform land distribution—dictates global patterns.[83]Drivers of Population Change
Fertility and Birth Rates
The total fertility rate (TFR) measures the average number of children that would be born to a woman over her lifetime if she experienced the age-specific fertility rates of a given year, serving as a key indicator of birth rates.[5] Globally, the TFR stood at approximately 2.3 children per woman in 2023, down from about 5 in the 1950s, reflecting a sustained decline driven by demographic transitions in most regions.[5] Replacement-level fertility, defined as roughly 2.1 children per woman in low-mortality settings, is the threshold needed to maintain population size absent net migration, accounting for slight excess male births and early-life mortality.[88] More than half of countries already fall below this level as of 2024, with projections indicating the global TFR will reach 2.1 around 2036 and continue falling to 1.8 by 2100 under medium-variant assumptions.[89][90] Historical trends show fertility peaking mid-20th century before accelerating downward post-1960s, coinciding with widespread reductions in infant and child mortality that reduced the need for larger families to ensure offspring survival.[5] In developed regions, TFRs dropped below replacement by the 1970s, while developing areas followed suit from the 1980s onward, halving global averages over decades.[91] United Nations estimates for 2024 place the global TFR at 2.2, with sub-Saharan Africa sustaining rates above 4 due to lower urbanization and education levels, contrasting sharply with East Asia's sub-1.5 figures in countries like South Korea (0.7 in 2023).[90][92]| Region | TFR (2023 estimate) | Notes |
|---|---|---|
| Sub-Saharan Africa | ~4.5 | Highest globally; slower decline projected.[2] |
| South Asia | ~2.0 | Near replacement; rapid drops in India, Bangladesh.[92] |
| Latin America & Caribbean | ~1.8 | Below replacement; stable low.[92] |
| Europe | ~1.5 | Persistent low; varies by country (e.g., France 1.8, Italy 1.2).[5] |
| East Asia | ~1.2 | Ultra-low; Japan 1.3, driven by aging and costs.[92] |
Mortality Rates and Health Advances
Global crude death rates have fallen substantially since the 19th century, driven by improvements in sanitation, nutrition, and medical interventions that reduced infectious disease mortality. In major cities during the late 19th and early 20th centuries, clean water access accounted for nearly half of total mortality reductions and three-quarters of infant mortality declines.[97] These public health measures, including sewage systems and water chlorination, predated widespread antibiotic use and targeted waterborne diseases like cholera and typhoid. Life expectancy at birth has more than doubled globally, from about 32 years in 1900 to 73 years in 2023, reflecting lower age-specific mortality across populations.[98] Key 20th-century advances included vaccines against smallpox, polio, and measles, which eradicated or controlled major killers; antibiotics like sulfa drugs introduced in the 1930s reduced bacterial infection deaths; and hygiene practices that curbed tuberculosis and diarrheal diseases.[99] Smallpox vaccination alone prevented an estimated 300-500 million deaths in the 20th century.[48] Infant and child mortality rates exemplify these gains, with global under-5 mortality dropping from 93 deaths per 1,000 live births in 1990 to 37 in 2023, largely due to expanded immunization, better maternal care, and treatments for preterm birth and infections.[100] Preterm birth complications, neonatal infections, and pneumonia remain leading causes but have declined with interventions like antibiotics and neonatal intensive care.[101] United Nations estimates indicate that noncommunicable diseases now account for a rising share of deaths, shifting from 59% in 2002 to projected 69% by 2030, as infectious mortality wanes.[102] The COVID-19 pandemic temporarily reversed trends, with global adult mortality rates rising in 2020-2021, though child under-5 rates continued downward overall.[103] Sustained progress depends on addressing persistent gaps in low-income regions, where infectious diseases and malnutrition still elevate rates above global averages.[104]Net Migration Effects
Net international migration exerts no direct effect on the global population total, as inflows to one region precisely offset outflows from another, resulting in a worldwide net migration of zero.[7] This redistribution, however, profoundly influences regional demographics, with high-income and developed regions experiencing net population gains that often compensate for sub-replacement fertility rates, while low-income regions face accelerated depopulation.[7] Between 2000 and 2020, international migration contributed a net inflow of 80.5 million people to high-income countries, accounting for the entirety of their population growth during that period amid declining natural increase (births minus deaths).[105] In 2023, Northern America recorded the highest regional net immigration, driven primarily by labor demands, family reunification, and asylum flows, while Asia experienced the largest net emigration, reflecting push factors such as economic disparities and conflict in origin countries like Syria, Afghanistan, and Venezuela.[106] Europe similarly saw substantial net inflows, with the European Union gaining approximately 1.1 million net migrants in 2022, offsetting aging populations and low birth rates in nations like Germany and Italy.[107] Conversely, sub-Saharan Africa and parts of Latin America endured net outflows exceeding 500,000 annually in recent years, exacerbating youth bulges and straining rural economies through labor loss, though remittances partially mitigate economic impacts.[108] These flows alter age structures in receiving countries by injecting younger cohorts, with migrants typically aged 20-40, thereby reducing dependency ratios and sustaining workforce sizes; for instance, in the United States, net migration added 2.8 million people between 2023 and 2024, predominantly working-age individuals.[109] In sending regions, however, selective emigration of skilled workers—known as brain drain—can hinder long-term population vitality by depleting human capital, as evidenced in countries like India and Nigeria, where net outflows of educated youth exceed 1 million combined annually.[110] Projections from the United Nations indicate that by 2050, net migration will drive nearly all population growth in Europe and Northern America, while contributing to declines in origin regions unless offset by policy interventions or economic convergence.[2] United Nations estimates, derived from census data and border statistics, assume moderate future migration levels but may understate irregular flows, which independent analyses suggest add 20-30% to official figures in destinations like the European Union.[108]Future Projections
Medium-Variant Estimates
The medium variant in United Nations World Population Prospects represents the central projection scenario, incorporating the mean of projected fertility and mortality trajectories alongside the median net international migration for each country or area.[111] This variant assumes a global total fertility rate (TFR) declining from 2.25 children per woman in 2024 to approximately 1.85-1.89 by 2100, with convergence toward levels slightly below replacement fertility (2.1) driven by continued advancements in education, gender equity, and economic development in high-fertility regions, alongside limited rebounds in low-fertility countries.[7] Life expectancy is projected to rise from 73.3 years in 2024 to around 77-82 years by 2100, reflecting ongoing health improvements, while net migration has negligible global impact but shapes outcomes in specific nations like the United States and Canada.[7] These assumptions yield a baseline for policy analysis, though historical UN projections have often overestimated growth due to faster-than-anticipated fertility declines.[13] Under the medium variant, global population stands at 8.2 billion in 2024 and is expected to reach 9.7 billion by 2050, surpassing 10 billion before peaking at 10.3 billion in 2084, then slightly declining to 10.2 billion by 2100.[7] This trajectory marks an 80% probability of peaking within the century, revised downward from prior estimates (e.g., 6% lower than 2013 projections) primarily due to accelerated fertility reductions in countries like China.[7] Growth post-2050 hinges on sub-Saharan Africa, where populations in nations like Nigeria are projected to double by mid-century, accounting for over half of global increase, while 63 countries (28% of current population) have already peaked and face 14% declines by 2054.[7]| Year | Projected Population (billions) | Key Milestone |
|---|---|---|
| 2024 | 8.2 | Current estimate |
| 2050 | 9.7 | Continued growth |
| 2084 | 10.3 | Peak population |
| 2100 | 10.2 | Post-peak stabilization |