

Community hub
Recent from talks
Contribute something
Nothing was collected or created yet.
Public transport
View on Wikipedia


.jpg)
.jpg)
| Part of a series on |
| Transport |
|---|
| Modes |
| Overview |
| Topics |
|
|
Public transport (also known as public transit, mass transit, or simply transit) are forms of transport available to the general public. It typically uses a fixed schedule, route and charges a fixed fare.[1][2][3] There is no rigid definition of which kinds of transport are included, and air travel is often not thought of when discussing public transport—dictionaries use wording like "buses, trains, etc."[4] Examples of public transport include city buses, trolleybuses, trams (or light rail), rapid transit (metro/subway/underground, etc.) and passenger trains and ferries. Public transport between cities is dominated by airlines, coaches, and intercity rail. High-speed rail networks are being developed in many parts of the world.
Most public transport systems run along fixed routes with set embarkation/disembarkation points to a prearranged timetable, with the most frequent services running to a headway (e.g., "every 15 minutes" as opposed to being scheduled for a specific time of the day). However, most public transport trips include other modes of travel, such as passengers walking or catching bus services to access train stations.[5] Share taxis offer on-demand services in many parts of the world, which may compete with fixed public transport lines, or complement them, by bringing passengers to interchanges. Paratransit is sometimes used in areas of low demand and for people who need a door-to-door service.[6]
Urban public transit differs distinctly among Asia, North America, and Europe. In Japan, profit-driven, privately owned and publicly traded mass transit and real estate conglomerates predominantly operate public transit systems.[7][8][better source needed] In North America, municipal transit authorities most commonly run mass transit operations. In Europe, both state-owned and private companies operate mass transit systems.
For geographical, historical and economic reasons, differences exist internationally regarding the use and extent of public transport. The International Association of Public Transport (UITP) is the international network for public transport authorities and operators, policy decision-makers, scientific institutes and the public transport supply and service industry. It has over 1,900 members from more than 100 countries from all over the globe.
In recent years, some high-wealth cities have seen a decline in public transport usage. A number of sources attribute this trend to the rise in popularity of remote work, ride-sharing services, and car loans being relatively cheap across many countries. Major cities such as Toronto, Paris, Chicago, and London have seen this decline and have attempted to intervene by cutting fares and encouraging new modes of transportation, such as e-scooters and e-bikes.[9] Because of the reduced emissions and other environmental impacts of using public transportation over private transportation, many experts have pointed to an increased investment in public transit as an important climate change mitigation tactic.[10]
History
[edit]

Conveyances designed for public hire are as old as the first ferry service. The earliest public transport was water transport.[11] Ferries appear in Greek mythology writings. The mystical ferryman Charon had to be paid and would only then take passengers to Hades.[12]
Some historical forms of public transport include the stagecoaches traveling a fixed route between coaching inns, and the horse-drawn boat carrying paying passengers, which was a feature of European canals from the 17th century onwards. The canal itself as a form of infrastructure dates back to antiquity. In ancient Egypt canals were used for freight transportation to bypass the Aswan cataract. The Chinese also built canals for water transportation as far back as the warring States period[13] which began in the 5th century BCE. Whether or not those canals were used for for-hire public transport remains unknown; the Grand Canal in China (begun in 486 BCE) served primarily the grain trade.
The bus, the first organized public transit system within a city, appears to have originated in Paris in 1662,[14] although the service in question, Carrosses à cinq sols (English: five-sol coaches), which have been developed by mathematician and philosopher Blaise Pascal, lasted only fifteen years until 1677.[15] Buses are known to have operated in Nantes in 1826. The public bus transport system was introduced to London in July 1829.[16]
The first passenger horse-drawn vehicle opened in 1806. It ran along the Swansea and Mumbles Railway.[17]
In 1825, George Stephenson built the Locomotion No 1 for the Stockton and Darlington Railway in northeast England, the first public steam railway in the world. The world's first steam-powered underground railway opened in London in 1863.[18]
The first successful electric streetcar was built for 11 miles of track for the Union Passenger Railway in Tallahassee, Florida, in 1888. Electric streetcars could carry heavier passenger loads than predecessors, which reduced fares and stimulated greater transit use.
Two years after the Richmond success, over thirty-two thousand electric streetcars were operating in America. Electric streetcars also paved the way for the first subway system in America. Before electric streetcars, steam powered subways were considered. However, most people believed that riders would avoid the smoke-filled subway tunnels from the steam engines. In 1894, Boston built the first subway in the United States, an electric streetcar line in a 1.5-mile tunnel under Tremont Street's retail district. Other cities quickly followed, constructing thousands of miles of subway in the following decades.[19]
In March 2020, Luxembourg abolished fares for trains, trams and buses and became the first country in the world to make all public transport free.[20]
The Encyclopædia Britannica specifies that public transportation is within urban areas, but does not limit its discussion of the topic to urban areas.[21]
Types of public transport
[edit]Comparing modes
[edit]Seven criteria estimate the usability of different types of public transport and its overall appeal. The criteria are speed, comfort, safety, cost, proximity, timeliness and directness.[22] Speed is calculated from total journey time including transfers. Proximity means how far passengers must walk or otherwise travel before they can begin the public transport leg of their journey and how close it leaves them to their desired destination. Timeliness is how long they must wait for the vehicle. Directness records how far a journey using public transport deviates from a passenger's ideal route.
In selecting between competing modes of transport, many individuals are strongly motivated by direct cost (travel fare/ ticket price to them) and convenience, as well as being informed by habit. The same individual may accept the lost time and statistically higher risk of accident in private transport, together with the initial, running and parking costs. Loss of control, spatial constriction, overcrowding, high speeds/accelerations, height and other phobias may discourage use of public transport. The transport hub makes it easier for travellers to use different modes of transport during one trip.
Actual travel time on public transport becomes a lesser consideration when predictable and when travel itself is reasonably comfortable (seats, toilets, services), and can thus be scheduled and used pleasurably, productively or for (overnight) rest. Chauffeured movement is enjoyed by many people when it is relaxing, safe, but not too monotonous. Waiting, interchanging, stops and holdups, for example due to traffic or for security, are discomforting.
.jpg)
Airline
[edit]An airline provides scheduled service with aircraft between airports, the majority using airplanes. Air travel has high speeds, but incurs large waiting times before and after travel, and is therefore often only feasible over longer distances or in areas where a lack of surface infrastructure makes other modes of transport impossible. Since the 1970s, the hub-and-spoke system increased in popularity, compared to point-to-point flights. Jet lag is a human constraint discouraging frequent rapid long-distance east–west commuting.
Bush airlines work more similarly to bus stops; an aircraft waits for passengers and takes off when the aircraft is full.
Bus and coach
[edit]
Bus services use buses on conventional roads to carry numerous passengers on shorter journeys. Buses operate with low capacity compared with trams or trains, and can operate on conventional roads, with relatively inexpensive bus stops to serve passengers. Therefore, buses are commonly used in smaller cities, towns, and rural areas, and for shuttle services (e.g. to the airport) supplementing other means of transit in large cities. Midibuses have an ever lower capacity, however double decker buses, articulated buses and bi-articulated buses have a slightly larger capacity.
Intercity bus service use coaches (long-distance buses) for suburb-to-CBD or longer-distance transportation. The vehicles are normally equipped with more comfortable seating, a separate luggage compartment, video and possibly also a toilet. They have higher standards than city buses, but a limited stopping pattern.
Certain types of buses, styled after old-style streetcars, are also called trackless trolleys, but are built on the same platforms as a typical diesel, CNG, or hybrid bus; these are more often used for tourist rides than commuting and tend to be privately owned. Similarly, trackless trains are often used for moving tourists between sights, often at beach resorts, or visitors within amusement parks, among others.
.jpg)
Trolleybus and electric buses
[edit]Trolleybuses are electrically powered buses that receive power from overhead power line by way of a set of trolley poles for mobility. Online Electric Vehicles are buses that run on a conventional battery, but are recharged frequently at certain points via underground wires.[23]
Electric buses can store the needed electrical energy on board, or be fed mains electricity continuously from an external source such as overhead lines. The majority of buses using on-board energy storage are battery electric buses (which is what this article mostly deals with), where the electric motor obtains energy from an onboard battery pack.

Bus rapid transit and guided busway
[edit]Bus rapid transit (BRT) is a term used for buses operating on dedicated right-of-way, much like a light rail; resulting in a higher capacity and operating speed compared to regular buses.
A Guided bus capable of being steered by external means, usually on a dedicated track or roll way that excludes other traffic, permitting the maintenance of schedules even during rush hours.

Rail
[edit]Passenger rail transport is the conveyance of passengers by means of wheeled vehicles specially designed to run on railways. Trains allow high capacity at most distance scales, but require track, signalling, stations and other infrastructure (e.g. electric cables) to be built and maintained, resulting in high upfront costs. Passenger rail is used on long distances (even crossing national borders), within regions and in various ways in urban environments. In many European countries, operators use specific train categories to distinguish between services. Rail travel is very popular in Japan (118 billion km (73 billion mi) per inhabitant and year in 2009)[24] and Switzerland (2,505 km (1,557 mi) per inhabitant and year in 2019).[25]
Heritage trains (often operating on heritage railways) and luxury trains are tourism-oriented rail services carrying passengers over scenic and/or historic routes.

_(cropped).jpg)
Inter-city and high-speed rail
[edit]Inter-city rail is long-haul passenger services that connect multiple urban areas. They have few stops, and aim at high average speeds, typically only making one of a few stops per city. These services may also be international, including overnight trains with sleeping cars or couchettes.
High-speed rail is passenger trains operating significantly faster than conventional rail—typically defined as at least 200 kilometres per hour (120 mph). The most predominant systems have been built in Europe and East Asia (China, Japan), and compared with air travel, offer long-distance rail journeys as quick as air services, have lower prices to compete more effectively and use electricity instead of combustion.[26] Trains that are faster than conventional trains but slower than high-speed trains are sometimes referred to as higher-speed trains.
Urban rail transit
[edit]Urban rail transit is an all-encompassing term for various types of local rail systems, such as for example trams, light rail, rapid transit, people movers, commuter rail, monorail, suspension railways and funiculars.
Commuter and regional rail
[edit]Commuter rail is part of an urban area's public transport. It provides faster services to outer suburbs and neighboring satellite cities. Trains stop at stations that are located to serve a smaller suburban or town center. The stations are often combined with shuttle bus or park and ride systems, and may also be equipped with bicycle parkings or stations. Frequency may be up to several times per hour, and commuter rail systems may either be part of the national railway or operated by local transit agencies.
Common forms of commuter rail employ either diesel electric locomotives, or electric multiple unit trains. They typically use single-level railroad cars, which allow for faster boarding/deboarding times, though some systems also use bilevel rail cars. Some commuter train lines share a railway with freight trains.[27]
Regional rail links towns and villages with each other. They typically run on an hourly or half-hourly basis and call at every station. At larger train stations, connections to long-distance trains are commonly offered. Some S-Bahn systems in German-speaking countries are comparable to regional trains. Some regional trains operate in mountainous areas.
-

-
 Merseyrail train in Liverpool
 -

-
 S-Bahn train in Vorarlberg

.jpg)
.jpg)

Rapid transit and light metro
[edit]A Metro rapid transit (MRT) railway system (also called a metro, underground, heavy rail, or subway) operates in an urban area with high capacity and frequency, and grade separation from other traffic.[28][29] Heavy rail is a high-capacity form of rail transit, with 4 to 10 units forming a train, and can be the most expensive form of transit to build. Modern heavy rail systems are mostly driverless, which allows for higher frequencies and less maintenance cost.[27]
Systems are able to transport large numbers of people quickly over short distances with little land use. Variations of rapid transit include people movers, small-scale light metro and the commuter rail hybrid S-Bahn (see also U-Bahn). More than 160 cities have rapid transit systems, totalling more than 8,000 km (4,971 mi) of track and 7,000 stations. Twenty-five cities have systems under construction.
Medium-capacity rail system (MCS) also including light metro, is light capacity rapid transit compared to typical heavy-rail rapid transit. MCS trains are usually 1 to 4 cars. Most medium-capacity rail systems are automated or use light-rail type vehicles.
Automated guideway transit (AGT) system is a type of fixed guideway transit infrastructure with a riding or suspension track that supports and physically guides one or more driverless vehicles along its length.
Some rapid transit systems use rubber-tyred trains instead of rail.
-
 A rapid transit train from New York City
 -
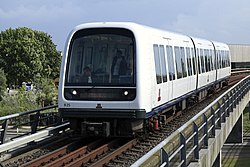 Light metro train in Copenhagen
 -
 Port Liner AGT system in Kobe
 -


Light rail transit
[edit]Light rail transit (LRT) is a term coined in 1972 and uses mainly tram technology. Light rail has mostly dedicated right-of-ways and less sections shared with other traffic and usually step-free access. A light rail line is generally traversed with increased speed compared to a tram line. Light rail lines are, thus, essentially modernized interurbans. Unlike trams, light rail trains are often longer and have one to four cars per train.[27] In some cases, trams are also considered part of the light rail family.
Special light rail variants are tramtrains (see also Karlsruhe model), premetros (designed for later conversion to rapid transit) or the Stadtbahn in Germany.
-

-
 Tram-train in Karlsruhe region
 -

.jpg)


Tram and streetcar
[edit]Trams (also known as streetcars or trolleys) are railborne vehicles that originally ran in city streets, though over decades more and more dedicated tracks are used. They have higher capacity than buses, but must follow dedicated infrastructure with rails and wires either above or below the track, limiting their flexibility.
In the United States, trams were commonly used prior to the 1930s, before being superseded by the bus. In modern public transport systems, they have been reintroduced in the form of the light rail.[27]
.jpg)
.jpg)
.jpg)


Rubber-tyred tram
[edit]A Rubber-tyred tram, is a development of the guided bus in which a vehicle is guided by a fixed rail in the road surface and draws current from overhead electric wires (either via pantograph or trolley pole).
A Translohr is a rubber-tyred tramway system, originally developed by Lohr Industrie of France and now run by a consortium of Alstom Transport and Fonds stratégique d'investissement (FSI) as newTL.
The Autonomous Rail Rapid Transit (ART) is a lidar (light detection and ranging) guided bus and bi-articulated bus system for urban passenger transport. It is resembling a rubber-tyred tram as much a tram and a Bus rapid transit system.[30]
Rack railway
[edit]Rack railways, also known as cog railways or cogwheel railways, provide public transport in mountainous regions, in both rural and urban areas. They are characterized by an additional middle rack rail and one or more cogwheels (rack and pinion) to overcome steep gradients, as opposed to conventional adhesion railways.
-
 A rack railway with bicycle trailer in Stuttgart
 -
 A rack railway in Switzerland
 -


.jpg)

Monorail
[edit]Somewhere between light and heavy rail in terms of carbon footprint,[citation needed] monorail systems usually use overhead tracks, similar to an elevated railway above other traffic. The systems are either mounted directly on the track supports or put in an overhead design with the train suspended. Maglevs use electromagnets instead of wheels on rail.
Monorail systems are used throughout the world (especially in Europe and east Asia, particularly Japan), but apart from public transit installations in Las Vegas and Seattle, most North American monorails are either short shuttle services or privately owned services (With 150,000 daily riders, the Disney monorail systems is a successful example).[31]
-
 A monorail in Kuala Lumpur
 -
 Former maglev at Incheon Airport, South Korea
 -

.jpg)


Personal rapid transit and people mover
[edit]Personal rapid transit (PRT) is an automated cab service that runs on rails or a guideway. This is an uncommon mode of transportation (excluding elevators) due to the complexity of automation. A fully implemented system might provide most of the convenience of individual automobiles with the efficiency of public transit. The crucial innovation is that the automated vehicles carry just a few passengers, turn off the guideway to pick up passengers (permitting other PRT vehicles to continue at full speed), and drop them off to the location of their choice (rather than at a stop). Conventional transit simulations show that PRT might attract many auto users in problematic medium-density urban areas. A number of experimental systems are in progress. One might compare personal rapid transit to the more labor-intensive taxi or paratransit modes of transportation, or to the (by now automated) elevators common in many publicly accessible areas.
Automated people mover (APM) are a special term for grade-separated rail which uses vehicles that are smaller and shorter in size.[27] These systems are generally used only in a small area such as a theme park or an airport.


Cable-propelled transit and funicular
[edit]Cable-propelled transit (CPT) is a transit technology that moves people in motor-less, engine-less vehicles that are propelled by a steel cable.[32] There are two sub-groups of CPT—gondola lifts and cable cars (railway). Gondola lifts are supported and propelled from above by cables, whereas cable cars are supported and propelled from below by cables.
While historically associated with usage in ski resorts, gondola lifts are now finding increased consumption and utilization in many urban areas—built specifically for the purposes of mass transit.[33] Many, if not all, of these systems are implemented and fully integrated within existing public transportation networks. Examples include Metrocable (Medellín), Metrocable (Caracas), Mi Teleférico in La Paz, Portland Aerial Tram, Roosevelt Island Tramway in New York City, and the London Cable Car.
Funicular is a type of cable railway system that connects points along a railway track laid on a steep slope. The system is characterized by two counterbalanced carriages (also called cars or trains) permanently attached to opposite ends of a haulage cable, which is looped over a pulley at the upper end of the track[34]
Hovertrains are also cable-driven but use a cushion pad instead of rails. Examples are the U-bahn in the car-free resort town of Serfaus, or previously the Narita Airport Terminal 2 shuttle in Japan and the Duke Hospital MRT in North Carolina.

Ferry
[edit]A ferry is a boat used to carry (or ferry) passengers, and sometimes their vehicles, across a body of water. A foot-passenger ferry with many stops is sometimes called a water bus. Ferries form a part of the public transport systems of many waterside cities and islands, allowing direct transit between points at a capital cost much lower than bridges or tunnels, though at a lower speed. Ship connections of much larger distances (such as over long distances in water bodies like the Mediterranean Sea) may also be called ferry services.

Integration with cycling
[edit]
Many cities around the world have introduced bikes, electric bikes, and scooters to their public transport infrastructure.[35][verification needed] Good cycling infrastructure, including good parking at stations, makes it feasible for people to travel further to public transport stations.[36]
Operation
[edit]Infrastructure
[edit]All public transport runs on infrastructure, either on roads, rail, airways or seaways. The infrastructure can be shared with other modes, freight and private transport, or it can be dedicated to public transport. The latter is especially valuable in cases where there are capacity problems for private transport. Investments in infrastructure are expensive and make up a substantial part of the total costs in systems that are new or expanding. Once built, the infrastructure will require operating and maintenance costs, adding to the total cost of public transport. Sometimes governments subsidize infrastructure by providing it free of charge, just as is common with roads for automobiles.
Interchanges
[edit]
Interchanges are locations where passengers can switch from one public transport route to another. This may be between vehicles of the same mode (like a bus interchange), or e.g. between bus and train. It can be between local and intercity transport (such as at a central station or airport).
Timetables
[edit]Timetables (or 'schedules' in North American English) are provided by the transport operator to allow users to plan their journeys. They are often supplemented by maps and fare schemes to help travelers coordinate their travel. Online public transport route planners help make planning easier. Mobile apps are available for multiple transit systems that provide timetables and other service information and, in some cases, allow ticket purchase, some allowing to plan your journey, with time fares zones e.g.
Services are often arranged to operate at regular intervals throughout the day or part of the day (known as clock-face scheduling). Often, more frequent services or even extra routes are operated during the morning and evening rush hours. Coordination between services at interchange points is important to reduce the total travel time for passengers. This can be done by coordinating shuttle services with main routes, or by creating a fixed time (for instance twice per hour) when all bus and rail routes meet at a station and exchange passengers. There is often a potential conflict between this objective and optimising the utilisation of vehicles and drivers.
Digitalisation and management tools
[edit]The operation of public transport has been transformed by fleet digitalization, evolving from manual processes to sophisticated, data-driven management systems.[37] This evolution is centered around the deployment of Intelligent Transportation Systems (ITS) that enhance both operational efficiency and the passenger experience.
A foundational component of modern operations is the use of telematics systems, with GPS devices, to track the real-time position of every vehicle in a fleet. This data is the bedrock for several key tools:
- Real-Time Passenger Information (RTPI): By processing AVL data, operators can calculate and disseminate accurate arrival and departure predictions to passengers through various channels, including mobile applications, websites, and digital displays at stations and stops.[38]
- Transport Management Systems: Control centers use software to monitor the entire network in real time. This allows dispatchers to manage services, respond to disruptions (such as traffic congestion or vehicle breakdowns), and ensure schedules are maintained.
- Data Analytics for Service Planning: The vast amount of data collected from AVL and ticketing systems provides valuable insights into travel patterns. Transport authorities use this data to analyze demand, optimize routes and schedules, and plan long-term network improvements.[39]
Digitalisation has also revolutionized fare collection. The evolution from manual ticket sales to modern electronic ticketing systems—such as those using contactless smart cards or mobile payment apps—has streamlined the boarding process. Furthermore, these systems can be integrated across different transport modes and operators to create a single, seamless payment system for travelers, significantly improving convenience.[40]
Financing
[edit]The main sources of financing are ticket revenue, government subsidies and advertising. The percentage of revenue from passenger charges is known as the farebox recovery ratio.[41] A limited amount of income may come from land development and rental income from stores and vendors, parking fees, and leasing tunnels and rights-of-way to carry fiber optic communication lines.
Fare and ticketing
[edit]

Most—but not all—public transport requires the purchase of a ticket to generate revenue for the operators. Tickets may be bought either in advance, or at the time of the journey, or the carrier may allow both methods. Passengers may be issued with a paper ticket, a metal or plastic token, or a magnetic or electronic card (smart card, contactless smart card). Sometimes a ticket has to be validated, e.g. a paper ticket has to be stamped, or an electronic ticket has to be checked in.
Tickets may be valid for a single (or return) trip, or valid within a certain area for a period of time (see transit pass). The fare is based on the travel class, either depending on the traveled distance, or based on zone pricing. A rail pass is a transit pass for rail, for which there are offers for tourists to Europe (Eurail, Interrail), Japan, South Korea, Taiwan, the United Kingdom (BritRail Pass), the United States (USA Rail Pass) and previously India.
The tickets may have to be shown or checked automatically at the station platform or when boarding, or during the ride by a conductor. Operators may choose to control all riders, allowing sale of the ticket at the time of ride. Alternatively, a proof-of-payment system allows riders to enter the vehicles without showing the ticket, but riders may or may not be controlled by a ticket controller; if the rider fails to show proof of payment, the operator may fine the rider at the magnitude of the fare.
Multi-use tickets allow travel more than once. In addition to return tickets, this includes period cards allowing travel within a certain area (for instance month cards), or to travel a specified number of trips or number of days that can be chosen within a longer period of time (called carnet ticket). Passes aimed at tourists, allowing free or discounted entry at many tourist attractions, typically include zero-fare public transport within the city. Period tickets may be for a particular route (in both directions), or for a whole network. A free travel pass allowing free and unlimited travel within a system is sometimes granted to particular social sectors, for example students, elderly, children, employees (job ticket) and the physically or mentally disabled.
Zero-fare public transport services are funded in full by means other than collecting a fare from passengers, normally through heavy subsidy or commercial sponsorship by businesses. Several mid-size European cities and many smaller towns around the world have converted their entire bus networks to zero-fare. Three capital cities in Europe have free public transport: Tallinn, Luxembourg and as of 2025, Belgrade. Local zero-fare shuttles or inner-city loops are far more common than city-wide systems. There are also zero-fare airport circulators and university transportation systems.
Revenue, profit and subsidies
[edit]Governments frequently opt to subsidize public transport for social, environmental or economic reasons. Common motivations include the desire to provide transport to people who are unable to use an automobile[42] and to reduce congestion, land use and automobile emissions.[42]
Subsidies may take the form of direct payments for financially unprofitable services, but support may also include indirect subsidies. For example, the government may allow free or reduced-cost use of state-owned infrastructure such as railways and roads, to stimulate public transport's economic competitiveness over private transport, that normally also has free infrastructure (subsidized through such things as gas taxes). Other subsidies include tax advantages (for instance aviation fuel is typically not taxed), bailouts if companies that are likely to collapse (often applied to airlines) and reduction of competition through licensing schemes (often applied to taxis and airlines). Private transport is normally subsidized indirectly through free roads and infrastructure,[43] as well as incentives to build car factories[44] and, on occasion, directly via bailouts of automakers.[45][46] Subsidies also may take the form of initial or increased tolls for drivers, such as the San Francisco Bay Area raising tolls on numerous bridges and proposing more hikes to fund the Bay Area Rapid Transit system.[47]
Land development schemes may be initialized, where operators are given the rights to use lands near stations, depots, or tracks for property development. For instance, in Hong Kong, MTR Corporation Limited and KCR Corporation generate additional profits from land development to partially cover the cost of the construction of the urban rail system.[48]
Some supporters of mass transit believe that use of taxpayer capital to fund mass transit will ultimately save taxpayer money in other ways, and therefore, state-funded mass transit is a benefit to the taxpayer. Some research has supported this position,[49] but the measurement of benefits and costs is a complex and controversial issue.[50] A lack of mass transit results in more traffic, pollution,[51][52][53] and road construction[54] to accommodate more vehicles, all costly to taxpayers;[55] providing mass transit will therefore alleviate these costs.[56]
A study found that support for public transport spending is much higher among conservatives who have high levels of trust in government officials than those who do not.[57]
Safety and security
[edit]
The injury and death rate due to crashes for public transit tends to be lower than that of automobile travel.[58] A 2014 study noted that "residents of transit-oriented communities have about one-fifth the per capita crash casualty rate as in automobile-oriented communities".[58]
Higher crime rates with public transport compared to automobile travel were found by a 2018 study in Netherlands.[59] Some public transport systems attract vagrants who use the stations or trains as sleeping shelters.[60] The safety and security of public transport varies by location and time.[61]
Impact
[edit]Accessibility
[edit]
Public transport is means of independent transport for individuals (without walking or bicycling) such as children too young to drive, the elderly without access to cars, those who do not hold a drivers license, and the infirm such as wheelchair users. Kneeling buses, low-floor access boarding on buses and light rail has also enabled greater access for the disabled in mobility. In recent decades low-floor access has been incorporated into modern designs for vehicles. In economically deprived areas, public transport increases individual accessibility to transport where private means are unaffordable.
Environmental
[edit]
Although there is continuing debate as to the true efficiency of different modes of transportation, mass transit is generally regarded as significantly more energy efficient than other forms of travel. A 2002 study by the Brookings Institution and the American Enterprise Institute found that public transportation in the U.S. uses approximately half the fuel required by cars, SUVs and light trucks. In addition, the study noted that "private vehicles emit about 95 percent more carbon monoxide, 92 percent more volatile organic compounds and about twice as much carbon dioxide and nitrogen oxide than public vehicles for every passenger mile traveled".[63]
Studies have shown that there is a strong inverse correlation between urban population density and energy consumption per capita, and that public transport could facilitate increased urban population densities, and thus reduce travel distances and fossil fuel consumption.[64]
Supporters of the green movement usually advocate public transportation, because it offers decreased airborne pollution compared to automobiles transporting a single individual.[65] A study conducted in Milan, Italy, in 2004 during and after a transportation strike serves to illustrate the impact that mass transportation has on the environment. Air samples were taken between 2 and 9 January, and then tested for methane, carbon monoxide, non-methane hydrocarbons (NMHCs), and other gases identified as harmful to the environment. The figure below is a computer simulation showing the results of the study "with 2 January showing the lowest concentrations as a result of decreased activity in the city during the holiday season. 9 January showed the highest NMHC concentrations because of increased vehicular activity in the city due to a public transportation strike."[66]
Based on the benefits of public transport, the green movement has affected public policy. For example, the state of New Jersey released Getting to Work: Reconnecting Jobs with Transit.[67] This initiative attempts to relocate new jobs into areas with higher public transportation accessibility. The initiative cites the use of public transportation as being a means of reducing traffic congestion, providing an economic boost to the areas of job relocation, and most importantly, contributing to a green environment by reducing carbon dioxide (CO2) emissions.
Using public transportation can result in a reduction of an individual's carbon footprint. A single person, 20-mile (32 km) round trip by car can be replaced using public transportation and result in a net CO2 emissions reduction of 4,800 pounds (2,200 kg) per year.[68] Using public transportation saves CO2 emissions in more ways than simply travel as public transportation can help to alleviate traffic congestion as well as promote more efficient land use. When all three of these are considered, it is estimated that 37 million metric tons of CO2 will be saved annually.[68] Another study claims that using public transit instead of private in the U.S. in 2005 would have reduced CO2 emissions by 3.9 million metric tons and that the resulting traffic congestion reduction accounts for an additional 3.0 million metric tons of CO2 saved.[69] This is a total savings of about 6.9 million metric tons per year given the 2005 values.
In order to compare energy impact of public transportation to private transportation, the amount of energy per passenger mile must be calculated. The reason that comparing the energy expenditure per person is necessary is to normalize the data for easy comparison. Here, the units are in per 100 p-km (read as person kilometer or passenger kilometer). In terms of energy consumption, public transportation is better than individual transport in a personal vehicle.[70] In England, bus and rail are popular methods of public transportation, especially in London. Rail provides rapid movement into and out of the city of London while busing helps to provide transport within the city itself. As of 2006–2007, the total energy cost of London's trains was 15 kWh per 100 p-km, about 5 times better than a personal car.[71]
For busing in London, it was 32 kWh per 100 p-km, or about 2.5 times less than that of a personal car.[71] This includes lighting, depots, inefficiencies due to capacity (i.e., the train or bus may not be operating at full capacity at all times), and other inefficiencies. Efficiencies of transport in Japan in 1999 were 68 kWh per 100 p-km for a personal car, 19 kWh per 100 p-km for a bus, 6 kWh per 100 p-km for rail, 51 kWh per 100 p-km for air, and 57 kWh per 100 p-km for sea.[71] These numbers from either country can be used in energy comparison calculations or life-cycle assessment calculations.
Public transportation also provides an arena to test environmentally friendly fuel alternatives, such as hydrogen-powered vehicles. Swapping out materials to create lighter public transportation vehicles with the same or better performance will increase environmental friendliness of public transportation vehicles while maintaining current standards or improving them.
In the 2023 study titled "Subways and CO2 Emissions: A Global Analysis with Satellite Data," research reveals that subway systems significantly reduce CO2 emissions by approximately 50% in the cities they serve, contributing to an 11% global reduction. The study also explores potential expansion in 1,214 urban areas lacking subways, suggesting a potential emission cut by up to 77%. Economically, subways are viable in 794 cities under optimistic financial conditions (SCC at US$150/ton and SIC at US$140 million/km), but this figure drops to 294 cities with more pessimistic assumptions. Despite high costs—about US$200 million per kilometer for construction—subways offer substantial co-benefits, such as reduced traffic congestion and improved public health, making them a strategic investment for urban sustainability and climate mitigation.[72][73]
Electric public transit efficiency
[edit]
Shifts from private to public transport (train, trolleybus, personal rapid transit or tram) have the potential for large gains in efficiency in terms of an individual's distance traveled per kWh.
Research shows people prefer trams to buses,[74] because they are quieter and more comfortable and perceived as having higher status.[75] Therefore, it may be possible to cut liquid fossil fuel consumption in cities through the use of electric trams. Trams may be the most energy-efficient form of public transportation, with rubber-wheeled vehicles using two-thirds more energy than the equivalent tram, and run on electricity rather than fossil fuels.
In terms of net present value, they are also the cheapest – Blackpool trams are still running after 100 years,[76] but combustion buses only last about 15 years.
Land use
[edit].jpg)
Dense areas with mixed-land uses promote daily public transport use while urban sprawl is associated with sporadic public transport use. A recent European multi-city survey found that dense urban environments, reliable and affordable public transport services, and limiting motorized vehicles in high density areas of the cities will help achieve much needed promotion of public transport use.[77][78]
Urban space is a precious commodity and public transport utilises it more efficiently than a car dominant society, allowing cities to be built more compactly than if they were dependent on automobile transport.[79] If public transport planning is at the core of urban planning, it will also force cities to be built more compactly to create efficient feeds into the stations and stops of transport.[5][80] This will at the same time allow the creation of centers around the hubs, serving passengers' daily commercial needs and public services. This approach significantly reduces urban sprawl. Public land planning for public transportation can be difficult but it is the State and Regional organizations that are responsible to planning and improving public transportation roads and routes. With public land prices booming, there must be a plan to using the land most efficiently for public transportation in order to create better transportation systems. Inefficient land use and poor planning leads to a decrease in accessibility to jobs, education, and health care.[81]
Societal
[edit]A developed country is not a place where the poor have cars; it's where the rich use public transport —Enrique Peñalosa, former mayor of Bogotá[82]
The consequences for wider society and civic life, is public transport breaks down social and cultural barriers between people in public life. An important social role played by public transport is to ensure that all members of society are able to travel without walking or cycling, not just those with a driving license and access to an automobile—which include groups such as the young, the old, the poor, those with medical conditions, and people banned from driving. Automobile dependency is a name given by policy makers to places where those without access to a private vehicle do not have access to independent mobility.[83] This dependency contributes to the transport divide. A 2018 study published in the Journal of Environmental Economics and Management concluded that expanded access to public transit has no meaningful impact on automobile volume in the long term.[84]

Above that, public transportation opens to its users the possibility of meeting other people, as no concentration is diverted from interacting with fellow-travelers due to any steering activities. Adding to the above-said, public transport becomes a location of inter-social encounters across all boundaries of social, ethnic and other types of affiliation.
Social issues
[edit]Impact of COVID-19 pandemic
[edit]The COVID-19 pandemic had a substantial effect on public transport systems, infrastructures and revenues in various cities across the world.[85] The pandemic negatively impacted public transport usage by imposing social distancing, remote work, or unemployment. In the United States it caused a 79% drop in public transport riders at the beginning of 2020. This trend continued throughout the year with a 65% reduced ridership as compared to previous years.[86] Similarly in London, at the beginning of 2020, ridership in the London Underground and buses declined by 95% and 85% respectively.[87]
A 55% drop in public transport ridership as compared to 2019 was reported in Cairo, Egypt after a period of mandatory halt. To reduce COVID-spread through cash contact, in Nairobi, Kenya, cashless payment systems were enforced by National Transport and Safety Authority (NTSA). Public transport was halted for three months in 2020 in Kampala, Uganda with people resorting to walking or cycling. Post-quarantine, upon renovating public transport infrastructure, public transport such as minibus taxis were assigned specific routes. The situation was difficult in cities where people are heavily dependent on the public transport system. In Kigali, Rwanda social distancing requirements led to fifty percent occupancy restrictions, but as the pandemic situation improved, the occupancy limit was increased to meet popular demands. Addis Ababa, Ethiopia also had inadequate bus services relative to demand and longer wait times due to social distancing restrictions and planned to deploy more buses. Both Addis Ababa and Kampala aim to improve walking and cycling infrastructures in the future as means of commuting complementary to buses.[88]
Examples of public transport systems
[edit]- Armenia
- Australia
- Melbourne (see also Melbourne Principles)
- Bulgaria
- Canada
- Estonia
- Fiji
- Finland
- Germany
- Greece
- Hungary
- Ireland
- The Netherlands
- New Zealand
- Slovakia
- Switzerland
- Zurich (see also Zurich model)
- Turkey
- United Kingdom
- United States
See also
[edit]- Deutschlandticket
- Finnish models of public transport
- Free public transport
- Health impact of light rail systems
- International Association of Public Transport
- List of tram and light rail transit systems
- List of urban transit advocacy organisations
- Passenger load factor
- Patronage (transport)
- Private transport
- Public transport accessibility level
- Public transport bus service
- Public transport route planner
- Public transport timetable
- Rail pass
- Sustainable transport
- Transit district
- Transit pass
- Transit police
- Transit watchdog
- Transport divide
- Transportation engineering
References
[edit]- ^ "Public transport". Oxford Dictionary. 2025. Retrieved 16 June 2025.
Transport available for public use; a transport system (of buses, trains, etc.) that runs on fixed routes at set times and may be used by anyone with a valid ticket or pass.
- ^ "public transport in British". Collins English Dictionary. HarperCollins. Archived from the original on 2 December 2018. Retrieved 30 January 2018.
a system of buses, trains, etc., running on fixed routes, on which the public may travel
- ^ Preston, John (2020). "Public Transport". International Encyclopedia of Human Geography (Second Edition): 113–120. doi:10.1016/B978-0-08-102295-5.10325-7. ISBN 978-0-08-102296-2.
- ^ "Coronavirus (COVID-19): safer travel guidance for passengers - Walking, cycling, and travelling in vehicles or on public transport". UK Government. Retrieved 17 July 2021.
Check with your transport operator: bus, coach, tram and ferry operators/National Rail/TfL
- ^ a b McLeod, Sam (2017). "Urban Public Transport: Planning Principles and Emerging Practice". Journal of Planning Literature. 32 (3): 223–239. doi:10.1177/0885412217693570. S2CID 157431405.
- ^ "PublicTransportation.org". www.publictransportation.org. Archived from the original on 30 April 2011. Retrieved 15 January 2022.
- ^ Calimente, John (2012). "Rail integrated communities in Tokyo". Journal of Transport and Land Use. 5 (1). doi:10.5198/jtlu.v5i1.280. hdl:11299/171057.
- ^ "Lessons from Japanese Experiences of Roles of Public and Private Sectors in Urban Transport". Japan Railway & Transport Review. Archived from the original on 26 October 2017. Retrieved 14 December 2013.
- ^ "Public transport is in decline in many wealthy cities". The Economist. 18 July 2018. Retrieved 25 March 2022.
- ^ "Public Transit @ProjectDrawdown #ClimateSolutions". Project Drawdown. 6 February 2020. Retrieved 2 April 2022.
- ^ See Pre Columbian Wheels
- ^ Littleton, C. Scott (1 January 2005). Gods, Goddesses, and Mythology. Marshall Cavendish. ISBN 9780761475644.
- ^ Needham, Joseph. (1986). Science and Civilization in China: Volume 4, Physics and Physical Technology, Part 3, Civil Engineering and Nautics. Taipei: Caves Books, Ltd. ISBN 0521070600
- ^ web-page (in French) at http://www.herodote.net/histoire/evenement.php?jour=18260810 Archived 16 October 2010 at the Wayback Machine. Retrieved 13 June 2008
- ^ Alfred, Randy. "March 18, 1662: The Bus Starts Here ... in Paris". Wired. Retrieved 28 August 2023.
- ^ "The London Omnibus". Knowledgeoflondon.com. Archived from the original on 1 November 2011. Retrieved 21 October 2011.
- ^ "Mumbles railway was 'remarkable'". BBC. 25 March 2007.
- ^ "The Metropolitan line". London Transport Museum. Retrieved 30 March 2022.
- ^ Young, Jay (2 March 2015). "Infrastructure: Mass Transit in 19th- and 20th-Century Urban America". Oxford Research Encyclopedia of American History. doi:10.1093/acrefore/9780199329175.013.28. ISBN 9780199329175. Archived from the original on 29 November 2018. Retrieved 28 November 2018.
- ^ Andrea Lo (15 January 2019). "Luxembourg makes all public transport free". CNN. Retrieved 30 March 2022.
- ^ Joseph L. Schofer. "Mass transit". Encyclopædia Britannica. Archived from the original on 31 January 2018. Retrieved 30 January 2018.
- ^ Humphreys, Pat (17 December 2016). "City Transport in the 2020s". Transport and Travel. Archived from the original on 2 February 2017. Retrieved 20 January 2017.
- ^ "KAIST Online Electric Vehicle". Gizmag.com. 20 August 2009. Archived from the original on 13 August 2011. Retrieved 21 October 2011.
- ^ The Association of Japanese Private Railways. 大手民鉄の現況(単体) (PDF) (in Japanese). Archived from the original (PDF) on 4 March 2012. Retrieved 27 November 2010.
- ^ Imwinkelried, Daniel (18 September 2022). "Das Klimaticket soll Österreicher zum Umsteigen bewegen". Neue Zürcher Zeitung (in German). Retrieved 19 September 2022.
- ^ Eli (26 May 2010). "High Speed Train VS Airplane". Tech the Future. Archived from the original on 4 March 2016. Retrieved 21 October 2011.
- ^ a b c d e Spieler, Christof (2021). Trains, Buses, People (2nd ed.). Washington, DC: Island Press. pp. 16–17. ISBN 9781642832136. LCCN 2021935870.
- ^ "Rapid transit". Merriam-Webster. Archived from the original on 27 June 2013. Retrieved 27 February 2008.; "Metro". International Association of Public Transport. Archived from the original on 27 June 2013. Retrieved 27 February 2008.
- ^ "Glossary of Transit Terminology". American Public Transportation Association. Archived from the original on 27 September 2007. Retrieved 27 February 2008.
- ^ "zatran".
- ^ suzannep. "Disney World Transportation Map [Interactive Guide to Navigate Disney]". Magic Guides. Retrieved 6 March 2021.
- ^ – The Gondola Project Archived 2 February 2011 at the Wayback Machine Basic Lesson 1: What is Cable Propelled Transit Retrieved on 7 November 2009
- ^ – Planetizen Archived 28 December 2010 at the Wayback Machine South America Incubates Cable Propelled Transit Retrieved on 10 June 2010
- ^ The Giessbach Funicular with the World's First Abt Switch (PDF). The American Society of Mechanical Engineers. 2015.
- ^ "How two-wheelers are weaving their way into urban transport". The Economist. Retrieved 25 March 2022.
- ^ Kosmidis, Ioannis; Müller-Eie, Daniela (2 January 2024). "The synergy of bicycles and public transport: a systematic literature review". Transport Reviews. 44 (1): 34–68. doi:10.1080/01441647.2023.2222911. ISSN 0144-1647.
- ^ "Smart and Secure: How Digitalization is Transforming Public Transport". Berg Insight. Retrieved 19 September 2025.
- ^ Skarga-Bandurova, I.; Derkach, M.; Kotsiuba, I. (September 2018). "The Information Service for Delivering Arrival Public Transport Prediction". 2018 IEEE 4th International Symposium on Wireless Systems within the International Conferences on Intelligent Data Acquisition and Advanced Computing Systems (IDAACS-SWS). pp. 84–88. doi:10.1109/IDAACS-SWS.2018.8525787. ISBN 978-1-5386-9339-1.
- ^ "Estonia's public transportation digital transformation". Shared City. Retrieved 19 September 2025.
- ^ "Estonia's public transportation digital transformation". Shared City. Retrieved 19 September 2025.
- ^ "Farebox Recovery Ratio, Selected Transit Systems". transportgeography.org. 4 December 2017. Retrieved 14 April 2025.
- ^ a b Litman, Todd (September 2016). "Evaluating Public Transit Benefits and Costs" (PDF). Victoria Transport Policy Institute. Archived (PDF) from the original on 10 January 2017.
- ^ Krukar, Milan; Merriss, John; Henion, Loyd (31 January 1983). Subsidies in Oregon Highway Transportation. TRB Publications Index. ISBN 978-0-309-03361-9. Archived from the original on 29 September 2011. Retrieved 21 October 2011.
- ^ "Canadian auto subsidies: Money for nothing? | vox – Research-based policy analysis and commentary from leading economists". Voxeu.org. 21 December 2008. Archived from the original on 28 October 2011. Retrieved 21 October 2011.
- ^ "General Motors bailout details". Chicago Sun-Times. Archived from the original on 18 April 2010.
- ^ Roth, Alisa (4 December 2008). "Auto bailout talk is history repeating | Marketplace From American Public Media". Marketplace.publicradio.org. Archived from the original on 11 July 2012. Retrieved 21 October 2011.
- ^ "$1.50 bridge toll hike? Bay Area drivers could be on the hook to help bail out BART and other transit". The Mercury News. 26 June 2023. Retrieved 1 July 2023.
- ^ Verougstraete, Matheiu; Zeng, Han (July 2014). "Land Value Capture Mechanism: The Case of the Hong Kong Mass Transit Railway" (PDF). www.unescap.org. United Nations Economic and Social Commission for Asia and the Pacific. Archived (PDF) from the original on 25 October 2016.
- ^ For examples, see http://onlinepubs.trb.org/onlinepubs/tcrp/tcrp_rpt_49.pdf Archived 6 July 2010 at the Wayback Machine and http://onlinepubs.trb.org/onlinepubs/tcrp/tcrp_rpt_34.pdf Archived 5 July 2010 at the Wayback Machine
- ^ "GAO-05-423SP Highlights of an Expert Panel: The Benefits and Costs of Highway and Transit Investments" (PDF). Archived (PDF) from the original on 18 December 2011. Retrieved 21 October 2011.
- ^ Kielburger, Craig; Kielburger, Marc (12 May 2008). "Transit key in pollution, poverty fights". The Star. Toronto. Archived from the original on 22 October 2012.
- ^ "Healthy Places – Respiratory Health and Air Pollution". CDC. 15 October 2009. Archived from the original on 15 October 2011. Retrieved 21 October 2011.
- ^ "Transportation Cost and Benefit Analysis II – Air Pollution Costs" (PDF). Victoria Transport Policy Institute. Archived (PDF) from the original on 6 July 2010. Retrieved 29 October 2012.
- ^ "Highway Construction Cost / Inflation Issues – Contract Admin – Construction". FHWA. 22 August 2011. Archived from the original on 23 October 2011. Retrieved 21 October 2011.
- ^ "Transportation Cost and Benefit Analysis". Victoria Transport Public Institute. Archived from the original on 9 October 2011. Retrieved 21 October 2011.
- ^ "Transportation Cost and Benefit Analysis II – Conclusions and Recommendations" (PDF). Victoria Transport Policy Institute. 3 January 2009. Archived (PDF) from the original on 6 July 2010. Retrieved 9 April 2010.
- ^ Lim, Jae Young; Moon, Kuk-Kyoung (January 2022). "The Implications of Political Trust for Supporting Public Transport". Journal of Social Policy. 51 (1): 77–95. doi:10.1017/S0047279420000707. S2CID 234005857.
- ^ a b Todd Litman, A New Transit Safety Narrative Archived 12 December 2019 at the Wayback Machine, Journal of Public Transportation, Vol. 17, No. 4 (2014), pp. 114–134.
- ^ Ruiter, Stijn; Bernasco, Wim (2018). "Is travel actually risky? A study of situational causes of victimization". Crime Science. 7 (1): 10. doi:10.1186/s40163-018-0084-6. ISSN 2193-7680.
- ^ Needle et al., 1997: 10–13
- ^ Ceccato, Vania; Gaudelet, Nathan; Graf, Gabin (2022). "Crime and safety in transit environments: a systematic review of the English and the French literature, 1970–2020". Public Transport. 14 (1): 105–153. doi:10.1007/s12469-021-00265-1. ISSN 1613-7159.
- ^ "Van Hool presents the ExquiCity Design Mettis". Archived from the original on 5 June 2013. Retrieved 5 June 2012.
- ^ Lyndsey Layton, "Study Lists Mass Transit Benefits", The Washington Post, 17 July 2002, Page B05
- ^ Newman, 1999
- ^ "Environmental Benefits of Public Transit | The Environment". www.kcata.org. Retrieved 21 April 2025.
- ^ Barletta, Barbara; Dabdub, Donald; Blake, Donald R.; Rowand, F. Sherwood; Nissenson, Paul; Meinardi, Simone (2008). "Influence of the public transportation system on the air quality of a major urban center. A case study: Milan, Italy". Atmospheric Environment. 42 (34): 7915–7923. Bibcode:2008AtmEn..42.7915M. doi:10.1016/j.atmosenv.2008.07.046. S2CID 21271533.
- ^ New Jersey Future. "Getting to Work: Reconnecting Jobs with Transit. Archived 20 July 2011 at the Wayback Machine" New Jersey Future.1 November 2008.New Jersey Environmental Digital Library. 7 December 2009
- ^ a b Public Transportation Reduces Greenhouse Gases and Conserves Energy.
- ^ Todd Davis; Monica Hale. "Public Transportation's Contribution to U.S. Greenhouse Gas Reduction." Sept. 2007. p. 25
- ^ David JC MacKay. "Sustainable Energy Without the Hot Air." 2009. p. 120 www.withouthotair.com
- ^ a b c David JC MacKay. "Sustainable Energy Without the Hot Air." 2009. p. 121 www.withouthotair.com
- ^ "Riding into a greener future: How widespread use of subways could slash CO2 emissions". World Bank Blogs. Retrieved 3 May 2024.
- ^ Dasgupta, Susmita; Lall, Somik; Wheeler, David (2023). "Subways and CO2 emissions: A global analysis with satellite data". Science of the Total Environment. 883 163691. Bibcode:2023ScTEn.88363691D. doi:10.1016/j.scitotenv.2023.163691. PMID 37100143.
- ^ "Trams, energy saving, private cars, trolley buses, diesel buses | Claverton Group". Claverton-energy.com. 28 May 2009. Archived from the original on 19 September 2009. Retrieved 19 September 2009.
- ^ Lesley, Lewis (October 2008). "Sustainable light rail". Claverton Group. Archived from the original on 16 September 2009. Retrieved 19 September 2009.
- ^ "Blackpool Trams – Then and Now". Live Blackpool. 9 September 2020. Archived from the original on 30 October 2020. Retrieved 26 November 2020.
- ^ Gascon, Mireia (August 2020). "What explains public transport use? Evidence from seven European cities". Transport Policy. 99: 362–374. doi:10.1016/j.tranpol.2020.08.009. hdl:10044/1/82997. S2CID 225362683.
- ^ Mayer, Jonas (13 May 2025). "Can public transport ever replace cars?". dw.com. Retrieved 3 August 2025.
- ^ "UITP – Public transport alleviates congestion" (PDF). Archived from the original (PDF) on 2 October 2011. Retrieved 21 October 2011.
- ^ "UITP Advocacy". Uitp.org. Archived from the original on 10 March 2012. Retrieved 21 October 2011.
- ^ Kulyk, Walter (2002). Urban Public Transportation Systems: Ensuring Sustainability Through Mass Transit. American Society of Civil Engineers. pp. 408–409. ISBN 978-0-7844-0717-2.
- ^ "Public transportation: Not only for the poor". The Himalayan Times. 1 April 2014. Archived from the original on 10 April 2014. Retrieved 1 April 2014.
- ^ Litman, T. (1999), The Costs of Automobile Dependency and the Benefits of Balanced Transport, Victoria Public Policy Institute
- ^ Beaudoin, Lin Lawell (19 January 2018), The effects of public transit on the demand for automobile travel, pp. 447–467
- ^ Winkless, Laurie (15 February 2022). "What Impact Has The Pandemic Had On Mass Transit?". Forbes. Retrieved 22 March 2022.
- ^ EBP US, Inc. (27 January 2021). "The Impact of the COVID-19 Pandemic on Public Transit Funding Needs in the U.S." APTA. American Public Transportation Association. Retrieved 22 March 2022.
- ^ "Coronavirus: Transport for London furloughs 7,000 staff as fare revenue plunges 90%". Sky News. 24 April 2020. Retrieved 23 March 2022.
- ^ Mimano, Carolyne (January 2021). "Africa in Transition:Improving Urban Mobility Amid the COVID-19 Pandemic" (PDF). www.ITDP.org. Institute for Transportation and Development Policy. Retrieved 23 March 2022.
Further reading
[edit]- Bloom, Nicholas Dagen, The Great American Transit Disaster: A Century of Austerity, Auto-centric Planning, and White Flight, University of Chicago Press, 2023 ISBN 978-0-226-82440-6
- Hess, D. 2007. "What is a clean bus? Object conflicts in the greening of urban transit." Sustainability: Science, Practice, & Policy 3(1):45–58. [1]
- Needle, Jerome A.; Transportation Security Board & Cobb, Renée M. (1997). Improving Transit Security. Transportation Security Board. ISBN 978-0-309-06013-4.
- Newman, Peter; Jeffrey R. Kenworthy (1999). Sustainability and Cities: Overcoming Automobile Dependence. Island Press. ISBN 978-1-55963-660-5.
- Ovenden, Mark (2007). Transit Maps of the World. London: Penguin. p. 7. ISBN 978-0-14-311265-5.
- Valderrama, A.; Beltran, I. (2007). "Diesel versus compressed natural gas in Transmilenio-Bogotá: innovation, precaution, and distribution of risk". Sustainability: Science, Practice, & Policy 3(1):59–67. Archived from the original on 30 June 2007. Retrieved 2 March 2017.
- Costales, Bryan (2021). Elevator Versus Bus. United States: Fool Church Media. ISBN 978-1945232-41-1.
External links
[edit]| Bus service | |
|---|---|
| Rail | |
| Vehicles for hire | |
| Carpooling | |
| Ship | |
| Cable | |
| Other transport | |
| Locations | |
| Ticketing and fares |
|
| Routing | |
| Facilities | |
| Scheduling | |
| Politics | |
| Technology and signage | |
| Models | |
| Other topics | |
Public transport
View on GrokipediaHistory
Origins in Pre-Industrial Societies
In ancient Rome, where urban population densities reached approximately 1 million inhabitants by the 2nd century CE, shared vehicular travel emerged as a practical response to distances that exceeded feasible walking for merchants and laborers carrying goods. The raeda, a four-wheeled carriage drawn by horses or mules, functioned as an early form of shared passenger conveyance, accommodating multiple travelers on predefined routes between cities and relay stations, with fares paid per journey segment.[11] These vehicles operated without fixed schedules or state subsidies, relying on private operators who changed draft animals at mutationes (staging posts) spaced 15–25 Roman miles apart, enabling average speeds of 20–40 miles per day under favorable conditions.[11] However, capacity remained low—typically 4–6 passengers—and services were demand-driven, concentrated on major roads like the Via Appia, where high traffic volumes justified operations absent alternatives like personal mounts for the non-elite.[12] Water-based shared mobility similarly arose in pre-industrial settings constrained by geography, as seen in medieval European river crossings where guilds of watermen provided ferry services for passengers and light freight. By the late Middle Ages (circa 1350–1500 CE), organized passenger transport on rivers developed in regions like England and the Low Countries, with ferries propelled by oars, poles, or ropes hauled from shore, serving pilgrims, traders, and locals where bridges were scarce or seasonally impassable.[13] These operations, often regulated by local guilds to prevent monopolies and ensure safety, transported groups of 10–20 individuals per crossing, with fares scaled by distance and load, reflecting voluntary aggregation driven by the inefficiency of individual fording in populous trade hubs.[14] Empirical records from Thames watermen guilds indicate self-sustaining models without public funding, succeeding only in high-density corridors like London's river traffic, where walking equivalents were drowned out by tidal currents and commerce volumes exceeding personal capacity. Such systems underscored causal limits: low-tech modalities persisted where terrain enforced group necessity, but faltered in less dense areas due to coordination costs and predation risks on unguarded routes. In Byzantine Constantinople, a metropolis of up to 500,000 residents by the 6th century CE, intra-urban and cross-Bosporus boat services supplemented land travel, with private operators ferrying passengers via oared galleys and sailboats from harbors like Prosphorion.[15] These voluntary arrangements, documented in legal codes like the Ecloga, catered to diverse users including officials and merchants, achieving capacities of 50–100 per vessel on short hops, but remained sporadic and weather-dependent without infrastructural mandates.[16] Overall, pre-industrial precursors exemplified scale-constrained, unsubsidized shared mobility, viable solely in environments where population pressures rendered solitary alternatives causally untenable, foreshadowing later expansions only under mechanized thresholds.[17]19th-Century Mechanization and Urban Growth
The industrialization of Europe and North America in the 19th century triggered rapid urban expansion, as rural migrants flocked to factories in cities like London and New York, generating acute demand for affordable mass transport to enable daily commutes. London's share of England's population increased from 10% in 1801 to 21.6% by 1901, while New York's manufacturing boom similarly swelled its populace, straining walking and private carriage capacities.[18][19] Private entrepreneurs addressed this through horse-drawn omnibuses, which offered scheduled services at fares sufficient to cover costs without subsidies. In London, George Shillibeer initiated the first such route on July 4, 1829, from Paddington Green to the Bank of England, accommodating up to 22 passengers per vehicle. Operations expanded swiftly, reaching about 400 buses by 1832, as market competition spurred route proliferation to serve factory workers and merchants.[20][21] Early mechanization efforts sought to supplant horses with steam engines for greater reliability amid congestion. Walter Hancock's "Enterprise" steam omnibus launched regular service on April 22, 1833, plying the London Wall to Paddington route at speeds up to 10-12 mph, though mechanical unreliability and safety concerns limited widespread adoption. Horse-drawn rail trams then prevailed, providing smoother rides on fixed tracks; New York's inaugural line opened November 14, 1832, via the New York and Harlem Railroad, with the car "John Mason" named for its banking patron, enabling faster travel and higher throughput that directly supported suburban worker flows.[22][23][24] These rail innovations markedly increased capacity—trams carried 40-60 passengers versus omnibuses' 20—but unchecked demand from urban influxes quickly induced overcrowding, as private operators reacted post hoc to ridership surges rather than preemptively scaling via collective planning. Electrification advanced this trend late in the century; Werner von Siemens' Gross-Lichterfelde line near Berlin debuted as the first electric tramway on May 16, 1881, attaining 10-15 mph with overhead wires, thus accommodating denser populations through enhanced efficiency without proportional animal labor increases.[25]20th-Century Expansion and Automobile Competition
Following World War I, public transport systems in the United States and Europe underwent substantial expansion to accommodate urban population growth and industrialization. In the US, electric streetcar networks reached their maximum extent in 1919, with annual ridership peaking at around 13 billion passengers by 1923, primarily serving urban commuters. Per capita transit trips in urban areas hit a record 287 annually in 1920, underscoring the near-universal dependence on these fixed-route systems before widespread personal vehicle adoption.[26][27][28] European cities similarly invested in tram and bus extensions, leveraging electrification to enhance capacity and speed amid post-war reconstruction.[29] The introduction of the Ford Model T in 1908 marked the onset of affordable mass-produced automobiles, which offered superior door-to-door flexibility and schedule independence compared to public transport's rigid routes and timetables. By the 1920s, falling prices and improved roads spurred a surge in car ownership, with registrations rising dramatically and enabling suburban expansion that further diluted urban transit densities. This consumer preference for personal vehicles over collective systems initiated a market-driven shift, as automobiles provided privacy, comfort, and adaptability for daily needs without intermediate transfers or crowding.[30][31][32] Consequently, US public transit ridership declined sharply from its mid-1920s zenith, dropping by more than 50% by the 1950s as automobile use dominated urban mobility; streetcar passengers alone fell from 12-13 billion annually in the 1920s to just 300,000 by 1963. Private operators, facing revenue shortfalls from this patronage loss, often curtailed services to stem losses, compounding the vicious cycle of reduced frequency and appeal. In contrast, the UK's 1948 Transport Act nationalized bus and rail services to integrate operations, yet this state control coincided with persistent inefficiencies and slower adaptation to automotive competition, differing from the US's voluntary private enterprises that, despite struggles, responded more directly to market signals before widespread abandonment.[33][35][36]Late 20th to Early 21st-Century Shifts and Crises
The 1970s oil crises catalyzed policy responses in Western nations, accelerating public transport investments amid fuel shortages and price spikes. The 1973 Arab oil embargo, which quadrupled global oil prices, underscored vulnerabilities in automobile-dependent economies and prompted U.S. federal legislation like the 1974 Energy Policy and Conservation Act, alongside $4.8 billion in transit operating subsidies to promote alternatives to cars.[37][38] Systems such as San Francisco's Bay Area Rapid Transit (BART), operational since September 1972, benefited from this momentum, with initial ridership boosted by crisis-induced commuting shifts away from personal vehicles.[39] Yet, these interventions often reflected top-down policy rather than organic demand, as evidenced by persistent overestimation of ridership forecasts—projects post-2000 averaged 22% below projections, with pre-2000 efforts faring worse at 52% shortfalls.[40] In the United States and Europe, decades of subsidies failed to substantially erode car dominance, with U.S. public transit capturing under 5% of work trip modal share by the 2000s despite federal outlays exceeding $100 billion cumulatively since the 1970s.[26][41] Annual subsidies by the 2010s covered 76% of operating costs, yet transit's overall market share hovered at 2-3% for all trips, signaling low returns on infrastructure amid sprawling land use and inelastic demand unresponsive to supply expansions.[28] This contrasted sharply with Asia's urban rail booms, where high-density environments drove voluntary adoption; Tokyo's network expanded significantly in the 1990s-2000s under master plans, achieving a 30% rail modal share by 2008 through integration with dense employment centers rather than equivalent subsidy levels.[42] Causal analysis reveals subsidies in low-density Western contexts primarily masked structural mismatches—such as dispersed suburbs favoring cars—rather than generating sustainable ridership, as fare recovery ratios remained below 30% in most U.S. systems.[43] Early digital tools, like computerized scheduling introduced in the 1990s, offered marginal efficiency gains but could not compensate for demand shortfalls rooted in land-use patterns prioritizing highways.[44] In Asia, expansions aligned with pre-existing transit-oriented densities, yielding higher utilization without proportional fiscal burdens, highlighting how policy-forced growth in the West diverged from demand-driven trajectories elsewhere.[45]Modes and Technologies
Road-Based Systems: Buses, Coaches, and Variants
Road-based public transport systems primarily utilize buses and coaches, which are rubber-tired vehicles designed for operation on standard roadways, enabling high route flexibility and adaptability to changing urban demands without requiring dedicated fixed infrastructure.[46] These vehicles typically carry 40 to 100 passengers depending on configuration, with articulated and bi-articulated variants increasing capacity to over 200 for high-demand corridors.[46] Globally, electric bus adoption has accelerated, with approximately 635,000 electric buses in operation as of 2023, predominantly in China where new energy public buses reached about 544,000 units by the end of 2024, comprising 82.7% of the public bus fleet.[47] [48] Key variants include trolleybuses, which draw power from overhead wires to achieve zero tailpipe emissions while maintaining bus-like flexibility, offering energy efficiency nearly three times that of diesel buses through regenerative braking and continuous charging.[49] [50] Bus Rapid Transit (BRT) systems enhance performance with dedicated lanes, off-board fare collection, and high-capacity vehicles, emulating rail benefits at lower cost; the pioneering Curitiba system, launched in 1974, demonstrated this model by integrating express services and tube stations to serve 85% of residents efficiently.[51] [52] BRT infrastructure costs are substantially lower than rail equivalents, with heavy rail potentially up to 40 times more expensive and light rail up to 12 times, due to reliance on upgraded roadways rather than new tracks.[46] Coaches extend road-based systems to intercity routes, featuring higher speeds and comfort for longer distances but sharing core operational traits with urban buses. Compared to rail, buses demand less upfront infrastructure investment but incur higher per-vehicle operating costs, including labor, as lower passenger capacities necessitate more units and drivers to match rail throughput; for instance, light rail vehicle operating costs average $233 per hour versus $122 for buses, though scaled per passenger, buses often require more staff overall.[53] Recent innovations include autonomous bus pilots, with trials in 2024 across sites like Kumamoto City, Japan, and Qianhai, China, testing driverless operations on public roads to reduce labor dependencies and enhance safety through sensor-based navigation.[54] [55] These developments prioritize empirical efficiency gains, such as lower emissions and flexible deployment, over rigid guideways.[56]Rail Systems: Urban, Inter-City, and High-Speed
Urban rail systems, encompassing subways, metros, and light rail, leverage dedicated fixed tracks to deliver high-capacity passenger service within metropolitan areas, enabling efficient movement of large volumes in high-density environments. These systems benefit from infrastructure that minimizes road conflicts, supporting consistent speeds and reliability where population justifies the investment. However, fixed routes limit flexibility, and operations are susceptible to disruptions from signaling failures, track maintenance, or overcrowding, often leading to cascading delays.[57][58] The New York City Subway exemplifies urban rail scale, transporting 1.698 billion passengers in 2019 with average weekday ridership of 5.5 million.[59] Inter-city rail connects major urban centers over medium to long distances, typically using conventional tracks shared with freight or regional services, which can constrain capacity through scheduling conflicts and varying speeds. These networks excel in corridors with sufficient demand, offering energy-efficient alternatives to air or car travel, with rail emitting far less CO2 per passenger-kilometer than road or air modes due to aerodynamic efficiency and load factors.[60][61] Yet, in low-density regions, underutilization arises from sparse origins and destinations, rendering fixed infrastructure economically inefficient without subsidies. Capacity metrics, such as train seats and headways, determine throughput; for instance, commuter rail lines prioritize peak-hour seating, achieving utilization rates tied to route length and frequency.[62] High-speed rail (HSR) extends inter-city concepts with dedicated tracks for speeds exceeding 200 km/h, prioritizing punctuality and safety through advanced signaling and earthquake-resistant designs in seismically active areas. Japan's Shinkansen, debuting on October 1, 1964, between Tokyo and Osaka, maintains exceptional on-time performance, with the Tokaido line averaging delays of just 1.6 minutes per train in recent years.[63][64] In contrast, the California HSR project illustrates risks of overruns, with costs escalating to an estimated $135 billion by 2025—over four times initial projections—amid delays and federal funding cuts of $4 billion.[65][66] Rail's fixed infrastructure confers energy advantages at scale, with urban and HSR systems consuming less fuel per passenger than automobiles or planes, particularly when electrified.[67] Drawbacks include high upfront capital for grading and electrification, vulnerability to weather in exposed alignments, and poor adaptability to shifting demand patterns without parallel roadways. As of 2025, trends favor maglev extensions for ultra-high speeds, with China's prototypes reaching 650 km/h and Japan's Chuo Shinkansen line advancing to halve Tokyo-Nagoya travel time.[68][69] These developments underscore rail's potential in dense, linear corridors but highlight causal dependencies on geographic density and political commitment for viability.[70]Water, Cable, and Other Specialized Modes
 compared to buses or light rail, limiting broad applicability without integrated multimodal hubs.[78] Other specialized fixed-route systems, such as personal rapid transit (PRT) and automated people movers, target enclosed or campus-like settings like airports, where demand predictability and security needs favor dedicated guideways over shared infrastructure. PRT deploys small, on-demand pods for point-to-point travel, as trialed at Heathrow Airport's ULTra system since 2011, shuttling passengers between terminals and parking at speeds up to 40 km/h with energy use reduced over 60% versus cars in controlled tests.[79] These excel in low-density, non-stop service—bypassing intermediate halts for efficiency—but require extensive off-board switching networks, inflating capital costs to $20-50 million per km and capping scalability; only a handful of airport implementations exist globally, with ridership in the low millions annually per site, failing to displace broader urban transit due to inflexibility in variable demand and integration hurdles.[80] Causal analysis reveals their success hinges on geographic isolation or regulatory silos, like airside perimeters, precluding widespread urban rollout where economies favor higher-capacity, adaptable modes amid fluctuating passenger flows.[81]Emerging Innovations: Autonomous Vehicles and Integration
Autonomous vehicles (AVs) are being piloted as public transport options, particularly in the form of driverless shuttles and buses, to enhance efficiency by eliminating driver costs and enabling 24/7 operations without fatigue-related errors. In Singapore, the Land Transport Authority has conducted ongoing trials, including autonomous buses at Resorts World Sentosa, with plans to integrate AVs into the public transport network starting in the fourth quarter of 2025. A BYD-led consortium secured a contract in October 2025 to trial six 16-seater autonomous buses on public routes such as services 400 and 191 from 2026, aiming to address labor shortages and improve service reliability. Studies indicate potential benefits like increased road safety through reduced human error—responsible for over 90% of accidents—and lower emissions via optimized routing, though these gains depend on high utilization rates in shared fleets.[82][83][84] Despite promising pilots, scalability faces significant hurdles, including regulatory fragmentation, infrastructure demands, and public trust issues. AV public transport systems require dedicated testing zones and updated liability frameworks, as seen in Singapore's Rule 5 applications for road trials, which mandate safety drivers initially. Economic analyses highlight high upfront costs for sensors and mapping—often exceeding $100,000 per vehicle—alongside logistical challenges like handling complex urban scenarios, where pilots show frequent interventions for pedestrians or erratic traffic. Research from 2024 emphasizes that without extended trial periods and improved sensor redundancy, full deployment remains limited, with many projects stalling post-pilot due to these barriers. Moreover, AVs lacking features like seatbelts in shuttles raise safety concerns in crashes, potentially eroding ridership.[85][86][87] Integration of AVs with existing public transport occurs through Mobility as a Service (MaaS) platforms, which use apps to combine on-demand AV shuttles, buses, and rail into seamless multimodal trips. In Helsinki, the Whim app pioneered subscription-based access to integrated services, reducing private car use by blending public transit with ridesharing, though its parent company MaaS Global filed for bankruptcy in March 2024 due to financial unviability, leading to acquisition by umob and operational halts. Broader MaaS efforts aim for real-time planning and payments, potentially hybridizing AVs with fixed-route systems for first/last-mile connectivity, but empirical models predict that widespread personal AV ownership could shift demand away from collective public modes, increasing vehicle miles traveled by 20-60% if not regulated for shared use. A 2025 Victoria Transport Policy Institute analysis underscores that AVs reserved primarily for public fleets could sustain transit viability, whereas market-driven personal adoption risks exacerbating congestion and undermining public transport's efficiency edge.[88][89][90]Operational Framework
Infrastructure and Maintenance Demands
Public transport systems demand substantial physical infrastructure tailored to their modes, with rail-based networks requiring dedicated fixed assets such as tracks, electrification systems, tunnels, elevated structures, and stations, while road-based systems like buses primarily leverage shared roadways alongside vehicle depots and terminals. Heavy rail subways, for instance, incur construction costs averaging $383 million per mile globally, though U.S. projects often exceed this, with New York City's Second Avenue Subway reaching $2.6 billion per mile due to factors including overbuilt designs and regulatory delays.[91][92] In contrast, bus rapid transit (BRT) systems, which may include dedicated lanes, cost $150-250 million per mile, but conventional buses avoid such dedicated builds by operating on existing streets, shifting infrastructure burdens to general road maintenance shared with private vehicles.[93] Maintenance of these assets forms a core operational challenge, with rail infrastructure necessitating regular inspections, track replacements, and signal upgrades to prevent failures, often comprising a significant share of budgets—vehicle and facility maintenance alone accounted for notable portions in U.S. National Transit Database reports, alongside deferred upkeep contributing to systemic vulnerabilities. In the U.S., public transit faces a repair backlog estimated at $140-176 billion as of recent assessments, linking chronic underinvestment in state-of-good-repair to incidents like rail derailments and bus fleet breakdowns from worn components.[94][95][96] Lifecycle analyses underscore the long-term burdens, as rail's high initial capital—amortized over decades—yields durable but inflexible assets prone to escalating repair needs if neglected, unlike buses with shorter 12-15 year vehicle lifespans and adaptable routing on modifiable roads. Fixed rail commitments create sunk costs that hinder responsiveness to shifting demand patterns, such as urban depopulation or remote work trends, whereas road-shared bus operations allow reallocating resources without demolishing dedicated guideways, though both modes amplify wear on underlying pavements and utilities. Empirical comparisons reveal rail's total social costs, including infrastructure investment, exceed bus equivalents in low-density contexts due to underutilized capacity post-build.[97][98][43]Scheduling, Capacity, and Intermodality
Public transport systems design timetables to balance service frequency with demand fluctuations, typically increasing vehicle dispatch rates during peak commuting periods—such as reducing bus headways from 10-15 minutes off-peak to 2-5 minutes peak—to maximize throughput while minimizing operating costs.[99] Optimization models incorporate passenger flow data to adjust for these variations, yet stochastic factors like traffic variability often cause bunching, where following vehicles catch up to leaders, resulting in irregular arrivals that inflate average wait times by up to 50% beyond scheduled headways in urban bus networks.[100] Emerging AI-based tools, deployed in systems as of 2024-2025, leverage real-time analytics for predictive scheduling and route tweaks, achieving reductions in wait times through dynamic holding or speed adjustments, though they cannot fully eradicate bunching stemming from upstream disruptions.[101][102] Intermodality relies on coordinated transfer points and feeder services to chain modes efficiently, such as park-and-ride lots enabling car-to-transit switches at urban fringes. Empirical evaluations of park-and-ride implementations indicate they can induce modal shifts from single-occupancy vehicles to public transport, with meta-analyses identifying site-specific factors like proximity to highways yielding utilization rates that expand transit's effective catchment and boost ridership by facilitating access for suburban users.[103] [104] Bike integration at transit hubs similarly supports first/last-mile connectivity, with studies on bike-sharing synergies showing expanded service areas and increased public transport usage through reduced access barriers, particularly in mid-sized cities where combined trips enhance overall system appeal over siloed modes.[105] [106] Capacity in public transport is inherently constrained by vehicle dimensions and operational frequencies, with overcrowding thresholds defined by load factors where standing density exceeds comfortable limits—often 4-6 passengers per square meter before discomfort escalates.[107] In extreme cases like Tokyo's subway during rush hours, trains routinely surpass 150-200% of rated capacity, packing passengers to levels where movement is severely restricted, a threshold private automobiles avoid through per-vehicle exclusivity and on-demand availability.[108] [109] This fixed-capacity model contrasts with cars' scalable but individualized access, underscoring public systems' vulnerability to demand spikes without proportional infrastructure expansion. Reliability comparisons highlight public transport's scheduled rigidity against private cars' flexibility; on-time performance for rail often hits 85-95% in controlled environments, but bus services lag at 70-85% due to external interferences, leading to higher variability in door-to-door times versus cars, where drivers dictate pacing absent severe congestion.[110] Data from multimodal analyses show public options averaging 1.4-2.6 times longer travel durations than equivalent car trips, amplified by wait and transfer uncertainties that fixed timetables cannot match in predictability.[111]Safety Records and Risk Management
Public transport systems demonstrate superior safety records in terms of fatalities per passenger-mile compared to private automobiles, primarily due to centralized control, dedicated infrastructure, and engineering safeguards. In the European Union, rail passenger fatalities averaged 0.019 per billion passenger-kilometers from 2010 to 2023, reflecting a 32.4% decline in total railway fatalities over that period despite rising ridership.[112][113] U.S. data similarly indicate commuter rail fatality rates below 0.2 per billion passenger-miles, far exceeding the passenger vehicle rate of approximately 5.7 deaths per billion passenger-miles in recent years.[114] Bus and coach modes align closely with rail, with EU passenger fatality risks around one-third higher than rail but still minimal at under 0.3 per billion passenger-kilometers.[115] Non-fatal risks, particularly assaults and violent crimes, elevate in dense urban transit environments owing to increased interpersonal exposure among strangers. In New York City's subway system, reported violent crimes—including misdemeanor assaults—nearly doubled from 1,445 incidents in 2014 to 2,745 in 2024, outpacing overall city trends.[116] Nationally, assaults on transit workers surged post-pandemic, with major U.S. agencies documenting heightened violence against operators and staff.[117] Such incidents occur at rates exceeding those in private vehicles, where isolation reduces opportunities for confrontation, though transit statistics benefit from systematic reporting absent in personal travel logs.[118] Risk management strategies emphasize prevention through infrastructure design, technology, and protocols. Post-9/11 federal mandates, including TSA's risk-based security for mass transit and rail, have integrated widespread surveillance, access controls, and employee training to mitigate terrorism and crime threats.[119][120] Engineering features like automatic train control and barriers further reduce collision risks, contributing to rail's empirical edge over roads; however, persistent urban density challenges necessitate ongoing adaptations, as evidenced by 2024 upticks in select U.S. systems despite these measures.[121][122]Economic Realities
Cost Structures: Capital, Operating, and User Expenses
Capital costs for public transport infrastructure represent substantial upfront investments, varying significantly by mode due to requirements for tracks, electrification, stations, and land acquisition. Urban heavy rail and subway systems in developed nations often range from $50 million to $200 million per kilometer, driven by tunneling, elevated structures, and advanced signaling systems.[123] Light rail transit (LRT) averages around $37 million per kilometer in U.S. projects, reflecting dedicated rights-of-way and vehicle procurement.[46] In comparison, bus rapid transit (BRT) incurs lower capital outlays of $1 million to $10 million per kilometer, leveraging existing roadways with dedicated lanes and basic stations.[124] High-speed rail (HSR) amplifies these fixed costs, with international benchmarks at $20 million to $40 million per kilometer for greenfield lines, but real-world projects frequently exceed this due to geological challenges and scope creep.[125] The UK's HS2 Phase 1, spanning approximately 225 kilometers from London to Birmingham, has seen costs balloon from initial estimates of £36 billion to £45-54 billion as of 2025, equating to over £200 million per kilometer amid design immaturity and construction delays.[126] [127]| Mode | Typical Capital Cost per km (USD millions) | Key Factors Influencing Variance |
|---|---|---|
| Heavy Rail/Subway | 50–200 | Tunneling, urban density, regulatory hurdles[123] |
| Light Rail | 20–40 | Trackwork, stations, electrification[46] |
| BRT | 1–10 | Busways, signals, minimal land needs[124] |
| High-Speed Rail | 20–200+ | Speed requirements, overruns, terrain[126] |
Subsidies, Revenue Models, and Fiscal Burdens
Public transport systems globally rely on substantial government subsidies to bridge the gap between operating costs and fare revenues, with fares often covering less than 50% of expenses in many jurisdictions. In the United States, for instance, fiscal year 2023 government expenditures on public transit totaled $92.4 billion across federal, state, and local levels, while passenger fares generated only $16.5 billion, leaving subsidies to fund the remainder.[131] These subsidies have escalated post-2021, bolstered by federal programs under the Bipartisan Infrastructure Law, which authorized up to $108 billion for public transportation initiatives including operating support.[132] Analyses from the Cato Institute highlight that such funding distorts comparisons with highway systems, where user fees like fuel taxes cover operating costs more fully; transit subsidies averaged $1.01 per passenger-mile in 2018, versus mere pennies for roads, countering narratives portraying automobiles as disproportionately "welfare"-dependent.[133] Revenue models for public transport vary but predominantly combine user-paid fares with non-user taxes, creating incentives misaligned with cost recovery. Farebox recovery ratios—the share of operating costs met by fares—typically range from 20% to 40% in major U.S. systems, declining from pre-2000 averages due to stagnant ridership and rising expenses.[134] Alternative streams include advertising, concessions, and dedicated levies such as sales or property taxes earmarked for transit authorities, alongside federal grants derived from general revenues.[135] In contrast to ad valorem user fees (e.g., gasoline taxes for roads), transit's reliance on broad-based taxation dilutes accountability, as operators face reduced pressure to innovate or optimize routes, perpetuating inefficiencies observed in low-recovery systems.[131] Fiscal burdens arise from these models' dependence on taxpayer funds, often exceeding fare revenues by multiples and straining public budgets amid competing priorities like education and infrastructure maintenance. U.S. transit subsidies per capita averaged over $200 annually in recent years, yet deliver lower per-rider value than highway investments, with total 2018 subsidies reaching $54.3 billion or $5.50 per unlinked trip.[136] [133] This structure fosters opportunity costs, as diverted general revenues could address underfunded alternatives, while chronic under-recovery—evident in fare revenues dropping to $10 billion in 2021 amid pandemic disruptions—amplifies debt accumulation and deferred maintenance for agencies.[6] Cato critiques underscore that equating transit's per-rider subsidies to highway "externalities" overlooks empirical disparities, where roads self-fund via users while transit imposes net fiscal drains without equivalent productivity gains.[131]| Aspect | Public Transit (U.S., 2023) | Highways (Comparative) |
|---|---|---|
| Total Spending | $92.4 billion | User fees cover ops; subsidies <1¢/passenger-mile |
| Fare/User Revenue | $16.5 billion | Fuel taxes exceed maintenance |
| Subsidy Intensity | ~$1+/passenger-mile | Minimal net subsidy |
| Source | Cato Institute analysis | [131][133] |
Efficiency Metrics and Market Distortions
Efficiency in public transport systems is quantified through metrics such as load factor, which measures the ratio of actual passengers to total available capacity (seating plus standing), and vehicle kilometers per passenger, reflecting operational productivity.[137] For urban buses, load factors typically range from 30% to 40% under standard planning assumptions, though empirical data from various systems reveal frequent deviations, particularly during non-peak periods where utilization can fall below 20%.[137] Rail systems exhibit similar patterns, with average load factors around 50% for intercity services but lower for urban routes outside rush hours, as indicated by operator reports and performance analyses.[138] These metrics highlight chronic underutilization, as vehicles and infrastructure remain deployed regardless of demand fluctuations, resulting in excess capacity costs. Market distortions in public transport stem primarily from regulatory mandates for universal coverage, compelling operators to maintain fixed routes and schedules in low-demand areas and times, even when revenues fail to cover variable costs. Economic analyses demonstrate that such obligations lead to inefficient resource allocation, with subsidies enabling persistence of services that would otherwise contract under market pricing.[139] For instance, off-peak and peripheral operations often operate at load factors insufficient to achieve break-even, yet policy requirements prioritize geographic equity over economic viability, inflating system-wide expenses.[140] Pricing rigidities, including below-cost fares subsidized by taxpayers, further distort signals, discouraging demand-responsive adjustments like variable scheduling or route consolidation. These distortions ignore the heterogeneous time values of users, enforcing uniform service levels that favor collective coordination at the expense of individual optimization, as evidenced by welfare models showing net losses from over-servicing low-density corridors. Peer-reviewed assessments recommend Ramsey-optimal pricing—higher off-peak fares to boost utilization—yet implementation lags due to political constraints, perpetuating fiscal burdens estimated at billions annually in major economies.[139][141] Consequently, productivity remains subdued, with many systems achieving only partial recovery of operating costs through fares, underscoring the tension between mandated accessibility and empirical efficiency.[10]Private Transport Comparisons
Time, Flexibility, and Productivity Trade-Offs
Public transport systems operate on predetermined routes and timetables, imposing waiting intervals of 10 to 15 minutes alongside access, egress, and transfer components that extend overall door-to-door durations.[142] Private automobiles, by enabling direct, unscheduled travel, typically halve these times in practice; nationwide U.S. data from 2017 reveal average transit commutes at 51 minutes versus 29 minutes for solo drivers.[143] In suburban contexts with dispersed origins and destinations, this gap intensifies, as transit deviations and infrequent service yield travel times 1.4 to 2.6 times longer than equivalent car trips.[111] Such rigidity curtails adaptability to variable schedules or ad hoc needs, contrasting sharply with cars' capacity for immediate, point-to-point journeys that align with users' timelines.[144] This flexibility proves causal in expanding job access within sprawling metropolitan forms, where employment centers scatter beyond efficient transit corridors; vehicle ownership raises employment likelihood by enabling broader spatial reach, doubling probabilities for single mothers and markedly aiding welfare recipients.[145] [146] The resultant time burdens erode productivity, with longer commutes empirically linked to diminished work engagement, elevated absenteeism (a 1% daily increase associating with 0.018-0.027% more sick days annually), and foregone hours for professional or personal output.[147] Car-dependent regions, by facilitating autonomous navigation across expansive economies, exhibit GDP per capita growth tied to rising vehicle ownership up to approximately $50,000 thresholds, reflecting enhanced labor participation and efficiency gains from individualized control over mobility.[148]Safety and Accident Statistics
Public transit modes demonstrate substantially lower fatality rates per passenger-mile than private automobiles. In the United States, data from 2000–2009 indicate passenger fatality rates of 0.11 per billion passenger-miles for buses, 0.24 for transit rail (including subways), and 0.43 for mainline passenger rail, compared to 7.28 for passenger cars.[149] These figures align with broader trends from the National Safety Council, which report passenger vehicle death rates per 100 million passenger-miles over the past decade as more than 60 times higher than for buses and 20 times higher than for passenger trains.[114] Highway fatality rates from the National Highway Traffic Safety Administration (NHTSA) further contextualize automobile risks at 1.26 fatalities per 100 million vehicle-miles traveled in 2023, which, adjusted for average occupancy, yields comparable per-passenger-mile disparities.[150]| Mode | Fatalities per Billion Passenger-Miles (US, 2000–2009) |
|---|---|
| Buses | 0.11 |
| Transit Rail | 0.24 |
| Mainline Rail | 0.43 |
| Passenger Cars | 7.28 |
Overall Societal Cost-Benefit Analyses
Empirical cost-benefit analyses of public transport systems demonstrate substantial contextual dependence, with positive outcomes predominantly in ultra-dense urban cores where ridership densities support farebox recovery and ancillary revenues exceeding infrastructure demands. The Hong Kong MTR exemplifies this, operating as a for-profit entity that generated HK$15.8 billion in net profit for 2024 through integrated rail fares and property developments adjacent to stations, enabling self-financing of expansions without net taxpayer subsidies.[157][158] This rail-plus-property model captures value uplift from transit proximity, yielding benefit-cost ratios above 1 by internalizing development gains that offset capital outlays averaging HK$1-2 billion per kilometer for new lines. In contrast, low-density sprawling environments like those prevalent in the United States often register negative or marginal net societal benefits, with aggregate benefit-cost ratios for urban transit systems estimated at 1.34 under medium assumptions, though only 23 of 88 major urbanized areas exceed parity when accounting for congestion relief, time savings, and operating efficiencies.[159] Public funding burdens are acute, as total expenditures reached $92.4 billion across government levels in fiscal year 2023 against $16.5 billion in fare revenues, equating to farebox recovery rates below 20% and implying subsidy ratios where operating costs per passenger trip vastly outpace private vehicle user fees.[131] These disparities arise from mismatched scale, where fixed costs for underutilized capacity in dispersed populations erode gains from mode shifts, frequently resulting in net fiscal drains absent density thresholds of 10,000-20,000 residents per square kilometer.[160] Adjusting for induced demand—where transit expansions generate supplemental trips via enabled accessibility rather than pure substitution—further tempers purported congestion benefits, as empirical models indicate 20-60% of capacity additions manifest as new demand over time, diluting per-trip efficiencies.[161] International Transport Forum evaluations underscore this, advocating refined appraisal methods that integrate dynamic land-use feedbacks and alternatives such as telecommuting, which reduced U.S. transit ridership by 15-20% post-2020 independently of service levels, exposing overreliance on static commuting assumptions in many analyses.[162] Pro-transit cost-benefit studies frequently exhibit selection bias, as projects with inflated benefit forecasts (optimism bias factors of 20-50% in traffic and revenue projections) disproportionately advance past approval hurdles, while viable low-cost options like bus rapid transit or demand-responsive services in peripheral areas are sidelined, skewing aggregates toward apparent justification.[163][164]Environmental Scrutiny
Direct Emissions and Energy Consumption
Direct emissions from public transport operations primarily arise from on-vehicle fuel combustion, measured in kilograms of CO2 equivalent per passenger-kilometer (kg CO2e/pkm). For diesel buses operating at average load factors of 20-50%, emissions range from 0.10 to 0.20 kg CO2e/pkm, reflecting efficiencies from high vehicle occupancy that offset per-vehicle fuel use of around 0.3-0.5 liters per kilometer.[165] [166] In comparison, average passenger cars emit 0.20-0.30 kg CO2e/pkm, accounting for typical occupancy of 1.5-1.6 persons and gasoline/diesel efficiency of 7-10 liters per 100 km.[165] [166] Diesel rail variants, such as regional trains, produce comparable levels of 0.10-0.25 kg CO2e/pkm at load factors exceeding 50%, though electrified rail achieves near-zero direct tailpipe emissions by shifting combustion upstream to power plants.[67] [166] Energy consumption in public transport underscores these emission profiles, with diesel modes requiring 1.5-2.5 megajoule per passenger-kilometer (MJ/pkm) under loaded conditions, versus cars' 2.0-3.0 MJ/pkm.[167] Electrified systems, including metro and commuter rail, consume 0.5-1.5 MJ/pkm electrically, but total emissions hinge on grid carbon intensity—ranging from under 0.02 kg CO2e/pkm in low-carbon grids like hydroelectric-heavy Norway to over 0.15 kg in coal-dominant regions such as parts of India or Poland.[67] In the European Union, where trolleybus networks expanded in 2024 with manufacturers like Solaris and Hess deploying zero-tailpipe models, average grid emissions of approximately 0.20-0.25 kg CO2e per kWh yield operational advantages over diesel equivalents, though gains diminish in fossil-reliant national mixes.[50] [67] Globally, the transport sector accounted for 24% of energy-related CO2 emissions in recent years, totaling nearly 8 Gt CO2 in 2022, yet public transport's contribution remains small—often under 10% of sectoral emissions—due to modal shares below 20% in most urban areas, with cars dominating at 40-60%.[168] [169] This limited footprint persists despite efficiency claims, as low ridership densities in sprawling or car-oriented cities elevate per-passenger metrics closer to private vehicle benchmarks.[167]Lifecycle Assessments Including Infrastructure
Lifecycle assessments of public transport infrastructure evaluate greenhouse gas emissions across the full cycle, including raw material extraction, manufacturing of components like steel and concrete, construction activities, ongoing maintenance, and eventual decommissioning or renewal. These embodied emissions often reveal substantial upfront carbon debts that are amortized over decades, contrasting with operational emissions focused on fuel or electricity use. For rail systems, infrastructure accounts for a significant share of total lifecycle emissions, with embodied carbon from materials and construction typically ranging from 20% to 50% depending on project scale, material choices, and expected service life.[170] [171] In subway and urban rail projects, the construction phase dominates embodied emissions, where upstream material production (e.g., cement for tunnels and steel for tracks) and on-site excavation contribute over 95% of tunnel-related GHG outputs.[172] Global expansion of subway networks has accumulated substantial embodied emissions, with material stocks in infrastructure driving hundreds of millions of tonnes of CO2-equivalent since the 1980s, often equivalent to 5-15 years of operational emissions for a typical line before offsets begin.[173] These initial burdens arise from energy-intensive processes like steel smelting and concrete curing, which release CO2 during production, and are exacerbated in geotechnically challenging urban environments requiring extensive piling and reinforcement. High-density concrete usage in stations and viaducts further elevates impacts, as cement production alone accounts for 8% of global anthropogenic CO2.[174] Bus infrastructure, including dedicated lanes, stops, and shared roadways, incurs lower per-km embodied emissions than rail but accumulates through periodic renewals like asphalt resurfacing and steel signage replacement, adding 15-30% to system-wide lifecycle totals in maintenance-heavy scenarios.[175] Road infrastructure maintenance emissions, such as from asphalt production (derived from petroleum refining), amplify indirect costs, with each kilogram of construction-related GHG potentially linked to 20-30 kg of downstream fuel consumption emissions via induced vehicle travel.[175] For electric bus fleets, battery production introduces additional upstream impacts; lithium-ion battery manufacturing emits 50-100 kg CO2-eq per kWh of capacity, driven by mining and refining of cobalt, nickel, and lithium, which involve habitat disruption and water-intensive extraction processes risking contamination in arid regions.[176] [177] Studies from 2023-2025 indicate these supply chain emissions can comprise 30-50% of an EV bus's vehicle lifecycle GHG, particularly where grid electricity for assembly remains fossil-dependent.[178] [179] Rail's structural longevity—tracks and tunnels lasting 50-100 years—can offset embodied emissions in high-utilization corridors with load factors above 50 passengers per vehicle-km, as per analogs in IPCC assessments of transport mitigation pathways, where low-occupancy scenarios fail to recoup upfront investments within plausible timelines.[180] Bus systems, with shorter asset lives (e.g., 10-20 years for pavements), show less amortization potential unless paired with dedicated, low-maintenance busways, though shared road use complicates attribution. Overall, full-cycle analyses underscore that infrastructure emissions favor durable modes only under sustained high demand; otherwise, they impose persistent carbon penalties relative to less capital-intensive alternatives.[181][182]Myths vs. Empirical Outcomes in Emission Reductions
A common misconception holds that public transport inherently achieves superior emission reductions compared to private vehicles, disregarding operational realities such as average passenger loads. In practice, urban buses frequently operate at load factors below 20%, resulting in higher CO2-equivalent emissions per passenger-kilometer than a single-occupancy gasoline car; for example, a diesel bus at 10% occupancy emits around 170 grams CO2e per passenger-kilometer, surpassing the 120 grams for a solo driver.[166] [165] Even intercity coaches, assuming 35% occupancy, average 30 grams CO2 per passenger-kilometer, but city routes with sporadic ridership often exceed solo car benchmarks when deadheading or off-peak operations are factored in.[183] Lifecycle analyses of electrified transit reveal conditional benefits, with electric buses reducing greenhouse gas emissions by 33-65% relative to diesel equivalents in the United States, contingent on grid decarbonization progress.[184] These gains—potentially up to 50% lower than internal combustion counterparts in cleaner grids—diminish in fossil-fuel-heavy regions, where battery production and upstream electricity generation erode advantages; for instance, medium-duty electric vehicles show lifecycle CO2 emissions 18-87% below conventional ones depending on regional energy mixes.[185] U.S. empirical data underscores limited systemic impact: public transit CO2 emissions fell 12.8% from 2008 to 2018 amid a 7.1% rise in vehicle-miles traveled, yielding marginal per-passenger declines despite federal subsidies exceeding $100 billion annually for transit capital projects.[186] [187] Rebound effects further temper projected outcomes, as transit expansions induce additional travel by attracting new users or enabling longer trips, offsetting 10-30% of efficiency-driven savings through heightened overall mobility.[188] Aggregate studies of road and public transport interventions estimate that secondary demand responses—such as reduced walking/cycling substitution or sprawl facilitation—can negate 20-50% of anticipated emission cuts, rendering net reductions closer to those from hybrid vehicle adoption than wholesale modal shifts.[189] [190] Thus, while densely utilized systems deliver verifiable decarbonization, low-ridership scenarios and behavioral feedbacks reveal that empirical emission trajectories often fall short of policy rhetoric, prioritizing targeted high-load applications over universal mandates.[191]Societal and Urban Consequences
Accessibility for Diverse Populations
Public transit systems primarily serve low-income individuals concentrated in urban areas, where ridership demographics reveal a skew toward households earning below the national median income. In the United States, for instance, approximately 60% of bus riders in smaller Midwestern cities reside in households with annual incomes under $25,000, highlighting the system's role in supporting economically disadvantaged urban commuters who lack access to personal vehicles.[192] This pattern holds nationally, as public transit usage correlates strongly with lower socioeconomic status, with commuters from the lowest income quintiles comprising a disproportionate share of trips despite overall low mode share—around 5% of U.S. work trips in 2022.[193] However, public transit's accessibility excludes significant portions of the population, particularly those in rural and suburban areas where service coverage is sparse or nonexistent. Only 0.4% of rural U.S. residents rely on public transportation for work commutes, compared to 4.3% in urban settings, leaving non-urban low-income households dependent on automobiles or informal alternatives despite facing similar economic constraints.[194] This geographic limitation underscores a core inequity: transit investments, often justified on equity grounds, fail to reach sprawled or remote communities, effectively bypassing a substantial demographic of potential beneficiaries who contribute to funding through general taxes. Subsidies for public transit, which in the U.S. exceed $80 billion annually from federal, state, and local sources, frequently display regressive distributional effects, as benefits concentrate in dense urban cores while costs diffuse across broader taxpayer bases including rural and middle-income suburbs. Analyses indicate that supply-side subsidies—directed to operators—tend to be neutral or regressive, with higher-income users benefiting from longer-distance travel and expanded services that low-utilization rates amplify per-rider costs.[195] [196] For elderly and disabled populations, empirical barriers persist despite mandates like the Americans with Disabilities Act, including inflexible schedules that conflict with medical needs, incomplete infrastructure retrofits, and reliability issues that deter usage. People with disabilities are twice as likely to report inadequate transportation options, with 560,000 never leaving home due to mobility limitations, and older non-drivers using transit at rates below 27% even in accessible urban environments.[197] [198] Fixed-route systems' rigidity contrasts with the door-to-door flexibility of private vehicles, amplifying exclusion for these groups where empirical travel data shows reliance on family or paratransit over mainstream services.[199]Crime, Health, and Quality-of-Life Effects
Public transit systems exhibit elevated risks of violent crime compared to private automobiles, where passengers remain isolated from unrelated individuals, minimizing interpersonal assaults and thefts. In 2023, transit riders in the United States faced victimization rates approximately three times higher than the general population, with assaults and robberies concentrated in confined, high-density environments that facilitate offender access to victims—conditions absent in personal vehicles.[200] Enhanced public transport accessibility has been empirically linked to increased violent crime probabilities, with a halving of relative travel time via transit versus cars correlating to a 36% rise in violent incidents, as offenders exploit efficient mobility to reach targets.[201] While some systems reported declines, such as San Francisco's BART seeing overall crime drop 17% and violent crime fall 11% in 2024 relative to 2023, absolute incidents like aggravated assaults persisted at levels exceeding pre-2019 baselines in certain categories, underscoring ongoing vulnerabilities tied to passenger density.[202][203] Health impacts from public transit include heightened exposure to airborne pollutants and pathogens due to shared indoor spaces and proximity to traffic emissions. Studies indicate that bus and train commuters encounter elevated particulate matter (PM) and nitrogen dioxide (NO₂) levels compared to private car users with controlled ventilation, as vehicles like buses operate in exhaust plumes without equivalent cabin filtration.[204][205] During the COVID-19 pandemic, land public transport emerged as a high-transmission setting owing to crowding, prolonged exposure times, and suboptimal ventilation, with epidemiological models confirming elevated infection risks in enclosed, high-occupancy vehicles absent in isolated car travel.[206] Sedentary waiting periods at stops or stations further contribute to inactivity, contrasting with the controlled mobility of driving, though walking to access points offers incidental exercise offset by overall exposure hazards.[207] Quality-of-life effects manifest in reduced user satisfaction and elevated stress from inherent unreliability and delays, which impose psychological burdens not typical of private driving. Surveys reveal public transport commuters report the lowest commute satisfaction among modes, with dissatisfaction intensifying under crowded conditions and schedule variability that engender uncertainty and frustration.[208] Delays and unpredictability correlate with heightened stress responses, as users endure involuntary waits and interpersonal strains in shared spaces, leading to "dislike" rates for transit commutes exceeding those for automobiles by factors tied to operational inconsistencies.[209][210] Empirical assessments attribute these outcomes to the mode's dependence on external factors like traffic externalities and maintenance failures, fostering a sense of diminished control compared to the autonomy of personal vehicles.[211]Influence on Urban Planning and Individual Freedom
Public transport systems, particularly rail and bus rapid transit, have profoundly shaped urban planning by incentivizing transit-oriented development (TOD), which clusters high-density housing and commercial spaces around fixed transit nodes to maximize ridership. However, empirical comparisons reveal that such densification often exacerbates housing scarcity and costs rather than alleviating them. In San Francisco, a city with extensive public transit infrastructure including BART and Muni, the value-to-income ratio for median home prices exceeded 7.5 by 2019, reflecting severe affordability challenges driven by regulatory constraints and land-use policies favoring density over sprawl.[212] In contrast, Houston, which relies predominantly on automobiles with minimal fixed-route transit emphasis, maintained lower housing costs and faster development timelines, with construction costs per square foot roughly one-third those in the Bay Area as of 2025.[213] This disparity underscores how TOD's push for vertical growth, while aiming to reduce car dependency, correlates with prolonged permitting processes—up to two years longer in California—and elevated per-unit fees averaging $31,000 in market-rate projects, limiting supply and voluntary housing options.[214] The fixed-route nature of public transport inherently constrains individual freedom by dictating travel paths, schedules, and destinations, reducing the capacity for spontaneous or customized mobility compared to personal vehicles. Studies indicate that public transit travel times average 1.4 to 2.6 times longer than car trips for equivalent distances, factoring in wait times and transfers that rigid routes impose.[111] In transit-dominant regimes, such as European cities with high rail usage, overall personal mobility metrics—measured by trip frequency and access to employment—lag behind car-centric U.S. suburbs, where 72% of commuters opt for vehicles precisely for their door-to-door flexibility.[215] Automobile access demonstrably enhances labor market outcomes, enabling broader job searches and family logistics, whereas fixed transit schedules limit these choices, particularly for non-standard work hours or errands.[216] Voluntary urban sprawl, facilitated by car ownership, supports greater individual autonomy and family-oriented lifestyles, with data linking low-density suburban environments to elevated life satisfaction. Residents in lower-density areas report higher neighborhood happiness, attributed to reduced noise, crime, and congestion inherent in dispersed layouts that public transit planning discourages.[217] Suburban living correlates with psychological well-being benefits, including lower stress from overcrowding and more space for child-rearing, contrasting high-density urban cores where transit reliance amplifies proximity-induced tensions.[218] These patterns reflect causal preferences for sprawl's opt-in benefits over coerced densification, as evidenced by persistent migration to exurban zones despite policy incentives for transit hubs.[219]Recent Developments
Post-Pandemic Recovery and Ridership Trends
Public transport systems worldwide experienced sharp ridership declines during the COVID-19 pandemic, with global averages dropping approximately 50% in 2020 relative to 2019 due to lockdowns, social distancing mandates, and reduced mobility.[220] In the United States, annual ridership fell by about 40%, though monthly lows reached 70-80% below pre-pandemic baselines in spring 2020, particularly affecting rail and bus services reliant on dense urban commuting.[221][222] Recovery has been uneven and incomplete through 2025. U.S. public transit recorded 7.7 billion unlinked trips in 2024, marking a 7% year-over-year increase from 2023 but remaining roughly 23% below 2019 levels.[223][224] By early 2025, national ridership approached 85% of pre-pandemic volumes, with bus services outperforming rail modes in rebound rates—local buses at about 80% recovery versus under 70% for heavy rail.[225][221] Persistent structural shifts explain the sluggish rebound. The entrenchment of remote and hybrid work models has eroded traditional peak-hour commutes, reducing demand on lines feeding urban cores, where office vacancy rates remain elevated and recovery lags suburban feeders by 10-15 percentage points in many metros.[222][226] Beyond temporary restrictions, behavioral changes rooted in hygiene fears and aversion to shared enclosed spaces have durably favored private automobiles and ridesharing over collective modes, with surveys indicating sustained reluctance to ride with strangers even post-vaccination peaks.[227][228] This modal shift, amplified by expanded personal vehicle use among former transit users, suggests that pre-2020 ridership baselines may prove unattainable without reversing these preferences, challenging assumptions of automatic post-crisis normalization.[229][230]Technological Adoptions: Electrification and AI
Electrification of public transport fleets has accelerated in recent years, with several European cities committing to phase out fossil fuel buses by 2025. For instance, more than 40 major cities, including Paris and Copenhagen, pledged to procure only zero-emission buses starting in 2025, driven by local climate targets and EU funding incentives. [231] [232] This shift aligns with broader market dynamics, where the global electric bus sector is forecasted to expand from USD 49.81 billion in 2023 to USD 110.44 billion by 2030, reflecting a compound annual growth rate (CAGR) of 12.1%. [233] Battery electric and hybrid models dominate new procurements, particularly in urban settings, though adoption varies by region due to infrastructure readiness. Parallel advancements in artificial intelligence (AI) are enhancing operational efficiency through predictive analytics and dynamic routing. Operators like Keolis have deployed AI systems to forecast ridership by correlating passenger data with variables such as weather conditions, enabling real-time adjustments to service levels. [234] [235] In 2025 trends, AI-driven demand forecasting and route optimization are projected to yield efficiency gains of 10-20% in fuel use and scheduling, based on analyses of traffic pattern predictions and resource allocation. [236] These tools process vast datasets from sensors and historical records to minimize delays and underutilization, with early implementations showing reduced idle times in bus and rail networks. Despite these integrations, practical constraints temper expectations for seamless scalability. Electric bus deployments face battery degradation in extreme temperatures and limited onboard capacity per passenger-kilometer compared to lighter vehicles, as highlighted in operational evaluations. [237] [238] Grid integration poses additional challenges, with rapid charging demands straining local electricity networks absent upgrades, per International Energy Agency assessments on electric vehicle infrastructure needs. [239] AI applications, while promising, require high-quality data inputs to avoid forecasting errors exacerbated by irregular post-2024 ridership patterns, underscoring the need for robust validation over hyped projections from vendor reports.Policy Shifts and Global Market Growth
The Infrastructure Investment and Jobs Act (IIJA), enacted on November 15, 2021, authorized $106.1 billion for the Federal Transit Administration to support public transit capital investments, operations, and state of good repair projects through fiscal year 2026.[240] This legislation represents a significant policy shift toward increased federal funding for transit infrastructure, prioritizing modernization and expansion amid calls for reduced emissions, though it relies on centralized allocation rather than direct responsiveness to regional ridership patterns.[241] In Asia, recent policy emphases have spurred rail network resurgences, particularly in Southeast Asia, where governments are developing integrated high-speed and freight rail systems to handle urbanization-driven demand and alleviate highway congestion.[242] Countries like China and India have accelerated high-speed rail construction, with China's network exceeding 40,000 kilometers by 2023 and ongoing expansions projected to enhance connectivity across dense population centers.[243] These initiatives reflect market-responsive strategies in high-density contexts, contrasting with subsidy-heavy models elsewhere by aligning infrastructure with empirical passenger growth forecasts of over 50% in domestic transport kilometers by 2030.[243] Global public transportation market projections indicate steady expansion, valued at $214.54 billion in 2022 and expected to reach $374.15 billion by 2030 at a compound annual growth rate of 7.2%, fueled primarily by Asia-Pacific urbanization and economic development rather than uniform policy mandates.[244] Optimism persists regarding autonomous vehicle integration into transit fleets, with studies forecasting potential reductions in operational costs and waiting times through shared AV shuttles complementing fixed routes, particularly in urban settings where demand density supports viability.[89] However, such advancements hinge on technological maturation and user adoption, underscoring a preference for demand-led innovations over purely regulatory-driven scaling.[245]Criticisms and Debates
Inherent Inefficiencies and Low Utilization Rates
Public transport systems exhibit inherent inefficiencies due to persistently low utilization rates, where vehicles operate well below designed capacity for much of the day. Load factors, defined as the ratio of passengers carried to available capacity, frequently fall below 20% during off-peak hours in urban settings, as dispersion of destinations reduces average occupancy despite scheduled services.[246] This underutilization persists across modes, with buses and rail averaging occupancy rates that fail to cover operational thresholds efficiently outside peak commuting windows, trapping capital in idle assets.[247] These low rates amplify per-passenger costs because public transport relies heavily on fixed expenses, such as infrastructure maintenance, fleet depreciation, and scheduled operations, which remain constant regardless of ridership fluctuations. In contrast, private automobiles align costs more closely with usage through variable elements like fuel and tolls, enabling scalable deployment without committed empty runs.[248] Fixed-cost structures in transit necessitate continuous service to maintain network reliability, yet empirical metrics show operating expenses per vehicle revenue mile rising 19.6% in U.S. systems from prior baselines, underscoring resource misallocation from suboptimal loads.[249] Operational waste is further evidenced by internal mismanagement in agencies, independent of funding models, as seen in U.S. examples of fraud eroding efficiency. The Chicago Transit Authority disbursed over $1 million from 2020 to 2025 for remote work by operations staff that watchdog audits deemed uncompleted, diverting resources from core service delivery.[250] Similarly, Washington Metropolitan Area Transit Authority train operators faced arrests in a 2025 healthcare fraud scheme, highlighting accountability gaps that compound low-utilization strains by inflating administrative overhead.[251] Such incidents, documented in inspector general reports, reveal systemic vulnerabilities in resource stewardship, where fixed commitments exacerbate the economic drag of underused capacity.[252]Government Overreach and Forced Adoption Policies
Government policies imposing financial penalties on private vehicle use, such as emission zones and congestion charges, aim to compel adoption of public transport but have drawn criticism for constituting overreach by curtailing individual mobility choices and suppressing market-driven transport preferences.[253] These interventions often prioritize environmental targets over empirical assessments of user behavior, leading to unintended consequences like widespread evasion and public resistance rather than voluntary shifts.[254] The expansion of London's Ultra Low Emission Zone (ULEZ) on August 29, 2023, to cover all boroughs imposed a £12.50 daily charge on non-compliant vehicles, sparking immediate backlash including mass protests and the formation of vigilante groups like the "Blade Runners," who damaged over 2,000 enforcement cameras in acts of sabotage.[255] Political fallout was evident in the July 2023 Uxbridge by-election, where Conservative candidate Steve Tuckwell won on an explicitly anti-ULEZ platform, overturning a Labour majority amid voter anger over the policy's impact on outer London drivers dependent on older vehicles for commuting.[253] Evasion emerged as a direct response, with authorities estimating up to one in 15 motorists using fake or "ghost" number plates to dodge charges, fueling a black market for cloned and doctored plates sold online for as little as £10; persistent non-payment accounted for nearly all fines issued by September 2025.[256][257][258] Similar dynamics unfolded with New York City's congestion pricing program, which planned a $15 toll for vehicles entering Manhattan south of 60th Street to fund transit upgrades but encountered fierce opposition as an example of state-imposed coercion.[259] Governor Kathy Hochul halted implementation in June 2024 citing potential economic harm to middle-class commuters and businesses, a decision that itself provoked lawsuits alleging executive overreach in blocking a federally approved plan.[260][261] The incoming Trump administration escalated criticism in February 2025, threatening to withhold federal transit funds unless the tolls were terminated, framing the policy as punitive taxation that ignored drivers' rights and failed to address underlying congestion causes like inadequate road capacity.[262][263] Critics contend these mandates distort market signals, where consumer demand for flexible private transport outpaces rigid public options, and advocate deregulation to empower private operators, whose historical performance demonstrates superior responsiveness. In Japan, the 1987 privatization of Japanese National Railways into seven for-profit companies spurred efficiency gains, with operators achieving profitability through integrated real estate and transport models, contrasting state-run systems' chronic subsidies elsewhere.[264][265] The 2002 bus deregulation further allowed market entry, fostering competition that improved service viability in urban areas without forced penalties.[266] Such approaches avoid backlash by aligning provision with actual ridership incentives, underscoring how coercive policies provoke resistance and evasion instead of sustainable adoption.[267]Equity Claims vs. Actual Beneficiary Profiles
Public transport systems are frequently justified on equity grounds, with advocates claiming they disproportionately benefit low-income and marginalized populations by providing affordable mobility options. However, empirical data on rider demographics reveals a more nuanced picture: in the United States, transit users are often lower-income and from minority groups, yet the funding model relies on broad-based taxpayer contributions that include non-users, creating cross-subsidies from suburban and rural residents who derive minimal direct benefit. For instance, in Washington, DC, 81% of bus riders are people of color and 46% have low incomes, while national funding sources comprise 21% federal, 25% local, and 26% state contributions, drawn from general revenues rather than user fees alone.[268][269] This structure implies a regressive transfer in practice, as operating costs exceed fare revenues by wide margins, with public transit subsidies covering the shortfall through taxes paid by all demographics, including those without access to viable service. Analyses indicate that U.S. public transit and intercity rail receive heavy operational subsidies, far outpacing cost recovery from riders, effectively shifting burdens to non-beneficiaries who may rely on personal vehicles or face inadequate alternatives. In contrast to pro-poor rhetoric, such subsidies support urban networks primarily utilized by commuters in dense areas, distorting resource allocation away from potentially more targeted aid like direct income support or rural infrastructure.[131] In Asian contexts, equity claims face additional scrutiny, as public transport usage spans broader income strata, with middle-class commuters often comprising a dominant share of ridership in high-density cities. China's urban networks serve 90% of city dwellers across classes, driven by population density that sustains high utilization but also means subsidies prop up systems benefiting working professionals rather than solely the poor. Economic studies highlight that while low-income groups may depend on informal or basic services, formalized transit in megacities like those in ASEAN draws heavily from middle-income users, questioning the universality of "pro-poor" framing when cross-subsidies from national or regional taxes fund expansions favoring urban hubs.[270][271] Critics argue this mismatch undermines causal efficiency, as universal subsidies incentivize overinvestment in fixed infrastructure for intermittent low-income demand while neglecting user-pays principles that could better align costs with benefits. Peer-reviewed assessments of subsidy distributions, such as in European analogs applicable to similar dynamics, show average rates around 44% but with disproportionate support for certain trips, often amplifying inequities when payers include non-urban taxpayers disconnected from the service. Overall, while transit aids specific vulnerable riders, the payer-rider disconnect per economic realism reveals systemic cross-subsidies that privilege urban beneficiaries over equitable, needs-based alternatives.[195][131]References
- https://www.[jstor](/page/JSTOR).org/stable/2119941