Recent from talks
Nothing was collected or created yet.
Water industry
View on WikipediaThis article needs additional citations for verification. (August 2011) |

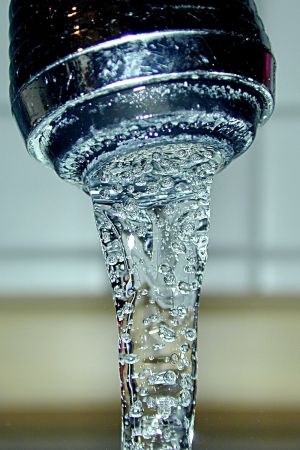
The water industry provides drinking water[1] and wastewater services (including sewage treatment) to residential, commercial, and industrial sectors of the economy. Typically public utilities operate water supply networks. The water industry does not include manufacturers and suppliers of bottled water, which is part of the beverage production and belongs to the food sector.
The water industry includes water engineering, operations, water and wastewater plant construction, equipment supply and specialist water treatment chemicals, among others.
The water industry is at the service of other industries, e.g. of the food sector which produces beverages such as bottled water.[2]
Organizational structure
[edit]There are a variety of organizational structures for the water industry, with countries usually having one dominant traditional structure, which usually changes only gradually over time.[3]
Ownership of water infrastructure and operations
[edit]- local government - the most usual structure worldwide, public utility
- national government - in many developing countries, especially smaller ones
- private ownership - more common in the developed world, see for example Water privatisation in England and Wales
- co-operative ownership and related NGO structures, public utility
Operations
[edit]- local government operating the system through a municipal department, municipal company, or inter-municipal company
- local government outsources operations to private sector, i.e. private water operators
- national government operations
- private water operators own the system
- BOTs - private sector building parts of a water system (such as a wastewater treatment plant) and operating it for an agreed period before transferring to public sector ownership and operation.
- cooperation and NGO operators
Functions
[edit]- Integrated water system (water supply, sewerage (sanitation) system, and wastewater treatment)
- Separation by function (e.g. Dutch system where sewerage run by city, water supply by municipal or provincial companies, and water treatment by water boards), though some Water Supply Companies have merged beyond municipal or provincial borders.
- Other separation (e.g. Munich, separated into three companies for bulk water supply, water and wastewater network operations, and retail)
Standards
[edit]Water quality standards and environmental standards relating to wastewater are usually set by national bodies.
- In England, the Drinking Water Inspectorate and the Environment Agency.
- In the United States, drinking water standards for public water systems are set by the United States Environmental Protection Agency (EPA) pursuant to the Safe Drinking Water Act.[4] EPA issues water pollution control standards in conjunction with state environmental agencies, pursuant to the Clean Water Act.[5]
- For countries within the European Union, water-related European Union directives are important for water resource management and environmental and water quality standards. Key directives include the Urban Waste Water Treatment Directive 1992 requiring most towns and cities to treat their wastewater to specified standards, and the Water Framework Directive 2000, which requires water resource plans based on river basins, including public participation based on Aarhus Convention principles.[6]
- International Standards (ISO) on water service management and assessment are under preparation within Technical Committee ISO/TC 224.
Global companies
[edit]Using available data only, and during 2009 - 2010, the ten largest water companies active globally were (largest first):[7] Veolia Environnement (France), Suez Environnement (France), ITT Corporation (US), United Utilities (UK), Severn Trent (UK), Thames Water (UK), American Water Works Company (US), GE Water (US), Kurita Water Industries (Japan), Nalco Water (US).
See also
[edit]- American Water Works Association - North American industry and standards association for drinking water
- Imagine H2O - International accelerator and organization for water technology startups
- Millennium Development Goals - goal 7 of the MDGs aimed to "reduce by half the proportion of people without sustainable access to safe drinking water"
- National Rural Water Association - Industry association supporting small and rural water and wastewater utilities in the United States.
- Water Environment Federation - Professional association for ambient water quality research and pollution control
References
[edit]- ^ "Information about Public Water Systems". 21 September 2015.
- ^ "About Bottled Water Safety".
- ^ "Characteristics of well - performing public water utilities" (PDF). ppp.worldbank.org.
- ^ United States. Safe Drinking Water Act. Pub. L. 93–523; 88 Stat. 1660; 42 U.S.C. § 300f et seq. Approved 1974-12-16.
- ^ United States. Federal Water Pollution Control Act Amendments of 1972. Pub. L. 92–500 Approved 1972-10-18.
- ^ "Archived copy" (PDF). Archived from the original (PDF) on 2005-04-08. Retrieved 2004-12-29.
{{cite web}}: CS1 maint: archived copy as title (link) Watertime - the international context. Section 2 - ^ "World's 10 Largest Water Companies". etcgroup.org ETC Group. 2012-01-18. Archived from the original on 6 June 2021. Retrieved 6 June 2021.
External links
[edit]- Truth from the Tap "Water Industry Facts" Water Industry Facts - Truth from the Tap Archived 2020-11-01 at the Wayback Machine
- Lowi, Alvin Jr. Avoiding the Grid: Technology and the Decentralization of Water
- WaterWorld Magazine (see Water & Wastewater Industry Report e-newsletter)
- Global Water Intelligence
- Industrial WaterWorld[permanent dead link]
- Water & Wastewater International[permanent dead link]
- Water Procurement Portal
- National Association of Clean Water Agencies
- Industrial Doctorate Centre for the Water Sector
- "Water Industry Journal".
Water industry
View on GrokipediaOverview and Definition
Scope and Key Components
The water industry comprises the infrastructure, operations, and services involved in providing potable water for human consumption and managing wastewater to protect public health and the environment. It primarily includes the extraction, purification, and distribution of freshwater, alongside the collection, treatment, and disposal or reuse of wastewater generated by households, industries, and agriculture. These activities form an integrated system essential for sanitation and resource management, often delivered by utilities under regulatory oversight.[10][11] Core components of the water supply subsystem consist of sourcing raw water, treatment to meet quality standards, and distribution through networks to end-users. Sourcing involves intake from surface water bodies like rivers and reservoirs or groundwater via wells, accounting for the initial acquisition phase where quality and quantity are assessed.[12][13] Treatment processes remove contaminants through methods such as coagulation, sedimentation, filtration, and disinfection, typically with chlorine or ultraviolet light, to render water safe for drinking.[13] Distribution relies on pressurized pipelines, pumping stations, storage tanks, and valves to deliver treated water efficiently, minimizing losses from leaks estimated at 20-30% globally in aging systems.[14][15] The wastewater management subsystem features collection via sewer networks, treatment at facilities, and effluent discharge or reclamation. Collection systems transport sewage through gravity-fed or pumped sewers to centralized plants, preventing untreated discharge into waterways.[16] Treatment occurs in stages: primary for solids separation, secondary via biological processes to degrade organics, and tertiary for advanced nutrient removal or disinfection before release.[17] Sludge from treatment is processed for disposal, incineration, or agricultural reuse, with reuse initiatives recovering water for non-potable uses like irrigation.[16] These components interlink, as treated wastewater can augment supply in water-scarce regions, though challenges like infrastructure aging and contamination risks persist.[18]Economic Significance and Scale
The global water and sewage market generated revenues of $713.38 billion in 2024, with projections indicating growth to $759.69 billion in 2025 at a compound annual growth rate of 6.5%.[19] This encompasses water utilities, treatment, and distribution services, though estimates vary by scope; for instance, the water and wastewater treatment technologies segment alone is valued at $350.7 billion in 2025, expected to expand significantly due to rising demand for infrastructure upgrades and pollution control.[5] These figures reflect the industry's role as a foundational utility sector, supporting residential, industrial, and agricultural needs amid population growth and urbanization. Direct contributions to global gross domestic product (GDP) from water utilities remain modest relative to their enabling effects, with water-dependent sectors like agriculture, energy, and manufacturing—reliant on reliable supply—underpinning broader economic output equivalent to trillions in value. The annual economic value of freshwater ecosystems and water resources has been estimated at $58 trillion, approximating 60% of global GDP, highlighting the sector's multiplier impact on productivity, though degradation risks substantial losses.[20] In developing countries, annual public spending on water infrastructure averages $164.6 billion, or about 0.5% of GDP, underscoring chronic underinvestment that constrains growth.[21] Employment in the water sector supports millions worldwide, though precise global figures for utilities and operations are fragmented; water-dependent industries collectively sustain 1.7 billion jobs, with direct utility roles emphasizing skilled labor in treatment, maintenance, and distribution.[3] Investment requirements amplify the sector's scale, with an estimated $6.7 trillion needed by 2030 to address infrastructure gaps and achieve sustainable development goals, driven by aging systems and climate pressures.[22] Failure to meet these could result in up to 8% GDP erosion in affected regions by mid-century, per simulations accounting for scarcity and ecosystem decline.[23]Historical Development
Ancient and Pre-Industrial Systems
Early civilizations developed rudimentary water supply systems primarily for irrigation and basic urban needs, relying on rivers and groundwater. In Mesopotamia, farmers constructed canals to divert water from the Tigris and Euphrates rivers as early as 6000 BCE, enabling large-scale agriculture in arid regions and supporting urban centers like Sumer.[24] Egyptian systems featured basins and canals that captured annual Nile floods for field irrigation, with evidence of organized water control dating to around 5000 BCE, though urban supply often depended on river proximity and simple wells.[25] The Indus Valley Civilization (circa 2600–1900 BCE) exhibited advanced infrastructure, including reservoirs, wells, and covered drainage systems in cities like Mohenjo-Daro, which managed wastewater and provided household water access superior to many later pre-industrial setups.[26][27] In arid Persia, qanats—underground tunnels tapping aquifers and channeling water by gravity—emerged around 700 BCE, allowing sustainable supply over long distances with minimal evaporation; these systems supported oasis settlements and agriculture across Iran and beyond, with some still operational today.[28][29] Ancient China constructed the Dujiangyan irrigation system in 256 BCE, a damless network of channels and levees diverting Min River waters to irrigate over 5,300 square kilometers, preventing floods while ensuring perennial supply without silt buildup.[30] In Greece, Athens relied on natural springs, shallow wells (up to 21 documented on the Acropolis by prehistoric times), and public fountains like the Enneakrounos, with conduits conveying spring water; urban demand strained these, prompting early tunneling efforts by the 6th century BCE.[31][32] The Roman Empire advanced centralized water distribution through aqueducts, beginning with the Aqua Appia in 312 BCE and expanding to eleven major systems by the 1st century CE, delivering approximately 1 million cubic meters daily to Rome's million inhabitants via gravity-fed channels, tunnels, and elevated arcs with gradients as precise as 1:4800 to maintain flow without pumps.[33][34] Engineering included sedimentation tanks and lead pipes for purification and branching, sustaining public baths, fountains, and households; structures like the Pont du Gard (19 BCE) spanned valleys up to 50 meters high.[35] These systems influenced provincial cities but declined post-5th century CE due to maintenance failures and invasions. Pre-industrial Europe, particularly during the Middle Ages (5th–15th centuries), saw fragmented local systems after Roman infrastructure decay, with towns depending on wells, rivers, and hand-dug conduits; monasteries often managed hydraulic works like watermills for milling and fulling, while cities like medieval London used gravel-bed wells and timber pipes for elite supply until groundwater depletion forced river reliance.[36][37] Islamic medieval cities employed norias (water wheels) and siphons for elevated supply, powering fountains and baths, but widespread contamination from urban waste persisted, limiting scalability until industrial mechanization.[36]Industrial Era Expansion
The Industrial Revolution, beginning in Britain around 1760, accelerated urbanization and factory-based production, dramatically increasing water demand for households, industries, and steam engines while straining rudimentary supply systems reliant on local wells, rivers, and intermittent carriers. In cities like Manchester, population surged from approximately 75,000 in 1801 to over 300,000 by 1851, overwhelming infrastructure and leading to contaminated sources shared with sewage disposal. Similar pressures emerged in emerging industrial centers across Europe and North America, where rapid migration to urban areas—often exceeding 5-10% annual growth in key hubs—exposed causal links between poor sanitation and epidemics, as untreated waste infiltrated potable supplies.[38][39] Public health crises catalyzed systemic responses, with the first UK cholera outbreak in Sunderland in 1831 killing over 500 and revealing waterborne transmission, later confirmed by John Snow's 1854 analysis of London's Broad Street pump, where contaminated well water correlated with 616 deaths in a localized cluster. This empirical evidence drove legislative action, including the Waterworks Clauses Act 1847, which standardized private company operations by mandating quality standards and consumer protections, and the Public Health Act 1848, establishing the General Board of Health to enforce piped supplies and filtration in underserved areas. By mid-century, private statutory water companies proliferated, incorporating via parliamentary acts to build reservoirs and aqueducts; for instance, Glasgow's Loch Katrine scheme, completed in 1855, delivered 55 km of gravity-fed conduit from a highland loch, supplying 50 million imperial gallons daily to combat recurrent typhoid.[40][41][42] Technological innovations underpinned expansion, including steam-powered pumping stations like London's Kew Bridge (1838), utilizing Boulton & Watt beam engines to lift Thames water, and slow sand filtration pioneered in 1829, which reduced turbidity and pathogens by biological action in gravel beds. The Metropolis Water Act 1852 regulated London's nine companies, prohibiting abstraction from tidal Thames sections prone to sewage backflow, requiring constant pressure supply to 250,000 homes, and enforcing filtration to cut contamination—evidenced by post-act declines in waterborne illnesses. Sewerage advanced concurrently, with Joseph Bazalgette's London Main Drainage system (1859-1875) featuring 132 km of intercepting brick sewers and 1,800 km of local drains, diverting 400 million gallons of waste daily from the Thames after the 1858 "Great Stink" crisis, which had rendered Parliament uninhabitable. In the US, parallel developments included New York's Croton Aqueduct (1842), a 65 km gravity tunnel serving 250,000 residents amid industrial growth, while Chicago's 1855 sewer reversal raised lake intakes 2 meters above the city level (later elevating the city 1-1.5 m) to isolate supplies from effluents. These interventions, blending private enterprise with state oversight, halved urban mortality rates from water-related diseases by 1900, though uneven implementation persisted in less-regulated peripheries.[38][43][44]20th Century Public Models and Post-War Growth
In the early 20th century, public ownership of water systems became predominant in the United States, surpassing private companies as municipalities assumed control to address growing urban demands that private entities could not meet. By 1900, publicly owned systems outnumbered private ones, with cities like Boston in 1846 and Baltimore in 1854 exemplifying the shift due to inadequate private funding and service expansion. Technological advancements, including slow sand filtration in the late 1800s and widespread chlorine disinfection by 1915, dramatically reduced waterborne diseases, achieving nearly a 100-fold decrease in major cities by the 1940s.[45] Throughout the mid-20th century, municipal water utilities focused on expanding coverage and improving treatment, supported by local government operations that regulated rates and quality through state commissions. By 1995, the U.S. had approximately 8,750 regulated water supplies, the majority publicly owned, reflecting steady growth from around 3,000 systems in 1895. In Europe, similar public models prevailed, with national and local authorities investing in piped supplies; by the early 20th century in the UK, most households had access to municipal water and sanitation under public management.[45][46] Post-World War II urbanization and population booms in the U.S. spurred massive infrastructure development, with much of the current network of treatment plants, distribution lines, and sewers constructed during this period to accommodate suburban expansion and rising demand. Federal legislation like the Clean Water Act of 1972 addressed pollution from untreated wastewater, prompting over $60 billion in government investments from the 1970s to the 1990s for sewage treatment upgrades, enabling waterways to become fishable and swimmable again. In Europe, post-war reconstruction under public frameworks similarly prioritized universal access, with countries like the UK consolidating regional water boards to manage supply and sanitation efficiently until the late 1980s.[47][48][45]Privatization Waves from 1980s Onward
The privatization of water utilities gained momentum in the 1980s, driven by neoliberal economic policies emphasizing market efficiency and private capital to address chronic underinvestment in aging infrastructure. In the United Kingdom, the Conservative government under Margaret Thatcher enacted the Water Act 1989, privatizing the ten regional water authorities in England and Wales on December 1, 1989, creating private companies responsible for both water supply and sewerage services.[42] This marked the first full national privatization of an entire water industry, with shares floated on the stock exchange, enabling access to private financing that public entities had struggled to secure amid fiscal constraints.[49] Pre-privatization efficiency improvements had already reduced staff from 80,000 to 50,000 between 1974 and 1989, but the shift to private ownership facilitated £50 billion in investments over the subsequent 15 years, focusing on infrastructure upgrades and pollution control.[50] France, with a longer tradition of private involvement dating to the 19th century, saw expanded concessions to firms like Suez and Veolia in the 1980s and 1990s, reaching 80% private operation of urban water services by 2000.[51] These models, often lease or affermage contracts rather than full asset sales, influenced global approaches, prioritizing operational management by private entities under municipal oversight. In Australia, Victoria state pursued partial privatization in the 1990s, transferring assets to private consortia with regulated returns, while New Zealand's 1980s reforms corporatized water entities, leading to some private stakes.[52] The 1990s extended waves to developing countries, often via international financial institutions like the World Bank promoting concessions for efficiency and access expansion amid fiscal crises. In Latin America, Argentina privatized Buenos Aires' water in 1993 under a 30-year concession to Aguas Argentinas, initially expanding connections by 40% but facing tariff hikes and service gaps that contributed to contract termination in 2006.[53] Bolivia's 1999 Cochabamba concession to a consortium led to sharp price increases—up to 200% for some—sparking the 2000 "Water War" protests and forced reversal, highlighting risks of inadequate regulation in low-income contexts.[54] By the early 2000s, over 180 cities in 35 countries had private water contracts, but empirical analyses show mixed outcomes: improved investment and quality compliance in regulated settings like post-1989 UK (e.g., meeting stringent EU standards), yet frequent early terminations—rising to 34% failure rate for water deals by 2010—due to unmet efficiency or affordability promises, particularly in Africa and Latin America.[55] Post-2000, reversals accelerated in places like Paris (2010 remunicipalization of Eau de Paris) and Gabon, with studies indicating no consistent efficiency edge for private operators over well-regulated publics, though privatization often boosted capital inflows where public funding lagged.[56] In Eastern Europe after communism's fall, countries like Hungary and the Czech Republic adopted mixed models in the 1990s, but many retained public dominance amid affordability concerns. Overall, these waves underscored causal trade-offs: private involvement accelerated infrastructure renewal—e.g., UK's river quality improvements—but frequently elevated tariffs (UK bills up 40% real terms since 1989) and dividends over consumer benefits, prompting stronger regulatory frameworks like Ofwat's price caps to mitigate monopolistic pricing.[57] Empirical evidence from panel data across developing economies links privatization to modest access gains (e.g., 5-10% connection increases) under strong oversight, but equity issues persist without subsidies, challenging claims of universal superiority.[55]Organizational Models
Public Ownership Structures
Public ownership structures in the water industry involve government entities—ranging from local municipalities to national agencies—holding title to assets, infrastructure, and operational control of water supply, treatment, and wastewater services, typically as non-profit operations funded through tariffs, taxes, or public bonds. These models prioritize public service mandates over profit maximization, with governance often vested in elected officials or appointed boards accountable to citizens, enabling direct democratic oversight but exposing operations to political influences and fiscal constraints from public budgets.[58][59] In the United States, public ownership predominates, with over 148,000 public water systems serving the vast majority of the population through community water systems classified by the Environmental Protection Agency based on population served and water source. Approximately 85% of these systems are owned by local governments or special districts, such as municipal departments that manage sourcing from surface or groundwater, treatment, and distribution networks spanning thousands of miles of pipes. For instance, the Los Angeles Department of Water and Power, a city-owned utility, supplies water to over 4 million residents via a combination of local aquifers, imported supplies, and recycled wastewater, with rates regulated by local ordinances to cover operational costs without shareholder dividends.[60][61] Internationally, national or regional public entities exemplify centralized structures; Scotland's Scottish Water, established in 2002 as a publicly owned corporation, integrates water and sewerage services for 5.5 million people across the country, investing £2.3 billion annually in infrastructure while maintaining universal access under statutory obligations. In the Netherlands, water management is handled by 21 publicly owned regional water boards (waterschappen), dating back to medieval times, which levy property-based taxes to fund dike maintenance, flood control, and potable water production serving 17 million residents with near-universal compliance to stringent quality standards. These boards operate autonomously but under national oversight, demonstrating how federated public models can address geographic challenges like low-lying terrain prone to flooding.[62] Empirical data on public structures highlight strengths in affordability and shutoff protections; a 2020 study of U.S. utilities found municipally owned systems 15-20% less likely to disconnect service for non-payment compared to private counterparts, attributing this to public mandates emphasizing equity during crises like the 2008 recession or COVID-19. However, operational challenges persist, including higher non-revenue water losses—averaging 15-20% in U.S. public systems due to aging pipes—and underinvestment, with the American Society of Civil Engineers grading U.S. drinking water infrastructure at D+ in 2021, citing deferred maintenance in many municipal networks totaling $473 billion in needed upgrades by 2039.[63][64] Cross-national econometric reviews, such as a World Bank analysis of developing economies, indicate public utilities often achieve comparable coverage rates to privatized ones but face inefficiencies from bureaucratic inertia, with labor productivity 20-30% lower in state-owned firms lacking competitive pressures. In contrast, public models in high-income contexts like Nordic countries correlate with low leakage rates (under 10%) through integrated planning, though systemic biases in academic studies—favoring public efficiency claims—warrant scrutiny against raw data showing variable outcomes tied more to regulatory enforcement than ownership per se.[55][65]Private Sector Involvement
Private sector involvement in water services typically occurs through contractual arrangements such as concessions, where operators assume responsibility for infrastructure maintenance, operation, and sometimes expansion in exchange for tariff revenues; management contracts, limited to operational oversight without capital risk; or full asset ownership following divestiture. These models aim to leverage private capital and expertise to address public sector limitations in funding and efficiency, particularly in aging infrastructure and expanding access. Globally, private operators serve approximately 10-15% of the urban population in low- and middle-income countries, with higher penetration in select developed markets.[66] France exemplifies extensive private delegation, with private firms managing water and sanitation for over 75% of the population through long-term concessions dating to the 19th century, dominated by companies like Veolia and Saur. Empirical analysis of French concessions from 1990 to 2005 indicates that privatization reduced child mortality by an estimated 375 deaths per year among young children, attributed to improved service coverage and quality under private management, though outcomes varied by regulatory enforcement. However, scandals involving overbilling and opacity prompted remunicipalizations, such as Paris in 2010—saving €35 million annually—and Lyon and Bordeaux in 2021-2023, reflecting concerns over profit prioritization amid public investment shortfalls.[67][68] In the United Kingdom, water privatization under the 1989 Water Act transferred English and Welsh assets to 10 regional private monopolies, including Thames Water, enabling initial capital inflows of £5.7 billion for infrastructure upgrades. Between 1991 and 2023, privatized firms distributed £78 billion in dividends to shareholders while accumulating debts exceeding £60 billion sector-wide, coinciding with underinvestment that contributed to over 3.6 million hours of sewage discharges into waterways in 2022 alone. Thames Water, serving 15 million customers, exemplifies challenges: its £14 billion debt as of 2023 led to a government bailout threat, with regulators fining the firm £168 million for pollution violations since 2010, underscoring issues of leveraged buyouts prioritizing debt service over maintenance.[69][57] Cross-country empirical studies reveal mixed performance: a World Bank analysis of 1990s-2000s concessions in Latin America found private operators expanded connections by 10-20% more than public counterparts but often at higher tariffs, with no consistent efficiency gains absent robust regulation. In developing contexts, such as Kenya's partial privatizations, outcomes include job reductions (up to 30% in surveyed contracts) and variable service improvements, hampered by weak oversight. Private investment peaked at $5.3 billion across 27 projects in 2016 but declined thereafter due to political risks and tariff disputes, signaling caution in high-risk environments. Successes, like Chile's concessions yielding sustained access gains, hinge on enforceable contracts, whereas failures in Bolivia's 2000 Cochabamba case—triggering riots over price hikes—highlight affordability pitfalls without subsidies.[55][9][70][71]Public-Private Partnerships and Hybrids
Public-private partnerships (PPPs) in the water industry encompass contractual arrangements where private entities assume responsibilities for aspects of water supply, treatment, or wastewater management, while public authorities retain oversight and often ownership of assets. Common forms include management contracts for operations, lease or affermage models where private operators manage distribution and billing in exchange for a share of revenues, concessions granting broader investment and pricing authority, and build-operate-transfer (BOT) schemes for infrastructure development. These models aim to leverage private sector expertise, capital, and efficiency incentives to address public utilities' limitations in funding infrastructure upgrades and reducing losses, particularly in aging networks or underfunded systems.[72][73] France exemplifies extensive PPP application, with private operators serving over 75% of the population through affermage contracts since the 19th century, focusing on distribution while municipalities own infrastructure. Empirical assessments indicate operational improvements, such as reduced non-revenue water (NRW) losses and enhanced bill collection, though critics note potential price premiums due to limited competition in contract renewals. In developing countries, PPPs have expanded access, connecting over 24 million people to piped water since 1990, with notable successes in Senegal's affermage model achieving near-full urban coverage and NRW levels comparable to Western Europe by 2006, alongside real-term tariff reductions and 15% staff cuts. Similarly, in eastern Manila's concession (1997 onward), coverage rose from 49% to 94% by 2006, NRW fell from 51% to 30% within three years, and water quality met 99% potability standards.[74][72][72] Performance data from over 65 long-term PPP projects reveal consistent efficiency gains, including NRW reductions averaging 20-50% in successful cases like Cartagena, Colombia (halved NRW, 65% staff reduction), and labor productivity improvements, such as Prague's drop from 12 to 8 staff per 1,000 connections. A non-parametric analysis of Italian utilities found private or public-private operators averaging 71.7% efficiency versus 64.4% for fully public ones, attributing gains to scale economies and private incentives. Systematic reviews confirm PPPs lower operating costs and boost productivity, particularly in resource-constrained settings, though outcomes hinge on competitive tendering, clear risk allocation, and regulatory enforcement to mitigate moral hazard and information asymmetries. Investment levels often rely on public subsidies or tariffs, with private capital proving insufficient alone in many cases.[72][75][73] Challenges persist, with approximately 9% of contracts terminating early, often due to unmet targets, protests over tariff hikes, or weak governance, as in Buenos Aires (1993 concession stalled post-1998 crisis, tariffs rose 112% of costs) and Cochabamba, Bolivia (2000 termination amid access disputes). Tariff effects are mixed, with increases in Latin America contrasting decreases in West Africa, underscoring the need for subsidies targeting low-income users to balance efficiency with affordability. Data limitations, including inconsistent baselines and underreporting of small projects, may overstate successes, while regional biases favor documented cases in stable environments.[72][72] Hybrid models blend public ownership with private involvement, such as through operations and maintenance (O&M) contracts or partial equity stakes, retaining public control over assets and tariffs while outsourcing expertise. In the United States, over 1,500 municipalities employ private O&M for wastewater treatment, exemplified by Milwaukee's 10-year contract for 550 million gallons per day capacity, yielding cost savings and compliance improvements without asset transfer. These arrangements, prevalent in Europe and North America, facilitate targeted efficiency without full privatization risks, though success requires robust performance metrics to align incentives. In developing contexts, hybrids incorporate community elements for localized management, enhancing resilience but demanding adaptive regulation.[76][77][78]Operational Processes
Water Sourcing and Treatment
Water sourcing for municipal supplies primarily draws from surface water sources such as rivers, lakes, and reservoirs, which provide large volumes replenished by precipitation, alongside groundwater extracted from aquifers via wells.[79] In the United States, groundwater accounts for nearly 50% of the nation's drinking water, particularly serving rural and smaller communities where aquifers offer consistent access, while surface water dominates urban systems due to scalability.[80] Alternative sources, including desalinated seawater in coastal regions and reclaimed wastewater, supplement supplies amid growing scarcity, with desalination capacity reaching about 100 million cubic meters per day globally as of 2023, concentrated in the Middle East and increasingly in water-stressed areas like California.[81] Treatment processes transform raw water into potable form through sequential physical, chemical, and biological steps to eliminate contaminants, turbidity, and pathogens. Initial screening removes large debris like leaves and fish at intake points from surface sources.[82] Coagulation follows, where chemicals such as aluminum sulfate (alum) are added to destabilize suspended particles, forming microflocs.[83] Flocculation gently mixes the water to aggregate microflocs into larger, settleable flocs, enhancing removal efficiency. Sedimentation basins then allow these flocs to settle by gravity, reducing turbidity by up to 90% in conventional plants.[84] Filtration through media like sand, gravel, and activated carbon further clarifies the water, capturing remaining particles and some organic matter; rapid sand filters operate at rates of 2-10 gallons per minute per square foot.[85] Disinfection, typically via chlorination, ozone, or ultraviolet light, inactivates microorganisms to prevent waterborne diseases; chlorine residuals of 0.2-4.0 mg/L are maintained for distribution safety, though alternatives like UV avoid chemical byproducts.[86] Additional steps, such as pH adjustment, fluoridation for dental health (at 0.7 mg/L per U.S. recommendations), and corrosion control, ensure compliance with standards like the U.S. EPA's National Primary Drinking Water Regulations, which set maximum contaminant levels for over 90 substances.[87] For groundwater, treatment often skips sedimentation and focuses on aeration or filtration if naturally low in turbidity, while desalination for brackish or seawater involves reverse osmosis membranes rejecting 99% of salts under high pressure.[83]Distribution Networks and Metering
Water distribution networks transport treated water from purification facilities to end-users through interconnected infrastructure designed to maintain sufficient pressure and flow while minimizing losses. Primary components include transmission mains for bulk conveyance, distribution mains branching to service lines, pumps for boosting pressure, valves for flow regulation and isolation, storage tanks or reservoirs for equalization, fire hydrants for emergency access, and fittings to manage direction changes and junctions.[88] [89] Pipes are typically constructed from materials such as ductile iron, PVC, or high-density polyethylene to withstand internal pressures up to 250 psi and resist corrosion, with diameters ranging from 2 inches for laterals to over 48 inches for arterial lines depending on demand.[90] Design principles emphasize hydraulic efficiency, redundancy for reliability, and pressure management to curb leakage, which accounts for a significant portion of non-revenue water (NRW)—the volume of produced water lost or unbilled due to physical leaks, overflows, or unauthorized use.[91] Systems often incorporate pressure-reducing valves (PRVs) and district metering areas (DMAs) to segment networks, lowering average operating pressures from highs of 100-150 psi to optimal 40-60 psi ranges, thereby reducing leak rates proportionally to the square root of pressure differentials per orifice flow equations.[92] [93] Valves, including gate, butterfly, and check types, enable isolation for maintenance and air release to prevent vacuum collapse, while booster pumps address elevation-induced head losses via variable frequency drives for energy-efficient operation.[88] Aging infrastructure exacerbates NRW, with many urban systems featuring pipes over 50 years old prone to bursts, necessitating proactive modeling using tools like EPANET software for simulation of flows under steady and extended-period conditions.[94] Metering quantifies water consumption at the point of delivery to enable accurate billing, demand forecasting, and conservation enforcement, typically installed on service connections downstream of curb stops. Traditional mechanical meters operate on velocity principles (e.g., turbine or compound designs) or positive displacement (piston or nutating disc), registering flows from 0.25 to 1,000 gallons per minute with accuracies of ±1.5% over a 5:1 turndown ratio, but they suffer from wear-induced inaccuracies after 10-15 years.[95] Electronic alternatives, such as ultrasonic or electromagnetic meters, use transit-time or Faraday's law to measure without moving parts, offering ±0.5% accuracy across broader ranges and resistance to clogging from debris.[96] [95] Advanced metering infrastructure (AMI) integrates smart meters with two-way communication via radio frequency, cellular, or fixed networks, allowing remote reading, real-time leak alerts through continuous flow anomaly detection, and pressure transient monitoring to prevent pipe failures.[97] [98] Unlike automated meter reading (AMR), which relies on drive-by or walk-by collection, AMI supports utility-initiated data pulls every 15-60 minutes, reducing operational costs by 20-30% and enabling dynamic pricing based on usage patterns.[99] Adoption has accelerated since the 2010s, driven by regulatory mandates in regions like the European Union, where smart metering has cut NRW by identifying unreported leaks comprising up to 20% of system losses.[98] Challenges include cybersecurity vulnerabilities in networked systems and upfront costs of $100-300 per unit, offset by lifetime savings from reduced tampering and non-billable flows.[100]Wastewater Management and Reuse
Wastewater management in the water industry encompasses the collection, treatment, and disposal or reuse of sewage and industrial effluents to mitigate environmental pollution and recover resources. Sewers transport wastewater from households, businesses, and industries to centralized treatment facilities, where processes remove solids, organic matter, pathogens, and nutrients before discharge into receiving waters or reuse applications. In the United States, these facilities process approximately 34 billion gallons of municipal wastewater daily. Globally, only 52% of wastewater receives treatment, with rates ranging from 74% in high-income countries to 4.3% in low-income ones, highlighting disparities in infrastructure investment and regulatory enforcement.[101][102] Treatment typically occurs in stages: primary treatment involves physical separation of solids via screening and sedimentation, achieving 50-70% removal of suspended solids; secondary treatment employs biological processes, such as activated sludge systems, to degrade organics via microbial action, reducing biochemical oxygen demand by 85-95%; tertiary treatment advances polishing through filtration, chemical precipitation for nutrient removal, and disinfection via chlorination or ultraviolet irradiation to eliminate pathogens. Advanced methods, including membrane bioreactors and reverse osmosis, enhance effluent quality for sensitive discharges or reuse, with deammonification processes achieving up to 95% ammonia removal in optimized systems. These stages prevent eutrophication and oxygen depletion in waterways, as untreated discharges can deplete dissolved oxygen by over 90% in receiving streams.[103][104] Wastewater reuse, or reclamation, repurposes treated effluents for non-potable uses like irrigation and industrial cooling, or potable applications via indirect or direct methods, addressing water scarcity amid projections of 3.5 billion people in water-stressed areas by 2025. Global reuse capacity stands below 250 million cubic meters per day, representing 8% of domestic freshwater withdrawals, though it has tripled over the past two decades and grows at nearly 7% annually. Non-potable reuse dominates, with agricultural irrigation accounting for over 50% of applications in regions like the Middle East and Australia, where treated wastewater supplements groundwater without direct human contact. Potable reuse, rarer due to public perception barriers, employs multi-barrier systems—such as ozonation, activated carbon, and reverse osmosis—meeting or exceeding drinking water standards, as demonstrated in pilot tests achieving EU-compliant quality.[105][106][107][108] Economic and environmental incentives drive reuse expansion, with the global market valued at USD 17.77 billion in 2024 and projected to reach USD 38.77 billion by 2032, fueled by technologies like advanced oxidation and membrane filtration that target emerging contaminants such as pharmaceuticals. Challenges include regulatory variability—stricter in the EU and California than elsewhere—and energy demands, as tertiary treatments can consume 1-2 kWh per cubic meter, though recovery of biogas from anaerobic digestion offsets up to 30% of operational costs in modern plants. Reuse reduces freshwater abstraction by 10-20% in adopting utilities, conserving ecosystems, but requires vigilant monitoring for trace organics, as incomplete removal risks bioaccumulation in food chains.[109][110][111]Regulation and Standards
Quality and Safety Protocols
Quality and safety protocols in the water industry establish enforceable standards for contaminants in drinking water to protect public health, primarily through limits on microbial pathogens, chemicals, and radiological substances. The World Health Organization (WHO) Guidelines for Drinking-Water Quality, updated in the fourth edition incorporating first and second addenda in 2022, provide health-based targets including guideline values such as 10 μg/L for arsenic, 50 μg/L for chromium (VI), and 5 mg/L for chlorine residuals, derived from toxicological data and exposure assessments.[112] These guidelines emphasize Water Safety Plans (WSPs), a framework for proactive risk assessment, control measures from source to tap, and verification through monitoring to prevent contamination rather than merely reacting to it.[113] In the United States, the Environmental Protection Agency (EPA) implements the Safe Drinking Water Act (SDWA) with National Primary Drinking Water Regulations setting maximum contaminant levels (MCLs) for over 90 substances, such as 0.015 mg/L for lead and zero for total coliform bacteria, enforced via compliance monitoring.[114] Public water systems must conduct routine testing, with frequencies varying by contaminant and system size—for instance, monthly bacteriological samples for systems serving more than 1,000 people and quarterly for smaller ones—alongside annual consumer confidence reports detailing results.[115] Treatment protocols mandate disinfection, filtration for surface water, and corrosion control to minimize byproducts like trihalomethanes, with violations triggering corrective actions or boil-water advisories.[87] The European Union's Drinking Water Directive (2020/2184), effective from January 2021 with full transposition by 2023, specifies parametric values including 10 μg/L for lead and 5 μg/L for nickel, alongside risk-based assessments and minimum hygiene criteria for materials in contact with water to prevent leaching.[116] Member states require regular monitoring, such as weekly microbiological checks at treatment works and daily at consumer points in high-risk areas, integrated with multibarrier approaches like coagulation, sedimentation, and UV disinfection.[117] Globally, protocols prioritize empirical evidence from epidemiological studies and dose-response models, though implementation gaps persist in developing regions where resource constraints limit adherence to WHO benchmarks.[112] Safety extends to wastewater reuse, mandating advanced treatment like reverse osmosis to meet reclaimed water standards before non-potable applications.[118]Environmental Compliance Requirements
Environmental compliance requirements in the water industry primarily govern the management of discharges, abstractions, and impacts on ecosystems to prevent pollution and ensure sustainable resource use. In the United States, the Clean Water Act of 1972 establishes the framework for regulating pollutant discharges from point sources, such as wastewater treatment plants, into navigable waters.[119] This includes the National Pollutant Discharge Elimination System (NPDES), which mandates permits for operators to limit effluents like biochemical oxygen demand (BOD), total suspended solids (TSS), nitrogen, phosphorus, and heavy metals, often based on technology-based standards or site-specific water quality criteria.[120] Permits typically specify maximum daily and monthly limits, for instance, BOD levels not exceeding 30 mg/L in many municipal facilities, with violations triggering fines up to $66,712 per day as adjusted for inflation in 2025.[121] In the European Union, the Water Framework Directive (2000/60/EC), effective since 2000, requires member states to achieve "good ecological and chemical status" for all water bodies by controlling pollution from urban wastewater, agriculture, and industry.[122] Water utilities must comply with the Urban Waste Water Treatment Directive (91/271/EEC), mandating secondary treatment for discharges from plants serving over 2,000 population equivalents, removing at least 70% of BOD and 50% of suspended solids before release into sensitive areas. Abstraction licenses limit groundwater and surface water extraction to prevent depletion, with monitoring required to assess impacts on flow regimes and habitats; for example, the UK Environment Agency enforces abstraction volumes under the Water Resources Act 1991, capping usage at sustainable yields determined by hydrological models. Operators across jurisdictions face mandatory monitoring and reporting protocols to verify adherence. Under NPDES, utilities conduct self-monitoring of effluent parameters at frequencies ranging from daily to quarterly, submitting discharge monitoring reports (DMRs) electronically to regulators, who use the data for compliance evaluations and public transparency via tools like EPA's Enforcement and Compliance History Online (ECHO).[123] [124] In the EU, the Industrial Emissions Directive (2010/75/EU) integrates best available techniques (BAT) for wastewater treatment, requiring annual reports on emissions and environmental management systems, with non-compliance leading to integrated pollution prevention and control (IPPC) permit revocations. Stormwater management adds layers, such as NPDES Phase II permits for small municipalities, mandating plans to reduce pollutants from runoff via structural controls like retention basins. Enforcement emphasizes deterrence through inspections, audits, and penalties, though efficacy varies; EPA data from 2023 indicates over 1,200 major CWA cases settled annually, recovering $1.2 billion in penalties and injunctive relief for upgrades. Utilities must also address emerging contaminants, such as per- and polyfluoroalkyl substances (PFAS), with EPA's 2024 lifetime health advisory levels influencing NPDES limits at 4 ppt for PFOA and PFOS combined in some states. Compliance often involves investing in advanced treatments like nutrient recovery or membrane bioreactors to meet tightening standards driven by eutrophication concerns in receiving waters.Economic Oversight and Tariff Controls
Economic oversight in the water industry encompasses regulatory mechanisms designed to address the natural monopoly characteristics of utilities, ensuring that tariffs cover efficient operating and capital costs while providing incentives for performance improvements and adequate investment in infrastructure. Regulators typically monitor financial health, enforce service standards, and adjust pricing frameworks periodically to prevent both overcharging by private providers and fiscal mismanagement in public entities, which can result in deferred maintenance or service degradation. In practice, this involves benchmarking against peer utilities to identify inefficient expenditures and setting revenue allowances that include a reasonable return on invested capital, often benchmarked against market rates to attract private investment without excessive consumer burden.[125][126] Tariff controls commonly employ incentive-based models such as price-cap regulation, where maximum allowable prices are set with adjustments for inflation minus an efficiency factor (RPI-X), compelling operators to reduce costs to retain profits. In England and Wales, the Water Services Regulation Authority (Ofwat) implements this through five-year price reviews; the PR24 determinations, finalized in December 2024, authorize £104 billion in total expenditure for 2025-2030, with average annual bill increases of 21% in real terms to fund upgrades amid aging pipes and leakage issues, while capping returns on equity at a weighted average cost of capital estimated at 4.98% pre-tax real. This approach has driven productivity gains, with studies indicating annual efficiency improvements of 1-2% since privatization in 1989, though critics note persistent high debt levels—exceeding £60 billion sector-wide in 2023—stemming from leveraged buyouts rather than regulatory failures.[127][128] In contrast, rate-of-return regulation prevails in the United States, where state public utility commissions (PUCs) approve tariffs based on a utility's rate base (net fixed assets plus working capital) multiplied by an authorized return on equity, typically ranging from 8% to 10.5% as of 2023 filings, plus recovery of operating expenses deemed prudent. PUCs scrutinize capital plans and conduct cost audits during rate cases, which occur every 3-7 years depending on the state, to balance investor recovery with ratepayer protection; for instance, Pennsylvania's PUC rejected portions of proposed rate hikes in 2024 for non-essential expenditures. This method safeguards against underinvestment but risks "gold-plating"—overbuilding to inflate the rate base—without complementary performance incentives, as evidenced by varying infrastructure conditions across states.[129][130] Internationally, oversight principles emphasize full cost recovery, including operational, capital, environmental, and opportunity costs, often guided by the OECD's "3Ts" framework of tariffs, taxes, and transfers to achieve financial sustainability without sole reliance on user fees, which averaged 70-80% of water supply and sanitation costs in OECD countries as of 2019. Volumetric tariffs, increasing with usage tiers, promote conservation by reflecting marginal resource scarcity, but regulators frequently incorporate affordability safeguards like low-income rebates or connection subsidies, as pure market pricing could exclude vulnerable households; empirical data from EU implementations under the Water Framework Directive show cost recovery ratios below 100% for environmental costs in over half of member states, correlating with higher abstraction pressures. Hybrid models in developing regions, such as performance-based contracts in Latin America, tie tariff adjustments to met service targets, mitigating risks of underfunding that plague heavily subsidized public systems.[131][132]Technological Innovations
Core Treatment Technologies
Conventional treatment for potable water relies on a sequence of physical, chemical, and biological processes to remove contaminants and pathogens from raw sources such as rivers or groundwater. The primary steps include coagulation, where chemicals like aluminum or iron salts are added to neutralize charges on suspended particles, enabling them to clump together; flocculation, involving gentle mixing to form larger flocs; sedimentation, allowing these flocs to settle out as sludge; filtration, passing water through media like sand, gravel, or activated carbon to trap remaining particles and microbes; and disinfection, typically using chlorine, chloramine, ultraviolet light, or ozone to inactivate harmful microorganisms.[133] These processes, established since the early 20th century, achieve over 99.99% removal of pathogens when properly implemented, though residuals like disinfection byproducts require monitoring.[133] In wastewater management, core technologies divide into primary, secondary, and tertiary treatments to progressively reduce pollutants before discharge or reuse. Primary treatment employs physical methods such as screening to remove debris and sedimentation in clarifiers to settle solids, capturing approximately 50-70% of total suspended solids and 25-35% of biochemical oxygen demand (BOD).[134] Secondary treatment, the biological core, utilizes processes like activated sludge—where aeration tanks foster microbial growth to metabolize dissolved organics—or attached growth systems such as trickling filters, reducing BOD by 85-95% and suspended solids by similar margins.[135] Tertiary treatment advances polishing through chemical precipitation for nutrient removal (e.g., phosphorus via alum), advanced filtration, or membrane systems to meet stringent effluent standards, often including final disinfection to control pathogens.[134] These core technologies form the backbone of global water industry operations, with variations based on source water quality and regulatory demands; for instance, membrane bioreactors integrate secondary biological treatment with ultrafiltration for compact, high-efficiency applications in space-constrained facilities.[135] While effective, challenges like sludge handling and energy demands in aeration processes drive ongoing refinements, yet conventional methods remain dominant due to proven reliability and cost-effectiveness over alternatives.[135]Digital Monitoring and Efficiency Tools
Digital monitoring in the water industry encompasses supervisory control and data acquisition (SCADA) systems integrated with Internet of Things (IoT) sensors to enable real-time oversight of treatment plants, distribution networks, and wastewater facilities.[136] These systems collect data on parameters such as pressure, flow rates, and water quality, allowing operators to detect anomalies like pressure drops indicative of leaks or contamination events.[137] For instance, IoT-enabled acoustic sensors and flow meters deployed in pipelines can identify leaks with precision up to 90% accuracy in urban networks, reducing non-revenue water losses that average 20-30% globally in many utilities.[138][139] Efficiency tools such as advanced metering infrastructure (AMI) and smart meters facilitate remote, granular tracking of consumption, enabling utilities to analyze usage patterns and implement demand-side management.[140] In distribution networks, pressure management systems using IoT valves dynamically adjust flows to minimize bursts, with studies showing reductions in water loss by 15-25% in implemented pilots.[141] Remote pump monitoring, often via SCADA-IoT hybrids, optimizes energy use by predicting overloads and scheduling maintenance, cutting operational costs by up to 20% in monitored stations.[142] Artificial intelligence (AI) enhances these tools through predictive maintenance algorithms that process sensor and historical data to forecast equipment failures in pipes and pumps.[143] In Wroclaw, Poland, an AI system analyzing SCADA data from over 1,000 km of networks reduced failure risks by identifying corrosion patterns, preventing disruptions and extending asset life.[144] Machine learning models for anomaly detection in wastewater treatment have similarly improved process efficiency, optimizing chemical dosing and energy consumption by 10-15% based on real-time feedback loops.[145] These applications, while promising, require robust cybersecurity measures, as interconnected systems increase vulnerability to breaches, though adoption has accelerated post-2020 with investments exceeding $10 billion annually in digital water tech.[146]Advanced Solutions like Desalination
Desalination extracts fresh water from seawater or brackish groundwater by removing dissolved salts and minerals, serving as a critical augmentation to traditional surface and groundwater sources in water-scarce regions. The predominant method, reverse osmosis (RO), forces water through semi-permeable membranes under high pressure, accounting for over 60% of global capacity due to its energy efficiency compared to thermal distillation processes like multi-stage flash (MSF).[147] As of 2022, more than 21,000 desalination plants operated worldwide, with annual capacity growth averaging 6-12%, driven by demand in arid areas such as the Middle East and North Africa.[148] Operational costs for seawater desalination have declined significantly, reaching as low as $0.41 per cubic meter (m³) in advanced facilities, primarily due to economies of scale, improved membrane durability, and energy recovery devices that recapture up to 95% of input pressure energy.[149] Energy consumption for RO has stabilized at 2.5-3.5 kilowatt-hours (kWh) per m³, though it remains higher than conventional treatment (0.5-1 kWh/m³), contributing to operational expenses of $0.20/m³ tied to electricity alone in regions with low power rates.[150] Major installations include Saudi Arabia's Ras Al-Khair plant, with a capacity of 1,401,000 m³/day using hybrid MSF-RO, and Israel's Sorek II, operational since 2024 at approximately 200 million m³ annually, leveraging closed-circuit RO for reduced fouling.[151] [152] Recent technological advances emphasize sustainability, including anti-fouling membranes that extend operational life by 20-50% and hybrid solar-thermal systems that align production with diurnal humidity cycles, eliminating battery storage needs and cutting emissions.[153] [147] Qatar's Ras Abu Fontas facility, completed in 2025 with 600,000 m³/day capacity, integrates wave energy capture to offset fossil fuel reliance.[154] Morocco's Agadir plant, under construction as of 2024, will produce 400,000 m³/day powered entirely by renewables, positioning it as Africa's largest upon commissioning.[155] Despite efficiencies, desalination imposes environmental burdens, notably from hypersaline brine discharge—1.5 times the intake volume—which elevates local salinity by 5-15% near outfalls, harming benthic ecosystems including seagrasses, polychaetes, and corals through smothering and oxygen depletion.[156] [157] Chemical additives like antiscalants exacerbate toxicity, while intake structures entrain marine organisms, with global brine production exceeding 142 billion m³ annually.[158] Mitigation strategies include diffuser-based dispersion and zero-liquid discharge systems using evaporation ponds or brine mining for minerals like magnesium, though these add 20-30% to costs.[157] Beyond desalination, atmospheric water generation (AWG) harvests moisture from humid air via condensation or desiccant adsorption, bypassing brine issues entirely but limited to regions with >30% relative humidity. Systems like those from Beyond Water produce up to 5,000 liters daily per unit using solar inputs, with energy use of 0.3-1 kWh/liter, suitable for decentralized applications in off-grid areas.[159] [160] Advances in metal-organic frameworks enhance yield by 50%, though scalability remains constrained by high upfront costs ($10,000-50,000 per unit) compared to grid-scale desalination.[161]Global Variations
Developed Economies' Frameworks
In developed economies, water industry frameworks prioritize rigorous standards for wastewater treatment and reuse to mitigate health risks and environmental impacts, often integrating multi-barrier treatment processes, continuous monitoring, and risk-based assessments. Ownership models differ markedly: the United States features predominantly public utilities, with over 80% of community water systems municipally owned or operated by public entities, enabling localized governance but sometimes challenged by fragmented infrastructure investment.[162] In contrast, the United Kingdom privatized its water and sewerage companies in 1989 under the Water Act, creating 10 regional monopolies regulated for economic efficiency and service quality by Ofwat, though this has led to criticisms of higher consumer costs and foreign ownership exceeding 70% of the sector.[163] [164] France employs a concession-based model where private operators like Veolia manage services under municipal oversight, blending private efficiency with public accountability, while Germany maintains largely public municipal ownership, emphasizing decentralized, community-led operations.[165] Regulatory approaches emphasize compliance with effluent discharge limits and promotion of reuse to address scarcity. In the European Union, Regulation (EU) 2020/741, applicable from June 26, 2023, mandates minimum quality parameters for treated urban wastewater reused in agricultural irrigation, including limits on pathogens, chemicals, and turbidity, supplemented by risk management plans and public transparency requirements; member states may impose stricter rules or exemptions based on local conditions.[166] The United States operates under the EPA's Clean Water Act, which sets national technology-based effluent standards via National Pollutant Discharge Elimination System permits, with states regulating reuse through guidelines like the 2012 Wastewater Reuse Criteria; the National Water Reuse Action Plan, launched in 2020, fosters innovation in direct and indirect potable reuse across 17 states with enabling frameworks.[167] Australia's National Water Initiative supports the Australian Guidelines for Water Recycling (updated from 2006), providing a risk-management framework for non-potable, indirect potable, and stormwater reuse, validated through multi-barrier processes and endorsed by states like Queensland for schemes recycling over 200 gigalitres annually.[168] These frameworks incorporate economic regulation to balance cost recovery with affordability and infrastructure renewal, often via periodic price reviews tied to performance incentives. For instance, Ofwat's price determinations in England and Wales, as in the 2024 review, cap tariffs while mandating £104 billion in investments for wastewater upgrades, though empirical analyses indicate privatized systems charge 59% more for services than public ones, raising equity concerns.[169] [54] Reuse policies increasingly incentivize circular economy principles, with EU directives requiring nutrient recovery from wastewater by 2030, yet implementation varies due to public acceptance barriers and validation costs, underscoring the causal link between stringent enforcement and reduced discharge pollution—evidenced by a 90% drop in UK river phosphorus levels post-privatization despite ongoing sewage issues.[170] Overall, while effective in advancing treatment technologies, these models reveal trade-offs: public systems excel in affordability but lag in scale efficiencies, whereas privatized ones drive investment yet amplify pricing pressures absent robust oversight.[162]Developing Regions' Challenges
In developing regions, access to safely managed drinking water remains severely limited, with approximately 2.2 billion people worldwide lacking such services as of 2022, the majority residing in low- and middle-income countries.[171] [172] Global coverage for safely managed drinking water reached 74% by 2024, up from 68% in 2015, yet progress lags in sub-Saharan Africa and South Asia, where basic services cover less than 50% of populations in many nations due to entrenched infrastructure gaps and rapid urbanization.[173] [174] Economic constraints exacerbate these deficits, as low government budget execution rates for water projects—often below 50% in low-income settings—hinder the expansion of piped networks and treatment facilities.[3] Water scarcity in these areas stems from a combination of physical limitations, overuse, and poor management, with agriculture accounting for over 70% of withdrawals in many arid zones, leading to aquifer depletion and river drying.[175] Population growth and climate variability compound the issue; for instance, in regions like the Middle East and North Africa, per capita water availability has fallen below 1,000 cubic meters annually, classifying them as water-stressed, while inefficient irrigation practices waste up to 60% of supplied water.[176] Poverty-driven inability to invest in storage and conveyance infrastructure perpetuates economic scarcity, where even abundant resources remain inaccessible without distribution systems.[177] Pollution severely degrades available sources, with untreated wastewater from roughly 370 million people discharged directly into water bodies, introducing pathogens and chemicals that render supplies unsafe.[178] In developing countries, industrial effluents and agricultural runoff contaminate over 40% of monitored surface waters, contributing to 80% of diseases linked to poor water quality, including diarrheal illnesses that cause millions of child deaths annually.[179] [180] The World Health Organization estimates that fecal contamination affects water for 1.7 billion people, amplifying health risks in densely populated slums lacking sanitation infrastructure.[181] Governance failures, including corruption, further undermine service delivery, with studies indicating that up to 26% of water investments may be lost to graft in vulnerable sectors, diverting funds from maintenance and expansion.[182] In African utilities, higher corruption levels correlate directly with reduced household access to sufficient clean water, as bribes and mismanagement prioritize elite connections over broad coverage.[183] Weak regulatory enforcement and opaque procurement processes enable these issues, stalling reforms despite international aid; for example, World Bank analyses highlight how unresponsive officials fail to align services with citizen needs, perpetuating cycles of underinvestment.[184] These challenges collectively impede economic growth, with water insecurity projected to shave up to 6% off GDP in scarcity-affected regions by 2050.[185]
Major International Operators
Veolia Environnement, a French multinational, stands as the world's largest private water operator, serving approximately 113 million people with drinking water and managing wastewater for 92 million as of 2023, bolstered by its 2022 acquisition of Suez's water and waste assets for €12.9 billion.[186] Its operations span over 40 countries across five continents, including municipal contracts in the United States (e.g., Atlanta and Milwaukee), Australia (Sydney's desalination), Brazil, and Vietnam, where it handles full-cycle water management from treatment to distribution.[187][188] Veolia's water division generated €14.5 billion in revenue in 2023, emphasizing integrated services like network maintenance and resource recovery to optimize efficiency in diverse regulatory environments.[189] Suez, originally a separate French entity, maintained a significant global footprint prior to the partial merger, providing drinking water to 57 million and sanitation to 36 million people worldwide in 2023, with operations in North America, Asia (over 6,500 employees across Southeast Asia and China), and Africa (e.g., recent Moroccan contracts for resource optimization).[190][191][192] Post-acquisition, residual Suez operations under new ownership continue in select international markets, focusing on circular economy solutions like wastewater reuse, though scaled down from its pre-2022 €9.2 billion revenue base.[193] Other notable international operators include Spain's Aqualia (part of FCC Group), which manages water services in 17 countries including the UK, Italy, and Colombia, serving 20 million customers with €1.7 billion in annual revenue as of 2022.[186] France's Saur Group operates in Europe, Africa, and Asia, handling 10 million users through concessions emphasizing performance-based contracts. Chinese firms like Beijing Enterprises Water Group, while dominant domestically (serving over 20 million in China), have expanded internationally to projects in Portugal and Indonesia, reflecting state-backed growth in emerging markets.[194] These operators collectively control about 5-10% of global urban water services, often through public-private partnerships that prioritize operational expertise over full ownership.[189]| Operator | Headquarters | Key International Presence | Population Served (Water) |
|---|---|---|---|
| Veolia | France | US, Australia, Brazil, Europe, Asia | ~113 million[186] |
| Suez | France | North America, Asia, Africa | ~57 million[190] |
| Aqualia | Spain | UK, Italy, Colombia, Middle East | ~20 million[186] |
