Hubbry Logo
PictogramPictogramMain
Open search
Pictogram
Community hub
Pictogram
logo
8 pages, 0 posts
0 subscribers
Be the first to start a discussion here.
Pictogram
Pictogram
from Wikipedia
Sample National Park Service pictograms

A pictogram (also pictogramme, pictograph, or simply picto[1]) is a graphical symbol that conveys meaning through its visual resemblance to a physical object. Pictograms are used in systems of writing and visual communication. A pictography is a writing system[2] which uses pictograms. Some pictograms, such as hazard pictograms, may be elements of formal languages.

In the field of prehistoric art, the term "pictograph" has a different definition, and specifically refers to art painted on rock surfaces. Pictographs are contrasted with petroglyphs, which are carved or incised.

Small pictograms displayed on a computer screen in order to help the user navigate are called icons.

Historical

[edit]

Early written symbols were based on pictograms (pictures which resemble what they signify) and ideograms (symbols which represent ideas). Ancient Sumerian, Egyptian, and Chinese civilizations began to adapt such symbols to represent concepts, developing them into logographic writing systems. Pictograms are still in use as the main medium of written communication in some non-literate cultures in Africa, the Americas, and Oceania.[citation needed] Pictograms are often used as simple, pictorial, representational symbols by most contemporary cultures.

Pictograms can be considered an art form, or can be considered a written language and are designated as such in Pre-Columbian art, Native American art, Ancient Mesopotamia and Painting in the Americas before Colonization.[3][4] One example of many is the Rock art of the Chumash people, part of the Native American history of California. In 2011, UNESCO's World Heritage List added "Petroglyph Complexes of the Mongolian Altai, Mongolia"[5] to celebrate the importance of the pictograms engraved in rocks.

Some scientists in the field of neuropsychiatry and neuropsychology, such as Mario Christian Meyer, are studying the symbolic meaning of indigenous pictographs and petroglyphs,[6] aiming to create new ways of communication between native people and modern scientists to safeguard and valorize their cultural diversity.[7]
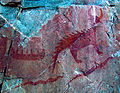
Modern uses

[edit]

An early modern example of the extensive use of pictograms may be seen in the map in the London suburban timetables of the London and North Eastern Railway, 1936–1947, designed by George Dow, in which a variety of pictograms was used to indicate facilities available at or near each station. Pictograms remain in common use today, serving as pictorial, representational signs, instructions, or statistical diagrams. Because of their graphical nature and fairly realistic style, they are widely used to indicate public toilets, or places such as airports and train stations. Because they are a concise way to communicate a concept to people who speak many different languages, pictograms have also been used extensively at the Olympics since the 1964 summer games in Tokyo featured designs by Masaru Katsumi [fr]. Later Olympic pictograms have been redesigned for each set of games.[9][10][11]

Pictographic writing as a modernist poetic technique is credited to Ezra Pound, though French surrealists credit the Pacific Northwest American Indians of Alaska who introduced writing, via totem poles, to North America.[12]

Contemporary artist Xu Bing created Book from the Ground, a universal language made up of pictograms collected from around the world. A Book from the Ground chat program has been exhibited in museums and galleries internationally.

Emojis are a type of pictogram.

In mathematics

[edit]
table with boxes instead of numbers, the amounts and sizes of boxes represent amounts of people
A compound pictogram showing the breakdown of the survivors and deaths of the maiden voyage of the RMS Titanic by class and age/gender

In statistics, pictograms are charts in which icons represent numbers to make it more interesting and easier to understand. A key is often included to indicate what each icon represents. All icons must be of the same size, but a fraction of an icon can be used to show the respective fraction of that amount.[13]

For example, the following table:
Day Letters sent
Monday 10
Tuesday 17
Wednesday 29
Thursday 41
Friday 18
can be graphed as follows:
Day Letters sent
Monday one envelope
Tuesday one envelope and a half
Wednesday three envelopes  
Thursday four envelopes   
Friday two envelopes 
Key: one envelope = 10 letters;   a half envelope = 5 letters
As the values are rounded to the nearest 5 letters, the second icon on Tuesday is the left half of the original.

In medicine and agriculture

[edit]

Miscommunication, for example due to language barriers or cognitive impairment, is a relevant factor for misdiagnosis in medicine. Pictograms and other forms of visual aids have therefore been used to ease communication and improve patient care, for example by ensuring medication adherence.[14] Reviews found especially pronounced effects in low-literacy patients.[15][16]

There is regular use of pictograms for products used in agriculture to aid hazard recognition, and also to advise on the correct usage of agrochemicals for agricultural workers with limited reading skills. This is often a national legal requirement, and many pictograms are standard throughout the industry.[17]

Standardization

[edit]

Pictograms can often transcend languages in that they can communicate to speakers of a number of tongues and language families equally effectively, even if the languages and cultures are completely different. This is why road signs and similar pictographic material are often applied as global standards expected to be understood by nearly all.

A standard set of pictograms was defined in the international standard ISO 7001: Public Information Symbols. Other common sets of pictographs are the laundry symbols used on clothing tags and the chemical hazard symbols as standardized by the GHS system.

Pictograms have been popularized in use on the Internet and in software, better known as "icons" displayed on a computer screen in order to help user navigate a computer system or mobile device.

See also

[edit]

Notes

[edit]

References

[edit]
[edit]
Revisions and contributorsEdit on WikipediaRead on Wikipedia
from Grokipedia
A pictogram is a graphical symbol that conveys meaning through its visual resemblance to a , , or action, serving as a form of non-verbal communication that relies on shared cultural or conventional features for interpretation. Pictograms originated in prehistoric times, with evidence from cave paintings dating back approximately 15,000 years, such as those in Trois-Frères, France, and evolved into structured systems for record-keeping in ancient civilizations like around 3500 BCE, where they appeared on clay bullae as precursors to cuneiform writing. Throughout history, pictograms transitioned from simple pictorial representations to more abstract ideograms, influencing the development of early writing systems in regions like and , and were used for diverse purposes including message transmission via Australian Aboriginal message sticks and Native American winter counts on buffalo robes, used from the 18th to the 19th centuries. In the 19th and early 20th centuries, industrial innovations drove their adoption in practical applications, such as railway timetables in Germanic Europe (e.g., the 1858 Vademecum) and tourism guides by organizations like the Touring Club de (1895) and (1900), marking a shift toward standardized visual aids for public navigation. The mid-20th century saw pictograms gain prominence in international design, particularly through events like the 1964 Tokyo Olympics and the 1972 Munich Olympics, where they were employed for multilingual event signage, influencing global standardization efforts by bodies such as Icograda and the (UIC) in the 1960s. Today, pictograms are integral to modern communication, standardized under frameworks like ISO 7001 (first published in 1980 and updated to its fourth edition in 2023), which defines over 100 scalable symbols for public information in accessible locations such as airports, hospitals, and public facilities, excluding safety-specific signs covered by ISO 7010. They enhance comprehension in multilingual or low-literacy environments, including healthcare instructions where they reduce ambiguity in patient information, and safety signage for hazards like floods or tsunamis.

Definition and Characteristics

Definition

A pictogram is a graphical symbol that conveys meaning through its visual resemblance to a physical object, idea, or action it represents, enabling communication without reliance on alphabetic text. These symbols function as pictorial representations, often simplifying forms to facilitate quick recognition and universal understanding across languages. Pictograms differ from ideograms, which denote abstract concepts without direct pictorial likeness, and logograms, which stand for specific words or phonetic values rather than visual similarity. For instance, a simple drawing of an eye might represent the action of "seeing," emphasizing the pictogram's reliance on resemblance to the . The term "pictogram" originates from the Latin pictus, meaning "painted" (past participle of pingere, "to paint"), combined with the Greek -gramma, denoting "letter" or "thing written," reflecting its nature as a painted or drawn record. Pictograms are broadly categorized into iconic types, featuring direct and realistic resemblance to the subject, and symbolic types, which employ stylized or abstracted forms while preserving essential visual cues for identification. This distinction highlights how pictograms balance literal depiction with interpretive flexibility in conveying meaning.

Semiotic Principles

In semiotics, pictograms function as signs within Ferdinand de Saussure's dyadic model, comprising a signifier—the visual image itself—and a signified—the concept or idea it evokes, with the bond between them established through conventional association rather than inherent necessity. This model, originally developed for linguistic signs, extends to visual representations like pictograms, where the pictorial form directly links to an abstract meaning, facilitating communication across verbal barriers. Pictograms primarily operate through principles of iconicity and , as outlined in Charles Sanders Peirce's triadic . Iconicity refers to the resemblance between the pictogram and its referent, such as a of a house evoking the concept of due to visual similarity, which enhances intuitive recognition. involves a causal or contextual connection, as in a smoke pictogram signaling the presence of through implied relation rather than mere likeness, directing attention to an immediate environmental cue. These principles allow pictograms to convey meaning efficiently in non-verbal contexts, though their effectiveness depends on the degree of in the design. Despite these strengths, pictograms face limitations in interpretation due to cultural variability, where symbols tied to specific societal norms—such as icons based on traditional clothing—may confuse audiences from different backgrounds. arises without contextual support, as open-ended visuals can yield multiple readings, and stylized forms often evolve toward , resembling signs with less direct resemblance to the . Experimental studies confirm these issues, showing divergent interpretations between U.S. and Japanese participants for pictograms like one depicting a with a speech bubble, rated as "talking" by but "lying" by Japanese due to connotative differences. Cognitively, pictograms promote universal understanding in low-literacy or multilingual environments by leveraging visual processing advantages, such as the , where images are recalled more accurately than words due to dual encoding in memory. indicates higher comprehension rates among low-literacy groups when pictograms are culturally adapted, with studies in demonstrating 85% accuracy for standardized health pictograms meeting ANSI criteria. In multilingual settings, like Thai undergraduate cohorts, pictogram use improves , though non-health students exhibit lower understanding (e.g., 6.75% accuracy for instructions) without verbal , underscoring the role of visual cues in bypassing linguistic barriers.

History

Prehistoric Origins

The earliest known pictographic expressions emerged during the , with the oldest dated examples from around 51,200 years ago, such as cave paintings in Leang Karampuang, , depicting figures and animals, and prominent sites like Cave, , where artworks dated to approximately 17,000 years ago depict large animals such as , , , and deer, often shown in dynamic poses suggesting hunts or natural scenes, using broad outlines and natural pigments for representational symbolism. These images highlight a reliance on iconicity, where visual forms directly resemble their subjects to convey meaning without verbal . In societies, such pictograms played essential roles in social and cultural practices, including to transmit knowledge of environments and events, territorial marking to assert group identity and boundaries, and rituals to foster community cohesion and invoke forces. For instance, graphic signs like quadrilaterals and tectiforms, frequently paired with animal motifs in European caves, supported collective narratives and ceremonial activities, reinforcing social stability in mobile bands without structured writing. Prominent prehistoric sites illustrate this tradition's breadth. The petroglyphs of the , inscribed on UNESCO's World Heritage List in 2011, date to as early as 12,000 BCE and feature engravings of animals, hunters, and abstract patterns spanning from the into later periods, reflecting symbolic documentation of daily life and beliefs. Similarly, Chumash in , produced by indigenous hunter-gatherers during the late prehistoric era around 1,000 to 2,000 years ago, includes colorful pictographs of zoomorphic figures, humanoids, and geometric designs in sandstone shelters, likely tied to shamanic visions and territorial expressions. More recent discoveries, such as the 12,000-year-old petroglyphs in Saudi Arabia's Shuwaymis region reported in 2025, highlight ongoing findings of early monumental depicting life-size animals and hinting at complex early settlements in the . This era marks a pivotal transition from purely representational imagery to , as seen in notations like sequential lines, dots, and forked signs that abstracted concepts such as time and seasons, with evidence from as early as 73,000 years ago in sites like , , and further development in the around 37,000 to 13,000 years ago, signaling a cognitive evolution toward systematic symbolism.

Ancient Developments

The development of pictograms in ancient civilizations marked a pivotal transition from simple symbolic representations to structured writing systems, building on prehistoric markings for more complex societal needs such as administration and . In , around 3500 BCE, the Sumerians in the city of began using pictographic impressions on clay tablets derived from earlier clay tokens employed for goods like and . These early pictographs, initially numbering in the hundreds, evolved into the script, which by circa 3000 BCE encompassed over 600 symbols representing objects, quantities, and actions, facilitating record-keeping in burgeoning urban economies. In , hieroglyphs emerged around 3200 BCE, as evidenced by inscriptions on bone and ivory labels from tombs at Abydos, initially serving funerary and administrative purposes. This system combined pictograms denoting concrete objects—such as the image of a reed symbolizing both the and the phonetic sound "i"—with emerging phonetic complements to convey abstract ideas and proper names. Over time, these pictographic elements formed a versatile script used in monumental inscriptions, papyri, and religious texts, blending ideographic and syllabic functions to record the Egyptian language. Chinese oracle bone script, dating from approximately 1200 BCE during the late Shang Dynasty, represents another independent evolution of pictographic writing, inscribed on animal bones and turtle shells for divination rituals. Characters like those for "sun" (a circular form with rays) and "moon" (a crescent shape) functioned as logograms, directly depicting concepts while also serving phonetic roles in a non-alphabetic system that laid the foundation for modern Chinese characters. This script, with around 4,000 known inscriptions, emphasized visual resemblance to natural forms, highlighting its pictographic roots in ritual and calendrical recording. Parallel developments occurred elsewhere, underscoring the independent invention of pictographic systems across regions. In the Indus Valley Civilization, circa 2500 BCE, small steatite seals bore short sequences of pictographic symbols—often alongside animal motifs—likely used for trade, ownership, or ritual identification, though the script remains undeciphered with about 400 distinct signs. Similarly, in , by around 600 BCE, early glyphs in cultures like the and Zapotecs incorporated pictographic elements for numerals, dates, and deities, evolving into complex logographic scripts without influence from traditions. These examples illustrate how pictograms, rooted in observable phenomena, adapted to diverse cultural contexts as precursors to full writing.

Medieval and Early Modern Evolution

During the medieval period, pictographic influences persisted in non-alphabetic writing systems, particularly in illuminated manuscripts from Islamic and Asian traditions. In Islamic manuscripts, artists incorporated symbolic motifs such as peonies, clouds, dragons, and phoenixes, adapted from Chinese visual traditions, to enhance textual decoration and convey conceptual meanings alongside . Similarly, medieval Asian manuscripts, including those from , featured pictographic punctuation marks that served both philological and iconographic functions, reflecting everyday cultural elements and bridging visual symbolism with script. These elements maintained a continuity of pictographic expression in regions where logographic or syllabic systems dominated, allowing for layered communication beyond purely alphabetic forms. In , from the 14th to 17th centuries, emerged as a system of stylized pictograms used to denote identity, lineage, and status among nobility and military orders. Coats of arms functioned as distinctive graphic symbols painted on shields, banners, and seals, evolving from simple charges like or eagles to complex compositions that conveyed abstract qualities such as bravery or sovereignty without relying on text. Concurrently, alchemical symbols during this era represented a pictographic for chemical elements, processes, and philosophical concepts, often depicted as iconic figures like the green for iron sulfate or the serpent for rebirth and amalgamation. These symbols, compiled in treatises and diagrams, provided a visual for esoteric knowledge, blending representational imagery with symbolic abstraction to encode transformative ideas. The invention of the Gutenberg printing press around 1450 accelerated the dominance of alphabetic scripts in , contributing to the decline of pictographic systems by standardizing for linear text production and reducing the need for illustrative aids in mass communication. However, pictographic elements survived in specialized domains such as , where early modern maps employed symbolic icons—like stylized trees for forests or ships for routes—to represent geographical features and aid intuitive understanding. books, popular in the 16th and 17th centuries, further preserved this tradition through combined images and mottos, using pictograms to illustrate moral, political, and natural allegories for educated audiences. A key transition toward revival occurred in the with proposals for universal characters as educational tools for the illiterate, exemplified by Francis Bacon's advocacy in the early for a "real character" system inspired by Chinese ideograms. Bacon envisioned these symbols as a that could bypass vernacular alphabets, enabling direct representation of concepts through visual similitude to facilitate learning among non-readers and promote international knowledge exchange. This idea influenced later 18th-century efforts to adapt pictographic aids in , marking a shift from decline to selective reappropriation in response to persistent challenges.

Modern Applications

Visual Communication and Signage

Pictograms are integral to modern and , serving as intuitive, non-verbal tools for conveying information in public spaces. In transportation, they facilitate efficient by distilling complex systems into recognizable symbols. A landmark example is Harry Beck's 1933 schematic map for the London Underground, which abstracted the city's rail network using simple icons—such as circles for stations and colored lines for routes—to emphasize connectivity over precise geography, thereby improving user comprehension in a bustling urban environment. This approach set a precedent for diagrammatic representations worldwide, prioritizing clarity for diverse passengers. Airport signage further exemplifies pictograms' role in wayfinding, where standardized symbols address linguistic barriers in international travel. The American Institute of Graphic Arts (AIGA), in collaboration with the U.S. , introduced the first set of 34 symbol signs in 1974, designed for use in transportation facilities like airports to denote amenities such as baggage claim, restrooms, and exits through minimalist, universally interpretable icons. These symbols, later expanded by 16 in 1979, received a Presidential Design Award for their effectiveness in reducing confusion among global travelers. In public safety and broader , the ISOTYPE (International System of Typographic Picture Education) system, pioneered by in during the 1920s and 1930s, employed repeatable pictograms to illustrate social statistics and instructional content, such as health advisories and data, making abstract information accessible to non-literate or multilingual audiences. ISOTYPE's emphasis on standardized, scalable figures influenced modern infographics for emergency signage and . Olympic pictograms highlight their application in large-scale events, where they unify communication across cultures. Debuting at the 1964 under the artistic direction of Katsumi Masaru, with contributions from Yoshiro Yamashita, the initial set featured 20 stylized figures for the sports and 39 for facilities, enabling spectators from over 90 nations to navigate venues without language dependency. These icons evolved in subsequent Olympics toward more abstract, geometric forms while retaining their core function of event identification, as seen in the minimalist designs of the 1972 Munich Games. The primary advantage of pictograms in signage lies in their ability to transcend linguistic barriers, promoting inclusivity in diverse settings. By minimizing text reliance, they enhance for international users, as demonstrated in road signage governed by the 1968 Vienna Convention on Road Signs and Signals, a treaty that standardizes over 100 symbolic pictograms for warnings, prohibitions, and directions to ensure consistent interpretation and road safety across signatory countries. This convention, adopted by more than 70 nations, underscores pictograms' role in reducing accidents through immediate visual recognition, particularly in high-stakes environments like highways and borders.

Digital Media and Emojis

The integration of pictograms into digital media began with the development of graphical user interfaces (GUIs) in the 1970s, where icons served as visual metaphors to simplify user interaction with computers. At Xerox PARC, the Alto computer, introduced in 1973, pioneered the use of icons alongside a mouse-driven interface, allowing users to manipulate graphical representations of files and programs rather than relying solely on text commands. This approach standardized visual symbols for computing tasks, influencing subsequent designs by emphasizing intuitive, non-verbal cues. In 1984, Apple further popularized these concepts with the Macintosh, where designer created a suite of pixel-based icons that embodied everyday metaphors, such as a trash can for deletion and a for editing. These symbols made the interface accessible to non-technical users by translating abstract functions into familiar visuals, setting a for pictogram use in personal . Emojis represent a contemporary evolution of pictograms in digital communication, originating in in 1999 when designer developed 176 symbols for NTT DoCoMo's mobile internet service to convey emotions and ideas concisely on limited screens. Standardized by the starting with version 6.0 in 2010, emojis enabled cross-platform compatibility, transforming them from proprietary mobile graphics into a global language. As of 17.0 released in September 2025, the standard includes over 3,900 emoji characters, facilitating nuanced emotional expression in text-based interactions. In applications and , emojis enhance textual communication by adding layers of tone and context, as seen in features like WhatsApp's reaction stickers, which allow quick visual responses to messages without typing. They also promote for users with low or language barriers, functioning as universal pictograms that convey meaning independently of written words. Despite their ubiquity, emojis face challenges including cross-platform rendering inconsistencies, where the same character may appear with varying styles—such as a cheerful face on one device versus a neutral one on another—potentially leading to misinterpretations in conversations. Cultural biases persist, with early sets criticized for underrepresenting diversity; however, additions from 2020 to 2025, including expanded skin tone modifiers and inclusive representations like interracial families, aim to address these gaps by better reflecting global demographics.

Specialized Uses

In Mathematics and Statistics

In mathematics and , pictograms, also known as pictographs, are charts that use or symbols to visually represent quantities of , where each corresponds to a predefined unit value. For instance, in a graph, a single figure might represent 100 individuals, allowing multiple to illustrate total sizes across categories like age groups or regions. This approach transforms numerical into an accessible format that emphasizes proportions and trends through repetition or grouping of symbols. The use of pictograms evolved from foundational statistical graphics, such as William Playfair's 1786 introduction of bar charts in The Commercial and Political Atlas, which pioneered the visual encoding of and influenced later symbolic representations. A significant advancement occurred in the with Otto Neurath's development of the ISOTYPE system in the , a standardized method of pictorial statistics designed to communicate complex societal data to broad audiences, including the illiterate, through consistent icons. In modern educational contexts, pictograms remain a staple for teaching data interpretation, such as in charts depicting demographic distributions where icons like figures or symbols represent grouped values to illustrate concepts like survival rates or population changes. Constructing a pictogram requires maintaining scale consistency to prevent visual distortion, particularly when vary in size to denote larger quantities—doubling the linear dimensions of an icon quadruples its area, which can exaggerate perceived differences unless the scaling is linear in count rather than size. The number of full needed for a given point is determined by the n=total valueunit valuen = \frac{\text{total value}}{\text{unit value}}, with partial or fractions used for remainders to ensure accuracy. A key or must accompany the to define the unit value explicitly. Pictograms provide advantages in , making statistical data intuitive and engaging for non-expert audiences by leveraging familiar symbols to convey quantities at a glance, which aids in education and public communication. However, they are susceptible to pitfalls, such as manipulation through inconsistent scales or ambiguous icon sizing, which can distort comparisons and lead to misinterpretation of data proportions if not designed with precision.

In Healthcare

Pictograms play a crucial role in healthcare by facilitating medication adherence, particularly among patients with low . Pictorial aids, such as icons depicting pills with clock symbols to indicate timing, have been shown to enhance compliance by simplifying complex instructions. For instance, a involving caregivers of young children demonstrated that a pictogram-based intervention reduced dosing errors (e.g., absolute risk reduction of 42.4% for daily doses) and improved adherence rates compared to standard counseling. Similarly, in studies with patients, adherence increased from 67.7% to 88.3% when pictograms were used alongside oral instructions. The has highlighted non-adherence rates of 25-50% in chronic disease management, underscoring the value of such visual tools in efforts. In patient information leaflets, pictograms are employed to communicate side effects clearly, aiding comprehension without relying solely on text. These symbols, often developed through international pharmacopeia standards post-2000, include representations like wavy lines for to denote gastrointestinal discomfort. The (USP) pictogram library, expanded in the early , provides standardized images for instructions such as dosing and storage, which have been integrated into leaflets to support in diverse settings. Research indicates these visual cues improve understanding when combined with textual descriptions. Such developments align with aimed at reducing medication errors through accessible formats. Pictograms serve as vital accessibility tools in healthcare for immigrants and the elderly, who often face barriers and cognitive challenges. Trials in the 2010s across and have provided evidence of their effectiveness; for example, a 2018 study in showed pictograms improved inhaler technique adherence sevenfold among low-literacy elderly patients with . In , a 2022 exploratory study on sub-Saharan migrants arriving in revealed low comprehension of USP pictograms, with none meeting ISO standards, emphasizing the need for culturally adapted formats. African studies have confirmed benefits of localized pictograms in improving recall of dosing schedules among low-literacy groups. These interventions promote equitable access by bridging and gaps in multicultural healthcare environments. Ethical considerations in pictogram design emphasize cultural neutrality to prevent misinterpretation and ensure equitable healthcare delivery. Images must avoid culturally specific symbols that could lead to confusion, which studies in diverse contexts have shown can result in high misinterpretation rates, such as up to 45.6% for certain icons. Developers prioritize universal motifs tested across demographics, as recommended by pharmacopeia guidelines, to uphold patient autonomy and without bias. Failure to achieve this neutrality risks exacerbating health disparities, particularly in global migrant populations.

In Agriculture and Safety

Pictograms play a crucial role in agrochemical labeling, providing visual warnings for toxicity and handling risks on pesticide containers. The Food and Agriculture Organization (FAO) of the United Nations introduced standardized pictograms in an 1988 addendum to its guidelines on good labeling practice for pesticides, aiming to communicate hazards to users regardless of literacy levels. These symbols, often accompanied by color-coded bands such as red for danger, were further refined in subsequent FAO and World Health Organization (WHO) publications from the 1990s onward, including the 2015 revised guidelines that include annexes with precautionary pictograms. The Globally Harmonized System of Classification and Labelling of Chemicals (GHS), adopted in 2003 by the United Nations, standardized these internationally, incorporating symbols like the skull and crossbones to denote acute toxicity, facilitating safer pesticide use in agriculture. In farm safety contexts, pictograms guide machinery operation and handling, particularly benefiting rural workers with low . Icons depicting protective gear, no-smoking zones near chemicals, and safe distances from equipment help prevent exposure and mechanical injuries. For instance, a 2017 cross-sectional survey in among paddy farmers revealed low awareness of safety pictograms, with only 28.6% correctly interpreting them, underscoring the need for culturally adapted visuals to enhance comprehension among low- groups. Similar icons on , standardized by organizations like the (ISO), warn against hazards such as entanglement or crushing, promoting safer practices in diverse linguistic environments. Pictograms extend to environmental sustainability in agriculture through symbols denoting eco-friendly practices. Organic certification marks, such as the USDA Organic Seal—a green circle with white text and a leaf motif—visually assure consumers and farmers of compliance with standards prohibiting synthetic pesticides and promoting soil health. The European Union's organic logo, featuring a green leaf and stars, similarly serves as a pictographic indicator of sustainable farming methods, aiding in the promotion of biodiversity and reduced chemical inputs. The adoption of pictograms in has demonstrably improved outcomes by enhancing recognition and compliance. indicates that well-designed pictograms on labels and machinery contribute to fewer incidents by improving user understanding, with studies showing they serve as vital tools for accident prevention in high-risk farming settings. For example, comprehensive programs incorporating these visuals have been linked to overall reductions in pesticide-related mishaps, supporting safer agricultural operations globally.

Standardization

International Standards

The (ISO) first published ISO 7001 in 1980 as a standard for graphical symbols intended for public information, aiming to provide clear, language-independent communication in public facilities and spaces worldwide. This standard specifies scalable symbols applicable to various sectors where the public has access, excluding safety signs and specialized fields like traffic regulation. The latest edition, ISO 7001:2023, registers over 100 such symbols, including those denoting facilities like information desks (PI PF 001) and restrooms, to promote universal understanding and reduce barriers to navigation. Examples include icons for features, such as vision-impaired assistance (AC 008), ensuring broad applicability in airports, hospitals, and public buildings. In the digital realm, the Unicode Consortium has established standards for emojis as modern pictograms since the release of Unicode 6.0 in 2010, integrating them into the Unicode Standard to enable consistent rendering across platforms and devices. Governed by Unicode Technical Standard #51, these standards define emoji sequences, properties, and presentation guidelines, with ongoing updates adding thousands of characters while maintaining interoperability. Accessibility is a key focus, with recommendations for alt text descriptions, high-contrast designs, and proposals for disability-representative emojis (e.g., guide dogs and prosthetic limbs) to support screen readers and diverse users. The adopted the Globally Harmonized System of Classification and Labelling of Chemicals (GHS) in 2003, introducing nine standardized hazard pictograms to convey physical, health, and environmental risks associated with chemicals in a globally consistent manner. These red-bordered symbols, such as the for flammables and the skull for , are integral to labels, safety data sheets, and transport markings. By 2025, the GHS has been implemented in over 80 countries, rendering its pictograms mandatory for communication in regulatory frameworks across the , , , and many others. Development of these standards emphasizes iterative processes to ensure cross-cultural recognizability, involving proposal submissions, expert reviews, and empirical testing of symbol comprehension. For instance, ISO symbols undergo validation per ISO 9186, which employs user studies to measure recognition rates (targeting at least 67% without explanation) across demographics and languages. Similarly, GHS pictograms were refined through international consultations under the UN's Committee of Experts, prioritizing simplicity and intuitiveness for global workers and consumers. Unicode emoji proposals follow a multi-stage review, including checks and evaluations to achieve high adoption rates. This rigorous, evidence-based approach minimizes misinterpretation and supports the standards' universality in .

Implementation Challenges

One significant obstacle to the global adoption of standardized pictograms is cultural and linguistic diversity, which can lead to varying interpretations across regions. For instance, on hazard pictograms, such as those under the Globally Harmonized System (GHS), have revealed misinterpretation rates of approximately 20-30% in tests involving participants from different backgrounds, particularly when symbols rely on Western-centric imagery that may not align with local contexts or experiences. A 2014 study comparing icon comprehension in rural and the found that while U.S. participants achieved 85% accuracy for medical symbols, Tanzanian participants reached only 55%, highlighting how cultural familiarity influences guessability and underscoring the need for localized testing to mitigate such barriers. Technological hurdles further complicate pictogram implementation, especially in digital environments where compatibility issues arise from inconsistent rendering across platforms. Prior to 2020, —a modern form of pictograms—suffered from significant fragmentation, with Japanese carriers like Docomo, SoftBank, and AU by using proprietary sets that were incompatible globally, leading to miscommunications when symbols appeared differently or not at all on various devices. The addressed this by standardizing encoding starting in 2010, enabling cross-platform support, though visual design variations persisted until vendors aligned more closely post-2015; 15.0, released in 2022, further enhanced compatibility by adding 448 new characters and improving sequence handling for complex pictographic expressions. Legal and economic factors pose additional challenges, particularly in enforcing pictogram standards in developing nations where resources for compliance are limited. In the , GHS pictogram enforcement is robust through mandatory regulations like REACH and CLP, with full since 2015 supported by centralized oversight and penalties for non-compliance, achieving high adoption rates in industry. In contrast, Asian developing countries like and face delays due to legislative gaps, insufficient training, and financial burdens for small enterprises, as evidenced by case studies showing partial GHS rollout with ongoing issues in label verification and monitoring. These disparities highlight the need for international aid, such as capacity-building programs from organizations like UNITAR, to bridge enforcement gaps without imposing undue economic strain. Looking ahead, AI-assisted design offers promising solutions for creating adaptive pictograms that address cultural and contextual barriers. Emerging post-2020, tools like PictoAI leverage generative models such as DALL-E 3 to produce cartographic pictograms from text prompts, incorporating semiotic principles for higher interpretability—empirical tests in showed 67% correct recognition rates compared to 32% for traditional symbols, with potential for cultural customization through iterative prompting. This approach enables dynamic adaptation, such as generating region-specific variants of GHS symbols, fostering more inclusive while reducing manual costs.

References

Add your contribution
Related Hubs
User Avatar
No comments yet.