
Community hub
Recent from talks
Contribute something
Nothing was collected or created yet.
Sugar
View on Wikipedia

Sugar is the generic name for sweet-tasting, soluble carbohydrates, many of which are used in food. Simple sugars, also called monosaccharides, include glucose, fructose, and galactose. Compound sugars, also called disaccharides or double sugars, are molecules made of two bonded monosaccharides; common examples are sucrose (glucose + fructose), lactose (glucose + galactose), and maltose (two molecules of glucose). White sugar is almost pure sucrose. During digestion, compound sugars are hydrolysed into simple sugars.
Longer chains of saccharides are not regarded as sugars, and are called oligosaccharides or polysaccharides. Starch is a glucose polymer found in plants – the most abundant source of energy in human food. Some other chemical substances, such as ethylene glycol, glycerol and sugar alcohols, may have a sweet taste, but are not classified as sugar.
Sugars are found in the tissues of most plants. Honey and fruits are abundant natural sources of simple sugars. Sucrose is especially concentrated in sugarcane and sugar beet, making them efficient for commercial extraction to make refined sugar. In 2016, the combined world production of those two crops was about two billion tonnes. Maltose may be produced by malting grain. Lactose is the only sugar that cannot be extracted from plants, as it occurs only in milk, including human breast milk, and in some dairy products. A cheap source of sugar is corn syrup, industrially produced by converting corn starch into sugars, such as maltose, fructose and glucose.
Sucrose is used in prepared foods (e.g., cookies and cakes), is sometimes added to commercially available ultra-processed food and beverages, and is sometimes used as a sweetener for foods (e.g., toast and cereal) and beverages (e.g., coffee and tea). Globally on average a person consumes about 24 kilograms (53 pounds) of sugar each year. North and South Americans consume up to 50 kg (110 lb), and Africans consume under 20 kg (44 lb).[1]
The use of added sugar in food and beverage manufacturing is a concern for elevated calorie intake, which is associated with an increased risk of several diseases, such as obesity, diabetes, and cardiovascular disorders.[2] In 2015, the World Health Organization recommended that adults and children reduce their intake of free sugars to less than 10% of their total energy intake, encouraging a reduction to below 5%.[3]
Etymology
[edit]The etymology of sugar reflects the commodity's spread. From Sanskrit śarkarā, meaning "ground or candied sugar", came Persian shakar and Arabic sukkar. The Arabic word was borrowed in Medieval Latin as succarum, whence came the 12th century French sucre and the English sugar. Sugar was introduced into Europe by the Arabs in Sicily and Spain.[4]
The English word jaggery, a coarse brown sugar made from date palm sap or sugarcane juice, has a similar etymological origin: Portuguese jágara from the Malayalam cakkarā, which is from the Sanskrit śarkarā.[5]
History
[edit]
Sugar was first produced from sugar cane in the Indian subcontinent.[6] Diverse species of sugar cane seem to have originated from India (Saccharum barberi and S. edule) and New Guinea (S. officinarum).[7][8] Sugarcane is described in Chinese manuscripts dating to the 8th century BCE, which state that the use of sugarcane originated in India.[9]
Nearchus, admiral of Alexander the Great, the Greek physician Pedanius Dioscorides and the Roman Pliny the Elder also described sugar.[10] In the mid-15th century, sugar was introduced into Madeira and the Canary Islands, where it was mass produced. Christopher Columbus introduced it to the New World leading to sugar industries in Cuba and Jamaica by the 1520s.[11] The Portuguese took sugar cane to Brazil.
Beet sugar, the starting point for the modern sugar industry,[12] was a German invention.[13][14] Beet sugar was first produced industrially in 1801 in Cunern, Prussia.[14]
Sugar became a household item by the 19th century, and this evolution of taste and demand for sugar as an essential food ingredient resulted in major economic and social changes.[15][page needed] Demand drove, in part, the colonisation and industrialisation of previously under-developed lands. It was also intimately associated with slavery.[15][page needed] World consumption increased more than 100 times from 1850 to 2000, led by the United Kingdom, where it increased from about 2 pounds per head per year in 1650 to 90 pounds by the early 20th century.
Chemistry
[edit]
Scientifically, sugar loosely refers to a number of compounds typically with the formula (CH2O)n. Some large classes of sugars, ranked in increasing order of molecular weight are monosaccharides, disaccharides, or oligosaccharides.
Monosaccharides
[edit]Monosaccharides are also called "simple sugars", the most important being glucose. Most monosaccharides have a formula that conforms to C
nH
2nO
n with n between 3 and 7 (deoxyribose being an exception). Glucose has the molecular formula C
6H
12O
6. The names of typical sugars end with -ose, as in "glucose" and "fructose". Such labels may also refer to any types of these compounds. Fructose, galactose, and glucose are all simple sugars, monosaccharides, with the general formula C6H12O6. They have five hydroxyl groups (−OH) and a carbonyl group (C=O) and are cyclic when dissolved in water. They each exist as several isomers with dextro- and laevo-rotatory forms that cause polarized light to diverge to the right or the left.[16]
- Fructose, or fruit sugar, occurs naturally in fruits, some root vegetables, cane sugar and honey and is the sweetest of the sugars. It is one of the components of sucrose or table sugar. It is used as a high-fructose syrup, which is manufactured from hydrolyzed corn starch that has been processed to yield corn syrup, with enzymes then added to convert part of the glucose into fructose.[17]
- Galactose generally does not occur in the free state but is a constituent with glucose of the disaccharide lactose or milk sugar. It is less sweet than glucose. It is a component of the antigens found on the surface of red blood cells that determine blood groups.[18]
- Glucose occurs naturally in fruits and plant juices and is the primary product of photosynthesis. Starch is converted into glucose during digestion, and glucose is the form of sugar that is transported around the bodies of animals in the bloodstream. Although in principle there are two enantiomers of glucose (mirror images one of the other), naturally occurring glucose is D-glucose. This is also called dextrose, or grape sugar because drying grape juice produces crystals of dextrose that can be sieved from the other components.[19]
The acyclic monosaccharides (and disaccharides) contain either aldehyde groups or ketone groups. These carbon-oxygen double bonds (C=O) are the reactive centers. All saccharides with more than one ring in their structure result from two or more monosaccharides joined by glycosidic bonds with the resultant loss of a molecule of water (H
2O) per bond.[20]
Disaccharides
[edit]Lactose, maltose, and sucrose are disaccharides, also called "compound sugars". The share the formula C12H22O11. They are formed by the condensation of two monosaccharide molecules with the expulsion of a molecule of water.[16]
- Lactose is the naturally occurring sugar found in milk. A molecule of lactose is formed by the combination of a molecule of galactose with a molecule of glucose. It is broken down when consumed into its constituent parts by the enzyme lactase during digestion. Children have this enzyme but some adults no longer form it and they are unable to digest lactose.[21]
- Maltose is formed during the germination of certain grains, the most notable being barley, which is converted into malt, the source of the sugar's name. A molecule of maltose is formed by the combination of two molecules of glucose. It is less sweet than glucose, fructose or sucrose.[16] It is formed in the body during the digestion of starch by the enzyme amylase and is itself broken down during digestion by the enzyme maltase.[22]
- Sucrose is found in the stems of sugarcane and roots of sugar beet. It also occurs naturally alongside fructose and glucose in other plants, in particular fruits and some roots such as carrots. The different proportions of sugars found in these foods determines the range of sweetness experienced when eating them.[16] A molecule of sucrose is formed by the combination of a molecule of glucose with a molecule of fructose. After being eaten, sucrose is split into its constituent parts during digestion by a number of enzymes known as sucrases.[23]
Polysaccharides
[edit]Longer than disaccharides are oligosaccharides and polysaccharides. Cellulose and chitin are polymers, often crystalline, found in diverse plants and insects, respectively. Cellulose cannot be digested directly by animals. Starch is an amorphous polymer of glucose that is found in many plants and is widely used in the sugar industry.
Sources
[edit]The sugar contents of common fruits and vegetables are presented in Table 1.
| Food item | Total carbohydrateA including dietary fiber |
Total sugars |
Free fructose |
Free glucose |
Sucrose | Fructose/ (Fructose+Glucose) ratioB |
Sucrose as a % of total sugars |
|---|---|---|---|---|---|---|---|
| Fruits | |||||||
| Apple | 13.8 | 10.4 | 5.9 | 2.4 | 2.1 | 0.67 | 20 |
| Apricot | 11.1 | 9.2 | 0.9 | 2.4 | 5.9 | 0.42 | 64 |
| Banana | 22.8 | 12.2 | 4.9 | 5.0 | 2.4 | 0.5 | 20 |
| Fig, dried | 63.9 | 47.9 | 22.9 | 24.8 | 0.9 | 0.48 | 1.9 |
| Grapes | 18.1 | 15.5 | 8.1 | 7.2 | 0.2 | 0.53 | 1 |
| Navel orange | 12.5 | 8.5 | 2.25 | 2.0 | 4.3 | 0.51 | 51 |
| Peach | 9.5 | 8.4 | 1.5 | 2.0 | 4.8 | 0.47 | 57 |
| Pear | 15.5 | 9.8 | 6.2 | 2.8 | 0.8 | 0.67 | 8 |
| Pineapple | 13.1 | 9.9 | 2.1 | 1.7 | 6.0 | 0.52 | 61 |
| Plum | 11.4 | 9.9 | 3.1 | 5.1 | 1.6 | 0.40 | 16 |
| Strawberry | 7.68 | 4.89 | 2.441 | 1.99 | 0.47 | 0.55 | 10 |
| Vegetables | |||||||
| Beet, red | 9.6 | 6.8 | 0.1 | 0.1 | 6.5 | 0.50 | 96 |
| Carrot | 9.6 | 4.7 | 0.6 | 0.6 | 3.6 | 0.50 | 77 |
| Corn, sweet | 19.0 | 6.2 | 1.9 | 3.4 | 0.9 | 0.38 | 15 |
| Red pepper, sweet | 6.0 | 4.2 | 2.3 | 1.9 | 0.0 | 0.55 | 0 |
| Onion, sweet | 7.6 | 5.0 | 2.0 | 2.3 | 0.7 | 0.47 | 14 |
| Sweet potato | 20.1 | 4.2 | 0.7 | 1.0 | 2.5 | 0.47 | 60 |
| Yam | 27.9 | 0.5 | tr | tr | tr | na | tr |
| Sugar cane | 13–18 | 0.2–1.0 | 0.2–1.0 | 11–16 | 0.50 | high | |
| Sugar beet | 17–18 | 0.1–0.5 | 0.1–0.5 | 16–17 | 0.50 | high |
Production
[edit]Due to rising demand, sugar production in general increased some 14% over the period 2009 to 2018.[25] The largest importers were China, Indonesia, and the United States.[25]
Sugar
[edit]In 2022–2023 world production of sugar was 186 million tonnes, and in 2023–2024 an estimated 194 million tonnes — a surplus of 5 million tonnes, according to Ragus.[26]
Sugarcane
[edit]| Sugarcane production – 2022 (millions of tonnes) | |
|---|---|
| 724.4 | |
| 439.4 | |
| 103.4 | |
| 92.1 | |
| World | 1,922.1 |
| Source: FAO[27] | |
Sugar cane accounted for around 21% of the global crop production over the 2000–2021 period. The Americas was the leading region in the production of sugar cane (52% of the world total).[28] Global production of sugarcane in 2022 was 1.9 billion tonnes, with Brazil producing 38% of the world total and India 23% (table).
Sugarcane is any of several species, or their hybrids, of giant grasses in the genus Saccharum in the family Poaceae. They have been cultivated in tropical climates in the Indian subcontinent and Southeast Asia over centuries for the sucrose found in their stems.[6]

Sugar cane requires a frost-free climate with sufficient rainfall during the growing season to make full use of the plant's substantial growth potential. The crop is harvested mechanically or by hand, chopped into lengths and conveyed rapidly to the processing plant (commonly known as a sugar mill) where it is either milled and the juice extracted with water or extracted by diffusion.[30] The juice is clarified with lime and heated to destroy enzymes. The resulting thin syrup is concentrated in a series of evaporators, after which further water is removed. The resulting supersaturated solution is seeded with sugar crystals, facilitating crystal formation and drying.[30] Molasses is a by-product of the process and the fiber from the stems, known as bagasse,[30] is burned to provide energy for the sugar extraction process. The crystals of raw sugar have a sticky brown coating and either can be used as they are, can be bleached by sulfur dioxide, or can be treated in a carbonatation process to produce a whiter product.[30] About 2,500 litres (660 US gal) of irrigation water is needed for every one kilogram (2.2 pounds) of sugar produced.[31]
Sugar beet
[edit]| Sugar beet production – 2022 (millions of tonnes) | |
|---|---|
| 48.9 | |
| 31.5 | |
| 29.6 | |
| 28.2 | |
| World | 260 |
| Source: FAO[27] | |
In 2022, global production of sugar beets was 260 million tonnes, led by Russia with 18.8% of the world total (table).
Sugar beet became a major source of sugar in the 19th century when methods for extracting the sugar became available. It is a biennial plant,[32] a cultivated variety of Beta vulgaris in the family Amaranthaceae, the tuberous root of which contains a high proportion of sucrose. It is cultivated as a root crop in temperate regions with adequate rainfall and requires a fertile soil. The crop is harvested mechanically in the autumn and the crown of leaves and excess soil removed. The roots do not deteriorate rapidly and may be left in the field for some weeks before being transported to the processing plant where the crop is washed and sliced, and the sugar extracted by diffusion.[33] Milk of lime is added to the raw juice with calcium carbonate. After water is evaporated by boiling the syrup under a vacuum, the syrup is cooled and seeded with sugar crystals. The white sugar that crystallizes can be separated in a centrifuge and dried, requiring no further refining.[33]
Refining
[edit]Refined sugar is made from raw sugar that has undergone a refining process to remove the molasses.[34][35] Raw sugar is sucrose which is extracted from sugarcane or sugar beet. While raw sugar can be consumed, the refining process removes unwanted tastes and results in refined sugar or white sugar.[36][37]
The sugar may be transported in bulk to the country where it will be used and the refining process often takes place there. The first stage is known as affination and involves immersing the sugar crystals in a concentrated syrup that softens and removes the sticky brown coating without dissolving them. The crystals are then separated from the liquor and dissolved in water. The resulting syrup is treated either by a carbonatation or by a phosphatation process. Both involve the precipitation of a fine solid in the syrup and when this is filtered out, many of the impurities are removed at the same time. Removal of color is achieved by using either a granular activated carbon or an ion-exchange resin. The sugar syrup is concentrated by boiling and then cooled and seeded with sugar crystals, causing the sugar to crystallize out. The liquor is spun off in a centrifuge and the white crystals are dried in hot air and ready to be packaged or used. The surplus liquor is made into refiners' molasses.[38]
The International Commission for Uniform Methods of Sugar Analysis sets standards for the measurement of the purity of refined sugar, known as ICUMSA numbers; lower numbers indicate a higher level of purity in the refined sugar.[39]
Refined sugar is widely used for industrial needs for higher quality. Refined sugar is purer (ICUMSA below 300) than raw sugar (ICUMSA over 1,500).[40] The level of purity associated with the colors of sugar, expressed by standard number ICUMSA, the smaller ICUMSA numbers indicate the higher purity of sugar.[40]
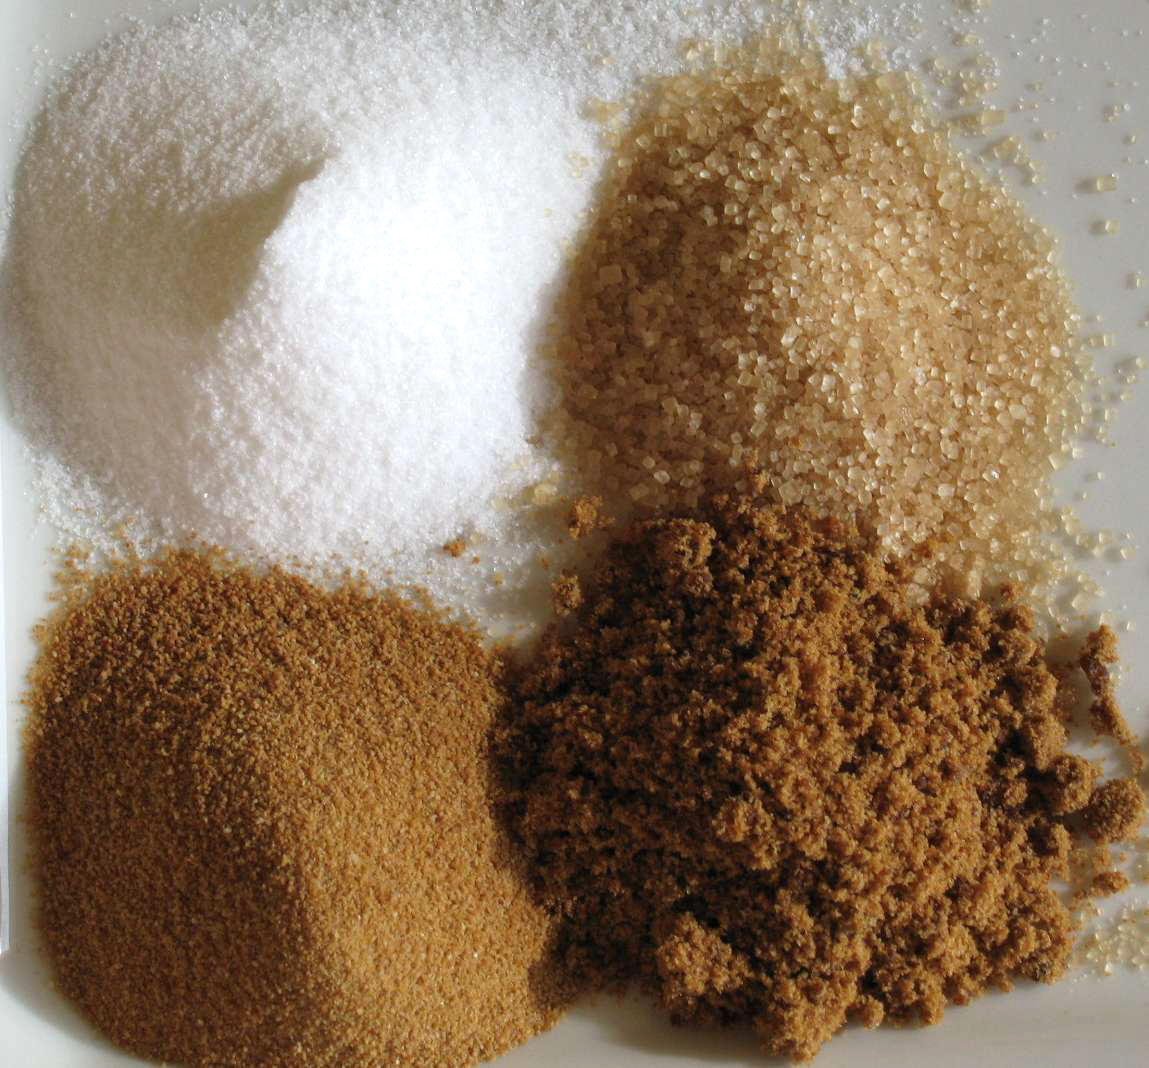
Forms and uses
[edit]Crystal size
[edit]

- Coarse-grain sugar, also known as sanding sugar, composed of reflective crystals with grain size of about 1 to 3 mm, similar to kitchen salt. Used atop baked products and candies, it will not dissolve when subjected to heat and moisture.[41]
- Granulated sugar (about 0.6 mm crystals), also known as table sugar or regular sugar, is used at the table, to sprinkle on foods and to sweeten hot drinks (coffee and tea), and in home baking to add sweetness and texture to baked products (cookies and cakes) and desserts (pudding and ice cream). It is also used as a preservative to prevent micro-organisms from growing and perishable food from spoiling, as in candied fruits, jams, and marmalades.[42]
- Milled sugars such as powdered sugar (icing sugar) are ground to a fine powder. They are used for dusting foods and in baking and confectionery.[43][41]
- Screened sugars such as caster sugar are crystalline products separated according to the size of the grains. They are used for decorative table sugars, for blending in dry mixes and in baking and confectionery.[43]
Densities
[edit]The densities of culinary sugars varies owing to differences in particle size and inclusion of moisture:[44]
- Beet sugar 0.80 g/mL
- Dextrose sugar 0.62 g/mL ( = 620 kg/m^3)
- Granulated sugar 0.70 g/mL
- Powdered sugar 0.56 g/mL
Shapes
[edit]
- Cube sugar (sometimes called sugar lumps) are white or brown granulated sugars lightly steamed and pressed together in block shape. They are used to sweeten drinks.[43]
- Sugarloaf was the usual cone-form in which refined sugar was produced and sold until the late 19th century.[45]
Brown sugars
[edit]
Brown sugars are granulated sugars, either containing residual molasses, or with the grains deliberately coated with molasses to produce a light- or dark-colored sugar such as muscovado and turbinado. They are used in baked goods, confectionery, and toffees.[43] Their darkness is due to the amount of molasses they contain. They may be classified based on their darkness or country of origin.[41]
Liquid sugars
[edit]
- Glucose syrup and corn syrup are widely used in the manufacture of foodstuffs. They manufactured from starch by enzymatic hydrolysis.[46] For example, corn syrup, which is produced commercially by breaking down maize starch, is one common source of purified dextrose.[47] Such syrups are use in producing beverages, hard candy, ice cream, and jams.[43]
- Inverted sugar syrup, commonly known as invert syrup or invert sugar, is a mixture of two simple sugars—glucose and fructose—that is made by heating granulated sugar in water. It is used in breads, cakes, and beverages for adjusting sweetness, aiding moisture retention and avoiding crystallization of sugars.[43]
- Molasses and treacle are obtained by removing sugar from sugarcane or sugar beet juice, as a byproduct of sugar production. They may be blended with the above-mentioned syrups to enhance sweetness and used in a range of baked goods and confectionery including toffees and licorice.[43]
- In winemaking, fruit sugars are converted into alcohol by a fermentation process. If the must formed by pressing the fruit has a low sugar content, additional sugar may be added to raise the alcohol content of the wine in a process called chaptalization. In the production of sweet wines, fermentation may be halted before it has run its full course, leaving behind some residual sugar that gives the wine its sweet taste.[48]
Burnt sugars and caramels
[edit]Heating sugar to near 200 °C for several minutes yields a product called burnt sugar. Often additives are used to modify the resulting caramels, e.g. alkali or sulfites. Several volatile products evolve in the heating process including butanone, several furans (2-Acetylfuran, furanone, hydroxymethyl furfural), and levoglucosan and more.[49]
Because sugars burn easily when exposed to flame, the handling of sugar powders risks dust explosion.[50] The 2008 Georgia sugar refinery explosion, which killed 14 people and injured 36, and destroyed most of the refinery, was caused by the ignition of sugar dust.[51]
Other sweeteners
[edit]- Low-calorie sweeteners are often made of maltodextrin with added sweeteners. Maltodextrin is an easily digestible synthetic polysaccharide consisting of short chains of three or more glucose molecules and is made by the partial hydrolysis of starch.[52] Strictly, maltodextrin is not classified as sugar as it contains more than two glucose molecules, although its structure is similar to maltose, a molecule composed of two joined glucose molecules.
- Polyols are sugar alcohols and are used in chewing gums where a sweet flavor is required that lasts for a prolonged time in the mouth.[53]
Consumption
[edit]Worldwide sugar provides 10% of the daily calories (based on a 2000 kcal diet).[54] In 1750, the average Briton got 72 calories a day from sugar. In 1913, this had risen to 395. In 2015, sugar still provided around 14% of the calories in British diets.[55] According to one source, per capita consumption of sugar in 2016 was highest in the United States, followed by Germany and the Netherlands.[56]
Nutrition and flavor
[edit]| Nutritional value per 100 g (3.5 oz) | |||||||||||||||||||||||||||||||||||||
|---|---|---|---|---|---|---|---|---|---|---|---|---|---|---|---|---|---|---|---|---|---|---|---|---|---|---|---|---|---|---|---|---|---|---|---|---|---|
| Energy | 1,576 kJ (377 kcal) | ||||||||||||||||||||||||||||||||||||
97.33 g | |||||||||||||||||||||||||||||||||||||
| Sugars | 96.21 g | ||||||||||||||||||||||||||||||||||||
| Dietary fiber | 0 g | ||||||||||||||||||||||||||||||||||||
0 g | |||||||||||||||||||||||||||||||||||||
0 g | |||||||||||||||||||||||||||||||||||||
| |||||||||||||||||||||||||||||||||||||
| Other constituents | Quantity | ||||||||||||||||||||||||||||||||||||
| Water | 1.77 g | ||||||||||||||||||||||||||||||||||||
| †Percentages estimated using US recommendations for adults,[57] except for potassium, which is estimated based on expert recommendation from the National Academies.[58] | |||||||||||||||||||||||||||||||||||||
| Nutritional value per 100 g (3.5 oz) | |||||||||||||||||||||
|---|---|---|---|---|---|---|---|---|---|---|---|---|---|---|---|---|---|---|---|---|---|
| Energy | 1,619 kJ (387 kcal) | ||||||||||||||||||||
99.98 g | |||||||||||||||||||||
| Sugars | 99.91 g | ||||||||||||||||||||
| Dietary fiber | 0 g | ||||||||||||||||||||
0 g | |||||||||||||||||||||
0 g | |||||||||||||||||||||
| |||||||||||||||||||||
| Other constituents | Quantity | ||||||||||||||||||||
| Water | 0.03 g | ||||||||||||||||||||
| †Percentages estimated using US recommendations for adults,[57] except for potassium, which is estimated based on expert recommendation from the National Academies.[58] | |||||||||||||||||||||
Brown and white granulated sugar are 97% to nearly 100% carbohydrates, respectively, with less than 2% water, and no dietary fiber, protein or fat (table).[59] Because brown sugar contains 5–10% molasses reintroduced during processing, its value to some consumers is a richer flavor than white sugar.[60]
Health effects
[edit]The World Health Organization and other clinical associations recommend that reducing the consumption of free sugar (sugar sources added during manufacturing) to less than 10% of total energy needs can help to lower disease risk.[2][3] This amount of sugar consumption is equivalent to about 50 g (1.8 oz) or 12 teaspoons of added sugar per day.[61] As of 2025[update], the American Heart Association recommends that free sugar intake be limited to 6% of total daily energy needs, or 36 g (1.3 oz) (9 teaspoons) for adult males, and 25 g (0.88 oz) (6 teaspoons) for women.[62] In many countries, the source and amount of added sugars can be viewed among ingredients on the labels of packaged foods.[62] Added sugars provide no nutritional benefit, but are a source of excess calories that can lead to overweight and increased disease risk.[2][3][61][62]
Obesity and metabolic syndrome
[edit]A 2003 technical report by the World Health Organization provided evidence that high intake of sugary drinks (including fruit juice) increases the risk of obesity by adding to overall energy intake.[63] By itself, sugar is not a factor causing obesity and metabolic syndrome, but rather its excessive consumption adds to caloric burden, which meta-analyses showed could increase the risk of developing type 2 diabetes and metabolic syndrome in adults and children.[64][65]
Cancer
[edit]Sugar consumption does not directly cause cancer.[66][67][68] Cancer Council Australia have stated that "there is no evidence that consuming sugar makes cancer cells grow faster or cause cancer".[66] There is an indirect relationship between sugar consumption and obesity-related cancers through increased risk of excess body weight.[68][66][69]
The American Institute for Cancer Research and World Cancer Research Fund recommend that people limit sugar consumption.[70][71]
There is a popular misconception that cancer can be treated by reducing sugar and carbohydrate intake to supposedly "starve" tumours. In reality, the health of people with cancer is best served by maintaining a healthy diet.[72]
Cognition
[edit]Despite some studies suggesting that sugar consumption causes hyperactivity, the quality of evidence is low[73] and it is generally accepted within the scientific community that the notion of children's 'sugar rush' is a myth.[74][75] A 2019 meta-analysis found that sugar consumption does not improve mood, but can lower alertness and increase fatigue within an hour of consumption.[76] One review of low-quality studies of children consuming high amounts of energy drinks showed association with higher rates of unhealthy behaviors, including smoking and excessive alcohol use, and with hyperactivity and insomnia, although such effects could not be specifically attributed to sugar over other components of those drinks such as caffeine.[77]
Tooth decay
[edit]The WHO, Action on Sugar and the Scientific Advisory Committee on Nutrition (SACN) state dental caries, also known as tooth decay/cavities, "can be prevented by avoiding dietary free sugars".[3][78][79][80]
A review of human studies showed that the incidence of caries is lower when sugar intake is less than 10% of total energy consumed.[81] Sugar-sweetened beverage consumption is associated with an increased risk of tooth decay.[82]
Nutritional displacement
[edit]The "empty calories" argument states that a diet high in added (or 'free') sugars will reduce consumption of foods that contain essential nutrients.[83] This nutrient displacement occurs if sugar makes up more than 25% of daily energy intake,[84] a proportion associated with poor diet quality and risk of obesity.[3] Displacement may occur at lower levels of consumption.[84]
Recommended dietary intake
[edit]The WHO recommends that both adults and children reduce the intake of free sugars to less than 10% of total energy intake.[3] "Free sugars" include monosaccharides and disaccharides added to foods, and sugars found in fruit juice and concentrates, as well as in honey and syrups.[3][62]
On 20 May 2016, the U.S. Food and Drug Administration announced changes to the Nutrition Facts panel displayed on all foods, to be effective by July 2018. New to the panel is a requirement to list "added sugars" by weight and as a percent of Daily Value (DV). For vitamins and minerals, the intent of DVs is to indicate how much should be consumed. For added sugars, the guidance is that 100% DV should not be exceeded. 100% DV is defined as 50 grams. For a person consuming 2000 calories a day, 50 grams is equal to 200 calories and thus 10% of total calories—the same guidance as the WHO.[85] To put this in context, most 12-US-fluid-ounce (355 ml) cans of soda contain 39 grams of sugar. In the United States, a government survey on food consumption in 2013–2014 reported that, for men and women aged 20 and older, the average total sugar intakes—naturally occurring in foods and added—were, respectively, 125 and 99 grams per day.[86] The American Heart Association recommends even lower daily consumption of added sugars: 36 grams for men, and 25 grams for women.[62]
Society and culture
[edit]Manufacturers of sugary products, such as soft drinks and candy, and the Sugar Research Foundation have been accused of trying to influence consumers and medical associations in the 1960s and 1970s by creating doubt about the potential health hazards of sucrose overconsumption, while promoting saturated fat as the main dietary risk factor in cardiovascular diseases.[87] In 2016, the criticism led to recommendations that diet policymakers emphasize the need for high-quality research that accounts for multiple biomarkers on development of cardiovascular diseases.[87]
Originally, no sugar was white; anthropologist Sidney Mintz writes that white likely became understood as the ideal after groups who associated the color white with purity transferred their value to sugar.[88] In India, sugar frequently appears in religious observances. For ritual purity, such sugar cannot be white.[88]
Gallery
[edit]-
 Brown sugar crystals
 -
 Whole date sugar
 -
 Whole cane sugar (grey), vacuum-dried
 -
 Whole cane sugar (brown), vacuum-dried
 -
 Raw crystals of unrefined, unbleached sugar


See also
[edit]- Barley sugar – Boiled sweet made from barley
- Blood sugar level – Concentration of glucose present in the blood (Glycaemia)
- Caramelization – Process of liquifying sugar
- Glycemic load – Estimate of how a quantity of food will raise a blood glucose level
- Glycome – Set of all sugars, free or bound, in an organism
- Insulin – Peptide hormone
- List of unrefined sweeteners
References
[edit]- ^ "OECD-FAO Agricultural Outlook 2020–2029 – Sugar" (PDF). Food and Agriculture Organization. 2019. Archived (PDF) from the original on 17 April 2021. Retrieved 15 February 2021.
- ^ a b c Huang Y, Chen Z, Chen B, et al. (April 2023). "Dietary sugar consumption and health: umbrella review". BMJ. 381 e071609. doi:10.1136/bmj-2022-071609. PMC 10074550. PMID 37019448.
- ^ a b c d e f g "Guideline: Sugars Intake for Adults and Children". World Health Organization; Executive Summary by the US National Library of Medicine. 2015. Retrieved 3 October 2025.
- ^ Harper D. "Sugar". Online Etymology Dictionary.
- ^ "Jaggery". Oxford Dictionaries. Archived from the original on 1 October 2012. Retrieved 17 August 2012.
- ^ a b Roy Moxham (7 February 2002). The Great Hedge of India: The Search for the Living Barrier that Divided a People. Basic Books. ISBN 978-0-7867-0976-2.
- ^ Kiple KF, Kriemhild Conee Ornelas. World history of Food – Sugar. Cambridge University Press. Archived from the original on 23 January 2012. Retrieved 9 January 2012.
{{cite book}}: CS1 maint: overridden setting (link) - ^ Sharpe, Peter (1998). "Sugar Cane: Past and Present". Illinois: Southern Illinois University. Archived from the original on 10 July 2011.
- ^ Rolph G (1873). Something about sugar: its history, growth, manufacture and distribution. San Francisco: J.J. Newbegin.
- ^ Faas P, Whiteside S (2005). Around the Roman Table: Food and Feasting in Ancient Rome. University of Chicago Press. p. 149. ISBN 978-0-226-23347-5.
- ^ Antonio Benítez Rojo (1996). The Repeating: The Caribbean and the Postmodern Perspective. James E. Maraniss (translation). Duke University Press. p. 93. ISBN 0-8223-1865-2.
- ^ "Andreas Sigismund Marggraf | German chemist". Encyclopædia Britannica. Archived from the original on 29 March 2020.
- ^ Marggraf (1747). "Experiences chimiques faites dans le dessein de tirer un veritable sucre de diverses plantes, qui croissent dans nos contrées" [Chemical experiments made with the intention of extracting real sugar from diverse plants that grow in our lands]. Histoire de l'académie royale des sciences et belles-lettres de Berlin (in French). pp. 79–90. Archived from the original on 31 December 2022.
- ^ a b "Festveranstaltung zum 100 jährigen Bestehen des Berliner Institut für Zuckerindustrie". Technische Universität Berlin. 23 November 2004. Archived from the original on 24 August 2007.
- ^ a b Mintz S (1986). Sweetness and Power: The Place of Sugar in Modern History. Penguin. ISBN 978-0-14-009233-2.
- ^ a b c d Buss D, Robertson, Jean (1976). Manual of Nutrition; Ministry of Agriculture, Fisheries and Food. London: Her Majesty's Stationery Office. pp. 5–9.
- ^ Kretchmer N, Claire B. Hollenbeck (1991). Sugars and Sweeteners. CRC Press, Inc. ISBN 978-0-8493-8835-4.
- ^ Raven PH, George B. Johnson (1995). Carol J. Mills (ed.). Understanding Biology (3rd ed.). WM C. Brown. p. 203. ISBN 978-0-697-22213-8.
- ^ Teller GL (January 1918). "Sugars Other Than Cane or Beet". The American Food Journal: 23–24. Archived from the original on 15 April 2023. Retrieved 19 March 2023.
- ^ Pigman W, Horton, D. (1972). Pigman and Horton (ed.). The Carbohydrates: Chemistry and Biochemistry Vol 1A (2nd ed.). San Diego: Academic Press. pp. 1–67. ISBN 978-0-12-556352-9.
- ^ Lactase at the Encyclopædia Britannica
- ^ Maltase at the Encyclopædia Britannica
- ^ Sucrase at the Encyclopædia Britannica
- ^ Use link to FoodData Central (USDA) and then search for the particular food, and click on "SR Legacy Foods".
- ^ a b "Sugar: World Markets and Trade" (PDF). Foreign Agricultural Service, US Department of Agriculture. November 2017. Archived (PDF) from the original on 23 November 2018. Retrieved 20 May 2018.
- ^ Eastick B (4 April 2024). "Global sugar market report April 2024". Ragus. Retrieved 15 January 2025.
- ^ a b "Sugar beet production in 2022, Crops/Regions/World list/Production Quantity/Year (pick lists)". UN Food and Agriculture Organization, Corporate Statistical Database (FAOSTAT). 2024. Retrieved 10 June 2024.
- ^ World Food and Agriculture – Statistical Yearbook 2023. Food and Agriculture Organization. 2023. doi:10.4060/cc8166en. ISBN 978-92-5-138262-2.
- ^ World Food and Agriculture – Statistical Yearbook 2021. Food and Agriculture Organization. 2021. doi:10.4060/cb4477en. ISBN 978-92-5-134332-6. S2CID 240163091. Archived from the original on 3 November 2021. Retrieved 13 December 2021 – via www.fao.org.
- ^ a b c d "How Cane Sugar is Made – the Basic Story". Sugar Knowledge International. Archived from the original on 22 September 2018. Retrieved 24 September 2018.
- ^ Flynn K (23 April 2016). "India Drought 2016 May Lead 29–35% Drop In Sugar Output For 2016–17 Season: Report". International Business Times. Archived from the original on 9 October 2016. Retrieved 27 October 2016.
- ^ "Biennial beet". GMO Compass. Archived from the original on 2 February 2014. Retrieved 26 January 2014.
- ^ a b "How Beet Sugar is Made". Sugar Knowledge International. Archived from the original on 21 March 2012. Retrieved 22 March 2012.
- ^ "Tantangan Menghadapi Ketergantungan Impor Gula Rafinasi" (in Indonesian). Asosiasi Gula Rafinasi Indonesia. Archived from the original on 13 April 2014. Retrieved 9 April 2014.
- ^ "Rafinasi Vs Gula Kristal Putih" (in Indonesian). Kompas Gramedia. 29 July 2011. Archived from the original on 13 April 2014. Retrieved 9 April 2014.
- ^ "Refining and Processing Sugar" (PDF). The Sugar Association. Archived from the original (PDF) on 21 February 2015. Retrieved 16 April 2014.
- ^ Pakpahan, Agus, Supriono, Agus, eds. (2005). "Bagaimana Gula Dimurnikan – Proses Dasar". Ketika Tebu Mulai Berbunga (in Indonesian). Bogor: Sugar Observer. ISBN 978-979-99311-0-8.
- ^ "How Sugar is Refined". SKIL. Archived from the original on 22 March 2012. Retrieved 22 March 2012.
- ^ Deulgaonkar A (12–25 March 2005). "A case for reform". Frontline. 22 (8). Archived from the original on 28 July 2011.
- ^ a b Pakpahan, Agus, Supriono, Agus, eds. (2005). "Industri Rafinasi Kunci Pembuka Restrukturisasi Industri Gula Indonesia". Ketika Tebu Mulai Berbunga (in Indonesian). Bogor: Sugar Observer. pp. 70–72. ISBN 978-979-99311-0-8.
- ^ a b c "Sugar types". The sugar association. Archived from the original on 6 January 2020. Retrieved 23 September 2019.
- ^ "Types and uses". Sugar Nutrition UK. Archived from the original on 5 August 2012. Retrieved 23 March 2012.
- ^ a b c d e f g "The journey of sugar". British Sugar. Archived from the original on 26 March 2011. Retrieved 23 March 2012.
- ^ "Engineering Resources – Bulk Density Chart". Powder and Bulk. Archived from the original on 27 October 2002.
- ^ David E (1977). English Bread and Yeast Cookery. Penguin Books. p. 139.
- ^ Schenck, Fred W. "Glucose and Glucose-Containing Syrups". Ullmann's Encyclopedia of Industrial Chemistry. Weinheim: Wiley-VCH. doi:10.1002/14356007.a12_457.pub2. ISBN 978-3-527-30673-2.
- ^ "Code of Federal Regulations Title 21". AccessData, US Food and Drug Administration. Archived from the original on 6 September 2020. Retrieved 12 September 2020.
- ^ Robinson J (2006). The Oxford Companion to Wine (3rd ed.). Oxford University Press. pp. 665–66. ISBN 978-0-19-860990-2.
- ^ Schiweck H, Clarke M, Pollach G (2007). "Sugar". Ullmann's Encyclopedia of Industrial Chemistry. doi:10.1002/14356007.a25_345.pub2. ISBN 978-3-527-30385-4.
- ^ Edwards WP (9 November 2015). The Science of Sugar Confectionery. Royal Society of Chemistry. p. 120. ISBN 978-1-78262-609-1.
- ^ "CSB Releases New Safety Video, "Inferno: Dust Explosion at Imperial Sugar"". U.S. Chemical Safety and Hazard Investigation Board. Washington, D.C. 7 October 2009. Archived from the original on 24 April 2020. Retrieved 17 May 2021.
- ^ Hofman DL, Van Buul VJ, Brouns FJ (2015). "Nutrition, Health, and Regulatory Aspects of Digestible Maltodextrins". Critical Reviews in Food Science and Nutrition. 56 (12): 2091–2100. doi:10.1080/10408398.2014.940415. PMC 4940893. PMID 25674937.
- ^ European Parliament and Council (1990). "Council Directive on nutrition labelling for foodstuffs". Council Directive of 24 September 1990 on nutrition labelling for foodstuffs. p. 4. Archived from the original on 3 October 2011. Retrieved 28 September 2011.
- ^ "Food Balance Sheets". Food and Agriculture Organization of the United Nations. 2007. Archived from the original on 9 October 2016. Retrieved 28 March 2012.
- ^ Otter C (2020). Diet for a large planet. USA: University of Chicago Press. p. 22. ISBN 978-0-226-69710-9.
- ^ Amber Pariona (25 April 2017). "Top Sugar Consuming Nations In The World". World Atlas. Archived from the original on 22 June 2022. Retrieved 20 May 2018.
- ^ a b United States Food and Drug Administration (2024). "Daily Value on the Nutrition and Supplement Facts Labels". FDA. Archived from the original on 27 March 2024. Retrieved 28 March 2024.
- ^ a b "TABLE 4-7 Comparison of Potassium Adequate Intakes Established in This Report to Potassium Adequate Intakes Established in the 2005 DRI Report". p. 120. In: Stallings VA, Harrison M, Oria M, eds. (2019). "Potassium: Dietary Reference Intakes for Adequacy". Dietary Reference Intakes for Sodium and Potassium. pp. 101–124. doi:10.17226/25353. ISBN 978-0-309-48834-1. PMID 30844154. NCBI NBK545428.
- ^ "Sugars, granulated (sucrose) in 4 grams (from pick list)". Conde Nast for the USDA National Nutrient Database, version SR-21. 2014. Archived from the original on 7 March 2015. Retrieved 13 May 2017.
- ^ O'Connor, Anahad (12 June 2007). "The Claim: Brown Sugar Is Healthier Than White Sugar". The New York Times. Archived from the original on 13 May 2017. Retrieved 13 May 2017.
- ^ a b "Sugar and diabetes". Diabetes Canada. 2025. Retrieved 3 October 2025.
- ^ a b c d e "Added sugars". American Heart Association. 2025. Retrieved 3 October 2025.
- ^ Joint WHO/FAO Expert Consultation (2003). "WHO Technical Report Series 916: Diet, Nutrition and the Prevention of Chronic Diseases" (PDF). Archived (PDF) from the original on 25 June 2016. Retrieved 25 December 2013.
- ^ Malik VS, Popkin BM, Bray GA, et al. (2010). "Sugar-Sweetened Beverages and Risk of Metabolic Syndrome and Type 2 Diabetes: A meta-analysis". Diabetes Care. 33 (11): 2477–83. doi:10.2337/dc10-1079. PMC 2963518. PMID 20693348.
- ^ Malik VS, Pan A, Willett WC, et al. (1 October 2013). "Sugar-sweetened beverages and weight gain in children and adults: a systematic review and meta-analysis". The American Journal of Clinical Nutrition. 98 (4): 1084–1102. doi:10.3945/ajcn.113.058362. ISSN 0002-9165. PMC 3778861. PMID 23966427.
- ^ a b c "Does sugar cause cancer?". Cancer Council Australia. 2021. Archived from the original on 28 March 2024.
- ^ "Does Sugar Cause Cancer?". American Society of Clinical Oncology. 2021. Archived from the original on 1 October 2023.
- ^ a b "Sugar and cancer – what you need to know". Cancer Research UK. 2023. Archived from the original on 6 January 2024.
- ^ "The Sugar and Cancer Connection". American Institute for Cancer Research. 2016. Archived from the original on 20 January 2024.
- ^ "Curbing global sugar consumption" (PDF). World Cancer Research Fund International. 2015. Archived (PDF) from the original on 29 March 2024.
- ^ Clinton SK, Giovannucci EL, Hursting SD (2020). "The World Cancer Research Fund/American Institute for Cancer Research Third Expert Report on Diet, Nutrition, Physical Activity, and Cancer: Impact and Future Directions". The Journal of Nutrition. 150 (4): 663–671. doi:10.1093/jn/nxz268. PMC 7317613. PMID 31758189.
- ^ Grimes DR, O'Riordan E (November 2023). "Starving cancer and other dangerous dietary misconceptions". Lancet Oncol. 24 (11): 1177–1178. doi:10.1016/S1470-2045(23)00483-7. PMID 37922928.
- ^ Del-Ponte B, Quinte GC, Cruz S, et al. (2019). "Dietary patterns and attention deficit/hyperactivity disorder (ADHD): A systematic review and meta-analysis". Journal of Affective Disorders. 252: 160–173. doi:10.1016/j.jad.2019.04.061. hdl:10923/18896. PMID 30986731.
- ^ Mantantzis K, Schlaghecken F, Sünram-Lea SI, et al. (1 June 2019). "Sugar rush or sugar crash? A meta-analysis of carbohydrate effects on mood". Neuroscience & Biobehavioral Reviews. 101: 45–67. doi:10.1016/j.neubiorev.2019.03.016. ISSN 0149-7634. PMID 30951762.
- ^ Wolraich ML (22 November 1995). "The Effect of Sugar on Behavior or Cognition in Children: A Meta-analysis". JAMA. 274 (20): 1617–1621. doi:10.1001/jama.1995.03530200053037. ISSN 0098-7484. PMID 7474248.
- ^ Mantantzis K, Schlaghecken F, Sünram-Lea SI, et al. (1 June 2019). "Sugar rush or sugar crash? A meta-analysis of carbohydrate effects on mood" (PDF). Neuroscience and Biobehavioral Reviews. 101: 45–67. doi:10.1016/j.neubiorev.2019.03.016. PMID 30951762. S2CID 92575160. Archived (PDF) from the original on 6 May 2020. Retrieved 30 April 2020.
- ^ Visram S, Cheetham M, Riby DM, et al. (1 October 2016). "Consumption of energy drinks by children and young people: a rapid review examining evidence of physical effects and consumer attitudes". BMJ Open. 6 (10) e010380. doi:10.1136/bmjopen-2015-010380. ISSN 2044-6055. PMC 5073652. PMID 27855083.
- ^ "Sugars and dental caries". World Health Organization. 2017. Archived from the original on 11 August 2024.
- ^ "Sugars and tooth decay". Action on Sugar. 2019. Archived from the original on 24 July 2024.
- ^ "SACN Carbohydrates and Health Report". Public Health England. 2015. Archived from the original on 21 August 2024.
- ^ Moynihan PJ, Kelly SA (2014). "Effect on Caries of Restricting Sugars Intake: Systematic Review to Inform WHO Guidelines". Journal of Dental Research. 93 (1): 8–18. doi:10.1177/0022034513508954. PMC 3872848. PMID 24323509.
- ^ Valenzuela MJ, Waterhouse B, Aggarwal VR, et al. (2021). "Effect of sugar-sweetened beverages on oral health: a systematic review and meta-analysis". Eur J Public Health. 31 (1): 122–129. doi:10.1093/eurpub/ckaa147. PMID 32830237.
- ^ Marriott BP, Olsho L, Hadden L, et al. (2010). "Intake of added sugars and selected nutrients in the United States, National Health and Nutrition Examination Survey (NHANES) 2003–2006". Crit Rev Food Sci Nutr. 50 (3): 228–58. doi:10.1080/10408391003626223. PMID 20301013. S2CID 205689533.
- ^ a b Panel on Macronutrients, Panel on the Definition of Dietary Fiber, Subcommittee on Upper Reference Levels of Nutrients, et al. (2005). Dietary reference intakes for energy, carbohydrate, fiber, fat, fatty acids, cholesterol, protein, and amino acids. Washington, DC: National Academies Press. ISBN 978-0-309-08525-0. Retrieved 4 December 2018.
Although there were insufficient data to set a UL [Tolerable Upper Intake Levels] for added sugars, a maximal intake level of 25 percent or less of energy is suggested to prevent the displacement of foods that are major sources of essential micronutrients
- ^ Nutrition Cf (22 February 2021). "Labeling & Nutrition – Changes to the Nutrition Facts Label". www.fda.gov. Archived from the original on 1 November 2014. Retrieved 10 March 2017.
- ^ What We Eat In America, NHANES 2013–2014 Archived 24 February 2017 at the Wayback Machine.
- ^ a b Kearns CE, Schmidt LA, Glantz SA (2016). "Sugar Industry and Coronary Heart Disease Research: A Historical Analysis of Internal Industry Documents". JAMA Internal Medicine. 176 (11): 1680–85. doi:10.1001/jamainternmed.2016.5394. PMC 5099084. PMID 27617709.
- ^ a b Mintz S (2015). "Foreword". In Goldstein D (ed.). The Oxford Companion to Sugar and Sweets. Oxford University Press. ISBN 978-0-19-931339-6.
Sources
[edit]![]() This article incorporates text from a free content work. Licensed under CC BY-SA IGO 3.0 (license statement/permission). Text taken from World Food and Agriculture – Statistical Yearbook 2023, FAO, FAO.
This article incorporates text from a free content work. Licensed under CC BY-SA IGO 3.0 (license statement/permission). Text taken from World Food and Agriculture – Statistical Yearbook 2023, FAO, FAO.
Further reading
[edit]- Barrett, Duncan, Calvi, Nuala (2012). The Sugar Girls. Collins. ISBN 978-0-00-744847-0.
- Chisholm H, ed. (1911). . Encyclopædia Britannica (11th ed.). Cambridge University Press.
- Frankopan, Peter, The Silk Roads: A New History of the World, 2016, Bloomsbury, ISBN 9781408839997
- Saulo, Aurora A. (March 2005). "Sugars and Sweeteners in Foods" (PDF). College of Tropical Agriculture and Human Resources.
- Strong, Roy (2002), Feast: A History of Grand Eating, Jonathan Cape, ISBN 0224061380
External links
[edit]- Sugar at the National Health Service
Sugar as food commodity | |||||||||
|---|---|---|---|---|---|---|---|---|---|
| Chemistry | |||||||||
| Sources | |||||||||
| Products |
| ||||||||
| Industry |
| ||||||||
| History |
| ||||||||
| Culture | |||||||||
| Related | |||||||||
| Research | |||||||||
Types of carbohydrates | |||||||||||||||
|---|---|---|---|---|---|---|---|---|---|---|---|---|---|---|---|
| General | |||||||||||||||
| Geometry | |||||||||||||||
| Monosaccharides |
| ||||||||||||||
| Multiple |
| ||||||||||||||
Sugar
View on GrokipediaEtymology and Terminology
Linguistic Origins
The English word "sugar" derives from the late 13th-century Middle English sugre, borrowed from Old French sucre (attested around 1100 CE), which in turn came from Medieval Latin succarum or zucchara.[6] This Latin form originated from Arabic sukkar (سُكَّر), introduced to Europe via Islamic trade routes during the medieval period.[7] The Arabic term itself traces to Middle Persian šakar, reflecting the commodity's transmission westward from ancient India.[6] At its linguistic root, šakar stems from Sanskrit śarkarā (शर्करा), an ancient Indo-Aryan term meaning "grit," "pebble," or "gravel," which described the coarse, crystalline granules produced from sugarcane juice—a reference to the substance's texture rather than its sweetness.[8] This etymon appears in Vedic texts as early as 1500–1200 BCE, where śarkarā denoted a sandy or ground product, evolving to specifically signify refined sugar by the time of classical Sanskrit literature around 500 BCE.[7] The word's path illustrates phonetic adaptations across language families: from Indo-European Sanskrit through Indo-Iranian Persian to Semitic Arabic, with minimal semantic shift focused on the material's granular form.[6] Cognates persist in modern languages, such as Italian zucchero, Spanish azúcar, and Portuguese açúcar, all retaining the Arabic-influenced al-sukkar prefix meaning "the sugar."[8] In contrast, Germanic and Slavic terms like German Zucker or Russian saharnый followed similar borrowings, underscoring sugar's role as a traded luxury that disseminated its nomenclature globally before widespread industrialization.[6] Claims of alternative origins, such as a direct Chinese derivation from Sha-Che ("sand-sugar plant"), lack corroboration in primary linguistic reconstructions and contradict the documented Indo-European-to-Semitic trajectory supported by comparative philology.[7]Scientific and Common Definitions
In common usage, sugar refers to sucrose, the disaccharide extracted primarily from sugarcane (Saccharum officinarum) or sugar beets (Beta vulgaris), refined into white crystals or powder for use as a sweetener in foods and beverages.[9] Sucrose constitutes the majority of added sugars in diets, appearing as colorless crystals with a sweet taste and high solubility in water.[1] This refined form, often termed table sugar, provides approximately 4 kilocalories per gram and is ubiquitous in processed products.[10] Scientifically, sugar denotes a subset of carbohydrates—specifically, monosaccharides and disaccharides—that are sweet-tasting, soluble in water, and capable of forming crystals.[11] These compounds consist of carbon, hydrogen, and oxygen atoms, typically in a ratio approximating , and serve as energy sources in biological systems.[10] Monosaccharides, the simplest sugars, include glucose (), the primary cellular fuel, and fructose, found in fruits; disaccharides like sucrose () form by condensation of two monosaccharides, with sucrose comprising one glucose and one fructose unit linked by a glycosidic bond.[1][12] Sucrose, the archetypal sugar, has a molecular weight of 342.30 g/mol, melts at 186°C, and decomposes before fully liquefying, exhibiting non-reducing properties due to the absence of free anomeric carbons.[1] In broader biochemical classification, sugars exclude longer-chain polysaccharides like starch, focusing on those yielding 1–2 monosaccharide units upon hydrolysis.[12] This distinction underscores sugars' rapid digestibility compared to complex carbohydrates.[11]Historical Development
Prehistoric to Ancient Civilizations
Prior to the widespread cultivation of sugarcane, honey served as the primary natural sweetener for prehistoric humans, with archaeological evidence indicating its collection and use dating back thousands of years. Residues of beeswax in pottery fragments from the Nok culture in Nigeria provide the oldest direct evidence of honey hunting in Africa, around 1500 BCE, suggesting it was a valued resource for its sweetness and caloric content.[13] In Europe and the Near East, cave paintings and artifacts from the Paleolithic era depict early interactions with bees, implying honey's role in diets before agriculture.[14] Sugarcane (Saccharum officinarum) originated from wild species like S. robustum and was first domesticated in New Guinea approximately 8,000 to 10,000 years ago by Papuan peoples, who chewed the stalks for their sweet juice.[15] This practice marked an early form of sugar consumption, though extraction and refining techniques had not yet developed.[16] Austronesian voyagers spread sugarcane to Polynesia, Island Melanesia, and Madagascar in prehistoric migrations, facilitating its dissemination across the Pacific.[17] By around 1000 BCE, sugarcane reached the Indian subcontinent, where it became integral to ancient agriculture and early processing methods.[18] In India, the Sanskrit term śarkarā referred to granular sugar derived from boiled cane juice, with evidence of crystallization emerging by 500 BCE through evaporation and cooling techniques that produced crude forms like khanda (jaggery).[19] Ancient Indian texts, such as those from the Vedic period, document sugarcane cultivation in regions like Bihar, predating large-scale refinement but indicating its use in rituals and medicine.[20] The knowledge of sugarcane spread westward to Persia following Darius I's invasion of India in 510 BCE, introducing the plant as a novel crop yielding "reeds that produce honey without bees."[21] Alexander the Great's armies encountered sugarcane during their 326 BCE campaign in the Punjab, with soldiers noting its sweetness, though it remained a rarity in the Mediterranean world.[22] In ancient China, sugarcane appears in records from the Warring States period (475–221 BCE), cultivated primarily for juice extraction rather than refined sugar.[23] Across these civilizations, sugar was valued more as a medicinal substance or luxury than a staple, limited by labor-intensive harvesting and absence of mechanized processing.[24]Medieval Expansion and Trade
During the early medieval period, Arab expansions facilitated the widespread cultivation of sugarcane (Saccharum officinarum) across the Mediterranean, building on techniques refined in Persia and India. Following conquests beginning in the 7th century, sugarcane was introduced to regions including Sicily, Cyprus, Malta, and the Barbary Coast, where irrigation systems and agricultural innovations enabled viable production in these semi-arid environments.[25] In Sicily under Muslim rule from the 9th century, sugarcane fields expanded significantly, supported by water mills for crushing cane and boiling houses for extracting syrup, marking the industry's shift from localized Asian practices to large-scale Mediterranean output.[26] Production involved harvesting mature cane, juice extraction via animal- or water-powered mills, clarification with lime, and crystallization in molds to yield raw sugar loaves, a labor-intensive process that yielded about 1-2% refined sugar by weight from the cane.[27] By the 10th century, sugar emerged as a high-value export from Islamic territories, traded northward to Europe as a medicinal spice and luxury commodity, often commanding prices equivalent to gold by weight. Venetian merchants established early import records dating to 966 AD, sourcing refined sugar from Levantine ports like Tripoli and Beirut, while Genoa and Pisa competed in shipments from Cyprus and Sicily.[28] Italian city-states dominated this trade through naval prowess and treaties, with Venice securing preferential access via alliances with Mamluk Egypt, effectively monopolizing distribution to northern Europe and inflating prices through tariffs and scarcity—up to 10 times the cost of honey.[27] In Cyprus, production peaked in the 14th century under Lusignan rule, with dozens of mills processing cane for export, though yields remained limited by marginal soils and reliance on slave labor, producing an estimated several hundred tons annually at height.[29] The Crusades (1095–1291) accelerated knowledge transfer, as European knights encountered sugar refineries in the Levant, spurring demand and investment in Mediterranean plantations; however, political upheavals like the Reconquista in Spain and Sicily's Norman-Arab transitions disrupted local output by the late 13th century, foreshadowing the industry's migration to Atlantic islands.[30] Trade volumes grew modestly, with Venetian convoys transporting thousands of pounds yearly, but sugar's status as "white gold" persisted due to inefficient yields—requiring 2-3 tons of cane per hundredweight of loaf sugar—and vulnerability to frost, confining viable cultivation to coastal enclaves.[31] This era's commerce laid foundational routes for sugar's later transatlantic scaling, intertwining economic incentives with colonial ambitions.[32]Industrialization and Modern Scaling
The industrialization of sugar production transitioned from small-scale, labor-intensive extraction to factory-based processing, driven by technological breakthroughs in both cane and beet refining during the late 18th and 19th centuries. In 1747, German chemist Andreas Sigismund Marggraf extracted sucrose from beets, proving it chemically identical to cane sugar and laying the groundwork for alternative sources independent of tropical imports.[33] His protégé, Franz Karl Achard, advanced this by constructing the first industrial beet sugar refinery in 1801 at Cunern, Silesia (modern Poland), where it processed beets into crystallized sugar, albeit at low initial efficiency of about 4% from 400 tons annually.[26][34] Napoleonic blockades on cane imports from 1806 spurred European governments to invest in beet factories, with France establishing its first viable plant in 1811 and expanding to over 40 by 1815 to achieve self-sufficiency.[24] For sugarcane, which dominated earlier colonial production, 19th-century innovations mechanized refining and reduced costs. The centrifugal separator, introduced in the 1840s, rapidly separated massecuite into raw sugar and molasses, replacing slower manual methods and enabling higher throughput in Caribbean and Louisiana mills.[35] In 1846, inventor Norbert Rillieux patented the multiple-effect vacuum evaporator, which reused steam across evaporators under vacuum to concentrate juice at lower temperatures, cutting fuel consumption by up to 80% and minimizing sugar inversion.[36] These efficiencies, combined with steam-powered mills and rail transport, scaled output; U.S. beet sugar factories emerged in California by the 1870s, while cane plantations mechanized harvesting in the early 1900s.[18] Modern scaling post-World War II leveraged agricultural revolutions, with hybrid sugarcane varieties boosting yields from 30-40 tons per hectare in the 1950s to over 80 tons today in leading regions.[37] Global production hit record highs, forecasted at 189.3 million metric tons for 2024/25, up 8.6 million tons from prior years, driven by expanded acreage and processing capacity.[3] Brazil leads with over 30% of output, producing around 40 million tons annually from vast Centro-Sul plantations optimized for both sugar and ethanol via integrated biorefineries.[38] India and Thailand follow, with India's output nearing 30 million tons amid government mandates for ethanol blending, while Thailand excels in efficiency through mechanized wet-season harvesting.[39] Beet sugar persists in temperate zones like the EU and U.S., comprising about 20-25% of totals, supported by crop rotations and subsidies.[3] Contemporary advancements include precision agriculture with AI for yield forecasting, genetic engineering for drought-resistant varieties, and automated factories using continuous centrifuges and Industry 4.0 controls to minimize waste and energy use.[40][41] These technologies have enabled co-products like bagasse-derived power, with Brazilian mills generating surplus electricity for grids, further incentivizing scale.[42] Despite volatility from weather and trade policies, production continues expanding in Asia and South America, outpacing consumption growth of 1-2% annually.[3]Chemical Composition
Monosaccharides and Building Blocks
Monosaccharides, also known as simple sugars, are the fundamental units of carbohydrates, characterized by a single polyhydroxylated aldehyde or ketone chain that cannot be further hydrolyzed by enzymatic action. They typically follow the empirical formula , where ranges from 3 to 7, with hexoses () being predominant in dietary sugars.[43] These molecules exist predominantly in cyclic forms in solution, such as pyranose or furanose rings, due to intramolecular reactions between the carbonyl group and a hydroxyl group.[44] The most prevalent monosaccharides in common sugars include glucose, fructose, and galactose, all aldo- or ketohexoses with the molecular formula . Glucose, an aldose, features an aldehyde group at carbon 1 and predominantly adopts a six-membered pyranose ring in equilibrium with its open-chain form, serving as a key energy source in metabolism.[45] Fructose, a ketose, possesses a ketone group at carbon 2 and favors a five-membered furanose ring, contributing a sweeter taste profile than glucose due to its structural affinity for taste receptors.[45] Galactose, structurally similar to glucose as an aldose but differing in the hydroxyl group configuration at carbon 4, is less common in free form but integral to lactose.[46] In sucrose (table sugar), the building blocks are one -D-glucopyranose unit and one -D-fructofuranose unit, joined by an --D-glucopyranosyl-(12)--D-fructofuranoside glycosidic linkage that renders the anomeric carbons non-reducing.[1] Hydrolysis of sucrose, as occurs in digestion via invertase, yields equimolar glucose and fructose (inverted sugar syrup), demonstrating their role as monomeric precursors.[47] Other monosaccharides like ribose (a pentose, ) form the backbone of nucleic acids but are not primary components of nutritive sugars.[43]| Monosaccharide | Functional Group | Ring Form Preference | Key Sources or Role |
|---|---|---|---|
| Glucose | Aldehyde (aldose) | Pyranose (6-membered) | Starch hydrolysis, blood glucose[46] |
| Fructose | Ketone (ketose) | Furanose (5-membered) | Honey, fruits, sucrose component[47] |
| Galactose | Aldehyde (aldose) | Pyranose (6-membered) | Lactose in dairy[46] |
Disaccharides and Complex Forms
Disaccharides consist of two monosaccharide units joined by a glycosidic bond, resulting in carbohydrates with the general formula C₁₂H₂₂O₁₁.[48] Sucrose, the predominant disaccharide in refined sugar, comprises one α-D-glucose unit linked to one β-D-fructose unit via an α-1,2-glycosidic bond between the anomeric carbons of each monosaccharide.[1][49] This linkage renders sucrose a non-reducing sugar, as both anomeric carbons are involved in the bond, preventing reaction with oxidizing agents like Benedict's solution.[50] Other disaccharides include maltose, formed by an α-1,4-glycosidic bond between two glucose units and produced during starch hydrolysis, and lactose, composed of β-D-galactose and D-glucose linked by a β-1,4-glycosidic bond, found in milk.[51][52] However, in the context of common sugar sources like sugarcane and sugar beets, sucrose dominates, comprising up to 15-20% of the plant's fresh weight in mature stalks.[53] Complex forms of carbohydrates extend beyond disaccharides to oligosaccharides and polysaccharides. Oligosaccharides contain 3 to 10 monosaccharide units, often branched, and occur in sugar processing byproducts like molasses, where trisaccharides such as raffinose (galactose-glucose-fructose) contribute to residual sweetness.[54][55] Polysaccharides, polymers of hundreds to thousands of monosaccharide units, include starch (a glucose polymer with α-1,4 and α-1,6 linkages) and cellulose (β-1,4-linked glucose, indigestible by humans).[56] These complex structures serve as energy storage (e.g., glycogen in animals, starch in plants) or structural components (e.g., chitin in exoskeletons), and enzymatic hydrolysis can yield simpler sugars for industrial use.[45] In sugar production, polysaccharides from plant cell walls complicate extraction, requiring mechanical and chemical processing to isolate sucrose.[57]Key Physical Properties
Sucrose, the primary form of refined sugar, appears as a white, odorless, crystalline or powdery solid at room temperature.[1] It exhibits a density of 1.587 g/cm³, making it denser than water.[58] The compound possesses a monoclinic crystal structure, which contributes to its stability in solid form.[59] Sucrose does not have a distinct melting point; instead, it decomposes at approximately 186°C (459 K), undergoing thermal degradation to form caramelization products rather than liquifying.[59] [58] It is highly soluble in water, with solubility reaching about 200 g per 100 mL at 20°C, increasing with temperature, but it shows limited solubility in ethanol (around 0.6%) and methanol (1%).[60] This high aqueous solubility stems from its polar molecular structure, facilitating dissolution in polar solvents.[53]| Property | Value |
|---|---|
| Appearance | White crystalline/powdery solid |
| Density | 1.587 g/cm³ |
| Crystal system | Monoclinic |
| Decomposition temperature | 186°C (459 K) |
| Water solubility (20°C) | ~200 g/100 mL |
Sources and Production
Primary Natural Sources
The primary natural sources for commercial sucrose production are sugarcane (Saccharum officinarum) and sugar beets (Beta vulgaris subsp. vulgaris). These plants are selected for their high sucrose concentrations compared to other vegetation, enabling efficient extraction for refined sugar. Globally, sugarcane supplies approximately 80% of sucrose, while sugar beets provide the remaining 20%.[61] Sugarcane, a perennial tropical grass originating from Southeast Asia, accumulates sucrose primarily in its stalks, which can reach heights of 3-6 meters. The stalks contain juice with 10-21% sucrose by fresh weight, extracted through crushing. Cultivation occurs in subtropical and tropical regions, with major producers including Brazil, India, and Thailand.[62][63] Sugar beets, a root crop developed in temperate climates unsuitable for sugarcane, store sucrose in their swollen taproots, typically comprising 15-20% sucrose on a fresh weight basis at harvest. Originating from selective breeding in 18th-century Europe, beets are grown in cooler areas like Europe and North America, with roots sliced and diffused to release the sugar-laden juice.[64][65] While sucrose occurs naturally in fruits, vegetables, and other plants such as apples, oranges, and carrots at lower concentrations (often under 10%), these are not viable for large-scale commercial extraction due to inefficient yields. Minor sources like sorghum stalks or date palm sap contribute negligibly to global production.[66]Agricultural Practices
Sugar is derived agriculturally from two primary crops: sugarcane (Saccharum spp.), a tropical perennial grass accounting for approximately 80% of global production, and sugar beets (Beta vulgaris subsp. vulgaris), a temperate biennial root crop contributing the remaining share.[67] Sugarcane cultivation predominates in tropical and subtropical regions such as Brazil, India, and Thailand, where it is propagated vegetatively using stem cuttings known as setts, planted manually or mechanically in rows spaced 0.9 to 1.5 meters apart.[68] The crop matures in 12 to 18 months for the plant cane harvest, followed by ratoon crops from regrowth of stubble, typically yielding 4 to 6 cycles before replanting due to declining productivity from soil exhaustion and pest buildup.[69] Sugarcane requires well-drained, fertile soils with pH 6.0 to 7.5 and high organic matter, often supplemented with nitrogen, phosphorus, and potassium fertilizers at rates of 100-200 kg N/ha, alongside irrigation in areas with less than 1,500 mm annual rainfall to support its high water demand of 1,500-2,500 mm per crop cycle.[70] Pest management includes chemical controls for borers and diseases like smut, while harvesting involves manual cutting in labor-intensive regions or mechanical harvesters in mechanized operations, extracting stalks at 60-80% of total biomass to minimize soil disruption.[68] Average yields range from 60-70 tonnes of cane per hectare globally, with peaks exceeding 100 tonnes/ha in optimized systems in Peru and Guatemala through improved varieties and precision inputs.[71] [72] Sugar beet farming occurs in temperate zones between 30° and 60° latitude, primarily in Europe and the United States, where monogerm or multigerm seeds are precision-planted in spring using vacuum or air planters at 80,000-100,000 plants per hectare in rows 50-60 cm apart.[73] The crop grows for 5-6 months, with roots harvested mechanically by topping leaves and lifting beets, aiming for high sucrose content of 15-20% in roots weighing 1-5 kg each.[74] It demands neutral to slightly alkaline soils (pH 6.5-7.5) with moderate fertility, applying 100-150 kg N/ha, and irrigation in dry conditions to achieve yields of 50-80 tonnes of beets per hectare, translating to 10-12 tonnes of sugar per hectare in efficient European systems.[75] [76] Disease control targets rhizomania and cercospora leaf spot via resistant varieties and fungicides, with reduced tillage increasingly adopted to preserve soil structure and incorporate cover crops.[77]Refining and Processing Techniques
Sugar refining from sugarcane begins at the mill, where harvested stalks are shredded and crushed to extract juice, typically yielding about 100-120 gallons of juice per ton of cane.[63] The juice undergoes clarification by adding lime to neutralize acids and precipitate impurities, followed by heating and filtration to remove suspended solids.[78] This clarified juice is then concentrated through multi-stage evaporation under vacuum to form a thick syrup, which is seeded with sugar crystals to initiate crystallization in vacuum pans.[79] The resulting massecuite—a mixture of crystals and molasses—is centrifuged to separate the raw sugar crystals, which are then dried and stored; this raw sugar contains about 96-98% sucrose and residual molasses.[79] Further refining of raw sugar occurs in dedicated refineries, starting with affination where the raw sugar is mixed with syrup and centrifuged to wash off outer molasses layers.[80] The affined sugar is dissolved in hot water to form a liquor, which is purified using carbonation (adding lime and carbon dioxide to form insoluble calcium saccharate precipitates) or phosphatation (using phosphoric acid and lime), followed by filtration through bone char or granular carbon to decolorize and remove organic impurities.[81] The purified liquor is evaporated to syrup and crystallized in multiple stages—often three to four "strikes" or boils—to maximize sucrose recovery, with each stage's lower-grade massecuite processed further via centrifugation and remelting.[79] Final white sugar crystals, achieving over 99.9% sucrose purity, are centrifuged, washed with fine water sprays, dried in rotary or band dryers, and screened for uniformity before packaging.[82] Sugar beet processing differs primarily in juice extraction via diffusion rather than crushing, as beets are sliced into cossettes and steeped in hot water at 70-80°C to osmotically draw out sucrose-rich juice, extracting about 98% of the beet's sugar content.[83] The raw juice, containing 10-14% sucrose, is purified through liming to pH 11 to coagulate proteins and add carbon dioxide for carbonatation, forming chalk precipitates that trap impurities; this is followed by hot filtration and sometimes cold saturation for additional impurity removal.[84] Evaporation reduces the juice to 60-70% solids syrup under vacuum, after which crystallization proceeds in three stages similar to cane, but beets yield directly refined sugar without a raw intermediate, with molasses separated via centrifuges and the pulp byproduct dried for animal feed.[85] Modern efficiencies, such as Norbert Rillieux's multiple-effect evaporator invented in the 1840s, recycle steam across evaporation stages, reducing energy use by up to 80% compared to single-effect systems.[86] Variations in processing yield different sugar forms: brown sugar retains more molasses post-centrifugation, while refined white sugar undergoes extensive decolorization; ion-exchange resins are increasingly used in cane refining for final liquor polishing to remove residual ions without chemical additives.[81] Overall recovery rates average 85-90% sucrose from cane and 80-85% from beets, with byproducts like bagasse (cane fiber) used for cogeneration and beet pulp for feed.[78][87]Forms and Applications
Structural Variations
Sucrose, the predominant form of table sugar, crystallizes in a monoclinic structure, typically forming elongated prismatic shapes that determine its handling and dissolution characteristics.[59] These crystals vary in size and uniformity based on controlled cooling rates, seeding techniques, and supersaturation levels during refining, allowing for tailored applications in food production.[88] Uniform crystal size is critical for efficient processing, as irregular shapes can lead to caking or poor flowability in industrial handling.[88] Granulated white sugar features medium-sized crystals, approximately 0.3 to 0.5 mm in diameter, providing a balance of solubility and volume in baking and cooking.[89] Finer variants, such as caster or superfine sugar, have crystals reduced to about 0.2 mm or smaller through grinding or rapid crystallization, enabling faster dissolution in cold liquids and lighter textures in meringues and cocktails.[90] [91] Coarse sugars, including sanding and demerara, possess larger crystals exceeding 0.6 mm, often retained from less refined syrups, which resist melting and are used for decorative purposes or crunch in toppings.[92] [93] Powdered or confectioners' sugar represents an amorphous structure achieved by pulverizing crystals to a dust-like fineness (particle size under 0.1 mm), frequently blended with 3% cornstarch to inhibit recrystallization and clumping in humid conditions.[90] Brown sugars maintain crystalline sucrose cores but incorporate molasses films coating the surfaces, resulting in irregular, sticky aggregates that impart flavor and moisture retention in recipes like cookies.[92] Rock candy exemplifies extreme structural variation with oversized, transparent crystals grown slowly over days via string or stick nucleation, yielding pure sucrose prisms up to several centimeters long for ornamental or slow-dissolving confectionery uses.[94] Compressed forms, such as sugar cubes, consist of densely packed fine granules bound by minor wetting and drying, forming rigid blocks without altering the underlying crystal lattice.[95] These structural differences directly impact functional properties: smaller crystals enhance creaming with fats and aeration in batters due to increased surface area, while larger ones minimize inversion during heating, preserving sweetness in caramels.[96] Industrial producers adjust massecuite viscosity and vacuum pan operations to target specific morphologies, ensuring consistency across batches.[97]Culinary and Household Uses
Sugar functions in culinary preparations primarily as a sweetener, balancing acidity and enhancing flavor in dishes ranging from desserts to savory sauces. It contributes to texture by adding bulk, viscosity, and mouthfeel, as seen in frostings, candies, and syrups.[98][99] In beverages, sugar dissolves readily to sweeten hot drinks like tea and coffee or cold ones like sodas, where it also stabilizes emulsions and prevents crystallization.[100] In baking, sugar interacts with other ingredients to influence structure and appearance. As a humectant, it attracts and retains moisture, keeping cakes, cookies, and breads soft over time.[101] It tenderizes batters by interfering with gluten formation, promotes aeration through creaming with fats to incorporate air, and facilitates leavening by feeding yeast in doughs, producing carbon dioxide for rise.[102] During heating, sugar enables caramelization above 160°C and participates in the Maillard reaction with proteins for browning and complex flavors in pastries and breads.[103] Sugar preserves foods by lowering water activity, depriving microbes of free water needed for growth, which is critical in high-sugar products like jams, jellies, and fruit preserves. In these, concentrations above 60% sugar by weight inhibit bacteria and molds, maintaining safety without refrigeration.[104][105] It also serves as a fermentation substrate in yogurt, beer, and wine production, where yeasts convert it to alcohol and gases.[106] Beyond cooking, sugar finds household applications for non-food purposes. Mixed with oils, it forms exfoliating scrubs for skin, leveraging its granular texture to remove dead cells without harsh abrasion.[107] As a mild abrasive, it cleans greasy surfaces or removes grass stains from fabrics when combined with vinegar or water.[108] In minor first aid, a spoonful can soothe a burned tongue by drawing heat through osmosis, though medical attention is advised for serious injuries.[98]Industrial and Non-Food Applications
Sugar, primarily in the form of sucrose, functions as a versatile feedstock in industrial fermentation processes to produce biofuels such as ethanol. Sucrose derived from sugarcane or sugar beets undergoes microbial fermentation, typically by yeast strains like Saccharomyces cerevisiae, yielding ethanol that is distilled for use as a gasoline additive or pure fuel.[109] This application leverages sucrose's ready hydrolysis into glucose and fructose, which microorganisms metabolize anaerobically, with global bioethanol production from sugar crops exceeding 100 billion liters annually as of 2022, driven largely by Brazil and the United States.[110] Beyond ethanol, sucrose fermentation yields platform chemicals like citric acid, lactic acid, and butanol, used in solvents, polymers, and bioplastics.[111] In pharmaceuticals, sucrose acts as an excipient for tablet formulation, providing bulk, compressibility, and taste-masking for bitter active ingredients.[112] It also serves as a preservative and antioxidant in syrups and injectables, stabilizing formulations by reducing water activity and inhibiting microbial growth, with invert sugar (hydrolyzed sucrose) specifically employed for its humectant properties.[1] Sucrose esters, chemically modified from sucrose, function as non-ionic surfactants in drug delivery systems, enhancing solubility and bioavailability of poorly water-soluble compounds.[113] Sucrose and its derivatives find applications in cosmetics and detergents as humectants, emulsifiers, and mild surfactants. In skincare products, sucrose maintains moisture by binding water molecules, while sucrose fatty acid esters provide foaming and cleansing without irritating skin, used in shampoos and body washes.[114] These sugar-based surfactants offer biodegradability advantages over petroleum-derived alternatives, aligning with regulatory preferences for eco-friendly ingredients in the European Union.[115] In the chemical industry, sucrose undergoes thermochemical or catalytic conversion to produce intermediates like levulinic acid, which serves as a precursor for pharmaceuticals, pesticides, and synthetic rubbers.[116] Sucrose also contributes to adhesive and ink production through caramelization or esterification, where its viscosity and binding properties enhance formulation stability. Other niche uses include wastewater treatment as a carbon source for microbial denitrification and brickmaking as a plasticizer to improve workability of clay mixtures.[117] These applications collectively represent a minor but growing fraction of global sucrose demand, estimated at under 5% of production, emphasizing efficiency in resource allocation for non-food sectors.[118]Consumption and Economics
Global Production and Trade
Global sugar production for the 2024/25 marketing year is forecasted at 180.8 million metric tons, reflecting revisions downward from earlier estimates due to factors including reduced output in Europe.[3] This volume is dominated by sugarcane-derived sugar, which accounts for approximately 80% of total production, primarily from tropical and subtropical regions, while sugar beets contribute the remainder in temperate climates.[119] Brazil and India lead as the largest producers, together representing about 39% of global output, with Brazil's production reaching 43.7 million metric tons and India's at 28 million metric tons.[119]| Country/Region | Production (million metric tons, 2024/25) | Share of Global (%) |
|---|---|---|
| Brazil | 43.7 | 24 |
| India | 28 | 15 |
| European Union | 16.5 | 9 |
| China | 11 | 6 |
| Thailand | 10.04 | 6 |
| United States | 8.45 | 5 |
Dietary Intake Patterns
Global per capita sugar availability, a proxy for consumption, averaged approximately 22.5 kg annually in 2022, equivalent to about 62 grams per day, though direct intake surveys indicate variability due to waste and other factors.[122] The World Health Organization (WHO) recommends limiting free sugars—defined as monosaccharides and disaccharides added to foods and beverages, plus those in honey, syrups, and fruit juices—to less than 10% of total daily energy intake, or ideally under 5%, corresponding to roughly 50 grams (12 teaspoons) or 25 grams (6 teaspoons) for a 2,000-calorie diet.[123] Actual intakes frequently exceed these thresholds; for instance, in the WHO European Region, reported adult daily free sugars consumption surpassed 5% of energy intake across all surveyed countries.[124] In high-income countries, per capita consumption remains elevated, with the United States leading at 126.4 grams daily as of recent estimates, followed by Germany (102.9 grams) and the Netherlands (102.5 grams).[125] [126] Lower-income regions show lower but rising levels; projections indicate Africa's per capita intake reaching 15.6 kg annually and Asia's 21.2 kg by 2034, both trailing the global average of 23.5 kg due to expanding processed food markets.[127] Disparities persist by socioeconomic status within countries, with higher intakes among urban and higher-income groups in developing nations, driven by increased availability of sugary beverages and snacks.[128] Historical trends reveal a general upward trajectory in global consumption since the mid-20th century, particularly in low- and middle-income countries where per capita use has grown alongside urbanization and economic development.[129] In the United States, added sugars intake rose from 111 grams daily in 1970 to 131 grams in 1996 before stabilizing or slightly declining amid public health campaigns, though total sugars from ultra-processed foods continue to dominate.[130] Recent data from packaged foods sales suggest a 0.5 kg per capita increase in added sugars between 2007 and 2019 globally, concentrated in East Asia.[129] Added sugars constitute the majority of intake patterns, primarily from ultra-processed sources, which account for nearly 90% of added sugars' energy contribution in diets like the U.S.[131] Sweetened beverages, including soft drinks (17.1% of U.S. added sugars) and fruit drinks (13.9%), rank as the leading category, followed by desserts, sweet snacks, and bakery products such as cakes and cookies.[132] [133] Processed foods like cereals, sauces, and yogurts embed sugars covertly, amplifying intake beyond obvious sweets; for example, ready-to-eat cereals contribute 3-6% of added sugars while providing variable nutrient density.[134]| Top Sources of Added Sugars in U.S. Diets (Approximate % of Total) | Contribution |
|---|---|
| Soft drinks and sweetened beverages | 17-30% |
| Desserts and sweet snacks (e.g., ice cream, cookies) | 15-20% |
| Fruit drinks and milk-based sweetened beverages | 10-14% |
| Bakery products (e.g., cakes, pastries) | 10-12% |
| Candies and sugars | 5-8% |
Market Dynamics and Pricing
The global sugar market exhibits high volatility due to its dependence on agricultural cycles, weather variability, and policy interventions in key producing regions. Raw sugar prices are benchmarked primarily through the Intercontinental Exchange (ICE) Sugar No. 11 futures contract, denominated in U.S. cents per pound, which reflects anticipated supply from tropical exporters like Brazil and India against steady demand from food processing and emerging biofuel sectors. White refined sugar trades via ICE Sugar No. 5 contracts, often at a premium influenced by refining costs and regional tariffs.[137] These futures markets incorporate forward expectations, with prices adjusting to factors like harvest forecasts and currency fluctuations; for example, a stronger U.S. dollar in late 2024 pressured exporter revenues, contributing to a 4.2% monthly decline in ICE #5 March 2025 white sugar contracts.[138] Supply-side dynamics dominate price swings, as sugarcane production—accounting for over 80% of global output—remains vulnerable to El Niño-induced droughts and frosts in Brazil, the world's largest exporter. In the 2023/24 season, Brazilian output fell short by approximately 5 million metric tons due to dry conditions, exacerbating a global deficit of 4.7 million metric tons and driving ICE No. 11 prices above 30 cents per pound in early 2024.[139] Conversely, improved monsoons in India, the top producer, and policy shifts allowing freer exports from mid-2024 onward boosted global stocks, leading to price retreats; by October 2025, ICE No. 11 spot prices had dropped to 14.96 cents per pound, a 32.3% decline from yearly highs amid projections of a 2.8 million metric ton surplus for 2025/26.[140][141] India's export bans during 2022-2023, justified by domestic shortages, similarly constricted supply and inflated prices, illustrating how state controls in populous producers can override market signals.[142] Demand elasticity is relatively inelastic for caloric sweeteners in developing economies but competes with substitutes like high-fructose corn syrup in the U.S. and EU, where protective quotas and subsidies distort local pricing; U.S. refined sugar quotas, for instance, maintain domestic prices 2-3 times above world levels to shield beet growers.[143] Biofuel diversion adds causal pressure: Brazilian mills prioritize ethanol when crude oil exceeds $80 per barrel, as in 2022, reducing sugar yields by up to 10 million tons annually and correlating with price spikes.[144] Geopolitical disruptions, such as the 2022 Russia-Ukraine conflict elevating European import needs, further amplify short-term volatility, though long-term trends favor surplus as yields improve via varietal advances and irrigation.[145] Overall, the market's pricing reflects a tug-of-war between episodic shortages and structural oversupply, with 2024's initial rally from 23-27 cents per pound giving way to declines as Brazilian crushing data signaled record harvests.[146]| Period | Key Price Event (ICE No. 11, cents/lb) | Primary Driver |
|---|---|---|
| Early 2024 | Rise to >30 | Brazilian weather deficits, global deficit of 4.7 MMT[139] |
| Mid-2024 | Peak and retreat to ~20 | Indian export easing, improved yields[138] |
| Oct 2025 | Fall to 14.96 | Anticipated 2025/26 surplus, Brazilian output surge[140][147] |
Nutritional Physiology
Metabolic Pathways
Sucrose, the primary form of dietary sugar, is a disaccharide composed of one glucose and one fructose molecule linked by an α-1,4 glycosidic bond.[148] In the human digestive system, it undergoes hydrolysis in the small intestine via the enzyme sucrase-isomaltase, yielding equimolar amounts of D-glucose and D-fructose for absorption.[149] Glucose is absorbed actively through the sodium-glucose linked transporter 1 (SGLT1) coupled with passive facilitative diffusion via GLUT2, while fructose enters primarily via GLUT5 and secondarily via GLUT2.[150] Absorbed glucose enters the portal bloodstream and is distributed systemically, where it serves as a central fuel for cellular energy production. In most tissues, glucose is phosphorylated by hexokinase (or glucokinase in liver) to glucose-6-phosphate, initiating glycolysis—a 10-step anaerobic pathway that converts one glucose molecule to two pyruvate molecules, generating a net yield of 2 ATP and 2 NADH per glucose.[151] Under aerobic conditions, pyruvate is decarboxylated to acetyl-CoA by pyruvate dehydrogenase, entering the tricarboxylic acid (TCA) cycle for further ATP production via oxidative phosphorylation; in anaerobic states, pyruvate is reduced to lactate.[152] Excess glucose is stored as glycogen through glycogenesis or converted to fatty acids via de novo lipogenesis in the liver, while gluconeogenesis reciprocally synthesizes glucose from non-carbohydrate precursors like lactate, glycerol, and glucogenic amino acids, primarily in the liver and kidneys to maintain blood glucose homeostasis during fasting.[153] Key regulatory enzymes include phosphofructokinase-1 (activated by AMP and inhibited by ATP/citrate in glycolysis) and fructose-1,6-bisphosphatase (oppositely regulated in gluconeogenesis), ensuring reciprocal control to prevent futile cycling.[154] Fructose metabolism differs markedly, occurring predominantly in the liver due to its low affinity for extrahepatic hexokinases. Upon hepatic uptake via GLUT2, fructose is phosphorylated by fructokinase (ketohexokinase) to fructose-1-phosphate, consuming ATP without allosteric feedback.[155] Aldolase B then cleaves fructose-1-phosphate into dihydroxyacetone phosphate (DHAP) and glyceraldehyde; the latter is phosphorylated by triokinase to glyceraldehyde-3-phosphate (G3P), both entering glycolysis distal to the phosphofructokinase-1 regulatory step.[156] This unregulated influx allows rapid flux toward hepatic lipogenesis when fructose intake exceeds processing capacity, with DHAP convertible to triglycerides via conversion to glycerol-3-phosphate and acetyl-CoA from pyruvate.[157] In rodents, hepatic fructose-1-phosphate levels rise approximately 10-fold to 1 mM within 10 minutes of ingestion, sustaining elevation and potentially promoting lipid accumulation if chronic.[155] Minimal fructose metabolism occurs in other tissues, underscoring the liver's central role and its implications for dose-dependent effects on lipid homeostasis.[158] Despite these mechanistic differences in glucose and fructose metabolism, recent studies and expert consensus indicate no major differences in overall metabolic effects among common added sugars, such as sucrose and high-fructose corn syrup, when consumed in equicaloric amounts, with emphasis placed on moderation of total intake rather than type selection. Systematic reviews have found equivalent impacts on anthropometric measures like weight and BMI, lipid profiles, and insulin sensitivity.[159][160]Caloric and Sensory Contributions
Sucrose, the predominant form of table sugar, yields approximately 4 kilocalories per gram upon metabolism, equivalent to 387-388 kilocalories per 100 grams, as it is fully digestible and provides energy solely from its carbohydrate content without associated macronutrients like fat or protein.[161][162] This caloric density arises from its hydrolysis into glucose and fructose in the digestive tract, where each monosaccharide is absorbed and oxidized for ATP production, contributing rapidly available energy comparable to other simple carbohydrates but lacking fiber or micronutrients.[163] In dietary contexts, added sugars from sucrose account for variable caloric intake shares, often 10-15% of total daily energy in Western diets, functioning as a concentrated source that elevates overall energy density in processed foods without satiety signals from bulk or protein.[164] Sensorily, sugar's primary contribution stems from its activation of the heterodimeric T1R2/T1R3 G-protein-coupled receptors on taste bud cells in the oral cavity, initiating a signaling cascade involving phospholipase Cβ2 and transient receptor potential channel M5 to depolarize cells and transmit sweet perception via afferent nerves.[165] Sucrose serves as the benchmark for sweetness intensity at a relative value of 1.0, with fructose exhibiting 1.1-1.7 times greater potency and glucose approximately 0.7-0.8 times, influencing perceived flavor profiles where higher concentrations enhance initial taste onset but may lead to adaptation.[166][167] Beyond isolated taste, sugar modulates food palatability by balancing flavors, improving mouthfeel through viscosity and humectancy, and suppressing bitterness, thereby increasing overall acceptability and consumption volume in formulations like beverages and confections.[168][169] This sensory enhancement drives hedonic responses, as evidenced by studies showing elevated intake of sugar-fortified items due to amplified liking rather than mere caloric signaling.[170]Health Implications
Empirical Benefits and Neutral Effects
Dietary sugar, particularly sucrose, serves as a rapidly absorbable source of energy, delivering approximately 4 kilocalories per gram through its hydrolysis into glucose and fructose in the small intestine.[171] This quick bioavailability supports acute physical performance, as evidenced by randomized controlled trials showing that carbohydrate ingestion, including forms derived from sugar, at rates of 30 to 80 grams per hour during endurance exercise enhances time-to-exhaustion and overall output by maintaining euglycemia and delaying glycogen depletion.[172] Similarly, in resistance training exceeding 45 minutes, acute sugar-containing carbohydrate feeding increases training volume without impairing strength metrics.[173] In cognitive domains, empirical evidence from systematic reviews of interventional studies demonstrates that acute glucose supplementation—often from sucrose sources—facilitates enhancements in episodic memory and attentional processes among healthy adults, particularly under conditions of mental demand or mild glucoprivation.[174] A meta-analysis of such trials further confirms modest benefits for immediate verbal recall and reaction times following 25-50 grams of glucose, with effects more pronounced in tasks requiring rapid processing.[175] These outcomes align with glucose's role as the brain's primary metabolic fuel, consuming about 120 grams daily in adults at rest.[176] Neutral effects emerge prominently in isocaloric substitution trials, where replacing sugars with other carbohydrates yields no significant impact on body weight, as sugars' caloric density drives intake-related gains rather than inherent metabolic toxicity.[177] Network meta-analyses of controlled feeding studies similarly report minimal differences in cardiometabolic markers like insulin sensitivity, uric acid, or blood pressure when sucrose or fructose substitutes starch isocalorically, though some substitutions modestly lower LDL cholesterol.[178][179] Overall, these findings indicate that sugar exerts no unique adverse influence beyond total energy balance in energy-matched diets, underscoring calorie intake as the primary mediator.[171]Dose-Dependent Risks: Metabolic and Cardiovascular
While a single high-sugar binge in healthy individuals produces transient acute effects such as temporary blood sugar spikes, insulin release, energy crashes, bloating, headaches, or fatigue, these resolve without significant long-term health impacts; risks such as insulin resistance, type 2 diabetes, obesity, and cardiovascular disease arise from chronic, repeated high sugar consumption rather than isolated incidents.[180] Excessive intake of added sugars, particularly fructose-containing sources like sucrose and high-fructose corn syrup, promotes hepatic insulin resistance through rapid metabolism in the liver, bypassing phosphofructokinase regulation and driving de novo lipogenesis, triglyceride accumulation, and inflammation.[181] This mechanism contributes to dose-dependent impairments in glucose homeostasis, with studies showing that even moderate fructose consumption (e.g., 25% of energy from fructose-sucrose mixtures) reduces hepatic insulin sensitivity by increasing diacylglycerol and activating protein kinase C epsilon.[182] Habitual fructose intake exceeding 50-100 g/day correlates with elevated intrahepatic lipids and diminished insulin-mediated suppression of endogenous glucose production in healthy adults.[183] Meta-analyses indicate a dose-response relationship between added sugar consumption and metabolic syndrome (MetS), with higher intakes elevating risk through components like central obesity, dyslipidemia, and hypertension.[184] For instance, sugar-sweetened beverage (SSB) intake shows a clear link to MetS development, independent of total energy, with prospective cohorts demonstrating 20-30% increased odds per daily serving.[185] Cross-sectional data from U.S. Hispanic adults reveal MetS prevalence rising from 24.8% baseline to higher quintiles of added sugars (average 14.4% energy), underscoring caloric-independent effects via fructose-driven hepatic steatosis.[186] Umbrella reviews confirm that dietary patterns high in added sugars (e.g., >10-15% energy) associate with greater MetS incidence, though causality strengthens with SSB-specific exposures due to liquid calories evading satiety signals.[187] Type 2 diabetes (T2D) risk escalates nonlinearly with added sugar intake, particularly from SSBs, where meta-analyses report a 26-30% higher relative risk for highest versus lowest consumers, adjusting for adiposity and lifestyle.[188] Each additional daily SSB serving links to 18-19% elevated T2D incidence, mediated partly by obesity but also via direct beta-cell dysfunction and ectopic fat deposition from chronic hyperglycemia.[189] Global burden estimates attribute substantial T2D disability-adjusted life years to SSB consumption, with risks amplifying above 5-10% energy from free sugars, as per systematic evidence portfolios.[190] Cardiovascular disease (CVD) outcomes exhibit dose-dependent associations with added sugars, where intakes exceeding 10% of total energy correlate with 9-38% higher CVD mortality, driven by endothelial dysfunction, atherogenic dyslipidemia, and hypertension.[191] Prospective analyses show total sugar and fructose intakes raising all-cause and CVD death risks, with nonlinear patterns indicating harm thresholds around 13% energy from added sugars.[192] SSB consumption specifically contributes to rising global CVD burden, with 250 mL daily linking to 10% increased CVD events, compounded by metabolic intermediaries like elevated triglycerides and uric acid.[193] Higher added sugar percentiles (>20% energy) predict excess mortality, though evidence rates moderate for precise thresholds due to confounding by overall diet quality.[194]Dental and Cognitive Outcomes
High intake of fermentable sugars, particularly sucrose, contributes to dental caries through a well-established mechanism involving oral bacteria such as Streptococcus mutans, which ferment sugars into lactic acid, lowering plaque pH below 5.5 and demineralizing tooth enamel over repeated exposures.[195] Sucrose is uniquely cariogenic among sugars because it serves as both an energy source for bacterial metabolism and a substrate for extracellular glucan production, enhancing plaque adhesion and biofilm formation that sustains acid attacks.[196] Frequency of consumption exacerbates risk more than total amount in some contexts, as prolonged acid exposure hinders remineralization, though fluoride availability and oral hygiene modulate outcomes.[197] Epidemiological evidence from systematic reviews confirms a dose-dependent association: for instance, a 40 g/day increase in added sugars correlates with a 6.4% rise in caries lesions among children, while higher sugar-sweetened beverage (SSB) intake elevates caries and erosion risk across populations.[198] [199] WHO-commissioned meta-analyses support recommended free sugar limits below 10% of energy intake to mitigate caries at the population level, drawing from longitudinal and intervention data showing reduced decay with sugar restriction.[200] These findings hold despite confounders like socioeconomic factors, underscoring sugar's causal role via microbial ecology rather than indirect pathways alone.[201] Chronic high consumption of added sugars is associated with accelerated cognitive decline and elevated dementia risk in observational studies, with cohort data linking higher intake to poorer memory, executive function including decision-making, and global cognition scores over time.[202] [203] A systematic review and meta-analysis of 17 studies found significant correlations between added sugars and cognitive impairment risk, attributing potential harm to mechanisms like hippocampal and prefrontal neuroinflammation, reduced brain blood flow, insulin resistance in the brain, and disrupted glucose homeostasis mimicking type 2 diabetes effects, with patterns of decline resembling early Alzheimer's.[204] [205] [206] For example, adults with the highest sugar intake showed 1.5 times greater odds of mild cognitive impairment compared to low consumers in a Mayo Clinic prospective study of over 1,200 participants followed for up to 6 years.[207] However, evidence for direct causality remains limited by reliance on cross-sectional and cohort designs prone to reverse causation or unmeasured confounders such as overall diet quality and physical activity; acute glucose administration can transiently enhance cognition in healthy individuals, contrasting chronic excess effects that exhibit dose-dependence, with occasional moderate intake posing lower risks than daily high-sugar items like beverages leading to cumulative moderate harm.[208] [209] Some animal studies indicate partial reversibility of related brain derangements through dietary adjustments improving metabolic health, though human interventional evidence is scarce.[210] Prenatal or long-term exposure appears particularly detrimental, with animal models and human prenatal data showing structural brain changes and functional deficits.[202] Overall, while associations are robust, interventional evidence is needed to confirm thresholds beyond which risks intensify, independent of obesity or metabolic syndrome.[211]Long-Term Debates: Cancer, Addiction Claims
The hypothesis that dietary sugar directly promotes cancer development stems from observations of the Warburg effect, wherein cancer cells exhibit elevated glucose uptake and glycolysis for energy production, leading to claims that sugar "feeds" tumors. However, this metabolic shift occurs in all proliferating cells and does not imply causation by exogenous sugar intake; normal cells also rely heavily on glucose, and restricting sugar does not selectively starve cancer cells without harming healthy tissues.[212] Epidemiological studies have not established direct causality, with meta-analyses of prospective cohorts showing null associations between total carbohydrate or sugar intake and overall cancer incidence.[213] Observational data reveal modest associations between sugary beverage consumption and risks for specific cancers, such as breast and colorectal, potentially tied to insulin resistance or inflammation rather than sugar per se. For instance, a 2019 prospective analysis of over 100,000 French adults found that higher intake of sugar-sweetened beverages correlated with a 18% increased overall cancer risk and 22% for breast cancer, though adjustments for confounders like adiposity attenuated effects.[214] Critics note these links are indirect, primarily mediated by obesity—excess caloric intake from sugars contributes to weight gain, which independently elevates cancer risk across 13 types via hormonal and inflammatory pathways—rather than sugar uniquely driving oncogenesis.[215][216] Preclinical rodent models suggest high-fructose diets may accelerate tumor growth through hepatic lipogenesis and metastasis promotion, but human translation remains speculative due to dosing differences and ethical limits on trials.[217] Claims of sugar addiction, often analogized to drug dependence via dopamine release in reward pathways, originate from intermittent-access rodent paradigms where animals binge sugar, exhibit withdrawal signs like anxiety, and show cross-sensitization to drugs like amphetamines.[218] These behaviors mimic addiction criteria in animals, with sugar occasionally surpassing cocaine preference in self-administration tests under certain conditions.[219] However, human evidence is scant and fails to meet clinical addiction thresholds, such as tolerance, compulsive use despite harm, or neuroadaptations akin to opioids or stimulants; neuroimaging shows reward activation but no dependency syndrome in controlled studies.[220] Scientific consensus views sugar as highly palatable and habit-forming—promoting overconsumption through sensory reward and glycemic spikes—but not addictive in the pharmacological sense, with claims exaggerated by media and lacking support from systematic reviews.[221] A 2016 review concluded addiction-like responses in animals require restricted access mimicking human dieting cycles, not ad libitum intake, and human surveys report "food addiction" symptoms more attributable to ultra-processed foods' multifactorial palatability than isolated sugar.[222] Behavioral interventions reducing added sugars yield no withdrawal comparable to substance use disorders, underscoring evolutionary adaptations for energy-dense foods rather than a discrete pathology.[223]Research and Policy Controversies
Industry Influence on Studies
In the mid-1960s, the Sugar Research Foundation (SRF), a trade association representing the sugar industry, paid three Harvard University scientists approximately $6,500 in today's dollars—equivalent to about $50,000 adjusted for inflation—to conduct literature reviews on the dietary causes of coronary heart disease (CHD).[224] These reviews, published in the New England Journal of Medicine in 1965 and 1967, selectively emphasized saturated fat and cholesterol as primary culprits while downplaying emerging evidence linking sucrose consumption to elevated triglycerides and CHD risk.[225] [226] Internal SRF documents reveal the organization initiated the project, drafted initial reports, and approved revisions to align with its interests, including suppressing data on sugar's potential harms from animal studies.[224] This funding influenced key researchers like D. Mark Hegsted, who later advised U.S. Senate committees on nutrition policy, contributing to the paradigm shift toward low-fat dietary recommendations in the 1970s and 1980s that inadvertently promoted higher sugar intake through "heart-healthy" processed foods.[227] The SRF's strategy mirrored tactics used by the tobacco industry, leveraging academic prestige to shape scientific consensus without full disclosure of financial ties at the time.[226] Subsequent historical analyses of declassified documents, including correspondence between SRF executives and the Harvard team, confirm the industry's intent to counter studies like John Yudkin's 1972 book Pure, White and Deadly, which argued sugar's central role in metabolic diseases.[228] Broader patterns of bias persist in sugar-related research. A systematic review of 60 studies on sugar-sweetened beverages (SSBs) and cardiometabolic outcomes found that all 26 studies reporting no significant association were funded by the beverage industry, while independent studies were far more likely to identify risks such as obesity and type 2 diabetes.[229] Industry-sponsored nutrition research overall shows a consistent favorable bias, with meta-analyses indicating sponsored trials report effect sizes up to eight times smaller for harms compared to independent ones.[230] [231] Mechanisms include selective outcome reporting, choice of surrogate endpoints over hard clinical outcomes, and funding of researchers with prior industry affiliations, often undisclosed until mandated by journals post-2000.[232] Critics of these revelations, such as some Columbia University researchers, argue that while funding occurred, it did not single-handedly "shift blame" to fat, citing confounding factors like concurrent epidemiological data favoring lipid hypotheses.[233] However, empirical evidence from randomized controlled trials post-1980s, untainted by such sponsorship, has substantiated dose-dependent sugar risks for metabolic syndrome, underscoring how early industry influence delayed causal recognition.[230] Disclosure requirements and calls for independent funding have since aimed to mitigate this, though industry lobbying continues to shape agendas, as seen in opposition to strict sugar limits in international guidelines.[234]Dietary Guidelines Evolution
The initial U.S. Dietary Guidelines for Americans, released in 1980, advised to "avoid too much sugar" without specifying quantities or distinguishing added from natural sugars, reflecting a broad caution amid rising concerns over dental caries and obesity but prioritizing reductions in fat intake.[235] This vagueness stemmed from limited epidemiological data at the time, with guidelines influenced by the 1977 Senate Select Committee on Nutrition's emphasis on increasing carbohydrate consumption to replace fats, a shift later criticized for overlooking potential metabolic harms of refined carbohydrates including sugars.[236] By 2000, the guidelines urged moderation in sugars through food and beverage choices, still without numerical limits, as evidence began linking sugar-sweetened beverages to weight gain but lacked consensus on total intake thresholds.[237] A pivotal change occurred in the 2015-2020 Dietary Guidelines, which for the first time recommended limiting added sugars to less than 10% of daily caloric intake—approximately 50 grams or 12 teaspoons for a 2,000-calorie diet—based on associations between high intake and cardiometabolic risks in observational studies.[238] This threshold aligned with evidence from systematic reviews indicating that exceeding 10% correlated with increased adiposity and cardiovascular disease markers, though causal mechanisms remained debated due to confounding factors like overall energy surplus.[239] The 2020-2025 edition retained this limit while introducing stricter school meal standards starting in 2025, capping added sugars in certain foods like yogurt at 15 grams per serving, amid data showing average U.S. consumption at 17 teaspoons daily, far exceeding recommendations.[240] Internationally, the World Health Organization first recommended in 1989 reducing free sugars—defined as monosaccharides and disaccharides added to foods plus those in honey, syrups, and fruit juices—to below 10% of total energy intake, drawing from early cohort studies on caries and body weight.[123] The 2015 WHO guideline strengthened this to a conditional further reduction to under 5% for additional benefits against non-communicable diseases, supported by meta-analyses of randomized trials showing dose-dependent effects on dental health but weaker direct causation for obesity independent of calories.[241] [242] Critics argue these quantitative limits lack robust randomized controlled trial evidence isolating added sugars' harms from total caloric excess or nutrient displacement, with some reviews finding no unique metabolic detriment beyond energy balance and noting potential overemphasis on liquid forms while ignoring satiating solid sources.[243] [244] Historical guideline evolution has been faulted for entrenching a low-fat, high-carbohydrate paradigm post-1970s, coinciding with a 19% rise in per capita sugar availability from 1970 to 2005 and the obesity epidemic, though causal attribution remains contested due to multi-factorial drivers like sedentary lifestyles.[245] Government and WHO sources, while authoritative, have faced scrutiny for selective evidence interpretation favoring population-level interventions over individualized caloric control.[177]Regulatory Measures: Taxes and Subsidies
Various governments have imposed excise taxes on sugar-sweetened beverages (SSBs) to curb consumption linked to obesity and related health issues, with over 130 jurisdictions in nearly 120 countries implementing such measures as of 2025.[246] Mexico pioneered a national SSB tax of 10% per liter in January 2014, resulting in a 33.1% retail price increase for taxed beverages and a sustained decline in purchases, particularly among lower-income households.[247] In the United Kingdom, a two-tier tax introduced in April 2018—8 pence per liter for drinks with 5-8 grams of sugar per 100 ml and 24 pence for higher levels—correlated with a reduction in household sugar purchases from SSBs by about 10% in the first year, with peer-reviewed analyses confirming decreased caloric intake from taxed items.[248] In the United States, city-level SSB taxes have shown consistent effects on reducing volumes sold; for instance, Berkeley, California's 1-cent-per-ounce tax effective March 2015 led to a 21% drop in SSB consumption four months post-implementation, while Philadelphia's 1.5-cent-per-ounce levy from January 2017 and Seattle's 1.75-cent-per-ounce tax from January 2018 each prompted substantial purchase declines of 30-38% in the initial years, with minimal substitution to untaxed sugary drinks.[249] Systematic reviews of real-world evaluations indicate these taxes generally increase SSB prices by 20-50% of the tax rate and reduce purchases by 10-30%, though long-term health outcomes like weight loss remain modest due to partial offsetting via untaxed alternatives or cross-border shopping.[250] Critics, including industry analyses, argue such taxes disproportionately burden low-income groups without proportionally improving public health metrics, as evidenced by limited BMI reductions in some cohorts.[251] Conversely, agricultural subsidies prop up sugar production in major exporting and importing nations, often elevating domestic prices above global averages and distorting trade. In the United States, the federal sugar program, reauthorized through the 2018 Farm Bill and extended in 2024, offers nonrecourse loans to processors at minimum rates of 18 cents per pound for raw cane sugar and 22.9 cents for refined beet sugar, allowing forfeiture of collateral sugar to the government if market prices fall below loan levels, which effectively guarantees producer revenues at taxpayer expense—estimated at $3-4 billion annually in higher consumer costs and occasional buyouts for ethanol.[252] This system has resulted in domestic prices averaging 2-3 times world levels since the 1980s, incentivizing inefficient production while inviting WTO challenges.[253] The European Union historically subsidized sugar beet production and exports under its Common Agricultural Policy, exporting 4-5 million tons annually with refunds until reforms in 2006 reduced quotas by 36% and phased out direct export subsidies following WTO rulings against practices like those in Council Regulation (EC) No. 1260/2001, which Brazil contested as violating agriculture agreement limits.[254] Post-reform, EU support shifted to decoupled payments, yet production persists with indirect aids, contributing to market surpluses. In Brazil, the world's top sugar exporter controlling 38% of global trade, government programs including credit guarantees, ethanol blending mandates, and agronomy financing provide at least $2.5 billion yearly in support, enabling low-cost expansion despite volatile prices and fueling accusations of dumping that undercut competitors.[255] These subsidies collectively foster overproduction—global sugar output exceeded 180 million tons in 2023—while raising import barriers in protected markets, though empirical trade data reveals they exacerbate price volatility rather than stabilizing farmer incomes long-term.[256]Societal and Environmental Context
Cultural and Symbolic Roles
In antiquity and the medieval period, sugar functioned primarily as a rare luxury commodity, symbolizing wealth and elite status due to its importation from distant regions like India and the Middle East, where it was initially valued for medicinal purposes and ritual offerings rather than everyday consumption.[257][258] By the 13th century in Europe, monarchs such as those in England consumed it sparingly as a spice-like delicacy, reinforcing its association with power and exclusivity amid high costs from Venetian trade monopolies.[259][260] During the Renaissance, sugar's symbolic role extended to edible art forms known as "subtleties," elaborate sculptures molded from boiled sugar paste into architectural or mythological figures, such as mythical trees or heraldic emblems, displayed at banquets to dazzle guests and demonstrate the host's affluence and ingenuity.[261][262] These transient works, often gilded and scented, blurred the lines between cuisine and sculpture, embodying impermanence and sensory indulgence while underscoring sugar's transformation from spice to status-driven spectacle by the 16th century.[263][264] In religious contexts, sugar evokes themes of devotion and purity; in Hindu Puranic traditions, it appears in offerings to deities like Vireshvara, where its sweetness metaphorically represents spiritual devotion and auspiciousness.[265] Similarly, in Buddhist monastic practices, sugar serves as a portable provision for traveling monks, symbolizing sustenance amid precepts urging moderation to avoid attachment.[266] Across ancient civilizations, sweets derived from sugar or analogs featured in ceremonial offerings to gods, linking sweetness to divine favor and communal rituals predating widespread refinement techniques.[267] Culturally, sugar's symbolism persists in associations with celebration and hospitality, where its distribution in confections reinforces social bonds and identity, though historical scarcity shaped its role more as a marker of hierarchy than universal pleasure.[268] In folklore from certain European households, sugar's perceived spiritual properties—such as attracting prosperity when left exposed—further embedded it in beliefs about luck and domestic rituals, reflecting its evolution from exotic import to embedded cultural artifact.[269]Economic and Labor Impacts
The global sugar industry generates substantial economic value, with production reaching approximately 189 million metric tons in the 2024/2025 season, primarily from sugarcane and sugar beets.[3] Revenue for sugar manufacturing is projected at $83.2 billion in 2024, reflecting a compound annual growth rate of 5.6% over the prior five years despite annual fluctuations.[270] Brazil dominates production at 43.7 to 46.88 million metric tons annually, followed by India at 28 million tons and the European Union at 16.5 million tons, accounting for over 40% of worldwide output.[119][38] Sugar trade is heavily distorted by subsidies and tariffs, which elevate domestic prices in protected markets like the United States and European Union while disadvantaging exporters in developing countries.[271][272] In the U.S., the sugar program imposes costs of $2.4 to $4 billion annually on consumers through high prices and contributes to 17,000 to 20,000 job losses in sugar-using industries, as imported sugar quotas and tariffs limit cheaper foreign supply.[273] Export subsidies in the EU enable surplus disposal but depress global prices, undermining competitiveness for unsubsidized producers in Africa and Asia.[274] These policies perpetuate inefficiencies, with developing nations facing barriers to market access despite their reliance on sugar exports for foreign exchange and rural employment.[275]| Top Sugar Producers (2024/2025, million metric tons) | Production |
|---|---|
| Brazil | 43.7-46.88[119][38] |
| India | 28 [119] |
| European Union | 16.5 [119] |