")

Community hub
Recent from talks
Contribute something
Nothing was collected or created yet.
Geography (Ptolemy)
View on Wikipedia
The Geography (Ancient Greek: Γεωγραφικὴ Ὑφήγησις, Geōgraphikḕ Hyphḗgēsis, lit. "Geographical Guidance"), also known by its Latin names as the Geographia and the Cosmographia, is a gazetteer, an atlas, and a treatise on cartography, compiling the geographical knowledge of the 2nd-century Roman Empire. Originally written by Claudius Ptolemy in Greek at Alexandria around 150 AD, the work was a revision of a now-lost atlas by Marinus of Tyre using additional Roman and Persian gazetteers and new principles.[1]
Key Information

Its translation into Arabic by al-Khwarismi in the 9th century was highly influential on the geographical knowledge and cartographic traditions of the Islamic world. Alongside the works of Islamic scholars—and the commentary containing revised and more accurate data by Alfraganus—Ptolemy's work was subsequently highly influential on Medieval and Renaissance Europe.
Manuscripts
[edit]Versions of Ptolemy's work in antiquity were probably proper atlases with attached maps, although some scholars believe that the references to maps in the text were later additions.
No Greek manuscript of the Geography survives from earlier than the 13th century.[2] However fragmentary papyri of later somewhat derivative works such as the Table of Noteworthy Cities have been found with the earliest, Rylands Library GP 522, dating to the early 3rd century.[3][4] A letter written by the Byzantine monk Maximus Planudes records that he searched for one for Chora Monastery in the summer of 1295;[5] one of the earliest surviving texts may have been one of those he then assembled.[6][7] In Europe, maps were sometimes redrawn using the coordinates provided by the text,[8] as Planudes was forced to do.[5] Later scribes and publishers could then copy these new maps, as Athanasius did for the emperor Andronicus II Palaeologus.[5] The three earliest surviving texts with maps are those from Constantinople (Istanbul) based on Planudes's work.[a]

The first Latin translation of these texts was made in 1406 or 1407 by Jacobus Angelus in Florence, Italy, under the name Geographia Claudii Ptolemaei.[15] It is not thought that his edition had maps,[16] although Manuel Chrysoloras had given Palla Strozzi a Greek copy of Planudes's maps in Florence in 1397.[17]
| Repository and Collection Number | Siglum[18] | Date | Maps | Image |
|---|---|---|---|---|
| Vatican Library, Vat. Gr. 191[19] (f.128v-169v) | X | 12th-13th century | No extant maps | |
| Copenhagen University Library, Fragmentum Fabricianum Graecum 23[19] | F | 13th century | Fragmentary; originally world and 26 regional | |
| Vatican Library, Urbinas Graecus 82[19][20][21] | U | 13th century | World and 26 regional | 
|
| Istanbul Sultan's Library, Seragliensis 57[19] | K | 13th century | World and 26 regional (poorly preserved) | 
|
| Vatican Library, Vat. Gr. 177[19] | V | 13th century | No extant maps | |
| Laurentian Library, Plut. 28.49[19] | O[22] | 14th century | Originally world, 1 Europe, 2 Asia, 1 Africa, 63 regional (65 maps extant) | |
| Bibliothèque nationale de France, Gr. Supp. 119[19] | C | 14th century | No extant maps | |
| Vatican Library, Vat. Gr. 178[19] | W | 14th century | No extant maps | |
| British Library, Burney Gr. 111[19] | T | 14th-15th century | Maps derived from Florence, Pluto 28.49 | |
| Bodleian Library, 3376 (46)-Qu. Catal. i (Greek), Cod. Seld. 41[19] | N | 15th century | No extant maps | |
| Vatican Library, Pal. Gr. 388[19] | 15th century | World and 63 regional No extant maps | ||
| Laurentian Library, Pluto 28.9 (and related manuscript 28.38)[19] | 15th century | No extant maps | ||
| Biblioteca Marciana, Gr. 516[19] | R | 15th century | Originally world and 26 regional (world map, 2 maps, and 2 half maps missing) | |
| Vatican Library, Pal. Gr. 314[19] | Z | 15th century | No extant maps; written by Michael Apostolios in Crete | |
| British Library, Harley MS 3686 | 15th century | 
| ||
| Huntington Library, Wilton Codex[23] | 15th century | One world, ten of Europe, four of Africa, and twelve of Asia, elegantly coloured and illuminated with burnished gold. |
Stemma
[edit]
Berggren & Jones (2000) place these manuscripts into a stemma whereby U, K, F and N are connected with the activities of Maximos Planudes (c.1255-1305). From a sister manuscript to UKFN descends R, V, W & C, however the maps were either copied defectively or not at all. "Of the greatest importance for the text of the Geography" they state is manuscript X (Vat.Gr.191); "because it is the only copy that is uninfluenced by the Byzantine revision." e.g. the 13th-14th century corrections of Planudes, possibly associated with recreating the maps.[18]
Regarding the maps, they conclude that it was unlikely that extant maps survived from which the above stemma descends, even if maps existed in antiquity:
"The transmission of Ptolemy's text certainly passed through a stage when the manuscripts were too small to contain the maps. Planudes and his assistants therefore probably had no pictorial models, and the success of their enterprise is proof that Ptolemy succeeded in his attempt to encode the map in words and numbers. The copies of the maps in later manuscripts and printed editions of the Geography were reproduced from Planudes' reconstructions."[24]
Mittenhuber (2010) further divides the stemma into two recensions of the original c.AD 150 lost work: Ξ and Ω (c.3rd/4th cent., lost).[22] Recension Ω contains most of the extant manuscripts and is subdivided into a further two groups: Δ and Π. Group Δ contains parchment manuscripts from the end of the thirteenth century, which are the earliest extant manuscripts of the Geography; these are U, K & F. Recension, Ξ, is represented by one codex only, X. Mittenhuber agrees with Berggren & Jones, stating that "The so-called Codex X is of particular significance, because it contains many local names and coordinates that differ from the other manuscripts ... which cannot be explained by mere errors in the tradition.". Although no manuscripts survive from earlier than the late 13th century; there are references to the existence of ancient codicies in late antiquity. One such example is in an epistle by Cassiodorus (c.560 A.D.):
“Tum, si vos notitiae nobilis cura inflammaverit, habetis Ptolemaei codicem, qui sic omnia loca evidenter expressit, ut eum cunctarum regionum paene incolam fuisse iudicetis. Eoque fit, ut uno loco positi, sicut monachos decet, animo percurratis, quod aliquorum peregrinatio plurimo labore collegit.”(Institutiones 1, 25)[22].
The existence of ancient recensions that differ fundamentally to the surviving manuscript tradition can be seen in the epitomes of Markianos by Stephanus:
"Καὶ ἄλλοι οὕτως διὰ του π Πρετανίδες νῆσοι, ὡς Μαρκιανὸς καὶ Πτολεμαῖος."[25][26]
The tradition preserved within the stemma of surviving (13th-14th century) manuscripts by Stückelberger & Grasshoff only preserves "Β" and not "Π" recentions of "Βρεττανικήσ".[27]
Contents
[edit]The Geography consists of three sections, divided among 8 books. Book I is a treatise on cartography and chorography, describing the methods used to assemble and arrange Ptolemy's data. From Book II through the beginning of Book VII, a gazetteer provides longitude and latitude values for the world known to the ancient Romans (the "ecumene"). The rest of Book VII provides details on three projections to be used for the construction of a map of the world, varying in complexity and fidelity. Book VIII constitutes an atlas of regional maps. The maps include a recapitulation of some of the values given earlier in the work, which were intended to be used as captions to clarify the map's contents and maintain their accuracy during copying. Book 8 formed the basis for the Table of Noteworthy Cities.
Cartographical treatise
[edit]Maps based on scientific principles had been made in Europe since the time of Eratosthenes in the 3rd century BC. Ptolemy improved the treatment of map projections.[28] He provided instructions on how to create his maps in the first section of the work.
Gazetteer
[edit]The gazetteer section of Ptolemy's work provided latitude and longitude coordinates for all the places and geographical features in the work. Latitude was expressed in degrees of arc from the equator, the same system that is used now, though Ptolemy used fractions of a degree rather than minutes of arc.[29] His Prime Meridian, of 0 longitude, ran through the Fortunate Isles, the westernmost land recorded,[30] at around the position of El Hierro in the Canary Islands.[31] The maps spanned 180 degrees of longitude from the Fortunate Isles in the Atlantic to China.
Ptolemy was aware that Europe knew only about a quarter of the globe.[citation needed]
Atlas
[edit]Ptolemy's work included a single large and less detailed world map and then separate and more detailed regional maps. The first Greek manuscripts compiled after Maximus Planudes's rediscovery of the text had as many as 64 regional maps.[b] The standard set in Western Europe came to be 26: 10 European maps, 4 African maps, and 12 Asian maps. As early as the 1420s, these canonical maps were complemented by extra-Ptolemaic regional maps depicting, e.g., Scandinavia.
Content
[edit]The Geography is spread over 8 books with the main body of the work (books 2-7) is a list of some 8000 toponyms comprising the Oikumene of the second century AD. Book 1 is written in prose and is Ptolemy's explanation of the project, his method and his sources (mainly Marinos of Tyre). Book 8 offers descriptions for each of the maps created in books 2-7 and forms the basis of the Table of Noteworthy Cities. The critical edition was published by Stückelberger, Mittenhuber and Klöti (2006).[27]
Book 1
[edit]Book 1 is a theoretical treatise by Ptolemy outlining the subject matter, previous work and instructing the reader how to draw a world map using his projection systems. The sections are, to use Ptolemy's original titles:[33]
- On the difference between world cartography and regional cartography
- On the prerequisites for world cartography
- How the number of stades in the earth's circumference can be obtained from the number of stades in an arbitrary rectilinear interval, and vice versa, even if [the interval] is not on a single meridian
- That it is necessary to give priority to the [astronomical] phenomena over [data] from records of travel
- That it is necessary to follow the most recent researches because of changes in the world over time
- On Marinos' guide to world cartography
- Revision of Marinos' latitudinal dimension of the known world on the basis of the [astronomical] phenomena
- The same revision [of the latitudinal dimension], on the basis of land journeys
- The same revision [of the latitudinal dimension], on the basis of sea journeys
- That one should not put the Aithiopians south of the parallel situated opposite to that through Meroe
- On the computations that Marinos improperly made for the longitudinal dimension of the oikoumene
- The revision of the longitudinal dimension of the known world on the basis of journeys by land
- The same revision [of the longitudinal dimension] on the basis of journeys by sea
- On the crossing from the Golden Peninsula to Kattigara
- On the inconsistencies in details of Marinos' exposition
- That certain matters escaped [Marinos'] notice in the boundaries of the provinces
- On the inconsistencies between [Marinos] and the reports ofour time
- On the inconvenience of Marinos' compilations for drawing a map of the oikoumene
- On the convenience of our catalogue for making a map
- On the disproportional nature of Marinos' geographical map
- On the things that should be preserved in a planar map
- On how one should make a map of the oikoumene on a globe
- List of the meridians and parallels to be included in the map
- Method of making a map of the oikoumene in the plane in proper proportionality with its configuration on the globe (In this section Ptolemy explains two methods for projecting his map)
Book 2
[edit]Western Atlantic fringes, Gaul, Central Europe and the Iberian Peninsula.[34]
| Chapter | Region |
|---|---|
| Prologue | |
| 1 | Britannia: Hibernia |
| 2 | Britannia: Albion |
| 3 | Hispanic Baetica |
| 4 | Hispanic Tarraconensis |
| 5 | Hispanic Lusitania |
| 6 | Aquitanian Gaul |
| 7 | Lugdunensian Gaul |
| 8 | Belgic Gaul |
| 9 | Narbonensian Gaul |
| 10 | Greater Germania |
| 11 | Raetia and Vindelica |
| 12 | Noricum |
| 13 | Upper Pannonia |
| 14 | Lower Pannonia |
| 15 | Illyria or Liburnia and Dalmatia |
Book 3
[edit]Italy, Greece and the major Mediterranean Islands.[34]
| Chapter | Region |
|---|---|
| 1 | Italy |
| 2 | Corsica |
| 3 | Sardinia |
| 4 | Sicily |
| 5 | Sarmatia |
| 6 | Tauric Peninsula |
| 7 | Iazyges Metanastae |
| 8 | Dacia |
| 9 | Upper Moesia |
| 10 | Lower Moesia |
| 11 | Thracia and the Peloponnesian Peninsula |
| 12 | Macedonia |
| 13 | Epirus |
| 14 | Achaia |
| 15 | Crete |
Book 4
[edit]North Africa from Morocco to Egypt and Ethiopia.[34]
| Chapter | Region |
|---|---|
| 1 | Mauritania Tingitana |
| 2 | Mauritania Caesariensis |
| 3 | Numidia and Africa proper |
| 4 | Cyrenaica |
| 5 | Marmarica, which is properly called Libya, All of Egypt, both Lower and Upper |
| 6 | Libya Interior |
| 7 | Ethiopia below Egypt |
| 8 | Ethiopia in the interior below this |
Book 5
[edit]Covering Anatolia, Asia Minor, the Middle East and Near East as well as Cyprus.[34]
| Chapter | Region |
|---|---|
| 1 | Bithynia and Pontus |
| 2 | Asia |
| 3 | Lycia |
| 4 | Pamphylia |
| 5 | Galatia |
| 6 | Cappadocia |
| 7 | Cilicia |
| 8 | Asiatic Sarmatia |
| 9 | Colchis |
| 10 | Iberia |
| 11 | Albania |
| 12 | Greater Armenia |
| 13 | Cyprus |
| 14 | Syria |
| 15 | Palestine |
| 16 | Arabia Petraea |
| 17 | Mesopotamia |
| 18 | Arabia Deserta |
| 19 | Babylonia |
Book 6
[edit]In book 6, Ptolemy covers the Near East, Caucuses and Central Asia.[35][27]
| Chapter | Region |
|---|---|
| 1 | Assyria |
| 2 | Media |
| 3 | Susiane |
| 4 | Persis |
| 5 | Parthia |
| 6 | Karmania |
| 7 | Eudaimon |
| 8 | Karmianien |
| 9 | Hyrkanien |
| 10 | Margiane |
| 11 | Bactriane |
| 12 | Sogdianer |
| 13 | Saken |
| 14 | Skythia |
| 15 | Skythia |
| 16 | Serike |
| 17 | Areia |
| 18 | Paropanisaden |
| 19 | Drangiana |
| 20 | Archosien |
| 21 | Gedrosien |
Book 7
[edit]India, China, and Sri Lanka.[27][18]
| Chapter | Description |
|---|---|
| 1 | India before the Ganges |
| 2 | India beyond the Ganges |
| 3 | Land of Sinen |
| 4 | Taprobane |
| 5 | Summary caption of the map of the oikoumene |
| 6 | The mapping of a ringed globe with the oikoumene |
| 7 | Caption for the flattening [of the oikoumene] |
Book 8
[edit]Descriptions of the maps created by the previous sections with details of day length at solstice, etc. The gazetter of toponyms is thought to have formed the basis for the Table of Noteworthy Cities.[27]
| Chapter | Description |
|---|---|
| 1 | On the basis for dividing the oikoumene into the [regional] maps |
| 2 | Which things are appropriate to include in the caption for each map |
| 3 | Europe Map 1 |
| 4 | Europe Map 2 |
| 5 | Europe Map 3 |
| 6 | Europe Map 4 |
| 7 | Europe Map 5 |
| 8 | Europe Map 6 |
| 9 | Europe Map 7 |
| 10 | Europe Map 8 |
| 11 | Europe Map 9 |
| 12 | Europe Map 10 |
| 13 | Africa Map 1 |
| 14 | Africa Map 2 |
| 15 | Africa Map 3 |
| 16 | Africa Map 4 |
| 17 | Asia Map 1 |
| 18 | Asia Map 2 |
| 19 | Asia Map 3 |
| 20 | Asia Map 4 |
| 21 | Asia Map 5 |
| 22 | Asia Map 6 |
| 23 | Asia Map 7 |
| 24 | Asia Map 8 |
| 25 | Asia Map 9 |
| 26 | Asia Map 10 |
| 27 | Asia Map 11 |
| 28 | Asia Map 12 |
| 29 | Directory of the lands of the oikoumene |
| 30 | List of length and width of individual maps |
Image Gallery
[edit]-
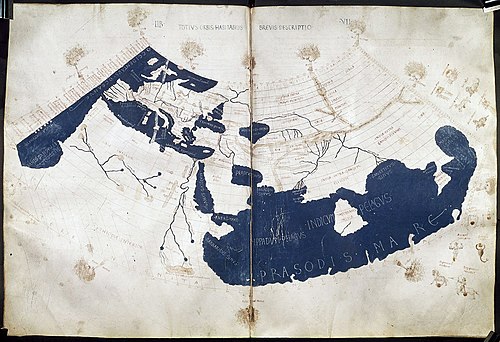 The Ptolemy world map, including the countries of "Serica" and "Sinae" (Cattigara) at the extreme right beyond the island of "Taprobane" (Sri Lanka) and the "Aurea Chersonesus" (Malay Peninsula).


_(cropped).jpg)

.jpeg)


.jpg)
.jpg)


_(cropped).jpg)

.jpg)
-

-

-

-
 4th Map of Asia
Cyprus, Syria, Palestine/Judea, Arabia Petrea and Deserta, Mesopotamia, and Babylonia -

-

-

-

-

-

-

-


.jpeg)
._1579.jpg)


.jpeg)
History
[edit]Antiquity
[edit]The original treatise by Marinus of Tyre that formed the basis of Ptolemy's Geography has been completely lost. A world map based on Ptolemy was displayed in Augustodunum (Autun, France) in late Roman times.[36] Pappus, writing at Alexandria in the 4th century, produced a commentary on Ptolemy's Geography and used it as the basis of his (now lost) Chorography of the Ecumene.[37] Later imperial writers and mathematicians, however, seem to have restricted themselves to commenting on Ptolemy's text, rather than improving upon it; surviving records actually show decreasing fidelity to real position.[37] Nevertheless, Byzantine scholars continued these geographical traditions throughout the Medieval period.[38]
Whereas previous Greco-Roman geographers such as Strabo and Pliny the Elder demonstrated a reluctance to rely on the contemporary accounts of sailors and merchants who plied distant areas of the Indian Ocean, Marinus and Ptolemy betray a much greater receptiveness to incorporating information received from them.[39] For instance, Grant Parker argues that it would be highly implausible for them to have constructed the Bay of Bengal as precisely as they did without the accounts of sailors.[39] When it comes to the account of the Golden Chersonese (i.e. Malay Peninsula) and the Magnus Sinus (i.e. Gulf of Thailand and South China Sea), Marinus and Ptolemy relied on the testimony of a Greek sailor named Alexandros, who claimed to have visited a far eastern site called "Cattigara" (most likely Oc Eo, Vietnam, the site of unearthed Antonine-era Roman goods and not far from the region of Jiaozhi in northern Vietnam where ancient Chinese sources claim several Roman embassies first landed in the 2nd and 3rd centuries).[40][41][42][43]
Medieval Islam
[edit]
Muslim cartographers were using copies of Ptolemy's Almagest and Geography by the 9th century.[44] At that time, in the court of the caliph al-Maʾmūm, al-Khwārazmī compiled his Book of the Depiction of the Earth (Kitab Surat al-Ard) which mimicked the Geography[45] in providing the coordinates for 545 cities and regional maps of the Nile, the Island of the Jewel, the Sea of Darkness, and the Sea of Azov.[45] A 1037 copy of these are the earliest extant maps from Islamic lands.[46] The text clearly states that al-Khwārazmī was working from an earlier map, although this could not have been an exact copy of Ptolemy's work: his Prime Meridian was 10° east of Ptolemy's, he adds some places, and his latitudes differ.[45] C.A. Nallino suggests that the work was not based on Ptolemy but on a derivative world map,[47] presumably in Syriac or Arabic.[45] The coloured map of al-Maʾmūm constructed by a team including al-Khwārazmī was described by the Persian encyclopædist al-Masʿūdī around 956 as superior to the maps of Marinus and Ptolemy,[48] probably indicating that it was built along similar mathematical principles.[49] It included 4530 cities and over 200 mountains.
Despite beginning to compile numerous gazetteers of places and coordinates indebted to Ptolemy,[50] Muslim scholars made almost no direct use of Ptolemy's principles in the maps which have survived.[44] Instead, they followed al-Khwārazmī's modifications and the orthogonal projection advocated by Suhrāb's early 10th-century treatise on the Marvels of the Seven Climes to the End of Habitation. Surviving maps from the medieval period were not done according to mathematical principles. The world map from the 11th-century Book of Curiosities is the earliest surviving map of the Muslim or Christian worlds to include a geographic coordinate system but the copyist seems to have not understood its purpose, starting it from the left using twice the intended scale and then (apparently realizing his mistake) giving up halfway through.[51] Its presence does strongly suggest the existence of earlier, now-lost maps which had been mathematically derived in the manner of Ptolemy,[46] al-Khwārazmi, or Suhrāb. There are surviving reports of such maps.[50]
Ptolemy's Geography was translated from Arabic into Latin at the court of King Roger II of Sicily in the 12th century AD.[52] However, no copy of that translation has survived.
Renaissance
[edit]The Greek text of the Geography reached Florence from Constantinople in about 1400 and was translated into Latin by Jacobus Angelus of Scarperia around 1406.[15] The reception of the Geography in Latin Europe was diverse. In the first half of the 15th century, Florentine humanists used it mainly as a philological resource to understand the geography of ancient texts; Venetian cartographers attempted to reconcile Ptolemaic maps with portolan charts and medieval mappaemundi, and French and German scholars with an interest in astrology focused on Ptolemy's cosmographical concepts.[53] Over the second half of the century, the prestige of the Geography grew to become the necessary framework of any reflection on geographical space.[54]
The first printed edition with maps, published in 1477 in Bologna, was also the first printed book with engraved illustrations.[55][56] Many editions followed (more often using woodcut in the early days), some following traditional versions of the maps, and others updating them.[55] An edition published at Ulm in 1482 was the first one printed north of the Alps. It became a commercial success and was reprinted in 1486.[57] Also in 1482, Francesco Berlinghieri printed the first edition in vernacular Italian. The edition published in Strasbourg in 1513 was a major step in the modernization of the Geography. It preserved the corpus of Ptolemy's text and maps as faithfully as possible to the original while it provided a separate set of 20 more accurate and up-to-date modern maps.[58] A much improved Latin translation of the Greek original was produced by Willibald Pirckheimer for the 1525 Strasbourg edition, and the first printed edition directly in Greek was authored by Erasmus of Rotterdam in Basel in 1533.

Ptolemy had mapped the whole world from the Fortunatae Insulae (Cape Verde[59] or Canary Islands) eastward to the eastern shore of the Magnus Sinus. This known portion of the world was comprised within 180 degrees. In his extreme east Ptolemy placed Serica (the Land of Silk), the Sinarum Situs (the Port of the Sinae), and the emporium of Cattigara. On the 1489 map of the world by Henricus Martellus, which was based on Ptolemy's work, Asia terminated in its southeastern point in a cape, the Cape of Cattigara. Cattigara was understood by Ptolemy to be a port on the Sinus Magnus, or Great Gulf, the actual Gulf of Thailand, at eight and a half degrees north of the Equator, on the coast of Cambodia, which is where he located it in his Canon of Famous Cities. It was the easternmost port reached by shipping trading from the Graeco-Roman world to the lands of the Far East.[60] In Ptolemy's later and better-known Geography, a scribal error was made and Cattigara was located at eight and a half degrees South of the Equator. On Ptolemaic maps, such as that of Martellus, Catigara was located on the easternmost shore of the Mare Indicum, 180 degrees East of the Cape St Vincent at, due to the scribal error, eight and a half degrees South of the Equator.[61]
Catigara is also shown at this location on Martin Waldseemüller's 1507 world map, which avowedly followed the tradition of Ptolemy. Ptolemy's information was thereby misinterpreted so that the coast of China, which should have been represented as part of the coast of eastern Asia, was falsely made to represent an eastern shore of the Indian Ocean. As a result, Ptolemy implied more land east of the 180th meridian and an ocean beyond. Marco Polo’s account of his travels in eastern Asia described lands and seaports on an eastern ocean apparently unknown to Ptolemy. Marco Polo’s narrative authorized the extensive additions to the Ptolemaic map shown on the 1492 globe of Martin Behaim. The fact that Ptolemy did not represent an eastern coast of Asia made it admissible for Behaim to extend that continent far to the east. Behaim’s globe placed Marco Polo’s Mangi and Cathay east of Ptolemy’s 180th meridian, and the Great Khan’s capital, Cambaluc (Beijing), on the 41st parallel of latitude at approximately 233 degrees East. Behaim allowed 60 degrees beyond Ptolemy’s 180 degrees for the mainland of Asia and 30 degrees more to the east coast of Cipangu (Japan). Cipangu and the mainland of Asia were thus placed only 90 and 120 degrees, respectively, west of the Canary Islands.
The Codex Seragliensis was used as the base of a new edition of the work in 2006.[14] This new edition was used to "decode" Ptolemy's coordinates of Books 2 and 3 by an interdisciplinary team of TU Berlin, presented in publications in 2010[62] and 2012.[63][64]
Influence on Christopher Columbus
[edit]Christopher Columbus modified this geography further by using 53+2⁄3 Italian nautical miles as the length of a degree instead of the longer degree of Ptolemy, and by adopting Marinus of Tyre’s longitude of 225 degrees for the east coast of the Magnus Sinus. This resulted in a considerable eastward advancement of the longitudes given by Martin Behaim and other contemporaries of Columbus. By some process Columbus reasoned that the longitudes of eastern Asia and Cipangu respectively were about 270 and 300 degrees east, or 90 and 60 degrees west of the Canary Islands. He said that he had sailed 1100 leagues from the Canaries when he found Cuba in 1492. This was approximately where he thought the coast of eastern Asia would be found. On this basis of calculation he identified Hispaniola with Cipangu, which he had expected to find on the outward voyage at a distance of about 700 leagues from the Canaries. His later voyages resulted in further exploration of Cuba and in the discovery of South and Central America. At first South America, the Mundus Novus (New World) was considered to be a great island of continental proportions; but as a result of his fourth voyage, it was apparently considered to be identical with the great Upper India peninsula (India Superior) represented by Behaim – the Cape of Cattigara. This seems to be the best interpretation of the sketch map made by Alessandro Zorzi on the advice of Bartholomew Columbus (Christopher's brother) around 1506, which bears an inscription saying that according to the ancient geographer Marinus of Tyre and Christopher Columbus the distance from Cape St Vincent on the coast of Portugal to Cattigara on the peninsula of India Superior was 225 degrees, while according to Ptolemy the same distance was 180 degrees.[65]
Early modern Ottoman Empire
[edit]Prior to the 16th century, knowledge of geography in the Ottoman Empire was limited in scope, with almost no access to the works of earlier Islamic scholars that superseded Ptolemy. His Geography would again be translated and updated with commentary into Arabic under Mehmed II, who commissioned works from Byzantine scholar George Amiroutzes in 1465 and the Florentine humanist Francesco Berlinghieri in 1481.[66][67]
Longitudes error and Earth size
[edit]There are two related errors:[68]
- Considering a sample of 80 cities amongst the 6345 listed by Ptolemy, those that are both identifiable and for which we can expect a better distance measurement since they were well known, there is a systematic overestimation of the longitude by a factor 1.428 with a high confidence (coefficient of determination r² = 0.9935). This error produces evident deformations in Ptolemy's world map most apparent for example in the profile of Italy, which is markedly stretched horizontally.
- Ptolemy accepted that the known Ecumene spanned 180° of longitude, but instead of accepting Eratosthenes's estimate for the circumference of the Earth of 252,000 stadia, he shrinks it to 180,000 stadia, with a factor of 1.4 between the two figures.
This suggests Ptolemy rescaled his longitude data to fit with a figure of 180,000 stadia for the circumference of the Earth, which he described as a "general consensus".[68] Ptolemy rescaled experimentally obtained data in many of his works on geography, astrology, music, and optics.
Gallery
[edit]-
 Codex Seragliensis GI 57, fol. 33v
 -

-
 1535 printed edition, title page
 -
 19th-century print in Latin (3 volumes)
 -
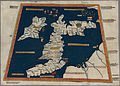 Prima Europe tabula One of the earliest surviving copies of Ptolemy's 2nd-century map of Great Britain and Ireland. 2nd edition, 1482.
 -
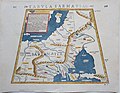 Sebastian Munster, Tabula Sarmatiae, 1571
 -
 Sebastian Munster, Tabula Sarmatiae, 1571 (reverse)

_Scandinavia.jpg)


See also
[edit]Notes
[edit]- ^ They are the Urbanas Graecus 82,[9] the Fragmentum Fabricianum Graecum 23,[10] and the Seragliensis 57.[11] The Urbanas Graecus is usually considered the oldest,[12][13] although some argue for the precedence of the Turkish manuscript.[14]
- ^ For example, the illustrations for British Library, Burney MS 111,[32] most of which were inserted into an earlier copy of the Geography during the early 15th century.
Citations
[edit]- ^ Berggren (2000).
- ^ Dilke (1987b), pp. 267–268.
- ^ Defaux, Olivier (2020-01-01). "Le Papyrus Rylands 522/523 et les tables de Ptolémée". Zeitschrift für Papyrologie und Epigraphik.
- ^ Defaux, Olivier (2017). The Iberian Peninsula in Ptolemy's Geography. Origins of the Coordinates and Textual History. Berlin: Edition Topoi. p. 124.
- ^ a b c Dilke (1987b), p. 268.
- ^ Biblioteca Apostolica Vaticana [The Apostolic Vatican Library]. Vat. Gr. 177. Late 13th century
- ^ Baigent, Elizabeth; Burri, Renate (2009). "The Rediscovery of Ptolemy's Geography (End of the Thirteenth to End of the Fifteenth Century)". Imago Mundi. 61 (1): 124–125. ISSN 0308-5694. JSTOR 40234225.
- ^ Milanesi (1996).
- ^ Biblioteca Apostolica Vaticana [The Apostolic Vatican Library]. Urbinas Graecus 82. Late 13th century
- ^ Universitetsbiblioteket [The University Library of Copenhagen]. Fragmentum Fabricianum Graecum 23. Late 13th century
- ^ The Sultan's Library in Istanbul. Codex Seragliensis GI 57. Late 13th century
- ^ Dilke (1987b), p. 269.
- ^ Diller (1940).
- ^ a b Stückelberger (2006).
- ^ a b Angelus (c. 1406).
- ^ Clemens (2008), p. 244.
- ^ Edson, Evelyn (2007-05-30). The World Map, 1300-1492: The Persistence of Tradition and Transformation. JHU Press. ISBN 978-0-8018-8589-1.
- ^ a b c Ptolemy; Berggren, J. Lennart; Jones, Alexander (2002). Ptolemy's Geography: An Annotated Translation of the Theoretical Chapters. Princeton University Press. pp. 41–5. ISBN 978-0-691-09259-1.
- ^ a b c d e f g h i j k l m n Oswald A. W. Dilke, "The Culmination of Greek Cartography in Ptolemy," in J. B. Harley and David Woodward, The History of Cartography, volume one. Cartography in Prehistoric, Ancient, and Medieval Europe and the Mediterranean. Chicago: The University of Chicago Press, 1987, pp. 177-200.
- ^ "Pinakes | Πίνακες - Notice : Vaticano, Città del Vaticano, Biblioteca Apostolica Vaticana (BAV), Urb. gr., 082". pinakes.irht.cnrs.fr. Retrieved 2025-05-06.
- ^ "DigiVatLib". digi.vatlib.it. Archived from the original on 2023-11-17. Retrieved 2025-05-06.
- ^ a b c Mittenhuber, Florian (2010), Jones, Alexander (ed.), "The Tradition of Texts and Maps in Ptolemy's Geography", Ptolemy in Perspective: Use and Criticism of his Work from Antiquity to the Nineteenth Century, Archimedes, vol. 23, Dordrecht: Springer Netherlands, pp. 95–119, doi:10.1007/978-90-481-2788-7_4, ISBN 978-90-481-2788-7, retrieved 2024-07-25
- ^ "Ptolemy, Geographia : cartographic material : manuscript". The Huntington Library. 1475. Retrieved 2022-09-07.
- ^ Ptolemy; Berggren, J. Lennart; Jones, Alexander (2002-01-15). Ptolemy's Geography: An Annotated Translation of the Theoretical Chapters. Princeton University Press. pp. 49–50. ISBN 978-0-691-09259-1.
- ^ Billerbeck, Margarethe (2006). Stephanus Byzantius Ethnica [vol. A] [Alpha Gamma] [2006] By Margarethe Billerbeck (in Greek). pp. 378–9.
- ^ Byzantium.), Stephanus (of (1849). Stephani Byzantii Ethnicorvm quae svpersvnt (in Greek). G. Reimeri. p. 186.
- ^ a b c d e Stückelberger, Alfred; Grasshoff, Gerd; Mittenhuber, Florian; Burri, Renate; Geus, Klaus; Winkler, Gerhard; Ziegler, Susanne; Hindermann, Judith; Koch, Lutz (2017-07-21). Klaudios Ptolemaios. Handbuch der Geographie: 1. Teilband: Einleitung und Buch 1-4 & 2. Teilband: Buch 5-8 und Indices (in Greek). Schwabe Verlag (Basel). pp. 146–7. ISBN 978-3-7965-3703-5.
- ^ Snyder, John (1997-12-05). Flattening the Earth. University of Chicago Press. p. 6. ISBN 9780226767475.
- ^ Talbert, Richard (2017). Roman Portable Sundials: The Empire in Your Hand. Oxford University Press. pp. 119–123.
- ^ Wright (1923).
- ^ de Grijs, Richard (2017). Time and Time Again Determination of longitude at sea in the 17th Century. IOP Publishing. doi:10.1088/978-0-7503-1194-6ch7. ISBN 978-0-7503-1194-6.
- ^ Images from Burney MS 111 at Wikicommons.
- ^ Ptolemaeus, Claudius; Berggren, J. L.; Jones, Alexander (2002). Ptolemy's geography: an annotated translation of the theoretical chapters. Princeton, NJ: Princeton Univ. Press. ISBN 978-0-691-09259-1.
- ^ a b c d Thayer, Bill. "Ptolemy: the Geography". Lacus Curtius. University of Chicago. Retrieved 13 April 2023.
- ^ href=; href= (160). "Ptolemaeus, Geography (II-VI)". original translation. Retrieved 2025-04-24.
- ^ "Ptolemy's World Map". www.bl.uk. Archived from the original on 2019-04-28. Retrieved 2020-01-15.
- ^ a b Dilke (1987a), p. 234.
- ^ Codex Athous Vatopedinus 655: Add MS 19391, f 19v-20 (British Library, London)
- ^ a b Parker (2008), p. 118.
- ^ Young (2001), p. 29.
- ^ Mawer (2013), p. 38.
- ^ Suárez (1999), p. 90-92.
- ^ Yule (1915), p. 52.
- ^ a b Edson (2004), pp. 61–62.
- ^ a b c d Rapoport (2008), p. 128.
- ^ a b Rapoport (2008), p. 127.
- ^ Nallino (1939).
- ^ al-Masʿūdī 1894, 33.
- ^ Rapoport (2008), p. 130.
- ^ a b Rapoport (2008), p. 129.
- ^ Rapoport (2008), p. 126–127.
- ^ Amari, Michele (1872). "Il Libro di Re Ruggiero ossia la Geografia di Edrisis". Bollettino della Società Geografica Italiana (7): 1–24.. Cited in Kahlaoui, Tarek (2018). Creating the Mediterranean : Maps and the Islamic imagination. Brill. p. 148. ISBN 9789004347380.
- ^ Gautier-Dalché, Patrick (2009). La géographie de Ptolémée en occident, IV-XVIe siècle. Terrarum orbis. Turnhout: Brépols. pp. 189–214. ISBN 978-2-503-53164-9.
- ^ Gautier-Dalché 2009, 267-268.
- ^ a b Landau, David; Parshall, Peter (1996). The Renaissance Print. Yale. pp. 241–242. ISBN 978-0-300-06883-2.
- ^ Crone, G.R. (Dec 1964). "review of Theatrum Orbis Terrarum. A Series of Atlases in Facsimile". The Geographical Journal. 130 (4): 577–578. doi:10.2307/1792324. JSTOR 1792324.
- ^ Gautier-Dalché 2009, 306-308
- ^ Gautier-Dalché 2009, 308-310.
- ^ Dennis Rawlins (March 2008). "The Ptolemy GEOGRAPHY's Secrets" (PDF). DIO - the International Journal of Scientific History. 14: 33. Bibcode:2008DIO....14...33R. ISSN 1041-5440.
- ^ J.W. McCrindle, Ancient India as described by Ptolemy, London, Trubner, 1885, revised edition by Ramachandra Jain, New Delhi, Today & Tomorrow’s Printers & Publishers, 1974, p.204: “By the Great Gulf is meant the Gulf of Siam, together with the sea that stretches beyond it toward China”; Albert Herrmann, “Der Magnus Sinus und Cattigara nach Ptolemaeus”, Comptes Rendus du 15me Congrès International de Géographie, Amsterdam, 1938, Leiden, Brill, 1938, tome II, sect. IV, Géographie Historique et Histoire de la Géographie, pp.123-8.[1]
- ^ Paul Schnabel, „Die Entstehungsgeschichte des kartographischen Erdbildes des Klaudios Ptolemaios“, Sitzungsberichte der Preussischen Akademie der Wissenschaften: Philosophisch-Historische Klasse, Verlag der Akademie der Wissenschaften, Bd.XIV, 1930, S.214-250, n.b. 239-243; cited in Albert Herrmann, “South-Eastern Asia on Ptolemy’s Map”, Research and Progress: Quarterly Review of German Science, vol.V, no.2, March–April 1939, pp.121-127, p.123.
- ^ Andreas Kleineberg, Christian Marx, Eberhard Knobloch, Dieter Lelgemann, Germania und die Insel Thule. Die Entschlüsselung von Ptolemaios´ „Atlas der Oikumene“. Wissenschaftliche Buchgesellschaft, Darmstadt, 2010, ISBN 978-3-534-23757-9.
- ^ Andreas Kleineberg, Christian Marx, Dieter Lelgemann, Europa in der Geographie des Ptolemaios. Die Entschlüsselung des „Atlas Oikumene“: Zwischen Orkney, Gibraltar und den Dinariden. Wissenschaftliche Buchgesellschaft, Darmstadt, 2010, ISBN 978-3-534-24835-3.
- ^ Christian Marx, Andreas Kleineberg, Die Geographie des Ptolemaios. Geographike Hyphegesis Buch 3: Europa zwischen Newa, Don und Mittelmeer. epubli, Berlin, 2012, ISBN 978-3-8442-2809-0.
- ^ “Alberico”, vol.IV, c. 169, Florence, Biblioteca Nazionale Centrale, Banco Rari 234; Sebastian Crino, "Schizzi cartografici inediti dei primi anni della scoperta dell' America", Rivista marittima, vol. LXIV, no.9, Supplemento, Novembre 1930, p.48, fig.18. Downloadable at: https://www.henry-davis.com/MAPS/Ren/Ren1/304.1.html Archived 2018-06-15 at the Wayback Machine
- ^ Casale, Giancarlo (2003). The Ottoman 'Discovery' of the Indian Ocean in the Sixteenth Century: The Age of Exploration from an Islamic Perspective.
- ^ Brotton, Jerry. Trading Territories: Mapping the Early Modern World. p. 101. Archived from the original on 2016-04-06.
- ^ a b Lucio Russo (2012). "Ptolemy's Longitudes and Eratosthenes' Measurement of the Earth's Circumference" (PDF). Mathematics and Mechanics of Complex Systems. 1: 67–79. doi:10.2140/memocs.2013.1.67.
References
[edit]- Ptolemy. Translated by Jacobus Angelus (c. 1406), Geographia. (in Latin)
- Berggren, J. Lennart & Alexander Jones (2000), Ptolemy's Geography: An Annotated Translation of the Theoretical Chapters, Princeton: Princeton University Press, ISBN 978-0-691-09259-1.
- Clemens, Raymond (2008), "Medieval Maps in a Renaissance Context: Gregorio Dati", in Talbert, Richard J.A.; Unger, Richard Watson (eds.), Cartography in Antiquity and the Middle Ages: Fresh Perspectives, New Methods, Leiden: Koninklijke Brill NV, pp. 237–256
- Dilke, Oswald Ashton Wentworth (1987a), "14 · Itineraries and Geographical Maps in the Early and Late Roman Empires" (PDF), History of Cartography, vol. I, Chicago: University of Chicago Press, pp. 234–257.
- Dilke, Oswald Ashton Wentworth (1987b), "15 · Cartography in the Byzantine Empire" (PDF), History of Cartography, vol. I, Chicago: University of Chicago Press, pp. 258–275.
- Diller, Aubrey (1940), "The Oldest Manuscripts of Ptolemaic Maps", Transactions of the American Philological Association, pp. 62–67.
- Edson, Evelyn & al. (2004), Medieval Views of the Cosmos, Oxford: Bodleian Library, ISBN 978-1-85124-184-2.
- al-Masʿūdī (1894), "Kitāb al-Tanbīh wa-al-ishrāf", Bibliotheca Geographorum Arabicorum, vol. 8, Leiden: Brill.
- Mawer, Granville Allen (2013). "The Riddle of Cattigara". In Nichols, Robert and Martin Woods (ed.). Mapping Our World: Terra Incognita to Australia. National Library of Australia. pp. 38–39. ISBN 9780642278098.
- Milanesi, Marica (1996), "A Forgotten Ptolemy: Harley Codex 3686 in the British Library", Imago Mundi, 48: 43–64, doi:10.1080/03085699608592832.
- Nallino, C.A. (1939), "Al-Ḥuwārismī e il suo rifacimento della Geografia di Tolomeo", Raccolta di scritti editi e inediti, vol. V, Rome: Istituto per l'Oriente, pp. 458–532. (in Italian)
- Parker, Grant (2008). The Making of Roman India. Cambridge University Press. ISBN 978-0-521-85834-2.
- Peerlings, Robert; Laurentius, Frans; van den Bovenkamp, Jaap (2017), "The watermarks in the Rome editions of Ptolemy's Cosmography and more", Quaerendo, 47 (3–4), Leiden: Koninklijke Brill NV: 307–327, doi:10.1163/15700690-12341392.
- Peerlings, Robert; Laurentius, Frans; van den Bovenkamp, Jaap (2018), "New findings and discoveries in the 1507/8 Rome edition of Ptolemy's Cosmography", Quaerendo, 48 (2), Leiden: Koninklijke Brill NV: 139–162, doi:10.1163/15700690-12341408, S2CID 165379448.
- Rapoport, Yossef; et al. (2008), "The Book of Curiosities and a Unique Map of the World", Cartography in Antiquity and the Middle Ages: Fresh Perspectives, New Methods, Leiden: Koninklijke Brill NV, pp. 121–138.
- Stückelberger, Alfred & al., eds. (2006), Ptolemaios Handbuch der Geographie (Griechisch-Deutsch) [Ptolemy's Manual on Geography (Greek/German)], Schwabe, ISBN 978-3-7965-2148-5. (in German and Greek)
- Suárez, Thomas (1999), Early Mapping of Southeast Asia, Periplus Editions, ISBN 978-962-593-470-9.
- Wright, John Kirtland (1923), "Notes on the Knowledge of Latitudes and Longitudes in the Middle Ages", Isis, V (1): 75–98, doi:10.1086/358121, JSTOR 223599, S2CID 143159033.
- Young, Gary Keith (2001). Rome's Eastern Trade: International Commerce and Imperial Policy, 31 BC-AD 305. Routledge. ISBN 978-0-415-24219-6.
- Yule, Henry (1915). Henri Cordier (ed.). Cathay and the Way Thither: Being a Collection of Medieval Notices of China, Vol I: Preliminary Essay on the Intercourse Between China and the Western Nations Previous to the Discovery of the Cape Route. Vol. 1. Hakluyt Society.
Further reading
[edit]- Blažek, Václav. "Etymological Analysis of Toponyms from Ptolemy's Description of Central Europe". In: Studia Celto-Slavica 3 (2010): 21–45. DOI: https://doi.org/10.54586/GTQF3679.
- Blažek, Václav. "The North-Eastern Border of the Celtic World". In: Studia Celto-Slavica 8 (2018): 7–21. DOI: https://doi.org/10.54586/ZMEE3109.
- Cosgrove, Dennis. 2003. Apollo's Eye: A Cartographic Genealogy of the Earth in the Western Imagination. Johns Hopkins University Press. Baltimore and London.
- Gautier Dalché, Patrick. 2009. La Géographie de Ptolémée en Occident (IVe-XVIe siècle). Terratum Orbis. Turnhout. Brepols, .
- Shalev, Zur, and Charles Burnett, eds. 2011. Ptolemy's Geography in the Renaissance. London; Turin. Warburg Institute; Nino Aragno. (In Appendix: Latin text of Jacopo Angeli's introduction to his translation of the Geography, with English translation by C. Burnett.)
- Stevenson, Edward Luther. Trans. and ed. 1932. Claudius Ptolemy: The Geography. New York Public Library. Reprint: Dover, 1991. This is the only complete English translation of Ptolemy's most famous work. Unfortunately, it is marred by numerous mistakes (see Diller) and the place names are given in Latinised forms, rather than in the original Greek.
- Diller, Aubrey (February 1935). "Review of Stevenson's translation". Isis. 22 (2): 533–539. doi:10.1086/346925. Retrieved 2007-07-15.
External links
[edit]Primary sources
[edit]- Greek
- Klaudios Ptolemaios: Handbuch der Geographie, hrsg. von Alfred Stückelberger und Gerd Grasshoff (Basel: Schwabe, 2006)
- (in Greek) Claudii Ptolemaei Geographia, ed. Karl Friedrich August Nobbe, Sumptibus et typis Caroli Tauchnitii, 1843, tom. I (books 1–4, missing p. 126); 1845, tom. II (books 5–8); 1845, tom. III (indices).
- Rylands Library GP 522, the earliest papyrus fragment of the Table of Noteworthy Cities. Catalogue list entry here.
- Vatican Urb.gr.82, the earliest surviving Byzantine manuscript maps of the Geography.
- Latin
- (in Latin) La Cosmographie de Claude Ptolemée, Latin manuscript copied around 1411
- (in Latin) Geography, digitized codex made in Italy between 1460 and 1477, translated to Latin by Jacobus Angelus at Somni. Also known as codex valentinus, it is the oldest manuscript of the codices with maps of Ptolemy with the donis projections.
- (in Latin) "Cosmographia" / Claudius Ptolemaeus. Translated into Latin by Jacobus Angelus, and edited by Nicolaus Germanus. – Ulm : Lienhart Holle. – 1482. (In the National Library of Finland.)
- (in Latin) Geographia Universalis, Basileae apud Henricum Petrum mense Martio anno M. D. XL. [of Basel, printed by Henricus Petrus in the month of March in the year 1540].
- (in Latin) Geographia Cl. Ptolemaei Alexandrini, Venetiis : apud Vincentium Valgrisium, Venezia, 1562.
- Portuguese
- Pedro Nunes, Tratado da Sphera com a Theorica do Sol e da Lua e ho Primeiro Liuro da Geographia de Claudio Ptolomeo Alexãndrino, Oficina de Germão Galharde, Lisboa, 1537 (Republished in: Pedro Nunes. Obras, vol. I, Ed. Academia das Ciências de Lisboa, pp. 1-159).
- Italian
- (in Italian) Geografia cioè descrittione vniuersale della terra partita in due volumi..., In Venetia : appresso Gio. Battista et Giorgio Galignani fratelli, 1598.
- (in Italian) Geografia di Claudio Tolomeo alessandrino, In Venetia : appresso gli heredi di Melchior Sessa, 1599.
- English
- Ptolemy's Geography at LacusCurtius (English translation)
- Extracts of Ptolemy on the country of the Seres (China) (English translation)
- 1st critical edition of Geography Book 8, by Aubrey Diller
- Geography Books 2.10-6.11 in English, with most Greece-related places geolocated, by John Brady Kiesling at ToposText
- AncientMiddleEast.com, geo-located .KMZ plots of nearly all points in Non-European regions, Books 4-7, for use in GoogleEarth.
German
- "Heaven and Earth : Ptolemy, the astronomer and geographer" (PDF). Archived (PDF) from the original on 6 June 2024. Retrieved 24 April 2025. 2006 Exhibition by Alfred Stückelberger, Florian Mittenhuber and Thomas Klöti
Secondary material
[edit]- Ptolemy the Geographer
- Ptolemy's Geography of Asia – Selected problems of Ptolemy's Geography of Asia (in German)
- History of Cartography Archived 2011-09-27 at the Wayback Machine including a discussion of the Geographia
- Claudius Ptolemy’s East Africa Georeferenced and Visualized
- Ptolemaios-Forschungsstelle (Ptolemy Research Institute, University of Bern)
