
Community hub
Recent from talks
Contribute something
Nothing was collected or created yet.
Oceanography
View on Wikipedia

Oceanography (from Ancient Greek ὠκεανός (ōkeanós) 'ocean' and γραφή (graphḗ) 'writing'), also known as oceanology, sea science, ocean science, and marine science, is the scientific study of the ocean, including its physics, chemistry, biology, and geology.
It is an Earth science, which covers a wide range of topics, including ocean currents, waves, and geophysical fluid dynamics; fluxes of various chemical substances and physical properties within the ocean and across its boundaries; ecosystem dynamics; and plate tectonics and seabed geology.
Oceanographers draw upon a wide range of disciplines to deepen their understanding of the world’s oceans, incorporating insights from astronomy, biology, chemistry, geography, geology, hydrology, meteorology and physics.
History
[edit]
Early history
[edit]Humans first acquired knowledge of the waves and currents of the seas and oceans in pre-historic times. Observations on tides were recorded by Aristotle and Strabo in 384–322 BC.[1] Early exploration of the oceans was primarily for cartography and mainly limited to its surfaces and of the animals that fishermen brought up in nets, though depth soundings by lead line were taken.
The Portuguese campaign of Atlantic navigation is the earliest example of a systematic scientific large project, sustained over many decades, studying the currents and winds of the Atlantic.
The work of Pedro Nunes (1502–1578) is remembered in the navigation context for the determination of the loxodromic curve: the shortest course between two points on the surface of a sphere represented onto a two-dimensional map.[2][3] When he published his "Treatise of the Sphere" (1537), mostly a commentated translation of earlier work by others, he included a treatise on geometrical and astronomic methods of navigation. There he states clearly that Portuguese navigations were not an adventurous endeavour:
"nam se fezeram indo a acertar: mas partiam os nossos mareantes muy ensinados e prouidos de estromentos e regras de astrologia e geometria que sam as cousas que os cosmographos ham dadar apercebidas (...) e leuaua cartas muy particularmente rumadas e na ja as de que os antigos vsauam" (were not done by chance: but our seafarers departed well taught and provided with instruments and rules of astrology (astronomy) and geometry which were matters the cosmographers would provide (...) and they took charts with exact routes and no longer those used by the ancient).[4]
His credibility rests on being personally involved in the instruction of pilots and senior seafarers from 1527 onwards by Royal appointment, along with his recognized competence as mathematician and astronomer.[2] The main problem in navigating back from the south of the Canary Islands (or south of Boujdour) by sail alone, is due to the change in the regime of winds and currents: the North Atlantic gyre and the Equatorial counter current [5] will push south along the northwest bulge of Africa, while the uncertain winds where the Northeast trades meet the Southeast trades (the doldrums) [6] leave a sailing ship to the mercy of the currents. Together, prevalent current and wind make northwards progress very difficult or impossible. It was to overcome this problem and clear the passage to India around Africa as a viable maritime trade route, that a systematic plan of exploration was devised by the Portuguese. The return route from regions south of the Canaries became the 'volta do largo' or 'volta do mar'. The 'rediscovery' of the Azores islands in 1427 is merely a reflection of the heightened strategic importance of the islands, now sitting on the return route from the western coast of Africa (sequentially called 'volta de Guiné' and 'volta da Mina'); and the references to the Sargasso Sea (also called at the time 'Mar da Baga'), to the west of the Azores, in 1436, reveals the western extent of the return route.[7] This is necessary, under sail, to make use of the southeasterly and northeasterly winds away from the western coast of Africa, up to the northern latitudes where the westerly winds will bring the seafarers towards the western coasts of Europe.[8]
The secrecy involving the Portuguese navigations, with the death penalty for the leaking of maps and routes, concentrated all sensitive records in the Royal Archives, completely destroyed by the Lisbon earthquake of 1775. However, the systematic nature of the Portuguese campaign, mapping the currents and winds of the Atlantic, is demonstrated by the understanding of the seasonal variations, with expeditions setting sail at different times of the year taking different routes to take account of seasonal predominate winds. This happens from as early as late 15th century and early 16th: Bartolomeu Dias followed the African coast on his way south in August 1487, while Vasco da Gama would take an open sea route from the latitude of Sierra Leone, spending three months in the open sea of the South Atlantic to profit from the southwards deflection of the southwesterly on the Brazilian side (and the Brazilian current going southward - Gama departed in July 1497); and Pedro Álvares Cabral (departing March 1500) took an even larger arch to the west, from the latitude of Cape Verde, thus avoiding the summer monsoon (which would have blocked the route taken by Gama at the time he set sail).[9] Furthermore, there were systematic expeditions pushing into the western Northern Atlantic (Teive, 1454; Vogado, 1462; Teles, 1474; Ulmo, 1486).[10]
The documents relating to the supplying of ships, and the ordering of sun declination tables for the southern Atlantic for as early as 1493–1496,[11] all suggest a well-planned and systematic activity happening during the decade long period between Bartolomeu Dias finding the southern tip of Africa, and Gama's departure; additionally, there are indications of further travels by Bartolomeu Dias in the area.[7] The most significant consequence of this systematic knowledge was the negotiation of the Treaty of Tordesillas in 1494, moving the line of demarcation 270 leagues to the west (from 100 to 370 leagues west of the Azores), bringing what is now Brazil into the Portuguese area of domination. The knowledge gathered from open sea exploration allowed for the well-documented extended periods of sail without sight of land, not by accident but as pre-determined planned route; for example, 30 days for Bartolomeu Dias culminating on Mossel Bay, the three months Gama spent in the South Atlantic to use the Brazil current (southward), or the 29 days Cabral took from Cape Verde up to landing in Monte Pascoal, Brazil.
The Danish expedition to Arabia 1761–67 can be said to be the world's first oceanographic expedition, as the ship Grønland had on board a group of scientists, including naturalist Peter Forsskål, who was assigned an explicit task by the king, Frederik V, to study and describe the marine life in the open sea, including finding the cause of mareel, or milky seas. For this purpose, the expedition was equipped with nets and scrapers, specifically designed to collect samples from the open waters and the bottom at great depth.[12]
Although Juan Ponce de León in 1513 first identified the Gulf Stream, and the current was well known to mariners, Benjamin Franklin made the first scientific study of it and gave it its name. Franklin measured water temperatures during several Atlantic crossings and correctly explained the Gulf Stream's cause. Franklin and Timothy Folger printed the first map of the Gulf Stream in 1769–1770.[13][14]

Information on the currents of the Pacific Ocean was gathered by explorers of the late 18th century, including James Cook and Louis Antoine de Bougainville. James Rennell wrote the first scientific textbooks on oceanography, detailing the current flows of the Atlantic and Indian oceans. During a voyage around the Cape of Good Hope in 1777, he mapped "the banks and currents at the Lagullas". He was also the first to understand the nature of the intermittent current near the Isles of Scilly, (now known as Rennell's Current).[15] The tides and currents of the ocean are distinct. Tides are the rise and fall of sea levels created by the combination of the gravitational forces of the Moon along with the Sun (the Sun just in a much lesser extent) and are also caused by the Earth and Moon orbiting each other. An ocean current is a continuous, directed movement of seawater generated by a number of forces acting upon the water, including wind, the Coriolis effect, breaking waves, cabbeling, and temperature and salinity differences.[16]
Sir James Clark Ross took the first modern sounding in deep sea in 1840, and Charles Darwin published a paper on reefs and the formation of atolls as a result of the second voyage of HMS Beagle in 1831–1836. Robert FitzRoy published a four-volume report of Beagle's three voyages. In 1841–1842 Edward Forbes undertook dredging in the Aegean Sea that founded marine ecology.
The first superintendent of the United States Naval Observatory (1842–1861), Matthew Fontaine Maury devoted his time to the study of marine meteorology, navigation, and charting prevailing winds and currents. His 1855 textbook Physical Geography of the Sea was one of the first comprehensive oceanography studies. Many nations sent oceanographic observations to Maury at the Naval Observatory, where he and his colleagues evaluated the information and distributed the results worldwide.[17]
Modern oceanography
[edit]Knowledge of the oceans remained confined to the topmost few fathoms of the water and a small amount of the bottom, mainly in shallow areas. Almost nothing was known of the ocean depths. The British Royal Navy's efforts to chart all of the world's coastlines in the mid-19th century reinforced the vague idea that most of the ocean was very deep, although little more was known. As exploration ignited both popular and scientific interest in the polar regions and Africa, so too did the mysteries of the unexplored oceans.

The seminal event in the founding of the modern science of oceanography was the 1872–1876 Challenger expedition. As the first true oceanographic cruise, this expedition laid the groundwork for an entire academic and research discipline.[18] In response to a recommendation from the Royal Society, the British Government announced in 1871 an expedition to explore world's oceans and conduct appropriate scientific investigation. Charles Wyville Thomson and Sir John Murray launched the Challenger expedition. Challenger, leased from the Royal Navy, was modified for scientific work and equipped with separate laboratories for natural history and chemistry.[19] Under the scientific supervision of Thomson, Challenger travelled nearly 70,000 nautical miles (130,000 km) surveying and exploring. On her journey circumnavigating the globe,[19] 492 deep sea soundings, 133 bottom dredges, 151 open water trawls and 263 serial water temperature observations were taken.[20] Around 4,700 new species of marine life were discovered. The result was the Report Of The Scientific Results of the Exploring Voyage of H.M.S. Challenger during the years 1873–76. Murray, who supervised the publication, described the report as "the greatest advance in the knowledge of our planet since the celebrated discoveries of the fifteenth and sixteenth centuries". He went on to found the academic discipline of oceanography at the University of Edinburgh, which remained the centre for oceanographic research well into the 20th century.[21] Murray was the first to study marine trenches and in particular the Mid-Atlantic Ridge, and map the sedimentary deposits in the oceans. He tried to map out the world's ocean currents based on salinity and temperature observations, and was the first to correctly understand the nature of coral reef development.
In the late 19th century, other Western nations also sent out scientific expeditions (as did private individuals and institutions). The first purpose-built oceanographic ship, Albatros, was built in 1882. In 1893, Fridtjof Nansen allowed his ship, Fram, to be frozen in the Arctic ice. This enabled him to obtain oceanographic, meteorological and astronomical data at a stationary spot over an extended period.


In 1881 the geographer John Francon Williams published a seminal book, Geography of the Oceans.[22][23][24] Between 1907 and 1911 Otto Krümmel published the Handbuch der Ozeanographie, which became influential in awakening public interest in oceanography.[25] The four-month 1910 North Atlantic expedition headed by John Murray and Johan Hjort was the most ambitious research oceanographic and marine zoological project ever mounted until then, and led to the classic 1912 book The Depths of the Ocean.
The first acoustic measurement of sea depth was made in 1914. Between 1925 and 1927 the "Meteor" expedition gathered 70,000 ocean depth measurements using an echo sounder, surveying the Mid-Atlantic Ridge.
In 1934, Easter Ellen Cupp, the first woman to have earned a PhD (at Scripps) in the United States, completed a major work on diatoms[26] that remained the standard taxonomy in the field until well after her death in 1999. In 1940, Cupp was let go from her position at Scripps. Sverdrup specifically commended Cupp as a conscientious and industrious worker and commented that his decision was no reflection on her ability as a scientist. Sverdrup used the instructor billet vacated by Cupp to employ Marston Sargent, a biologist studying marine algae, which was not a new research program at Scripps. Financial pressures did not prevent Sverdrup from retaining the services of two other young post-doctoral students, Walter Munk and Roger Revelle. Cupp's partner, Dorothy Rosenbury, found her a position teaching high school, where she remained for the rest of her career. (Russell, 2000)
Sverdrup, Johnson and Fleming published The Oceans in 1942,[27] which was a major landmark. The Sea (in three volumes, covering physical oceanography, seawater and geology) edited by M.N. Hill was published in 1962, while Rhodes Fairbridge's Encyclopedia of Oceanography was published in 1966.
The Great Global Rift, running along the Mid Atlantic Ridge, was discovered by Maurice Ewing and Bruce Heezen in 1953 and mapped by Heezen and Marie Tharp using bathymetric data; in 1954 a mountain range under the Arctic Ocean was found by the Arctic Institute of the USSR. The theory of seafloor spreading was developed in 1960 by Harry Hammond Hess. The Ocean Drilling Program started in 1966. Deep-sea vents were discovered in 1977 by Jack Corliss and Robert Ballard in the submersible DSV Alvin.[28]
In the 1950s, Auguste Piccard invented the bathyscaphe and used the bathyscaphe Trieste to investigate the ocean's depths. The United States nuclear submarine Nautilus made the first journey under the ice to the North Pole in 1958. In 1962 the FLIP (Floating Instrument Platform), a 355-foot (108 m) spar buoy, was first deployed.
In 1968, Tanya Atwater led the first all-woman oceanographic expedition. Until that time, gender policies restricted women oceanographers from participating in voyages to a significant extent.
From the 1970s, there has been much emphasis on the application of large scale computers to oceanography to allow numerical predictions of ocean conditions and as a part of overall environmental change prediction. Early techniques included analog computers (such as the Ishiguro Storm Surge Computer) generally now replaced by numerical methods (e.g. SLOSH.) An oceanographic buoy array was established in the Pacific to allow prediction of El Niño events.
1990 saw the start of the World Ocean Circulation Experiment (WOCE) which continued until 2002. Geosat seafloor mapping data became available in 1995.
Study of the oceans is critical to understanding shifts in Earth's energy balance along with related global and regional changes in climate, the biosphere and biogeochemistry. The atmosphere and ocean are linked because of evaporation and precipitation as well as thermal flux (and solar insolation). Recent studies have advanced knowledge on ocean acidification, ocean heat content, ocean currents, sea level rise, the oceanic carbon cycle, the water cycle, Arctic sea ice decline, coral bleaching, marine heatwaves, extreme weather, coastal erosion and many other phenomena in regards to ongoing climate change and climate feedbacks.
In general, understanding the world ocean through further scientific study enables better stewardship and sustainable utilization of Earth's resources.[29] The Intergovernmental Oceanographic Commission reports that 1.7% of the total national research expenditure of its members is focused on ocean science.[30]
Branches
[edit]

The study of oceanography is divided into these five branches:
Biological oceanography
[edit]Biological oceanography investigates the ecology and biology of marine organisms in the context of the physical, chemical and geological characteristics of their ocean environment.
Chemical oceanography
[edit]Chemical oceanography is the study of the chemistry of the ocean. Whereas chemical oceanography is primarily occupied with the study and understanding of seawater properties and its changes, ocean chemistry focuses primarily on the geochemical cycles. The following is a central topic investigated by chemical oceanography.
Ocean acidification
[edit]Ocean acidification describes the decrease in ocean pH that is caused by anthropogenic carbon dioxide (CO2) emissions into the atmosphere.[31] Seawater is slightly alkaline and had a preindustrial pH of about 8.2. More recently, anthropogenic activities have steadily increased the carbon dioxide content of the atmosphere; about 30–40% of the added CO2 is absorbed by the oceans, forming carbonic acid and lowering the pH (now below 8.1[32]) through ocean acidification.[33][34][35] The pH is expected to reach 7.7 by the year 2100.[36]
An important element for the skeletons of marine animals is calcium, but calcium carbonate becomes more soluble with pressure, so carbonate shells and skeletons dissolve below the carbonate compensation depth.[37] Calcium carbonate becomes more soluble at lower pH, so ocean acidification is likely to affect marine organisms with calcareous shells, such as oysters, clams, sea urchins and corals,[38][39] and the carbonate compensation depth will rise closer to the sea surface. Affected planktonic organisms will include pteropods, coccolithophorids and foraminifera, all important in the food chain. In tropical regions, corals are likely to be severely affected as they become less able to build their calcium carbonate skeletons,[40] in turn adversely impacting other reef dwellers.[36]
The current rate of ocean chemistry change seems to be unprecedented in Earth's geological history, making it unclear how well marine ecosystems will adapt to the shifting conditions of the near future.[41] Of particular concern is the manner in which the combination of acidification with the expected additional stressors of higher ocean temperatures and lower oxygen levels will impact the seas.[42]
Geological oceanography
[edit]Geological oceanography is the study of the geology of the ocean floor including plate tectonics and paleoceanography.
Physical oceanography
[edit]Physical oceanography studies the ocean's physical attributes including temperature-salinity structure, mixing, surface waves, internal waves, surface tides, internal tides, and currents. The following are central topics investigated by physical oceanography.
Seismic Oceanography
[edit]Ocean currents
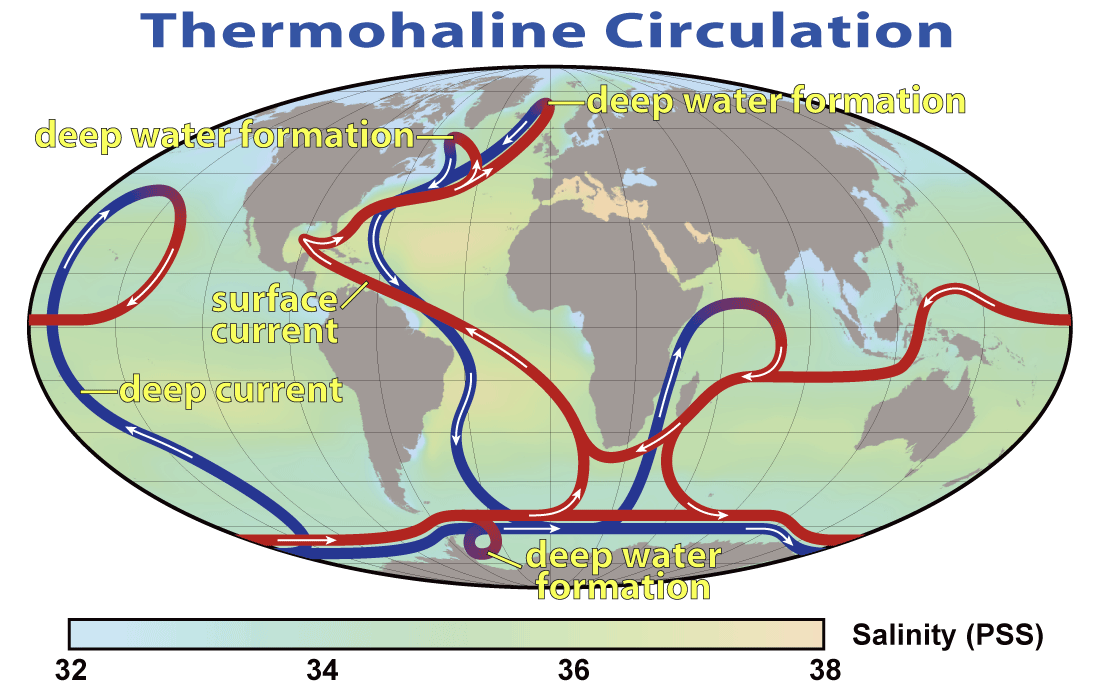
[edit]Since the early ocean expeditions in oceanography, a major interest was the study of ocean currents and temperature measurements. The tides, the Coriolis effect, changes in direction and strength of wind, salinity, and temperature are the main factors determining ocean currents. The thermohaline circulation (THC) (thermo- referring to temperature and -haline referring to salt content) connects the ocean basins and is primarily dependent on the density of sea water. It is becoming more common to refer to this system as the 'meridional overturning circulation' because it more accurately accounts for other driving factors beyond temperature and salinity.
- Examples of sustained currents are the Gulf Stream and the Kuroshio Current which are wind-driven western boundary currents.
Ocean heat content
[edit]Oceanic heat content (OHC) refers to the extra heat stored in the ocean from changes in Earth's energy balance. The increase in the ocean heat play an important role in sea level rise, because of thermal expansion. Ocean warming accounts for 90% of the energy accumulation associated with global warming since 1971.[43][44]
Paleoceanography
[edit]Paleoceanography is the study of the history of the oceans in the geologic past with regard to circulation, chemistry, biology, geology and patterns of sedimentation and biological productivity. Paleoceanographic studies using environment models and different proxies enable the scientific community to assess the role of the oceanic processes in the global climate by the reconstruction of past climate at various intervals. Paleoceanographic research is also intimately tied to palaeoclimatology.
Oceanographic institutions
[edit]
The earliest international organizations of oceanography were founded at the turn of the 20th century, starting with the International Council for the Exploration of the Sea created in 1902, followed in 1919 by the Mediterranean Science Commission. Marine research institutes were already in existence, starting with the Stazione Zoologica Anton Dohrn in Naples, Italy (1872), the Biological Station of Roscoff, France (1876), the Arago Laboratory in Banyuls-sur-mer, France (1882), the Laboratory of the Marine Biological Association in Plymouth, UK (1884), the Norwegian Institute for Marine Research in Bergen, Norway (1900), the Laboratory für internationale Meeresforschung, Kiel, Germany (1902). On the other side of the Atlantic, the Scripps Institution of Oceanography was founded in 1903, followed by the Woods Hole Oceanographic Institution in 1930, the Virginia Institute of Marine Science in 1938, the Lamont–Doherty Earth Observatory at Columbia University in 1949, and later the School of Oceanography at University of Washington. In Australia, the Australian Institute of Marine Science (AIMS), established in 1972 soon became a key player in marine tropical research.
In 1921 the International Hydrographic Bureau, called since 1970 the International Hydrographic Organization, was established to develop hydrographic and nautical charting standards.
Related disciplines
[edit]- Biogeochemistry – Study of chemical cycles of the earth related to biological activity
- Biogeography – Study of distribution of species
- Climatology – Scientific study of climate, defined as weather conditions averaged over a period of time
- Coastal geography – Study of the region between the ocean and the land
- Environmental science – Study of the environment
- Geophysics – Physics of the Earth and its vicinity
- Glaciology – Scientific study of ice and natural phenomena involving ice
- Hydrography – Measurement of bodies of water
- Hydrology – Science of the movement, distribution, and quality of water on Earth
- Limnology – Science of inland aquatic ecosystems
- Meteorology – Interdisciplinary scientific study of the atmosphere focusing on weather forecasting
- MetOcean – The syllabic abbreviation of meteorology and (physical) oceanography.
See also
[edit]- Anoxic event – Historic oxygen depletion events in Earth's oceans
- Anoxic waters – Areas of sea water, fresh water, or groundwater that are depleted of dissolved oxygen
- Argo (oceanography) – International oceanographic observation program
- Astrooceanography – Study of extraterrestrial oceans
- Bathymetric chart – Map depicting the submerged terrain of bodies of water
- Cabled observatory – Seabed oceanographic research platforms connected to the surface by undersea cables
- Ecological forecasting
- List of ocean circulation models
- List of seas
- List of submarine topographical features
- Maritime archaeology – Archaeological study of human interaction with the sea
- Marine current power – Extraction of power from ocean currents
- Marine engineering – Engineering and design of shipboard systems
- Naval architecture – Engineering discipline of marine vessels
- Ocean colonization – Type of ocean claim
- Oceans Act of 2000 – US law to establish policy on the oceans
- Ocean optics
- Ocean color
- Offshore construction – Installation of structures and facilities in a marine environment
- Outline of oceanography – Hierarchical outline list of articles related to oceanography
- Planetary oceanography – Study of extraterrestrial oceans
- Sea level – Geographical reference point from which various heights are measured
- Ocean chemistry
References
[edit]- ^ "A History Of The Study Of Marine Biology ~ MarineBio Conservation Society". 17 June 2018. Retrieved 17 May 2021.
- ^ a b Pedro Nunes Salaciense at the MacTutor History of Mathematics archive (retrieved 13/06/2020)
- ^ W.G.L. Randles, "Pedro Nunes and the Discovery of the Loxodromic Curve, or How, in the 16th Century, Navigating with a Globe had Failed to Solve the Difficulties Encountered with the Plane Chart", Revista da Universidade Coimbra, 35 (1989), 119–30.
- ^ Pedro Nunes Salaciense, Tratado da Esfera, cap. 'Carta de Marear com o Regimento da Altura' p.2 - https://archive.org/details/tratadodaspherac00sacr/page/n123/mode/2up (retrieved 13/06/2020)
- ^ http://ksuweb.kennesaw.edu/~jdirnber/oceanography/LecuturesOceanogr/LecCurrents/LecCurrents.html (retrieved 13/06/2020)
- ^ https://kids.britannica.com/students/assembly/view/166714 (retrieved 13/06/2020)
- ^ a b Carlos Calinas Correia, A Arte de Navegar na Época dos Descobrimentos, Colibri, Lisboa 2017; ISBN 978-989-689-656-0
- ^ "Map" (PDF). upload.wikimedia.org. Retrieved 15 September 2020.
- ^ Carlos Viegas Gago Coutinho, A Viagem de Bartolomeu Dias, Anais (Clube Militar Naval) May 1946
- ^ Carlos Viegas Gago Coutinho, As Primeiras Travessia Atlanticas - lecture, Academia Portuguesa de História, 22/04/1942 - in: Anais (APH) 1949, II serie, vol.2
- ^ Luís Adão da Fonseca, Pedro Álvares Cabral - Uma Viagem, INAPA, Lisboa, 1999, p.48
- ^ Wolff, Torben (1969). Danish Expeditions on the Seven Seas. Copenhagen: Rhodos.
- ^ "1785: Benjamin Franklin's 'Sundry Maritime Observations'". Archived from the original on 18 December 2005.
- ^ Wilkinson, Jerry. History of the Gulf Stream 1 January 2008
- ^ Lee, Sidney, ed. (1896). . Dictionary of National Biography. Vol. 48. London: Smith, Elder & Co.
- ^ US Department of Commerce, National Oceanic and Atmospheric Administration. "Tides and Currents". oceanservice.noaa.gov. Retrieved 25 April 2024.
- ^ Williams, Frances L. Matthew Fontaine Maury, Scientist of the Sea. (1969) ISBN 0-8135-0433-3
- ^ Then and Now: The HMS Challenger Expedition and the 'Mountains in the Sea' Expedition, Ocean Explorer website (NOAA), accessed 2 January 2012
- ^ a b Rice, A. L. (1999). "The Challenger Expedition". Understanding the Oceans: Marine Science in the Wake of HMS Challenger. Routledge. pp. 27–48. ISBN 978-1-85728-705-9.
- ^ Oceanography: an introduction to the marine environment (Peter K. Weyl, 1970), p. 49
- ^ "Sir John Murray (1841–1914) – Founder Of Modern Oceanography". Science and Engineering at The University of Edinburgh. Archived from the original on 28 May 2013. Retrieved 7 November 2013.
- ^ Williams, J. Francon (1881) The Geography of the Oceans: Physical, Historical, and Descriptive George Philip & Son.
- ^ Geography of the Oceans by John Francon Williams, 1881, OCLC 561275070
- ^ John Francon Williams commemorated (article) (Alloa Advertiser, retrieved 26 September 2019): https://www.alloaadvertiser.com/news/17928655.long-awaiting-tribute-pioneering-writer-buried-clacks/
- ^ Otto Krümmel (1907). "Handbuch der Ozeanographie". J. Engelhorn.
- ^ "Women passes test; become oceanographer". The Whittier News. 10 May 1934. p. 13. Retrieved 11 February 2023.
- ^ Sverdrup, Harald Ulrik; Johnson, Martin Wiggo; Fleming, Richard H. (1942). The Oceans, Their Physics, Chemistry, and General Biology. New York: Prentice-Hall.
- ^ "Bathyscaphe | Definition, History, & Facts | Britannica". www.britannica.com. Retrieved 18 January 2025.
- ^ "Oceanography | science". Encyclopedia Britannica. Retrieved 13 April 2019.
- ^ Isensee, Kirsten. editor. Intergovernmental Oceanographic Commission. (2020). Global ocean science report 2020: charting capacity for ocean sustainability. Executive summary. ISBN 978-92-3-100424-7. UNESCO Digital Library website p. 16. Retrieved 21 September 2022.
- ^ Caldeira, K.; Wickett, M. E. (2003). "Anthropogenic carbon and ocean pH" (PDF). Nature. 425 (6956): OS11C–0385. Bibcode:2001AGUFMOS11C0385C. doi:10.1038/425365a. PMID 14508477. S2CID 4417880. Archived (PDF) from the original on 4 June 2007.
- ^ "Ocean Acidity". EPA. 13 September 2013. Retrieved 1 November 2013.
- ^ Feely, R. A.; et al. (July 2004). "Impact of Anthropogenic CO2 on the CaCO3 System in the Oceans". Science. 305 (5682): 362–366. Bibcode:2004Sci...305..362F. doi:10.1126/science.1097329. PMID 15256664. S2CID 31054160.
- ^ Zeebe, R. E.; Zachos, J. C.; Caldeira, K.; Tyrrell, T. (4 July 2008). "OCEANS: Carbon Emissions and Acidification". Science. 321 (5885): 51–52. doi:10.1126/science.1159124. PMID 18599765. S2CID 206513402.
- ^ Gattuso, J.-P.; Hansson, L. (15 September 2011). Ocean Acidification. Oxford University Press. ISBN 978-0-19-959109-1. OCLC 730413873.
- ^ a b "Ocean acidification". Department of Sustainability, Environment, Water, Population & Communities: Australian Antarctic Division. 28 September 2007. Retrieved 17 April 2013.
- ^ Pinet, Paul R. (1996). Invitation to Oceanography. West Publishing Company. pp. 126, 134–135. ISBN 978-0-314-06339-7.
- ^ "What is Ocean Acidification?". NOAA PMEL Carbon Program. Archived from the original on 2 September 2013. Retrieved 15 September 2013.
- ^ Orr, James C.; et al. (2005). "Anthropogenic ocean acidification over the twenty-first century and its impact on calcifying organisms" (PDF). Nature. 437 (7059): 681–686. Bibcode:2005Natur.437..681O. doi:10.1038/nature04095. PMID 16193043. S2CID 4306199. Archived from the original (PDF) on 25 June 2008.
- ^ Cohen, A.; Holcomb, M. (2009). "Why Corals Care About Ocean Acidification: Uncovering the Mechanism". Oceanography. 24 (4): 118–127. Bibcode:2009Ocgpy..22d.118C. doi:10.5670/oceanog.2009.102. hdl:1912/3179.
- ^ Hönisch, Bärbel; Ridgwell, Andy; Schmidt, Daniela N.; Thomas, E.; et al. (2012). "The Geological Record of Ocean Acidification" (PDF). Science. 335 (6072): 1058–1063. Bibcode:2012Sci...335.1058H. doi:10.1126/science.1208277. hdl:1983/24fe327a-c509-4b6a-aa9a-a22616c42d49. PMID 22383840. S2CID 6361097.
- ^ Gruber, N. (18 April 2011). "Warming up, turning sour, losing breath: ocean biogeochemistry under global change". Philosophical Transactions of the Royal Society A: Mathematical, Physical and Engineering Sciences. 369 (1943): 1980–96. Bibcode:2011RSPTA.369.1980G. doi:10.1098/rsta.2011.0003. PMID 21502171.
- ^ IPCC (2013). Climate Change 2013: The Physical Science Basis (PDF) (Report). Cambridge University Press. p. 8. Archived (PDF) from the original on 29 October 2014.
- ^ Laura Snider (13 January 2021). "2020 was a record-breaking year for ocean heat - Warmer ocean waters contribute to sea level rise and strengthen storms". National Center for Atmospheric Research.
Sources and further reading
[edit]- Boling Guo, Daiwen Huang. Infinite-Dimensional Dynamical Systems in Atmospheric and Oceanic Science, 2014, World Scientific Publishing, ISBN 978-981-4590-37-2. Sample Chapter
- Hamblin, Jacob Darwin (2005) Oceanographers and the Cold War: Disciples of Marine Science. University of Washington Press. ISBN 978-0-295-98482-7
- Lang, Michael A., Ian G. Macintyre, and Klaus Rützler, eds. Proceedings of the Smithsonian Marine Science Symposium. Smithsonian Contributions to the Marine Sciences, no. 38. Washington, D.C.: Smithsonian Institution Scholarly Press (2009)
- Roorda, Eric Paul, ed. The Ocean Reader: History, Culture, Politics (Duke University Press, 2020) 523 pp. online review
- Steele, J., K. Turekian and S. Thorpe. (2001). Encyclopedia of Ocean Sciences. San Diego: Academic Press. (6 vols.) ISBN 0-12-227430-X
- Sverdrup, Keith A., Duxbury, Alyn C., Duxbury, Alison B. (2006). Fundamentals of Oceanography, McGraw-Hill, ISBN 0-07-282678-9
- Russell, Joellen Louise. Easter Ellen Cupp, 2000, Regents of the University of California.
External links
[edit]- NASA Jet Propulsion Laboratory – Physical Oceanography Distributed Active Archive Center (PO.DAAC). A data centre responsible for archiving and distributing data about the physical state of the ocean.
- Scripps Institution of Oceanography. One of the world's oldest, largest, and most important centres for ocean and Earth science research, education, and public service.
- Woods Hole Oceanographic Institution (WHOI). One of the world's largest private, non-profit ocean research, engineering and education organizations.
- British Oceanographic Data Centre. A source of oceanographic data and information.
- NOAA Ocean and Weather Data Navigator. Plot and download ocean data.
- Freeview Video 'Voyage to the Bottom of the Deep Deep Sea' Oceanography Programme by the Vega Science Trust and the BBC/Open University.
- Atlas of Spanish Oceanography by InvestigAdHoc.
- Glossary of Physical Oceanography and Related Disciplines by Steven K. Baum, Department of Oceanography, Texas A&M University
- Barcelona-Ocean.com Archived 9 November 2014 at the Wayback Machine. Inspiring Education in Marine Sciences
- CFOO: Sea Atlas. A source of oceanographic live data (buoy monitoring) and education for South African coasts.
- Oceanography on In Our Time at the BBC
- Memorial website for USNS Bowditch, USNS Dutton, USNS Michelson and USNS H. H. Hess


 | ||
| International | |
|---|---|
| National | |
| Other | |
Oceanography
View on GrokipediaOverview
Definition and Scope
Oceanography is the scientific study of the ocean, encompassing its physical properties, chemical composition, biological communities, and geological features.[8] This field examines processes such as ocean circulation, wave dynamics, tides, currents, and seafloor morphology shaped by plate tectonics.[8][9] The scope of oceanography extends to the interactions between the ocean and Earth's atmosphere, land, and biosphere, including the role of seawater in regulating global climate through heat transport and carbon sequestration.[9] It addresses marine ecosystems, where over 80% of Earth's known species reside, as well as chemical processes like ocean acidification driven by atmospheric CO₂ absorption.[9] Oceanography relies on empirical data from satellite observations, ship-based measurements, and submersible deployments to model phenomena such as thermohaline circulation, which influences deep-water formation and nutrient distribution.[10] As an interdisciplinary discipline, oceanography integrates physics to analyze fluid motion, chemistry to quantify dissolved gases and salts, biology to track species distributions and productivity, and geology to map sediment layers and tectonic activity.[8] This comprehensive approach supports applications in resource management, environmental monitoring, and hazard prediction, such as tsunamis and coastal erosion, underscoring the ocean's coverage of 71% of Earth's surface.[9]Importance to Science and Society
Oceanography provides foundational insights into Earth's climate dynamics, as the oceans absorb roughly 90% of excess heat trapped by greenhouse gases, exerting a stabilizing influence on global temperatures and atmospheric circulation.[11] This heat storage capacity, approximately 1,100 times that of the atmosphere, drives phenomena like the thermohaline circulation, which redistributes warmth and nutrients worldwide, informing predictive models for events such as El Niño-Southern Oscillation that affect weather patterns across continents.[12] Oceanographic research also elucidates biogeochemical cycles, including the sequestration of about 25% of anthropogenic CO2 emissions, which mitigates acidification but reveals vulnerabilities like reduced carbonate ion availability impacting shell-forming marine organisms.[13] These empirical findings, derived from satellite altimetry, Argo floats, and shipboard measurements, enhance geophysical models linking oceanic processes to plate tectonics and seismic activity. In biological oceanography, studies reveal the oceans' role in supporting over 230,000 known species, with estimates of up to 2.2 million total, underscoring biodiversity hotspots like coral reefs that drive evolutionary adaptations and ecosystem resilience.[14] This knowledge advances fields from microbiology to fisheries science, where understanding larval dispersal via currents informs sustainable harvesting strategies amid declining stocks, as evidenced by overexploitation reducing global fish biomass by 50% since the mid-20th century in some regions.[15] Societally, oceanography underpins an economy valued at $1.5 trillion annually in goods and services, employing around 31 million people through sectors like maritime trade, which handles 90% of global commerce by volume.[16][17] Fisheries and aquaculture, reliant on oceanographic data for stock assessments, supply protein to 3.3 billion people, while navigation aids from current mapping reduce shipping risks and fuel costs.[18] Additionally, predictive models from physical oceanography mitigate disasters, such as tsunamis detected via deep-sea buoys that provided early warnings saving thousands during the 2004 Indian Ocean event, and inform coastal defenses against storm surges intensified by sea-level rise averaging 3.3 mm yearly since 1993.[19] These applications extend to resource exploration, including offshore oil yielding 30% of global production and emerging deep-sea minerals critical for electronics.[20]History
Ancient and Early Observations
Ancient seafaring societies relied on empirical observations of ocean phenomena to enable navigation and trade across coastal and open waters. As early as 4000 BC, Egyptians constructed reed boats for Nile River travel, with shipbuilding techniques advancing by 3000 BC to support limited maritime ventures in the Mediterranean and Red Sea.[21] Phoenicians, from approximately 1500 to 300 BC, dominated Mediterranean commerce, developing keel-equipped vessels that facilitated voyages potentially extending into the Atlantic Ocean and a circumnavigation of Africa commissioned by Pharaoh Necho II around 600 BC, during which crews noted seasonal winds and coastal features over three years.[22][23] These expeditions demonstrated practical awareness of prevailing currents and monsoon patterns, though records emphasize route-finding over systematic measurement. Greek philosophers contributed early systematic inquiries into oceanic processes around the 4th century BC. Aristotle documented marine biology through dissections and habitat observations, classifying species and noting ecological distributions in works like Historia Animalium, which included accounts of Mediterranean fish migrations tied to seasonal water movements.[24] Pytheas of Massalia, during a voyage northward circa 320 BC, described tidal variations in the Atlantic, linking their rhythm to lunar phases and observing that tides rose highest during full and new moons, an insight derived from direct measurement at sites like the Bay of Biscay. Such correlations represented initial causal hypotheses, predating formal gravitational theory, and highlighted regional differences in tidal amplitudes, with Mediterranean tides noted as minimal compared to oceanic ones. Non-literate Pacific societies, particularly Polynesians from around 3000 BC onward, amassed sophisticated knowledge of open-ocean dynamics through generational wayfinding. Navigators discerned directional swells refracted by distant islands, interpreted bird flights as landfall indicators, and tracked star paths above the horizon for latitude, enabling deliberate settlements across 25 million square kilometers of Pacific from Hawaii to New Zealand by 1000 AD.[25][26] These techniques implicitly encoded current systems, such as equatorial countercurrents, via memorized wave patterns and wind shifts, allowing voyages of thousands of kilometers without instruments and demonstrating adaptive empirical mapping of circulatory features like the North Pacific Gyre.[27] Practical tidal observations appeared independently in other regions, such as ancient India's Kathiawar Peninsula, where dock structures dated 2500–1500 BC aligned with ebb and flow cycles for ship access, indicating localized predictive use without explanatory theory.[28] Collectively, these pre-modern efforts prioritized utilitarian insights over abstraction, laying groundwork for later scientific oceanography through accumulated data on tides, currents, and biota unresponsive to prevailing cosmological myths like flat-earth models.[29]Age of Sail and Exploration (15th–18th Centuries)
European maritime expansion from the 15th to 18th centuries advanced early oceanographic understanding primarily through practical navigation, as explorers documented winds, currents, and coastal bathymetry to facilitate long-distance voyages. Portuguese initiatives under Prince Henry the Navigator (1394–1460) involved systematic coastal surveys along West Africa starting in the 1410s, revealing southward-flowing currents such as the Canary Current, which influenced route planning around the African bulge. By 1498, Vasco da Gama's expedition to India (1497–1499) leveraged monsoon wind patterns in the Indian Ocean and skirted the Agulhas Current off the Cape of Good Hope, aided by local pilot expertise on regional conditions.[30] Christopher Columbus's first transatlantic crossing in 1492 exploited the northeast trade winds, sailing southwest from the Canary Islands to reach the Bahamas after 33 days, while his return utilized prevailing westerlies north of the trades. Ferdinand Magellan's circumnavigation (1519–1522), though incomplete by him, traversed the vast Pacific, noting equatorial doldrums and the Peru (Humboldt) Current's effects along South American coasts. These voyages empirically mapped wind systems like the trades, originating from subtropical highs and converging toward the equator, enabling repeatable Atlantic and Pacific passages.[31][32] In the 18th century, more systematic observations emerged. Captain James Cook's three Pacific voyages (1768–1779) featured hydrographic charting with chronometers for longitude, temperature profiles via thermometers lowered to depth, and tidal records accurate to 0.5 feet (15 cm) in height and 0.5 hours in timing, such as those at Tahiti and New Zealand. Cook's second voyage (1772–1775) included sea surface temperature measurements across the Southern Ocean to test terra australis hypotheses. Concurrently, Benjamin Franklin's 1769 Gulf Stream chart, drawn from whaler Timothy Folger's accounts, delineated the current's 70-mile-wide path from Florida Straits to the Grand Banks, warmer by 9–13°F (5–7°C) than surrounding waters, shortening packet ship crossings by two weeks.[33][34] James Rennell, drawing on East India Company logs, produced a 1799 map of Indian Ocean currents, identifying the Agulhas as a western boundary current linking equatorial flows between the Atlantic and Indian basins, with countercurrents enabling retrograde voyages. These efforts transitioned exploratory data into proto-oceanographic syntheses, prioritizing empirical logs over theoretical speculation, though limited by lead-line soundings (max ~100 fathoms) and lacking subsurface sampling.[35]19th-Century Systematic Studies
The systematic study of oceanography in the 19th century began with the compilation of empirical data from naval and merchant ship logs, enabling the first comprehensive mapping of surface currents and winds. In 1847, Matthew Fontaine Maury, superintendent of the U.S. Navy's Depot of Charts and Instruments, published the Wind and Current Chart of the North Atlantic, derived from thousands of ship reports, which demonstrated predictable patterns in ocean circulation and reduced transatlantic crossing times by up to 10 days.[36] [37] Maury's approach emphasized data aggregation over anecdotal observation, laying groundwork for quantitative ocean science; his 1855 book The Physical Geography of the Sea synthesized these findings into the first modern oceanographic treatise, discussing currents, depths, and atmospheric interactions based on verifiable measurements.[36] Advancements in bathymetry paralleled current mapping, driven by practical needs such as laying transatlantic telegraph cables. By the 1850s, improved sounding techniques, including the Brooke deep-sea lead, allowed measurements exceeding 2,000 fathoms (about 3,658 meters) in the North Atlantic, revealing a rugged seafloor contrary to earlier assumptions of uniform shallowness.[38] These efforts, coordinated through international exchanges, produced the first global depth charts and highlighted abyssal plains, informing submarine cable routes and challenging prevailing geological theories.[39] The era's apex was the HMS Challenger expedition (1872–1876), a British Royal Navy voyage explicitly dedicated to oceanographic research, circumnavigating 68,000 nautical miles with 492 deep-sea sounding stations, temperature profiles at various depths, and biological dredging operations.[5] [40] The mission documented salinity variations, current velocities, and life forms down to 2,500 fathoms (4,572 meters), discovering over 4,700 new marine species and confirming biological communities in deep waters previously thought barren.[5] Its 50-volume report, published over 20 years, established standardized methodologies for physical, chemical, and biological oceanography, catalyzing the discipline's institutionalization and international collaboration.[40]20th-Century Expeditions and Institutionalization
The early 20th century marked the institutionalization of oceanography through the establishment of dedicated research organizations, transitioning the field from ad hoc naval surveys to systematic, multidisciplinary studies. The International Council for the Exploration of the Sea (ICES) was founded in 1902 in Copenhagen to coordinate investigations into North Atlantic fisheries, hydrography, and plankton distribution, involving initial member states including Denmark, Norway, Sweden, Germany, and the United Kingdom.[41] In the United States, the Scripps Institution of Oceanography emerged in 1903, initiated by University of California biologist William E. Ritter with philanthropic support from E.W. Scripps and Ellen Browning Scripps, focusing initially on marine biology but expanding to physical and chemical oceanography.[42] The Prince Albert I of Monaco Oceanographic Museum and Laboratory, established in 1910, advanced Mediterranean and global deep-sea research through continuous observations and expeditions.[43] By 1930, the Woods Hole Oceanographic Institution (WHOI) was created in Massachusetts as a nonprofit dedicated to comprehensive ocean studies, commissioning its first research vessel, Atlantis, for Atlantic transects measuring temperature, salinity, and currents.[44] These institutions facilitated specialized expeditions that employed emerging technologies like echo-sounding and non-magnetic vessels for precise bathymetric and geophysical mapping. The Carnegie Institution's brigantine Carnegie conducted multiple cruises from 1909 to 1921, designed without ferrous materials to minimize magnetic interference, yielding geomagnetic data alongside oceanographic profiles of salinity, temperature, and plankton across the Pacific, Atlantic, and Indian Oceans during its global circumnavigations.[45] A final Carnegie voyage in 1928–1929 extended these measurements before the ship's explosion off Samoa, contributing early insights into equatorial currents and atmospheric interactions.[46] The German Atlantic Expedition aboard the Meteor from 1925 to 1927 systematically traversed the South Atlantic 14 times, utilizing continuous echo-sounding to map over 150,000 kilometers of seafloor, revealing the Walvis Ridge and mid-ocean topography while collecting data on currents, oxygen profiles, and nutrient distributions that challenged prevailing continental drift skepticism.[47] Parallel efforts in polar regions advanced understanding of Southern Ocean dynamics. The British Discovery Investigations, launched in 1925 under the Colonial Office and whaling industry auspices, refitted the RRS Discovery for 15 years of cruises through Antarctic waters, deploying nets, water bottles, and current meters to quantify whale migrations, frontal zones, and deep circulation, with later vessels like Discovery II incorporating acoustic depth finders for bottom profiling.[48] These initiatives, supported by national hydrographic offices and private funding, aggregated datasets on global ocean basins, laying empirical foundations for later wartime applications in submarine detection and post-1945 expansions, though limited by pre-electronic instrumentation to wireline soundings and discrete sampling.[43]Post-1945 Technological and Global Advances
The transition from wartime applications to peacetime scientific inquiry marked a pivotal era in oceanography after 1945, with surplus military technologies like improved sonar and echo sounders enabling systematic seafloor mapping. These tools revealed extensive mid-ocean ridge systems, including the 1953 discovery of the rift valley along the Mid-Atlantic Ridge by the research vessel Atlantis, which provided early evidence for seafloor spreading mechanisms central to plate tectonics theory.[49][50] U.S. Navy sponsorship, driven by submarine operations and acoustic propagation needs, funded rapid instrument development, including early deep-ocean cameras and magnetometers, while institutions like Scripps Institution of Oceanography pioneered systems such as the Deep Tow for high-resolution seabed imaging starting in the late 1950s.[50][49] Manned and unmanned submersibles emerged as transformative platforms for direct observation. The U.S. Navy's bathyscaphe Trieste conducted the first human descent to the Challenger Deep in the Mariana Trench on January 23, 1960, reaching a depth of 10,911 meters and collecting pressure, temperature, and light data that confirmed extreme deep-ocean conditions.[49] In 1964, the Woods Hole Oceanographic Institution commissioned Alvin, the first U.S. deep-diving research submersible, capable of operations to 3,000 meters, which facilitated geological sampling and biological surveys, including the 1977 discovery of hydrothermal vents.[51] The Deep Sea Drilling Project, initiated in 1966, deployed the Glomar Challenger in 1968 for piston coring up to 1,000 meters into the seafloor, yielding sediment cores that dated oceanic crust ages and substantiated seafloor spreading rates of 1-10 cm per year.[52] International cooperation accelerated through initiatives like the International Geophysical Year (1957-1958), which coordinated global ocean station deployments and current measurements across 67 nations, enhancing data on circulation and tides.[53] The Intergovernmental Oceanographic Commission, established under UNESCO in 1960, promoted data exchange and coordinated programs among over 140 member states, laying groundwork for sustained global monitoring.[54] Satellite remote sensing began with Seasat-1 in 1978, the first dedicated oceanographic mission, which measured sea surface topography, winds, and waves via radar altimetry and scatterometry over its 105-day operational period.[55] Subsequent advances included the Argo array, with initial float deployments in 1999 scaling to 3,000 autonomous profiling floats by 2007, providing real-time temperature and salinity profiles to 2,000 meters across 80% of the global ocean and enabling precise heat content calculations.[56] These developments integrated observational data into numerical models, supporting causal understandings of ocean dynamics amid increasing computational power.Branches of Oceanography
Physical Oceanography
Physical oceanography examines the physical properties of seawater—such as temperature, salinity, density, and pressure—and the dynamic processes governing ocean motion, including currents, waves, tides, and turbulence.[1] These studies apply principles of fluid mechanics, thermodynamics, and geophysics to understand how oceanic flows transport heat, momentum, and materials, influencing global climate patterns and weather systems.[57] Ocean waters exhibit strong density stratification, with warmer, less saline surface layers overlying colder, denser deep waters, which shapes vertical mixing and horizontal circulation.[58] Surface currents, primarily wind-driven via Ekman transport, form gyres in each ocean basin, such as the clockwise North Atlantic Gyre featuring the swift Gulf Stream, which reaches speeds of up to 2.5 meters per second and transports approximately 150 million cubic meters of water per second.[59] Deeper circulation arises from thermohaline forcing, where density gradients from temperature (thermo) and salinity (haline) variations drive a global conveyor belt-like system, moving water at rates of 10-20 kilometers per year and redistributing heat from equatorial to polar regions.[60] This circulation, including Antarctic Bottom Water formation, sustains meridional overturning and modulates climate variability, with disruptions potentially altering regional temperatures by several degrees Celsius.[61] Waves propagate energy across ocean surfaces, generated mainly by wind shear creating oscillatory motions with wavelengths from centimeters to hundreds of kilometers; in deep water, wave speed approximates the square root of wavelength times gravity over 2π.[62] Tides, long-period waves induced by gravitational attractions of the Moon and Sun, produce semidiurnal or diurnal cycles with global mean amplitudes of about 1 meter, amplified in coastal bays to exceed 10 meters as in the Bay of Fundy.[63][64] Internal waves at density interfaces further facilitate nutrient upwelling and energy dissipation, linking surface forcing to abyssal depths.[65] Physical oceanography underpins predictions of sea level rise—projected at 0.3 to 1 meter by 2100 from thermal expansion and ice melt—and El Niño-Southern Oscillation events, which redistribute heat and affect global fisheries and agriculture.[61] Observations reveal the ocean absorbs over 90% of excess atmospheric heat since 1970, buffering climate change but risking tipping points in circulation stability.[66] Advances in satellite altimetry, such as from TOPEX/Poseidon launched in 1992, have mapped sea surface height to within centimeters, enabling geostrophic current derivations via the dynamic height method.[58]Chemical Oceanography
Chemical oceanography examines the composition, reactions, and cycling of chemical species in seawater, including their interactions with biological, geological, and atmospheric processes. It focuses on the distribution of elements from major ions to trace metals, dissolved gases, nutrients, and organic compounds, as well as dynamic processes like air-sea gas exchange, sedimentation, and biogeochemical transformations. This field elucidates how chemical properties influence ocean circulation, marine productivity, and global climate regulation, such as through the marine carbon cycle.[67][68] Seawater's chemical composition is dominated by six major ions constituting over 99% of dissolved salts: sodium (Na⁺, ~468 mmol kg⁻¹), chloride (Cl⁻, ~545 mmol kg⁻¹), sulfate (SO₄²⁻, ~28 mmol kg⁻¹), magnesium (Mg²⁺, ~53 mmol kg⁻¹), calcium (Ca²⁺, ~10 mmol kg⁻¹), and potassium (K⁺, ~10 mmol kg⁻¹). These conservative elements maintain nearly constant ratios across the open ocean due to minimal removal or addition relative to salinity, which averages 35 practical salinity units (psu) globally but varies from near-zero in polar ice-influenced regions to over 40 psu in subtropical evaporation zones. Salinity primarily reflects chloride and sodium concentrations and governs seawater density, influencing thermohaline circulation. Non-conservative species, such as bicarbonate (HCO₃⁻) and carbonate (CO₃²⁻), contribute to total alkalinity (~2.3–2.5 meq kg⁻¹), buffering seawater pH at approximately 8.1, which is mildly alkaline but has declined by ~0.1 units since pre-industrial times due to anthropogenic CO₂ absorption.[69][69][70] Dissolved gases in seawater include oxygen (O₂, supersaturated in polar surface waters up to ~400 µmol kg⁻¹ but undersaturated in deep waters), carbon dioxide (CO₂, ~10–15 µmol kg⁻¹ in surface waters equilibrating with atmosphere), and nitrogen (N₂, ~500–600 µmol kg⁻¹). These gases drive redox reactions and support aerobic respiration, with O₂ profiles showing surface maxima from photosynthesis and atmospheric exchange, decreasing to minima (~20–50 µmol kg⁻¹) at intermediate depths due to organic matter remineralization. Nutrients like nitrate (NO₃⁻, <0.1–40 µmol kg⁻¹), phosphate (PO₄³⁻, <0.1–3 µmol kg⁻¹), and silicate (Si(OH)₄, <1–150 µmol kg⁻¹) exhibit nutrient-type distributions: depleted in surface euphotic zones by biological uptake and enriched in deep waters via decomposition, limiting primary production in ~75% of the ocean surface. Trace elements, such as iron (Fe, ~0.1–1 nmol kg⁻¹ in surface waters), are scavenged by particles but critical for phytoplankton, with distributions influenced by aeolian dust inputs and hydrothermal vents. Dissolved organic matter (DOM), comprising ~700 Gt C globally, includes humic substances and labile compounds fueling microbial loops.[71][72][73] Geochemical cycles in the ocean interconnect these components, with the carbon cycle central: oceans absorb ~25% of anthropogenic CO₂ emissions (~2.5 Gt C yr⁻¹), forming carbonic acid and reducing saturation states of CaCO₃ minerals (Ω_arag ~1–4 in surface waters). Nitrogen and phosphorus cycles sustain productivity via fixation (e.g., ~100–200 Tg N yr⁻¹ by diazotrophs), denitrification (~200–500 Tg N yr⁻¹ loss in suboxic zones), and regeneration, maintaining Redfield ratios (C:N:P ≈ 106:16:1) in exported organic matter. These cycles link to sulfur (via dimethylsulfide production) and silica (diatom biomineralization), with imbalances driving phenomena like hypoxia. Hydrothermal inputs (~10¹³ mol yr⁻¹ Fe from vents) and riverine fluxes (~10¹⁰ mol yr⁻¹ P) modulate oceanic inventories over millennial timescales.[72][74] Methods in chemical oceanography emphasize contamination-free sampling using Niskin rosette bottles on conductivity-temperature-depth (CTD) profilers for discrete depths, trace-metal clean techniques (e.g., Teflon-lined systems under laminar flow), and in situ sensors for real-time pH, O₂, and nutrient measurements. Laboratory analyses employ inductively coupled plasma mass spectrometry (ICP-MS) for trace elements (detection limits ~pmol kg⁻¹), ion chromatography for anions, and Winkler titration for O₂. Shipboard and shore-based protocols, as standardized in programs like GEOTRACES, ensure data quality through intercalibration and blanks. Isotopic tracers (e.g., δ¹³C, δ¹⁵N) reveal sources and rates, complementing numerical models of reaction kinetics and speciation (e.g., via equilibrium constants for carbonate systems).[75][76][75]Biological Oceanography
Biological oceanography examines the distribution, abundance, diversity, and ecological interactions of marine organisms within the context of oceanographic processes, including their responses to physical, chemical, and geological conditions.[77] This field integrates principles from ecology, physiology, and population biology to understand how biological communities structure marine ecosystems, from surface phytoplankton blooms to deep-sea benthic assemblages.[78] Unlike purely descriptive marine biology, it emphasizes quantitative analyses of organism-environment dynamics, such as how nutrient upwelling influences species composition in coastal zones.[79] Central to biological oceanography is primary productivity, primarily driven by photosynthetic phytoplankton, which convert inorganic carbon into organic matter and form the base of marine food webs. Global marine net primary production is estimated at 35–50 billion metric tons of carbon per year, comparable to terrestrial output and accounting for roughly half of Earth's total primary production through microbial contributions.[80] [81] Phytoplankton productivity varies spatially, with high rates in nutrient-rich upwelling regions and polar waters, but remains low in oligotrophic open oceans, where factors like light penetration and nutrient availability dictate biomass accumulation.[82] Trophic interactions propagate this energy upward through zooplankton grazers, nekton like fish, and apex predators, sustaining fisheries yields that exceed 100 million metric tons annually worldwide.[83] Marine organisms are categorized by habitat and mobility: plankton (drifting forms including phytoplankton and zooplankton), nekton (active swimmers such as squid and marine mammals), and benthos (seafloor dwellers from microbes to large invertebrates). Deep-sea studies have revealed unexpectedly high biodiversity, with over 200,000 estimated species in benthic communities, challenging earlier assumptions of barren abyssal plains and highlighting adaptations to extreme pressures and low temperatures.[84] Ecosystem models in biological oceanography quantify these interactions, revealing how physical forcings like currents disperse larvae and maintain genetic connectivity across populations.[85] Sampling methods include plankton nets for net hauls, sediment grabs or cores for benthic analysis, and remotely operated vehicles (ROVs) for deep-sea collections, often combined with acoustic surveys and remote sensing of chlorophyll via satellites to map biomass distributions.[86] [87] These techniques enable empirical assessments of productivity and diversity, informing sustainable management amid pressures like overexploitation, though data gaps persist in under-sampled regions such as the Southern Ocean.[88]Geological Oceanography
Geological oceanography, synonymous with marine geology, studies the composition, structure, and dynamic processes of the seafloor, including continental shelves, slopes, and deep ocean basins.[89] It applies geological and geophysical methods to map submarine landforms and reconstruct their formation through tectonic, volcanic, and erosional activities.[90] This branch reveals how oceanic crust differs from continental crust, being thinner (averaging 5-10 km thick) and denser, primarily composed of basaltic rocks.[91] Central to geological oceanography is the analysis of major seafloor physiographic provinces. Mid-ocean ridges, the most prominent feature, form a global system exceeding 64,000 km in length, representing divergent plate boundaries where upwelling mantle material generates new crust.[92] These ridges rise to depths of about 2,600 m on average, with axial valleys and rift zones marking active spreading centers.[92] Abyssal plains, vast flat expanses at 3,000-6,000 m depth, cover much of the ocean floor and result from sediment blanketing underlying topography, with thicknesses reaching hundreds of meters in regions like the Gulf of Alaska.[92] [93] Deep-sea trenches, such as the Mariana Trench at approximately 10,935 m, occur at subduction zones where oceanic plates converge and descend into the mantle.[94] Tectonic processes dominate seafloor evolution, with seafloor spreading propelling plate motions at rates typically 1-10 cm per year, as evidenced by symmetric magnetic stripe patterns on either side of ridges.[95] [96] For instance, the Mid-Atlantic Ridge spreads at 2-5 cm/year, accommodating the separation of the Americas from Eurasia and Africa.[97] This mechanism, integrated with subduction, recycles crust aged up to 180 million years at trenches, maintaining the ocean basins' youth relative to continents.[91] Volcanism along ridges and seamounts produces intraplate hotspots, while earthquakes cluster at plate boundaries, informing hazard assessments.[98] Marine sediments, a primary focus, are classified by origin into lithogenous (derived from land erosion, dominant near continents), biogenous (from organism remains, like calcareous oozes), hydrogenous (precipitated from seawater), and cosmogenous (extraterrestrial). Lithogenous sediments, including terrigenous clays and sands, thicken toward margins, with deposition rates as low as 2-3 cm per millennium in remote abyssal areas.[99] These layers preserve records of erosion, transport via turbidity currents, and burial, aiding reconstructions of paleotopography and resource exploration for polymetallic nodules or hydrocarbons.[100] Geological oceanographers employ multibeam sonar, seismic profiling, and coring to quantify sediment distribution and tectono-sedimentary interactions.[98]Paleoceanography and Climate Reconstruction
Paleoceanography examines the geological history of ocean basins through proxies embedded in marine sediments, microfossils, and chemical signatures to infer past sea surface temperatures, deep-water circulation, and biogeochemical cycles, thereby enabling reconstructions of global climate states over timescales from millennia to millions of years.[101] These records reveal that ocean dynamics, such as thermohaline circulation, have modulated atmospheric CO2 sequestration and heat distribution, influencing glacial-interglacial transitions; for instance, during the Last Glacial Maximum approximately 20,000 years ago, weakened Atlantic meridional overturning circulation reduced deep-water ventilation and enhanced carbon storage in the ocean interior.[102] Such findings underscore the ocean's role as a primary driver of ice age pacing, with circulation reorganizations contributing to more severe glaciations by altering moisture and heat transport to polar regions.[103] Core methods involve extracting sediment cores from ocean floors, which preserve layered archives of foraminiferal shells, organic biomarkers, and isotopic compositions calibrated against modern analogs for quantitative proxy interpretations.[104] Temperature proxies include oxygen isotopes (δ¹⁸O) in benthic and planktonic foraminifera, which integrate sea surface temperature and global ice volume signals—yielding estimates of 4–7°C cooler equatorial oceans during Pleistocene glacials—and Mg/Ca ratios in foraminiferal calcite, which isolate temperature effects after accounting for salinity influences.[101] For sea surface temperatures, alkenone unsaturation indices (Uᵏ'₃₇) from haptophyte algae provide robust Holocene reconstructions, showing an early warming peak around 8,000–6,000 years ago followed by Neoglacial cooling in marine records.[105] Circulation is traced via neodymium isotopes (εNd) in authigenic coatings and sortable silt grain sizes, indicating shifts like reduced North Atlantic Deep Water formation during ice ages.[101] CO₂ proxies, such as boron isotopes (δ¹¹B) in foraminifera, reconstruct surface ocean pH and atmospheric pCO₂, revealing levels as low as 180–200 ppm during glacial maxima versus 280 ppm interglacials.[101] Climate reconstructions from paleoceanographic data highlight periodicities tied to Milankovitch orbital forcings, with ocean proxies confirming benthic δ¹⁸O stacks that align marine isotope stages with ice core chronologies over the past 800,000 years.[106] Deep-time records, using clumped isotope thermometry (Δ₄₇) on carbonates, indicate equatorial ocean temperatures exceeding 30°C during the Eocene greenhouse climate, associated with CO₂ levels above 1,000 ppm, challenging models that underestimate warming sensitivity to greenhouse gases.[104] Databases like Temperature 12k compile 209 marine records spanning the Holocene, demonstrating spatial variability where tropical oceans warmed less than lands post-Younger Dryas, informing projections of future ocean-atmosphere feedbacks.[105] These multiproxy approaches, while subject to uncertainties from diagenesis and local bathymetry, provide causal insights into ocean-mediated climate stability, emphasizing circulation's amplification of orbital triggers over direct radiative effects.[104]Methods and Tools
Observational Platforms and Sampling
Observational platforms in oceanography encompass a range of vessels, fixed installations, and autonomous systems designed to collect in situ data on ocean properties such as temperature, salinity, currents, and biogeochemical variables.[107] Research vessels, including dedicated oceanographic ships like those operated by NOAA and the National Oceanography Centre, serve as primary platforms for deploying sampling gear via winches and cranes, enabling targeted measurements across the water column and seafloor.[86] These ships support hydrographic surveys, where conductivity-temperature-depth (CTD) profilers attached to rosette samplers collect continuous profiles and discrete water samples using Niskin bottles, which isolate seawater at specific depths for analysis of nutrients, dissolved oxygen, and contaminants.[108] Fixed and drifting surface platforms, such as moored buoys and drifters, provide long-term, continuous observations in fixed locations or Lagrangian trajectories. Moored buoys, anchored to the seafloor with instrumented cables, measure surface and subsurface parameters including wind, waves, and upper-ocean currents via acoustic Doppler current profilers (ADCPs); for instance, NOAA's moored systems have sustained deployments exceeding decades in key regions like the tropical Pacific. Drifting buoys track surface currents and air-sea interactions, contributing to global datasets under frameworks like the Global Drifter Program, which maintains over 1,000 units for real-time velocity and temperature data.[107] Profiling floats, exemplified by the Argo array, represent autonomous subsurface platforms that drift with ocean currents while cycling vertically to depths of 2,000 meters every 10 days, transmitting temperature and salinity profiles via satellite.[109] Launched internationally since 1999, the Argo program sustains approximately 4,000 active floats, generating over 100,000 profiles annually to map upper-ocean heat content and circulation; extensions like Deep Argo reach 6,000 meters for fuller volume sampling.[110] Biogeochemical-Argo variants add sensors for oxygen, nitrate, and pH, enhancing sampling of carbon cycle variables without human intervention.[111] Underwater vehicles expand access to mid- and deep-water realms beyond ship capabilities. Autonomous underwater vehicles (AUVs) and gliders, propelled by buoyancy changes, conduct transect surveys with onboard sensors for acoustic mapping and water sampling; gliders, for example, achieve ranges of thousands of kilometers over months.[112] Remotely operated vehicles (ROVs) and human-occupied submersibles enable precise seafloor sampling, deploying push cores or grabs for sediments and biological specimens; gravity corers, dropped from ships or vehicles, penetrate up to 10 meters into seabed layers to retrieve undisturbed stratigraphic samples.[113] These platforms integrate with global networks like the Ocean Observatories Initiative, which deploys over 900 instruments across cabled seafloor nodes and mobile assets for sustained, high-resolution data streams.[114] Sampling protocols emphasize contamination avoidance, with sterilized gear and standardized depths to ensure data comparability across platforms.[115]Remote Sensing and Satellite Technology
Remote sensing in oceanography employs satellite-based instruments to measure ocean surface properties such as topography, temperature, color, salinity, and wind fields, enabling global-scale observations unattainable by ship-based methods alone.[116] These techniques rely on electromagnetic radiation interactions with the ocean-atmosphere system, including radar altimetry for height variations, optical sensors for biological productivity, and microwave radiometry for all-weather data.[117] Satellite data have revolutionized understanding of ocean circulation, heat transport, and biogeochemical cycles by providing synoptic views and long-term time series, with resolutions typically ranging from 1-25 km horizontally and daily to weekly temporal coverage.[118] Radar altimetry, a cornerstone technique, uses pulse-delay measurements to determine sea surface height (SSH) with centimeter-level accuracy, revealing mesoscale eddies, geostrophic currents, and mean sea level trends. The TOPEX/Poseidon mission, launched in August 1992 by NASA and CNES, provided the first global SSH dataset, completing over 62,000 orbits before ceasing operations in January 2006, and demonstrated altimetry's feasibility for circulation mapping.[119] [120] This was succeeded by the Jason series: Jason-1 (2001-2013), Jason-2 (2008-2019), and Jason-3 (launched 2016), which maintain a 10-day repeat cycle and have measured global mean sea level rise at approximately 3.3 mm per year since 1993, isolating steric and mass contributions to variability.[121] [122] Optical remote sensing via ocean color sensors detects water-leaving radiance to estimate chlorophyll-a concentrations, indicating phytoplankton biomass and primary productivity. The Moderate Resolution Imaging Spectroradiometer (MODIS) on NASA's Aqua and Terra satellites, operational since 2002 and 1999 respectively, produces daily global maps at 1-km resolution after atmospheric correction for aerosols and gases, supporting studies of bloom dynamics and carbon export.[123] [124] Microwave scatterometers, such as those on QuikSCAT (1999-2009), measure backscatter to derive surface wind vectors with 25-km resolution, essential for air-sea flux calculations and storm tracking.[118] Gravimetry satellites like GRACE (2002-2017) and its follow-on GRACE-FO (2018-present) detect monthly ocean mass variations by tracking inter-satellite distance changes due to gravitational anomalies, with sensitivity to ~0.01 m equivalent water depth over 400-km scales.[125] GRACE data quantify basin-scale mass redistribution, contributing to sea level budget closure by distinguishing mass-driven rise (1.88-2.63 mm/year over 2002-2017) from thermal expansion.[126] These missions, processed through centers like NASA's Jet Propulsion Laboratory, integrate with in situ data for model validation, though challenges persist in coastal regions due to land contamination and retrieval uncertainties.[127] Ongoing advancements, including SWOT (launched 2022), promise higher-resolution (15-25 km) wide-swath altimetry for submesoscale features.[128]In Situ Instrumentation and Autonomous Systems
In situ instrumentation encompasses sensors and devices deployed directly within the ocean environment to measure parameters such as temperature, salinity, currents, dissolved oxygen, and biogeochemical properties in real time.[129] These tools enable continuous, high-resolution data collection unattainable by sporadic ship-based sampling, with developments accelerating after 1945 through advances in solid-state electronics and pressure-resistant sealing using O-rings.[130] Key early milestones include moored subsurface arrays for current observations starting in the 1960s, which provided Eulerian fixed-point data on ocean dynamics.[131] Conductivity-temperature-depth (CTD) profilers, invented in 1969 by Neil Brown at Woods Hole Oceanographic Institution, revolutionized vertical profiling by integrating conductivity for salinity estimation with temperature and pressure sensors, allowing rapid, accurate hydrographic casts to depths exceeding 6000 meters.[132] Moored buoys, deployed since the 1940s but refined post-war for deep-ocean use, anchor instrumented cables with acoustic Doppler current profilers (ADCPs) and environmental sensors, yielding long-term records of currents and water masses; for instance, equatorial Pacific moorings initiated in the 1970s supported El Niño forecasting via the TOGA program.[133][131] Modern iterations incorporate bio-optical and chemical sensors for parameters like chlorophyll fluorescence and pCO2, though challenges persist with biofouling and power limitations reducing sensor longevity to months in productive surface waters.[129] Autonomous systems extend in situ capabilities by enabling untethered, self-guided operations over vast scales, minimizing human intervention and costs relative to crewed vessels.[134] Profiling floats under the ARGO program, first deployed in 1999, form a global array of approximately 4000 units that cycle between 2000-meter depths and the surface, measuring temperature and salinity profiles transmitted via satellite; by 2018, ARGO had amassed two million profiles, quantifying ocean heat uptake at rates of 0.6-1.0 watts per square meter since 2005.[135][136] Expanded ARGO variants now include deep-reaching floats to 6000 meters and biogeochemical sensors for oxygen and nitrate, enhancing carbon cycle monitoring despite gaps in marginal seas and under ice.[137] Underwater gliders, developed in the late 1990s, propel via variable buoyancy and wing-mediated gliding, achieving missions of thousands of kilometers over months; examples include the Slocum glider (Teledyne, operational since 2001), Spray (Scripps Institution, ~0.25 m/s horizontal speed), and Seaglider (University of Washington), which sample adaptive grids for mesoscale features like eddies.[138][139][140] Autonomous underwater vehicles (AUVs), such as WHOI's REMUS series introduced in the 1990s, use propellers for targeted surveys, mapping seafloors at resolutions of centimeters and collecting acoustic or chemical data in hazardous areas like hydrothermal vents.[141] These platforms collectively support sustained observations, with gliders and AUVs complementing ARGO by providing higher spatial resolution but shorter endurance due to battery constraints, typically 30-90 days versus floats' 4+ years.[142] Integration with satellite data refines global models, though acoustic communication limitations and environmental durability remain barriers to full autonomy in extreme depths.[143]Numerical Modeling and Data Analysis
Numerical modeling in oceanography utilizes computational techniques to approximate solutions to the Navier-Stokes equations, continuity equation, and thermodynamic relations that govern ocean circulation, waves, and mixing processes. These models divide the ocean into discrete grids or unstructured meshes, applying finite difference, finite volume, or spectral methods to simulate variables such as velocity, temperature, salinity, and sea level on timescales from hours to centuries. Foundational principles for such models emerged in the 1960s, with Kirk Bryan proposing key algorithmic formulations for ocean circulation in 1969, enabling the spin-up of realistic steady-state solutions from rest.[144] By the 1980s, advancements in computing power allowed for global ocean general circulation models (OGCMs), which incorporate bathymetry, wind forcing, and boundary conditions to replicate large-scale features like the subtropical gyres and Antarctic Circumpolar Current.[145] Prominent examples include the NEMO (Nucleus for European Modelling of the Ocean) framework, a flexible OGCM used for regional and global simulations with resolutions down to 1/36° (about 2.5 km), facilitating studies of mesoscale eddies and climate variability. Hybrid models like HYCOM (Hybrid Coordinate Ocean Model) blend isopycnal, sigma, and z-level coordinates to better resolve mixed layers and overflows, applied in operational forecasting systems such as the U.S. Navy's global predictions since the early 2000s.[146] High-resolution modeling has revealed the role of eddies in transporting heat and momentum, with simulations showing they account for up to 30% of meridional heat flux in mid-latitudes, challenging earlier diffusion-based parameterizations. Recent developments integrate machine learning for subgrid-scale closures, improving representation of unresolved turbulence without ad hoc tuning.[147] Data analysis in oceanography processes heterogeneous datasets from moorings, ships, and satellites using statistical and spectral techniques to extract signals amid noise. Core methods include empirical orthogonal function (EOF) analysis to decompose variability into orthogonal modes, as in identifying the El Niño-Southern Oscillation's spatial patterns from sea surface temperature records spanning decades.[148] Time series analysis employs discrete Fourier transforms and wavelet methods to quantify periodicities, such as diurnal tides or annual cycles, while accounting for aliasing from sparse sampling; for instance, spectral analysis of current meter data reveals inertial oscillations with periods matching the local Coriolis frequency.[148] Error handling incorporates confidence intervals and autocorrelation corrections, essential for validating model outputs against observations, with techniques like jackknifing to assess uncertainty in sparse datasets.[148] Data assimilation bridges modeling and analysis by optimally merging observations with model forecasts, typically via sequential methods like the ensemble Kalman filter or 4D variational schemes that minimize a cost function over assimilation windows. In oceanography, systems such as SODA (Simple Ocean Data Assimilation) reanalyze global fields from 1950 onward by assimilating hydrographic profiles, altimetry, and Argo floats into OGCMs, yielding monthly estimates of temperature and currents with root-mean-square errors reduced by 20-50% compared to models alone.[149] Operational implementations, like those using NEMO with 40-member ensembles, ingest real-time satellite data to forecast mesoscale features, enhancing predictions of Gulf Stream variability. Challenges persist in handling model biases, such as excessive mixing in coarse grids, addressed through covariance inflation and localization in ensemble methods.[150]Key Oceanographic Phenomena
Circulation Patterns and Currents
Ocean currents represent continuous, directed flows of seawater influenced by wind stress, density variations from temperature and salinity, the Coriolis effect, and gravitational forces. Surface currents, confined to the upper approximately 400 meters, are primarily wind-driven and organize into large-scale gyres within subtropical high-pressure zones, rotating clockwise in the Northern Hemisphere and counterclockwise in the Southern Hemisphere. These include the North Atlantic Gyre, South Atlantic Gyre, North Pacific Gyre, South Pacific Gyre, and Indian Ocean Gyre. [151] [152] [153] Western intensified boundary currents within these gyres, such as the Gulf Stream and Kuroshio, flow poleward as narrow, fast streams carrying warm equatorial waters northward, while eastern boundary currents like the Canary and California Currents move equatorward as broader, slower flows of cooler water. The Gulf Stream accelerates from the Gulf of Mexico, achieving maximum surface speeds of about 2.5 meters per second (5.6 miles per hour) and exhibiting volume transport that rises from roughly 30 Sverdrups (1 Sv = 10^6 m³/s) in the Straits of Florida to over 100 Sv downstream due to entrainment of interior waters. [152] [154] [155] Wind forcing generates Ekman transport, the depth-integrated mass flow directed 90 degrees to the right of the wind vector in the Northern Hemisphere (left in the Southern), resulting from the Ekman spiral where successive water layers deflect via Coriolis forces and friction. This mechanism drives net convergence in subtropical gyre centers, promoting downwelling, and divergence at subpolar fronts, fostering upwelling and nutrient-rich surface waters. [156] [157] Deeper circulation arises from thermohaline forcing, where denser water sinks at high latitudes—such as North Atlantic Deep Water formation off Greenland—and spreads equatorward, upwelling in regions like the Southern Ocean to close the circuit in a global "conveyor belt" that redistributes heat and freshwater over millennial timescales. The Atlantic Meridional Overturning Circulation (AMOC), integral to this system, transports approximately 15-30 Sv of upper ocean water northward, balanced by deep southward return flow. [158] [159] [160] The Antarctic Circumpolar Current, the planet's most voluminous current, encircles Antarctica eastward at speeds up to 0.5 m/s, with a transport exceeding 100 Sv, linking the Atlantic, Pacific, and Indian basins while maintaining thermal isolation of polar waters through dynamic fronts. [161] [162]Thermohaline Dynamics and Heat Transport
The thermohaline circulation (THC) comprises density-driven ocean currents resulting from variations in seawater temperature and salinity, which determine water density and induce sinking or rising motions.[163] These density gradients arise primarily from surface heat fluxes that cool water at high latitudes and freshwater fluxes that alter salinity through evaporation, precipitation, and ice formation.[160] In regions like the North Atlantic and Southern Ocean, cold, saline water becomes dense enough to sink to abyssal depths, forming deep western boundary currents that propagate equatorward and poleward.[164] Upwelling occurs in lower latitudes, completing the cycle over timescales of approximately 1,000 years for a water parcel to traverse the global loop.[165] This circulation pattern, often depicted as the "global conveyor belt," interconnects major ocean basins, with North Atlantic Deep Water (NADW) and Antarctic Bottom Water (AABW) as key components.[166] Density increases from cooling dominate in polar convection sites, while salinity effects amplify sinking through brine rejection during sea ice formation, particularly in the Weddell and Ross Seas for AABW.[167] Empirical observations from conductivity-temperature-depth (CTD) profiles and neutrally buoyant floats confirm these dynamics, revealing vertical velocities on the order of 10-100 meters per year in deep oceans.[168] THC plays a critical role in meridional heat transport, redistributing approximately 10^{15} watts of heat poleward in the Northern Hemisphere, equivalent to about one-quarter of the total atmospheric and oceanic heat flux at those latitudes.[168] In the Atlantic, the meridional overturning circulation (AMOC), a THC subset, northwardly conveys warm surface water via the Gulf Stream, releasing heat to the atmosphere and enabling denser water formation.[169] This heat export, estimated at 0.5-1 petawatt in peak latitudes, moderates European climates relative to similar latitudes in North America.[170] Disruptions in density gradients, such as from altered freshwater inputs, can influence transport efficiency, though long-term stability arises from self-regulating feedbacks in deep water formation rates.[160]Wave Processes and Tides
Ocean waves primarily consist of surface gravity waves generated by wind shear at the air-sea interface, where friction transfers momentum from atmosphere to water, creating oscillatory disturbances.[171] These waves propagate energy through circular orbital motion of water particles, with motion amplitude decreasing exponentially with depth, such that at a depth equal to half the wavelength, particle velocity is about 4% of surface value.[172] In deep water, where depth exceeds half the wavelength, the dispersion relation governs wave speed: phase velocity , with as gravitational acceleration and as wavelength, implying longer waves travel faster than shorter ones, leading to dispersion and evolution of wave fields into swell trains from storm-generated seas.[173] Wave steepness, defined as height over wavelength, limits stability; waves steeper than 1:7 break due to instability, transferring energy to turbulence and foam.[174] Group velocity, approximately half the phase velocity in deep water, determines energy propagation rate, enabling remote sensing of storm origins via swell arrival times. Internal waves, at density interfaces, also occur but carry less energy than surface waves, influencing mixing via shear instabilities. Tides arise from differential gravitational forces exerted by the Moon and Sun on Earth's oceans, producing two tidal bulges: one facing the Moon due to stronger pull on near-side water, and an opposite bulge from inertia exceeding gravity on the far side.[175] The Moon's gravitational influence dominates, being about 2.2 times the Sun's despite greater solar mass, owing to proximity; combined, they yield semidiurnal tides with periods near 12.42 hours (lunar day half).[176] Equilibrium theory, positing instantaneous ocean adjustment to celestial positions, predicts global tidal amplitudes under 0.5 meters but fails to explain observed ranges up to 16 meters in resonant basins like the Bay of Fundy.[177] Dynamic theory accounts for continental barriers, Earth's rotation (Coriolis effect), and basin resonance, modeling tides as forced Kelvin waves with co-oscillating amphidromic systems—points of zero tidal range around which phase propagates.[178] Spring tides, with amplified ranges during new/full moons from aligned forces, contrast neap tides at quarter phases; perigee boosts amplitudes by 20-60%.[179] Tidal energy dissipates via bottom friction, slowing Earth's rotation by about 2.3 milliseconds per century.[180]Biogeochemical Interactions
Biogeochemical interactions in the ocean involve the interconnected cycles of elements like carbon, nitrogen, phosphorus, silicon, and oxygen, driven by microbial and planktonic activity, chemical reactions, and physical transport processes. These cycles sustain marine primary production, which accounts for roughly half of global photosynthesis, while exporting organic matter and influencing atmospheric composition. Microbial ecosystems dominate, transforming dissolved inorganic nutrients into particulate organic forms that sink or are remineralized, thereby linking surface productivity to deep-sea chemistry.[181][182] The biological carbon pump exemplifies these interactions, as phytoplankton convert dissolved CO₂ into biomass via photosynthesis, with 1-2% of this fixed carbon exported as sinking particles to depths below 1000 meters, sequestering 5-12 gigatons of carbon annually from the atmosphere. This export efficiency varies regionally, enhanced by aggregation into fecal pellets or marine snow, but diminished by bacterial respiration in the upper water column. The pump's strength depends on nutrient availability and grazing pressure, coupling carbon drawdown to nutrient regeneration rates.[183][184] Nitrogen and phosphorus cycles constrain productivity in nutrient-limited gyres, where nitrogen fixation by cyanobacteria like Trichodesmium inputs about 100-200 Tg N per year, balancing denitrification losses of similar magnitude in oxygen minimum zones. Phosphorus, supplied via aeolian dust (around 7 Tg P annually) and riverine fluxes, often co-limits growth with nitrogen under Redfield ratios (C:N:P ≈ 106:16:1), with recycling via zooplankton excretion sustaining 90% of production in stratified waters. Silicon cycling supports diatom blooms, critical in high-latitude and upwelling regions, with global inputs and outputs estimated at 270-400 Tmol yr⁻¹, influencing carbon export through biogenic opal formation.[185][186] Oxygen dynamics reflect these cycles, with marine photosynthesis generating over 50% of Earth's O₂ (approximately 3.5 × 10¹⁷ moles annually) in the euphotic zone, primarily by phytoplankton. However, respiratory consumption by heterotrophs and chemical oxidation of organic matter depletes oxygen below the thermocline, creating gradients where remineralization ratios (O₂ utilization per unit carbon respired) mirror Redfield stoichiometry. Ventilation by circulation replenishes surface oxygen, but in subsurface layers, solubility decreases with warming, amplifying depletion rates observed at 1-2% per decade in some basins.[187][188]Applications and Economic Impacts
Maritime Navigation and Fisheries Management
Oceanographic knowledge of currents and tides is essential for efficient and safe maritime navigation. Ship routing algorithms incorporate real-time data on ocean currents to optimize paths, reducing fuel consumption and transit times; for instance, vessels transiting the North Atlantic often exploit the Gulf Stream northward to gain speed while avoiding it southward to prevent deviation.[189][190] Tidal predictions, derived from harmonic analysis of water level data, enable precise scheduling of port entries and exits, particularly in shallow estuaries where insufficient depth during low tide risks grounding.[191][192] The U.S. National Oceanic and Atmospheric Administration (NOAA) provides such predictions for over 3,000 stations, supporting cargo operations that handle billions of tons annually without incident from tidal miscalculations.[193] In coastal and intracoastal waterways, monitoring tidal currents prevents hazards like excessive velocities that could overpower engines or cause collisions.[194] Bathymetric surveys, informed by oceanographic models, update nautical charts to reflect seabed changes from currents and sedimentation, crucial for large vessels with drafts exceeding 15 meters.[9] Integration of satellite altimetry and in-situ measurements into navigation systems has reduced weather-related delays, with studies showing potential fuel savings of up to 10% through current-aware speed optimization.[195] Oceanographic data underpins fisheries management by linking environmental drivers to stock dynamics, enabling evidence-based quotas and spatial closures. Upwelling zones, where nutrient-rich deep waters rise, sustain high productivity; these areas, comprising about 1% of ocean surface, yield roughly 50% of global fisheries landings, as seen in the Peru-Humboldt Current system supporting anchovy harvests exceeding 10 million tons in peak years.[196] Variability in upwelling intensity, driven by winds and currents, correlates with fish recruitment; for example, weakened upwelling during El Niño events has historically collapsed sardine stocks off California, prompting adaptive management shifts.[197] Acoustic surveys and ecosystem models incorporate temperature, salinity, and chlorophyll data to forecast biomass, with U.S. fisheries achieving sustainable levels for 93% of assessed stocks by 2019 through such integration.[198] Sustainable practices rely on transparent monitoring, as provided by platforms like Global Fishing Watch, which uses vessel tracking to detect illegal activities and assess pressure on stocks influenced by oceanographic shifts.[199] However, empirical assessments reveal overestimations in some stock models that undervalue environmental forcings, leading to quotas exceeding maximum sustainable yields; a 2016 GEOMAR study found global overfishing rates higher than FAO reports due to inadequate incorporation of physical oceanographic variability.[200] Effective management thus demands causal linkages between circulation patterns and trophic levels, prioritizing data from peer-reviewed oceanographic observations over policy-driven narratives.[201]Resource Extraction and Energy Development
Offshore hydrocarbon extraction remains a cornerstone of marine resource utilization, leveraging subsea drilling rigs, floating production storage and offloading (FPSO) vessels, and tension-leg platforms to access reserves beneath the seabed. In 2024, global offshore oil production stabilized at 25.2 million barrels per day, representing 27% of total worldwide oil output despite upstream investments rising nearly 40% above 2019 levels to sustain reserves amid geopolitical constraints.[202] [203] U.S. federal offshore operations, concentrated in the Gulf of Mexico, yielded 668 million barrels of oil and 700 billion cubic feet of natural gas in fiscal year 2024, underscoring the sector's role in energy security through established seismic imaging and directional drilling techniques that minimize surface footprints compared to onshore analogs.[204] Marine mineral extraction focuses on seafloor deposits such as polymetallic nodules, which accumulate over millions of years in abyssal plains and contain enriched concentrations of nickel, cobalt, copper, and manganese—metals critical for battery production and alloys. These nodules, prevalent in regions like the Clarion-Clipperton Zone off Mexico's west coast, are targeted via seabed collector vehicles that vacuum or scrape deposits for surface processing, though extraction efficiency and ecological baselines remain empirically unproven at commercial scales.[205] [206] As of October 2025, the International Seabed Authority has granted 31 exploration contracts but approved no exploitation permits, with regulations stalled after failed negotiations in 2024 and ongoing debates resuming in March 2025 over environmental thresholds and revenue sharing.[207] [208] U.S. proposals, including NOAA's July 2025 revisions to deep seabed mining rules, aim to enable domestic licensing while addressing gaps in impact monitoring.[209] Energy development from ocean sources emphasizes renewables, with fixed-bottom and floating offshore wind farms dominating deployment due to scalable turbine arrays harnessing persistent wind gradients over water. Global installed offshore wind capacity reached 78.5 gigawatts by the end of 2024, nearly half in China, powering an estimated 73 million households through grid-connected substations and high-voltage direct current transmission.[210] [211] Complementary technologies like tidal stream generators, wave energy converters, and ocean thermal energy conversion (OTEC) systems—exploiting salinity gradients, surface wave motion, or thermal differentials—lagged with a combined global capacity of 494 megawatts by late 2024, primarily from tidal-range installations in Europe and pilot OTEC plants demonstrating heat-engine cycles but constrained by high capital costs and biofouling.[212] These approaches prioritize sites with verifiable resource assessments from acoustic Doppler current profilers and buoy-deployed sensors, though scalability hinges on empirical demonstrations of long-term durability against corrosion and extreme loads.[213]Climate Forecasting and Hazard Mitigation
Oceanographic observations, including sea surface temperatures, salinity profiles from ARGO floats, and subsurface moorings, provide essential initialization data for coupled atmosphere-ocean general circulation models (GCMs) used in climate forecasting. These models simulate the ocean's role in redistributing heat and modulating atmospheric variability, such as in the El Niño-Southern Oscillation (ENSO), where accurate representation of equatorial Pacific thermocline depth and upwelling dynamics improves seasonal precipitation and temperature predictions.[214][215] Dynamic ENSO models, incorporating real-time ocean data, have achieved empirical success, with U.S. operational forecasts correctly predicting event phases in most cases over the past 50 years, though skill diminishes beyond 9-12 months due to chaotic subsurface dynamics.[216] Satellite altimetry and tide gauge networks enable forecasting of regional sea level anomalies driven by steric expansion and ocean circulation shifts, informing projections of coastal inundation risks under varying emission scenarios. In decadal predictions, ocean heat content anomalies observed via profiling floats constrain model drift, enhancing reliability for events like Atlantic Multidecadal Variability, which influences hurricane activity. Empirical validation against independent observations, rather than model ensembles alone, underscores persistent biases in ocean-atmosphere coupling, such as underestimated upwelling responses.[217][218] For hazard mitigation, deep-ocean assessment and reporting of tsunamis (DART) buoys, deployed by NOAA since 2001 and expanded post-2004 Indian Ocean tsunami, detect seafloor pressure changes to confirm tsunami generation from earthquakes, enabling propagation forecasts with lead times of hours for Pacific coastal threats.[219] These systems, numbering over 40 stations by 2023, integrate bathymetric data and numerical models to map inundation zones, reducing false alarms and supporting the National Tsunami Hazard Mitigation Program's community alerts. In tropical cyclone contexts, ocean heat content maps from airborne expendable bathythermographs and gliders predict rapid intensification by quantifying potential energy available from warm surface layers, as demonstrated in improved National Hurricane Center forecasts during events like Hurricane Maria in 2017.[220] Storm surge models, such as NOAA's SLOSH, incorporate real-time ocean currents, tides, and wind-driven setup validated against historical data, aiding evacuation planning and infrastructure resilience in vulnerable regions.[221] Long-term monitoring has empirically lowered tsunami fatalities through refined warnings, though coastal development offsets some gains in exposure risk.[222]Biotechnology and Pharmaceutical Prospects
Marine organisms, encompassing sponges, algae, bacteria, and invertebrates, produce a diverse array of bioactive compounds adapted to extreme oceanic conditions such as high pressure, salinity, and temperature variations, offering unique scaffolds for pharmaceutical development unavailable in terrestrial sources.[223] These marine natural products (MNPs) exhibit potent activities against cancer, infections, inflammation, and neurological disorders, with structural novelty including complex polyketides, peptides, and alkaloids that enhance binding specificity to drug targets.[224] As of 2024, 17 marine-derived drugs are in clinical use worldwide, demonstrating the viability of ocean-sourced molecules despite historical challenges in isolation and synthesis.[225] Prominent FDA-approved examples include ziconotide, derived from the venom of the cone snail Conus magus and approved in 2004 for severe chronic pain via intrathecal administration, targeting N-type voltage-gated calcium channels.[226] Trabectedin, sourced from the tunicate Ecteinascidia turbinata and approved in 2007 (Europe) and 2015 (FDA), treats soft tissue sarcoma and ovarian cancer by alkylating DNA and disrupting transcription.[227] Eribulin mesylate, a synthetic analog of halichondrin B from the sponge Halichondria okadai, received FDA approval in 2010 for metastatic breast cancer, stabilizing microtubules to inhibit mitosis.[226] These approvals underscore MNPs' empirical efficacy, with natural products showing higher clinical trial success rates than synthetic small molecules due to evolutionary optimization for biological interactions.[228] Beyond approved drugs, 33 MNPs are advancing in pharmaceutical pipelines as of 2024, including anticancer agents like plitidepsin from tunicates and anti-inflammatory compounds from soft corals, bolstered by genomic sequencing and metagenomics that reveal unculturable microbial sources contributing over 80% of marine biodiversity.[225] Recent advances, such as AI-driven structure prediction and CRISPR-enabled pathway engineering in marine microbes, accelerate hit-to-lead optimization, with echinoderm-derived terpenoids showing promise against multidrug-resistant bacteria in preclinical models from 2020-2025.[229] However, scalability remains a barrier, as wild harvesting yields low quantities, necessitating total synthesis or heterologous expression in engineered hosts, as seen in eribulin's production via semi-synthesis.[230] In biotechnology, marine extremophiles yield cold-adapted enzymes like proteases and lipases from polar bacteria, stable under low temperatures for green chemistry applications in pharmaceutical synthesis, reducing energy costs by up to 50% compared to mesophilic counterparts.[231] These enzymes facilitate biocatalysis for chiral intermediates in drug manufacturing, while marine algae-derived polysaccharides support biofuel production, with engineered strains achieving lipid yields of 40-60% dry weight for biodiesel precursors.[232] Bacteriocins from marine Actinobacteria offer antibiotic alternatives, inhibiting pathogens without resistance induction in vitro.[233] The U.S. marine biotechnology market, valued at approximately USD 3 billion in 2023, is projected to reach USD 5.24 billion by 2034, driven by demand for these ocean-sourced biocatalysts in pharma and renewables.[234] Prospects hinge on expanded bioprospecting in underexplored deep-sea and polar regions, where metagenomic surveys have identified novel gene clusters for polyketide synthases since 2020, yet regulatory hurdles and environmental extraction limits temper optimism, emphasizing sustainable aquaculture of source organisms over destructive harvesting.[235] Empirical data affirm MNPs' edge in addressing antimicrobial resistance, with marine peptides outperforming terrestrial analogs in potency against Gram-negative bacteria, positioning oceanography as a critical frontier for causal drug innovation amid stagnant terrestrial pipelines.[236]Environmental Challenges and Controversies
Natural Variability vs. Anthropogenic Climate Influences
Oceanographic research identifies several modes of natural variability that significantly influence sea surface temperatures (SSTs), heat content, and circulation patterns on interannual to multidecadal timescales. The El Niño-Southern Oscillation (ENSO), with cycles of 2-7 years, drives global SST anomalies of up to 0.5-1°C in the tropical Pacific, affecting heat redistribution and atmospheric teleconnections that alter precipitation and storm tracks worldwide.[237] Similarly, the Pacific Decadal Oscillation (PDO) and Atlantic Multidecadal Oscillation (AMO), operating on 20-80 year periods, modulate basin-wide SSTs by 0.2-0.5°C, influencing ocean heat uptake and release; for instance, the AMO's positive phase from the mid-1990s to circa 2015 amplified North Atlantic warming and hurricane activity.[238] These internal ocean-atmosphere oscillations arise from chaotic dynamics in circulation and wind patterns, independent of external forcings, and can account for a substantial portion of observed decadal SST trends, often rivaling projected anthropogenic signals in magnitude on regional scales.[239] External natural forcings, such as solar irradiance variations and volcanic eruptions, further contribute to ocean climate fluctuations. Solar cycles, with 11-year periodicity and ~0.1% irradiance changes, correlate with ENSO phase transitions and modest SST modulations of 0.1°C globally, as evidenced by alignments between solar minima and La Niña events.[240] Major volcanic events, like the 1991 Pinatubo eruption, inject stratospheric aerosols that reduce incoming solar radiation by 2-3 W/m² for 1-3 years, inducing ocean surface cooling of 0.2-0.5°C and temporary heat content reductions through enhanced mixing.[237] These forcings demonstrate the ocean's responsiveness to astrophysical and geological inputs, with empirical reconstructions showing they explain short-term anomalies not captured by greenhouse gas (GHG) trends alone. Anthropogenic influences, primarily from rising atmospheric CO₂ concentrations (now ~420 ppm as of 2023), exert a radiative forcing of ~2.0-3.0 W/m² since pre-industrial times, leading the ocean to absorb over 90% of excess Earth system heat, with upper 2000 m ocean heat content (OHC) increasing by ~330 zettajoules (ZJ) from 1971-2022.[241] This uptake manifests as basin-scale warming, particularly in the subtropical gyres, and contributes to sea level rise via thermal expansion of ~0.5-1.0 mm/year.[242] However, attribution studies relying on climate models often project accelerated OHC trends under GHG scenarios, yet ARGO float observations since 2004 reveal rates of 0.4-0.6 ZJ/year that align with combined natural modes like the IPO (Interdecadal Pacific Oscillation) during positive phases, complicating isolation of human signals amid internal variability.[243] Peer-reviewed analyses indicate that while anthropogenic CO₂ dominates the ocean's inorganic carbon sink (~25-30% of emissions), climate-driven circulation shifts introduce variability exceeding 20% of the sink's mean on decadal scales.[244] Debates persist over the relative roles in specific ocean dynamics, such as the Atlantic Meridional Overturning Circulation (AMOC). Model projections attribute potential AMOC weakening of 10-50% by 2100 to GHG-induced freshwater inputs from melting ice, but empirical evidence from air-sea heat fluxes and proxy records shows no statistically significant decline over the past 60-70 years, with fluctuations consistent with AMO cycles rather than exceeding natural bounds.[245][246] A 2022 study concluded that internal variability has dominated AMOC changes through the 20th century, with anthropogenic forcing detectable but secondary to stochastic ocean processes.[245] Sources like IPCC assessments assert high confidence in anthropogenic dominance for long-term trends, yet critics note model over-sensitivities to CO₂ and underestimation of natural oscillations, as sparse pre-2000s observations limit verification.[237] Overall, while anthropogenic forcing provides a baseline trend, natural variability—empirically dominant on sub-centennial scales—necessitates cautious attribution to avoid conflating internal cycles with human causation in oceanographic records.Pollution Sources and Empirical Mitigation Effects
Land-based activities contribute approximately 80% of marine pollution, primarily through rivers carrying nonpoint source runoff including plastics, nutrients, sewage, and industrial effluents. [247] Among these, nutrient pollution from agricultural fertilizer and manure runoff drives hypoxic "dead zones," with the Gulf of Mexico dead zone spanning over 6,000 square miles in 2023 due to excess nitrogen and phosphorus from the Mississippi River basin.[248] [249] Plastic debris constitutes another dominant pollutant, with an estimated 19-23 million tonnes entering aquatic ecosystems annually, predominantly from mismanaged land waste via rivers—1,000 rivers accounting for 80% of global riverine inputs.[250] [251] Ship-based sources, including oil spills and discarded fishing gear, add 20-30% of plastic pollution and episodic hydrocarbon releases, though these represent a smaller fraction than terrestrial origins.[252] Empirical mitigation of nutrient pollution has shown measurable reductions in dead zone extent through targeted agricultural practices. In the Gulf of Mexico, implementation of precision nutrient application and riparian buffer zones since the 1990s has correlated with periodic contractions in hypoxia area, with modeling indicating a potential 50% reduction if nutrient loads from key watersheds decrease by 20-45%.[253] Wetland restoration and cover cropping in the Mississippi basin have demonstrably lowered nitrogen exports by 10-30% in pilot fields, as verified by USGS monitoring data from 2010-2020.[254] These interventions prioritize causal reduction at the source over downstream remediation, yielding verifiable improvements in water quality metrics without relying on unproven large-scale geoengineering. For plastic pollution, source-control measures like improved waste collection in high-emission river basins have empirically curbed oceanic influx. In Indonesia, a major contributor, community-led river barriers and recycling programs reduced plastic leakage by up to 70% in treated waterways between 2019 and 2023, per field measurements.[255] Globally, policies curbing single-use plastics—such as the European Union's 2021 ban—have slowed waste generation rates, with OECD projections showing that enhanced collection could prevent a quadrupling of ocean plastics by 2060 under baseline scenarios.[256] However, direct ocean cleanup efforts, while removing surface debris (e.g., The Ocean Cleanup's interception of over 100,000 kg in the Great Pacific Garbage Patch by 2023), recover less than 1% of total submerged or seafloor accumulations estimated at 3-11 million metric tonnes as of 2020.[257] [258] Oil spill mitigation emphasizes prevention over cleanup, as post-incident recovery techniques recover only 10-20% of spilled volume on average, per analyses of events like Deepwater Horizon (2010).[259] Double-hull tanker mandates enforced since the 1990s have reduced spill volumes by 60% in U.S. waters, with longitudinal data from the International Tanker Owners Pollution Federation confirming fewer large incidents post-OPA 1990.[260] Bioremediation and dispersants show variable efficacy, accelerating biodegradation in some trials but persisting hydrocarbons in sediments, underscoring the primacy of regulatory enforcement for causal efficacy.[261] Overall, successful strategies hinge on enforceable land- and vessel-based controls, with empirical gains tempered by incomplete global adoption and persistent inputs from developing regions.[262]Overexploitation Debates in Fisheries and Aquaculture
In marine capture fisheries, debates center on the extent to which human harvesting has depleted global fish stocks, with empirical assessments indicating that approximately 37.7 percent of assessed stocks were overexploited or depleted as of 2021, up from 35.4 percent in 2019, while 50.5 percent were fished at biologically sustainable levels.[263] This figure applies only to the roughly one-third of global stocks that are formally assessed, leaving uncertainty about unmonitored fisheries, particularly in developing regions where illegal, unreported, and unregulated (IUU) fishing exacerbates pressures.[263] Proponents of the overexploitation narrative, often from environmental advocacy groups, cite selective examples of regional collapses—such as the 1992 cod fishery shutdown in the North Atlantic after decades of high catches exceeding recruitment rates—to argue for widespread impending catastrophe, though such cases frequently involve poor enforcement rather than inherent biological limits.[264] Critics, including fisheries scientist Ray Hilborn, contend that alarmist claims overstate depletion by extrapolating from high-seas or unmanaged stocks to the global totality, ignoring recoveries in well-managed systems; for instance, U.S. fisheries achieved zero overfishing status by 2017 through science-based quotas and individual transferable quotas (ITQs), with biomass rebuilding in species like Atlantic sea scallops from near-collapse levels in the 1990s to record highs by 2020.[265] Hilborn's analyses, drawing from global catch data and stock assessments, highlight that total marine capture production stabilized at around 90-95 million tonnes annually since the 1990s, not due to exhaustion but shifts to underutilized species lower in the food web and improved selectivity reducing bycatch.[266] These counterarguments emphasize causal factors like economic incentives for sustainability—where profitable fisheries self-regulate harvest rates below maximum sustainable yield—and question the credibility of sources prone to sensationalism, such as NGO reports that historically predicted total collapse by dates like 2048 but have not materialized amid ongoing production.[267] Aquaculture has intensified these debates by surpassing capture fisheries in output, reaching 94.4 million tonnes of aquatic animals in 2022 and comprising 51 percent of total production, thereby offsetting stagnation in wild catches and supporting global seafood supply growth to 223.2 million tonnes.[268] Advocates view it as a pressure-reliever for wild stocks, with finfish like salmon and tilapia farmed intensively in controlled systems that minimize ocean habitat disruption, though empirical evidence shows mixed environmental outcomes: fed aquaculture (e.g., shrimp, carnivorous fish) requires 1.5-3 kg of wild fishmeal per kg produced, potentially straining forage species, while disease outbreaks and effluent discharges have caused localized ecosystem degradation, as seen in Chilean salmon farms where algal blooms linked to waste killed 26 million fish in 2016.[269] Open-ocean or integrated multi-trophic systems show promise for mitigation, but scalability remains debated, with production growth driven by Asia (94 percent of volume) raising concerns over antibiotic overuse and biodiversity loss in coastal mangroves converted to ponds.[270]| Indicator | Capture Fisheries (2022) | Aquaculture (2022) |
|---|---|---|
| Production (million tonnes) | 91 | 94.4 (aquatic animals) |
| Sustainability Status | 37.7% overexploited (assessed stocks) | Variable; fed systems contribute to wild forage depletion |
| Key Challenges | IUU fishing, climate variability | Disease, nutrient pollution |
Resource Mining Conflicts: Deep-Sea and Coastal
Deep-sea mining targets polymetallic nodules, cobalt-rich ferromanganese crusts, and seafloor massive sulfides in areas beyond national jurisdiction, primarily in the Clarion-Clipperton Zone of the Pacific Ocean, which spans approximately 4.5 million square kilometers and holds an estimated 21 billion tonnes of nodules containing manganese, nickel, copper, and cobalt essential for battery production and renewable energy technologies.[273] Extraction methods, such as seafloor collector vehicles and riser systems, disrupt seafloor sediments, generating plumes that can extend thousands of meters vertically and horizontally, potentially smothering benthic organisms and altering midwater ecosystems over scales exceeding 10 kilometers from operations.[274] Empirical evidence from pilot tests, including the 2023 nodule collection trial by The Metals Company in the CCZ, indicates acute mortality in exposed fauna, with recovery timelines potentially spanning millennia due to the deep sea's low temperatures and slow biological rates, though long-term ecosystem-wide effects remain uncertain absent commercial-scale data.[275] Conflicts arise from tensions between resource demands driven by electrification—global cobalt demand projected to rise 500% by 2050—and environmental risks, including irreversible biodiversity loss in underexplored habitats hosting unique species like xenophyophores and holothurians, which exhibit densities up to 1,000 individuals per square meter in nodule fields.[276] Proponents, including Nauru and Norway, argue mining avoids terrestrial impacts like deforestation, while critics, supported by over 30 nations including France and Germany, cite insufficient baseline data and predictive models showing up to 90% habitat loss in mined patches, advocating a precautionary moratorium until regulations ensure no serious harm under UNCLOS Article 145.[207] The International Seabed Authority (ISA), tasked with authorizing exploitation, has issued 31 exploration contracts covering 1.3 million square kilometers as of 2025 but deferred adoption of a mining code at its July 2025 session amid divisions, with small island states like Samoa emphasizing equity risks where mining benefits developed powers at the expense of distant fisheries-dependent economies.[277] Geopolitical strains intensified with a U.S. executive order on April 24, 2025, promoting domestic critical mineral strategies, potentially bypassing ISA if Congress ratifies UNCLOS.[278] Coastal seabed mining, occurring within exclusive economic zones, extracts aggregates like sand and gravel for construction—global demand exceeding 50 billion tonnes annually—and heavy minerals such as diamonds and phosphates, often via dredging that resuspends sediments and erodes shorelines at rates up to 10 meters per year in high-extraction zones like Indonesia's Java Sea.[279] Primary conflicts involve spatial overlaps with fisheries, where dredging in areas like Namibia's offshore phosphate deposits (estimated 2 billion tonnes) has led to lawsuits from fishing unions claiming 20-30% declines in hake and horse mackerel yields due to habitat fragmentation and plume-induced larval mortality, though causal links remain debated amid confounding factors like overfishing.[280] Environmental assessments highlight risks to seagrass beds and mangroves, which support 30% of coastal fish production, with mitigation efforts like seasonal bans proving variably effective based on site-specific hydrodynamics.[281] Local disputes, such as those between mining firms and indigenous coastal communities in New Zealand's Westport region over ironsand extraction, underscore socioeconomic divides, with operations generating dust plumes affecting air quality and tourism revenues estimated at NZ$100 million annually. Regulatory frameworks vary, with the European Union's Marine Strategy Framework Directive imposing environmental impact assessments, yet enforcement gaps persist in developing nations prioritizing export revenues over empirical monitoring.[282]Recent Developments
Technological Innovations (2020s Focus)
The 2020s have marked a surge in autonomous platforms for oceanographic observation, enabling persistent, cost-effective data collection in extreme environments without human risk. Autonomous underwater vehicles (AUVs) have advanced through improved power systems, navigation accuracy, and artificial intelligence integration for adaptive mission planning and perception.[283] For instance, the Orpheus AUV, developed by Orpheus Ocean and field-tested by NOAA in 2025 east of the Mariana Trench, reaches depths up to 11,000 meters and captured the first direct images of polymetallic nodules at 5,645 meters, supporting assessments of deep-sea minerals.[284] Similarly, uncrewed surface vehicles (USVs) like Saildrone systems have evolved with enhanced satellite communications, endurance for multi-month deployments, and payloads including acoustic Doppler current profilers for upper-ocean measurements, aiding remote seafloor mapping and hurricane validation.[285] [286] Enhancements to global observing arrays have incorporated biogeochemical sensors, expanding beyond temperature and salinity to track oxygen, nitrate, pH, and chlorophyll-a. The Argo program, with over 2,211 active U.S. floats as of May 2025, includes deep-reaching variants to 6,000 meters and biogeochemical (BGC) models transmitting data every 10 days via satellite for real-time quality control.[287] Drifter buoys under NOAA's Global Drifter Program, numbering around 1,300, now measure sea surface temperature, salinity, wind, waves, and pressure, contributing to surface current and climate models.[287] These systems align with the UN Decade of Ocean Science (2021-2030), which emphasizes scalable robotics for pollution mapping and ecosystem monitoring.[288] Artificial intelligence has transformed data analysis and forecasting, processing vast datasets from satellites and in-situ sensors to detect patterns unattainable through traditional methods. In 2025, IBM's open-source Granite-Geospatial-Ocean model analyzes satellite imagery for marine ecosystem health and carbon uptake, while AI-driven vessel detection from Global Fishing Watch expanded global activity coverage by 30% using synthetic aperture radar.[289] [290] Institutions like Mercator Ocean International integrate AI for high-resolution ocean simulations, improving predictive accuracy for currents and biogeochemical cycles.[291] These tools, grounded in empirical validation against in-situ data, address challenges in handling heterogeneous ocean datasets but require ongoing calibration to mitigate biases from training data limitations.[292]Empirical Findings on Ocean Dynamics (Post-2020)
The Surface Water and Ocean Topography (SWOT) satellite, launched in December 2022 as a collaboration between NASA and the French space agency CNES, has provided unprecedented high-resolution measurements of sea surface height, enabling empirical quantification of submesoscale ocean features—eddies, fronts, and filaments smaller than 10 km in scale—that were previously undersampled by traditional altimetry.[293][294] Data from SWOT's early observing phase (2023–2024) reveal that these submesoscale structures contribute significantly to vertical mixing and lateral transport of heat, momentum, and nutrients, with sea surface height anomaly (SSHA) gradients exceeding those predicted by coarser models, thus refining estimates of ocean kinetic energy dissipation at scales of 1–25 km.[295][296] In the Mediterranean Sea, SWOT observations from 2023 onward have enhanced detection of small-scale eddies (down to 5–10 km diameter), demonstrating their role in sharpening mesoscale fronts and amplifying local currents by up to 20–30% compared to pre-SWOT satellite data, which underscores the underestimation of submesoscale variability in prior global circulation models.[295] Similarly, in open ocean basins, SWOT-derived velocities indicate that submesoscale dynamics drive enhanced downgradient heat fluxes, with empirical correlations showing these features responsible for 10–20% of the total meridional heat transport variability observed between 2023 and 2025.[297] These findings, validated against in-situ drifter and glider data, highlight how fine-scale topography influences larger-scale circulation patterns, including restratification of the mixed layer during winter.[294] Direct observations of the Atlantic Meridional Overturning Circulation (AMOC) from arrays like OSNAP and RAPID, extended through 2024, show persistent interannual variability superimposed on a multidecadal weakening trend of approximately 0.5–1 Sverdrup per decade since the early 2000s, though this signal remains statistically indistinguishable from internal variability in short-term records due to limited observational baselines.[298][299] Empirical analyses of upper-ocean temperature and salinity profiles from ARGO floats (2020–2025) indicate that freshwater inputs from Arctic gateways contribute to reduced deep convection in the Labrador Sea, correlating with AMOC streamfunction minima observed in 2021–2023, but proxy reconstructions and model-data syntheses question the dominance of anthropogenic forcing over natural oscillations like the Atlantic Multidecadal Variability.[300] An empirical stochastic modeling approach applied to global upper-ocean datasets (including satellite altimetry and ARGO profiles from 2020–2024) identifies coherent trends in velocity variance, eddy kinetic energy, and vertical shear, revealing regionally heterogeneous dynamics: strengthening wind-driven upwelling off western boundaries but subdued meridional overturning in subtropical gyres, consistent with observed shifts in Southern Ocean wind stress rather than uniform slowdown.[301] In the Southern Ocean, 2021–2025 hydrographic surveys document reversals in Antarctic Circumpolar Current branches linked to eddy-mean flow interactions, with empirical particle tracking showing altered cross-frontal exchanges that modulate global carbon uptake efficiency by 5–10% interannually.[302] These observations emphasize the causal role of mesoscale-to-submesoscale cascades in sustaining ocean dynamical stability amid varying surface forcing.[303]Policy Responses and International Agreements
The United Nations Decade of Ocean Science for Sustainable Development, proclaimed in 2017 and launched on January 1, 2021, represents a coordinated global effort to enhance oceanographic research and knowledge generation through 2030, with the aim of supporting Sustainable Development Goal 14 on conserving and sustainably using marine resources. Coordinated by UNESCO's Intergovernmental Oceanographic Commission, the initiative emphasizes empirical data collection on ocean dynamics, biodiversity, and ecosystem services to inform policy, including the identification of ten key challenges such as understanding ocean-climate interactions and pollution impacts. Over 50 national committees and numerous endorsed programs have mobilized resources, though implementation faces hurdles in funding and data integration across diverse jurisdictions.[288][304] In June 2023, the United Nations adopted the Agreement under the United Nations Convention on the Law of the Sea on the Conservation and Sustainable Use of Marine Biological Diversity of Areas Beyond National Jurisdiction (BBNJ Agreement, or High Seas Treaty), addressing governance gaps for the 64% of the ocean outside national waters. The treaty, finalized after nearly two decades of negotiations, mandates environmental impact assessments for activities like deep-sea mining, facilitates marine protected area designation based on scientific criteria, and promotes benefit-sharing from marine genetic resources discovered through oceanographic exploration. It opened for signature on September 20, 2023, and achieved the 60th ratification on September 19, 2025, triggering entry into force 120 days later on January 17, 2026; early ratifiers include vulnerable island nations citing empirical risks to migratory species and fisheries yields. Critics, including some resource-extraction advocates, argue it may impose regulatory burdens without proven causal links to biodiversity declines, prioritizing instead localized overexploitation data.[305][306][307] Negotiations for a global treaty to curb plastic pollution, initiated by a 2022 UN Environment Assembly resolution, continued into 2025 but stalled at the fifth intergovernmental committee session (INC-5.2) from August 5-14 in Geneva, where delegates rejected draft texts amid disagreements on production caps, chemical regulations, and financing—projected plastic waste could reach 1.7 billion metric tons by 2060 absent binding measures. Oceanographic studies underscore plastics' role in marine debris accumulation, with empirical surveys showing microplastic ingestion affecting up to 90% of sampled seabirds and fish in certain gyres, yet enforcement challenges persist due to inconsistent national reporting. Proponents advocate lifecycle approaches informed by ocean circulation models, while skeptics highlight recycling inefficiencies and question the treaty's potential to overlook upstream industrial emissions.[308][309] The third United Nations Ocean Conference, convened in Nice, France, from June 9-13, 2025, yielded a political declaration reaffirming commitments to ocean health, with over 200 pledges totaling billions in funding for restoration and research, including enhanced monitoring of deoxygenation zones via satellite and in-situ oceanographic networks. These build on prior conferences but emphasize verifiable metrics, such as tracking protected area efficacy through biodiversity indices rather than aspirational targets alone. Empirical evaluations of earlier policies, like the 2015 Paris Agreement's indirect ocean provisions, reveal mixed outcomes: reduced shipping emissions via IMO standards have curbed local acidification in some ports, but global CO2 absorption rates continue unabated, underscoring limits of mitigation without addressing root anthropogenic drivers.[310]Institutions and Organizations
Leading National Research Centers
The United States hosts several preeminent oceanographic research centers, including the Scripps Institution of Oceanography at the University of California, San Diego, founded in 1903 as the Marine Biological Association of San Diego and renamed in 1912. Scripps conducts multidisciplinary research on ocean chemistry, physics, biology, and climate, operating four research vessels and contributing to discoveries in seafloor mapping and El Niño dynamics through expeditions like the MidPac in 1950.[42] Its scientists have advanced understanding of ocean-atmosphere interactions, with facilities supporting over 200 principal investigators as of 2023.[311] Complementing Scripps is the Woods Hole Oceanographic Institution (WHOI), established in 1930 as a private nonprofit in Massachusetts, employing about 1,000 scientists, engineers, and staff dedicated to ocean exploration and technology. WHOI pioneered autonomous underwater vehicles and led the 1985 discovery of the RMS Titanic wreck at 3,800 meters depth using the submersible Argo, yielding data on deep-sea corrosion rates.[44] Its research spans hydrothermal vents, ocean acoustics, and carbon cycling, with key findings including the 1977 detection of black smokers at the Galápagos Rift.[6] In the United Kingdom, the National Oceanography Centre (NOC), operational since 2010 through the merger of prior facilities in Southampton and Liverpool, functions as the nation's primary institute for integrated ocean science, managing two research vessels and autonomous systems for data collection on currents, biogeochemistry, and sea-level variability. NOC's observational networks have documented Atlantic meridional overturning circulation slowdowns at rates of 0.5–1 Sverdrup per decade since 2004, informing climate models.[312] France's Institut Français de Recherche pour l'Exploitation de la Mer (IFREMER), formed in 1984 as a public institute under the Ministry of Higher Education and Research, focuses on sustainable marine resource use, aquaculture optimization, and coastal dynamics, operating a fleet including the Pourquoi Pas? vessel for deep-sea surveys. IFREMER's empirical studies have quantified microplastic ingestion in commercial fish species at concentrations up to 2.9 particles per individual in the Mediterranean as of 2022.[313] Japan's Japan Agency for Marine-Earth Science and Technology (JAMSTEC), reorganized in 2003 from earlier entities, leads national efforts in subduction zone seismicity, resource exploration, and biodiversity assessment, deploying submersibles like the Deep-sea 6500 that reached 6,527 meters in the Mariana Trench in 2012. JAMSTEC's seismic arrays have mapped megathrust faults contributing to the 2011 Tōhoku earthquake's 9.0 magnitude rupture over 500 kilometers.[314] Other nations maintain significant centers, such as Germany's GEOMAR Helmholtz Centre for Ocean Research Kiel, established in 2004, which specializes in ocean circulation modeling and microbial ecology, with moorings tracking North Atlantic Deep Water formation volumes exceeding 20 Sverdrups annually. These institutions collectively drive empirical advancements through vessel-based expeditions and in-situ sensors, prioritizing data verifiable against physical ocean laws over modeled projections alone.Global and Collaborative Bodies
The Intergovernmental Oceanographic Commission (IOC) of UNESCO coordinates global efforts in marine sciences, emphasizing international collaboration for ocean observation, data exchange, and capacity building among its 150 member states. It implements key programs including tsunami warning systems and the integration of ocean data into climate assessments, with activities grounded in empirical monitoring to support sustainable ocean management.[315] The IOC's framework addresses gaps in national capabilities by fostering joint research initiatives and standardizing protocols for oceanographic data, thereby enhancing causal understanding of marine processes without reliance on unsubstantiated models.[315] The Scientific Committee on Oceanic Research (SCOR) functions as a non-governmental entity under the International Science Council, promoting methodological advancements in oceanography through interdisciplinary working groups that tackle challenges like deep-sea sampling and biogeochemical cycling. SCOR facilitates global researcher networks, prioritizing evidence-based approaches to resolve conceptual issues in ocean dynamics, such as circulation patterns verified by in-situ measurements rather than simulations alone.[316] The Global Ocean Observing System (GOOS), steered by the IOC, delivers real-time essential ocean variables—including temperature, salinity, and oxygen levels—from platforms like Argo floats and satellite altimetry, aggregating over 1 million daily observations for empirical analysis. This system supports causal realism in policy by providing verifiable data on ocean health indicators, countering biases in interpretive frameworks from less rigorous sources.[317][318] Regional bodies like the International Council for the Exploration of the Sea (ICES) extend collaborative principles globally through North Atlantic-focused research on fisheries and ecosystems, issuing advice based on stock assessments and environmental data to inform sustainable harvesting. ICES integrates multi-nation datasets, emphasizing empirical trends over narrative-driven projections.[319]Related Disciplines
Atmospheric and Climate Sciences
The interface between the ocean and atmosphere facilitates continuous exchanges of heat, momentum, freshwater, and gases, which are fundamental to global climate dynamics. Winds transfer momentum to the ocean surface, driving surface currents and generating waves, while the ocean imparts drag on the atmosphere, influencing wind patterns. Heat fluxes occur via conduction, convection, longwave radiation, and latent heat from evaporation, with the ocean typically warming the atmosphere in winter and cooling it in summer. These interactions are quantified through bulk formulas relating fluxes to differences in temperature, humidity, and wind speed across the interface.[320][321] Oceans serve as the primary reservoir for excess heat in the Earth's climate system, absorbing over 90% of the anthropogenic heat added since the 1970s, primarily in the upper 2000 meters. This uptake, measured via ARGO floats and ship-based observations, has led to an increase in ocean heat content equivalent to more than 800 times the annual U.S. electricity consumption as of 2022. Ocean currents, including the thermohaline circulation, redistribute this heat poleward, moderating equatorial overheating and ameliorating polar cooling; for instance, the Atlantic Meridional Overturning Circulation transports approximately 1 petawatt of heat northward, enabling milder European climates compared to similar latitudes in North America. Disruptions to this circulation, such as from freshwater influxes, could alter regional temperature gradients.[322][323][324] Gas exchanges at the air-sea boundary regulate atmospheric composition, with oceans acting as a sink for about 25% of anthropogenic CO2 emissions since the 1960s through solubility and biological pumps. This absorption, estimated from pCO2 measurements and global carbon inventories, forms carbonic acid, lowering surface pH by approximately 0.1 units since pre-industrial times, though the biological pump's efficiency varies with nutrient availability and stratification. Oxygen and other trace gases also flux bidirectionally, influencing marine productivity and atmospheric oxidative capacity.[325][326] Coupled ocean-atmosphere phenomena exemplify these interactions' climate impacts. The El Niño-Southern Oscillation (ENSO) arises from equatorial Pacific feedbacks where anomalous warming weakens trade winds, shifting convection eastward and altering global precipitation and temperature patterns, with effects persisting 6-18 months. Thermohaline circulation stability affects hemispheric heat budgets, as evidenced by paleoclimate proxies showing past shutdowns correlated with abrupt cooling events like the Younger Dryas. Empirical data from satellite altimetry and moorings underscore the need for integrated models to predict variability, revealing natural oscillations that modulate anthropogenic signals.[327][164]Marine Geology and Geophysics
Marine geology encompasses the study of the ocean floor's morphology, composition, sedimentary processes, and geological history, while marine geophysics focuses on the physical properties of the oceanic lithosphere, including seismic, gravitational, and magnetic anomalies.[328][329] These disciplines reveal the oceanic crust's role in plate tectonics, where the lithosphere's structure and evolution drive global geological dynamics.[330] Seafloor spreading, a core process in marine geophysics, occurs at mid-ocean ridges where upwelling mantle material generates new oceanic crust at rates typically ranging from 1 to 10 cm per year, evidenced by symmetric magnetic stripe patterns in the seafloor basalt recording reversals of Earth's geomagnetic field.[98][331] This mechanism, first proposed by Harry Hess in 1960, explains the lateral expansion of ocean basins and the recycling of crust at subduction zones, with global production rates showing a slowdown to 69-75% of pre-15 million year levels by 6-5 million years ago, primarily due to reduced spreading in the Pacific.[332][333] Ocean floor mapping relies on multibeam sonar and side-scan sonar systems, which emit acoustic pulses to construct high-resolution bathymetric models, revealing features like abyssal plains, trenches, and fracture zones with resolutions down to meters.[334][335] Sedimentology examines marine deposits formed by turbidity currents, pelagic rain, and boundary shear flows, with gravity coring used to sample up to several meters of seabed material for analyzing composition and paleoclimate proxies like sea-level changes.[336][113] Submarine volcanism and hydrothermal vents, prevalent along mid-ocean ridges and arc systems, are probed through geophysical surveys detecting magmatic intrusions and fluid discharges; for instance, temperature fluctuations in vent fluids signal pre-eruptive tectonic stress, as observed at sites like Hinepuia volcano where magmatic gases enrich fluids.[337][338] These processes contribute to 70% of arc-related hydrothermalism featuring volatile-rich emissions, influencing seafloor mineralization and heat flux.[339] Seismic and gravity data further delineate crustal thickness variations, with anomalies highlighting subduction zones where oceanic plates descend, fostering trenches deeper than 11 km like the Mariana.[330]Ecology and Evolutionary Biology
Marine ecology encompasses the study of interactions between organisms and their ocean environments, including population dynamics, community structures, and ecosystem processes across pelagic, benthic, and coastal habitats. Primary production in marine ecosystems is dominated by phytoplankton, which account for the base of food webs by converting solar energy into biomass through photosynthesis, supporting zooplankton grazers and subsequent trophic levels up to apex predators like sharks and marine mammals. These microscopic algae contribute significantly to global carbon cycling and oxygen production, with their blooms influencing nutrient distribution via processes like upwelling and sinking fluxes. Empirical observations from satellite data and field studies confirm phytoplankton's role in sustaining fisheries yields, which total around 90 million metric tons annually from wild capture.[340][341][342] Marine biodiversity underpins ecosystem resilience, with oceans hosting an estimated 91% of Earth's habitable volume and diverse phyla adapted to extreme conditions, from hydrothermal vents to polar ice edges. Coral reefs, kelp forests, and deep-sea chemosynthetic communities exemplify hotspots where symbiotic relationships and trophic cascades maintain stability, though empirical data from global surveys reveal uneven distribution, with higher species richness in tropical and coastal zones. Disruptions, such as overfishing or acidification, propagate through food webs, as evidenced by declines in herbivore populations correlating with algal overgrowth in reef systems. Conservation efforts prioritize these areas, recognizing their role in services like nutrient recycling and habitat provision.[343][344] Evolutionary biology in oceanography reveals adaptations shaped by abiotic stressors like pressure, salinity, and temperature gradients. Deep-sea organisms, for instance, exhibit convergent evolution in traits such as gelatinous bodies and light-emitting organs to exploit low-light niches, with genomic analyses showing positive selection on genes for hydrostatic pressure resistance. Endothermic invaders of marine realms, like cetaceans, display shifts toward slower life histories, including delayed maturity and reduced metabolic rates, as inferred from fossil records and phylogenetic reconstructions spanning the last 50 million years.[345][346] Speciation in marine settings challenges terrestrial models due to extensive larval dispersal and gene flow, favoring parapatric or sympatric modes driven by ecological selection over strict allopatry. Studies of reef fish and planktonic invertebrates demonstrate divergence via habitat partitioning or mate choice, with genomic markers revealing hybrid zones where reinforcement strengthens barriers. Recent advances, including demographic modeling of glacial-interglacial cycles, indicate rapid radiations in open-ocean clades, where oceanographic barriers like currents facilitate isolation. These processes underscore causal links between environmental heterogeneity and lineage diversification, with empirical phylogenies tracing origins to events like the oxygenation of deep waters around 390 million years ago.[347][348][349]References
- https://www.coastalwiki.org/wiki/Ocean_and_shelf_tides
- https://www.coastalwiki.org/wiki/Nutrient_conversion_in_the_marine_environment