
Community hub
Recent from talks
Contribute something
Nothing was collected or created yet.


Tides are the rise and fall of sea levels caused by the combined effects of the gravitational forces exerted by the Moon (and to a much lesser extent, the Sun) and are also caused by the Earth and Moon orbiting one another.
Tide tables can be used for any given locale to find the predicted times and amplitude (or "tidal range"). The predictions are influenced by many factors including the alignment of the Sun and Moon, the phase and amplitude of the tide (pattern of tides in the deep ocean), the amphidromic systems of the oceans, and the shape of the coastline and near-shore bathymetry (see Timing). They are however only predictions, and the actual time and height of the tide is affected by wind and atmospheric pressure. Many shorelines experience semi-diurnal tides—two nearly equal high and low tides each day. Other locations have a diurnal tide—one high and low tide each day. A "mixed tide"—two uneven magnitude tides a day—is a third regular category.[1][2][a]
Tides vary on timescales ranging from hours to years due to a number of factors, which determine the lunitidal interval. To make accurate records, tide gauges at fixed stations measure water level over time. Gauges ignore variations caused by waves with periods shorter than minutes. These data are compared to the reference (or datum) level usually called mean sea level.[3]
While tides are usually the largest source of short-term sea-level fluctuations, sea levels are also subject to change from thermal expansion, wind, and barometric pressure changes, resulting in storm surges, especially in shallow seas and near coasts.
Tidal phenomena are not limited to the oceans, but can occur in other systems whenever a gravitational field that varies in time and space is present. For example, the shape of the solid part of the Earth is affected slightly by Earth tide, though this is not as easily seen as the water tidal movements.
Characteristics
[edit]Ocean tides are cyclic, rising and falling approximately twice a day. Four stages in the tidal cycle are named:[4]: 235
- The water stops falling, reaching a local minimum called low tide.
- Sea level rises over several hours, covering the intertidal zone; flooding.
- The water stops rising, reaching a local maximum called high tide.
- Sea level falls over several hours, revealing the intertidal zone; ebbing.
Oscillating currents produced by tides are known as tidal streams or tidal currents. The moment that the tidal current ceases is called slack water or slack tide. The tide then reverses direction and is said to be turning. Slack water usually occurs near high water and low water, but there are locations where the moments of slack tide differ significantly from those of high and low water.[5]
Tides are commonly semi-diurnal (two high waters and two low waters each day), or diurnal (one tidal cycle per day). The two high waters on a given day are typically not the same height (the daily inequality); these are the higher high water and the lower high water in tide tables. Similarly, the two low waters each day are the higher low water and the lower low water. The daily inequality is not consistent and is generally small when the Moon is over the Equator.[b]
Reference levels
[edit]
The following reference tide levels can be defined, from the highest level to the lowest:
- Highest astronomical tide (HAT) – The highest tide which can be predicted to occur. Note that meteorological conditions may add extra height to the HAT.
- Mean high water springs (MHWS) – The average of the two high tides on the days of spring tides.
- Mean high water neaps (MHWN) – The average of the two high tides on the days of neap tides.
- Mean sea level (MSL) – This is the average sea level. The MSL is constant for any location over a long period.
- Mean low water neaps (MLWN) – The average of the two low tides on the days of neap tides.
- Mean low water springs (MLWS) – The average of the two low tides on the days of spring tides.
- Lowest astronomical tide (LAT) – The lowest tide which can be predicted to occur.[7]
Range variation: springs and neaps
[edit]
The semi-diurnal range (the difference in height between high and low waters over about half a day) varies in a two-week cycle. Approximately twice a month, around new moon and full moon when the Sun, Moon, and Earth form a line (a configuration known as a syzygy[8]), the tidal force due to the Sun reinforces that due to the Moon. The tide's range is then at its maximum; this is called the spring tide. It is not named after the season, but, like that word, derives from the meaning "jump, burst forth, rise", as in a natural spring. Spring tides are sometimes referred to as syzygy tides.[9]
When the Moon is at first quarter or third quarter, the Sun and Moon are separated by 90° when viewed from the Earth (in quadrature), and the solar tidal force partially cancels the Moon's tidal force. At these points in the lunar cycle, the tide's range is at its minimum; this is called the neap tide, or neaps. "Neap" is an Anglo-Saxon word meaning "without the power".[10] Neap tides are sometimes referred to as quadrature tides.[9]
Spring tides result in high waters that are higher than average, low waters that are lower than average, "slack water" time that is shorter than average, and stronger tidal currents than average. Neaps result in less extreme tidal conditions. There is about a seven-day interval between springs and neaps.
-
 Spring tide: Sun and Moon on the same side (0°)
 -
 Neap tide: Sun and Moon at 90°
 -
 Spring tide: Sun and Moon at opposite sides (180°)
 -
 Neap tide: Sun and Moon at 270°
 -
 Spring tide: Sun and Moon at the same side (cycle restarts)


Tidal constituents
[edit]Tidal constituents are the net result of multiple influences impacting tidal changes over certain periods of time. Primary constituents include the Earth's rotation, the position of the Moon and Sun relative to the Earth, the Moon's altitude (elevation) above the Earth's Equator, and bathymetry. Variations with periods of less than half a day are called harmonic constituents. Conversely, cycles of days, months, or years are referred to as long period constituents.
Tidal forces affect the entire earth, but the movement of solid Earth occurs by mere centimeters. In contrast, the atmosphere is much more fluid and compressible so its surface moves by kilometers, in the sense of the contour level of a particular low pressure in the outer atmosphere.
Principal lunar semi-diurnal constituent
[edit]In most locations, the largest constituent is the principal lunar semi-diurnal, also known as the M2 tidal constituent or M2 tidal constituent. Its period is about 12 hours and 25.2 minutes, exactly half a tidal lunar day, which is the average time separating one lunar zenith from the next, and thus is the time required for the Earth to rotate once relative to the Moon. Simple tide clocks track this constituent. The lunar day is longer than the Earth day because the Moon orbits in the same direction the Earth spins.
The Moon orbits the Earth in the same direction as the Earth rotates on its axis, so it takes slightly more than a day—about 24 hours and 50 minutes—for the Moon to return to the same location in the sky. During this time, it has passed overhead (culmination) once and underfoot once (at an hour angle of 00:00 and 12:00 respectively), so in many places the period of strongest tidal forcing is the above-mentioned, about 12 hours and 25 minutes. The moment of highest tide is not necessarily when the Moon is nearest to zenith or nadir, but the period of the forcing still determines the time between high tides.
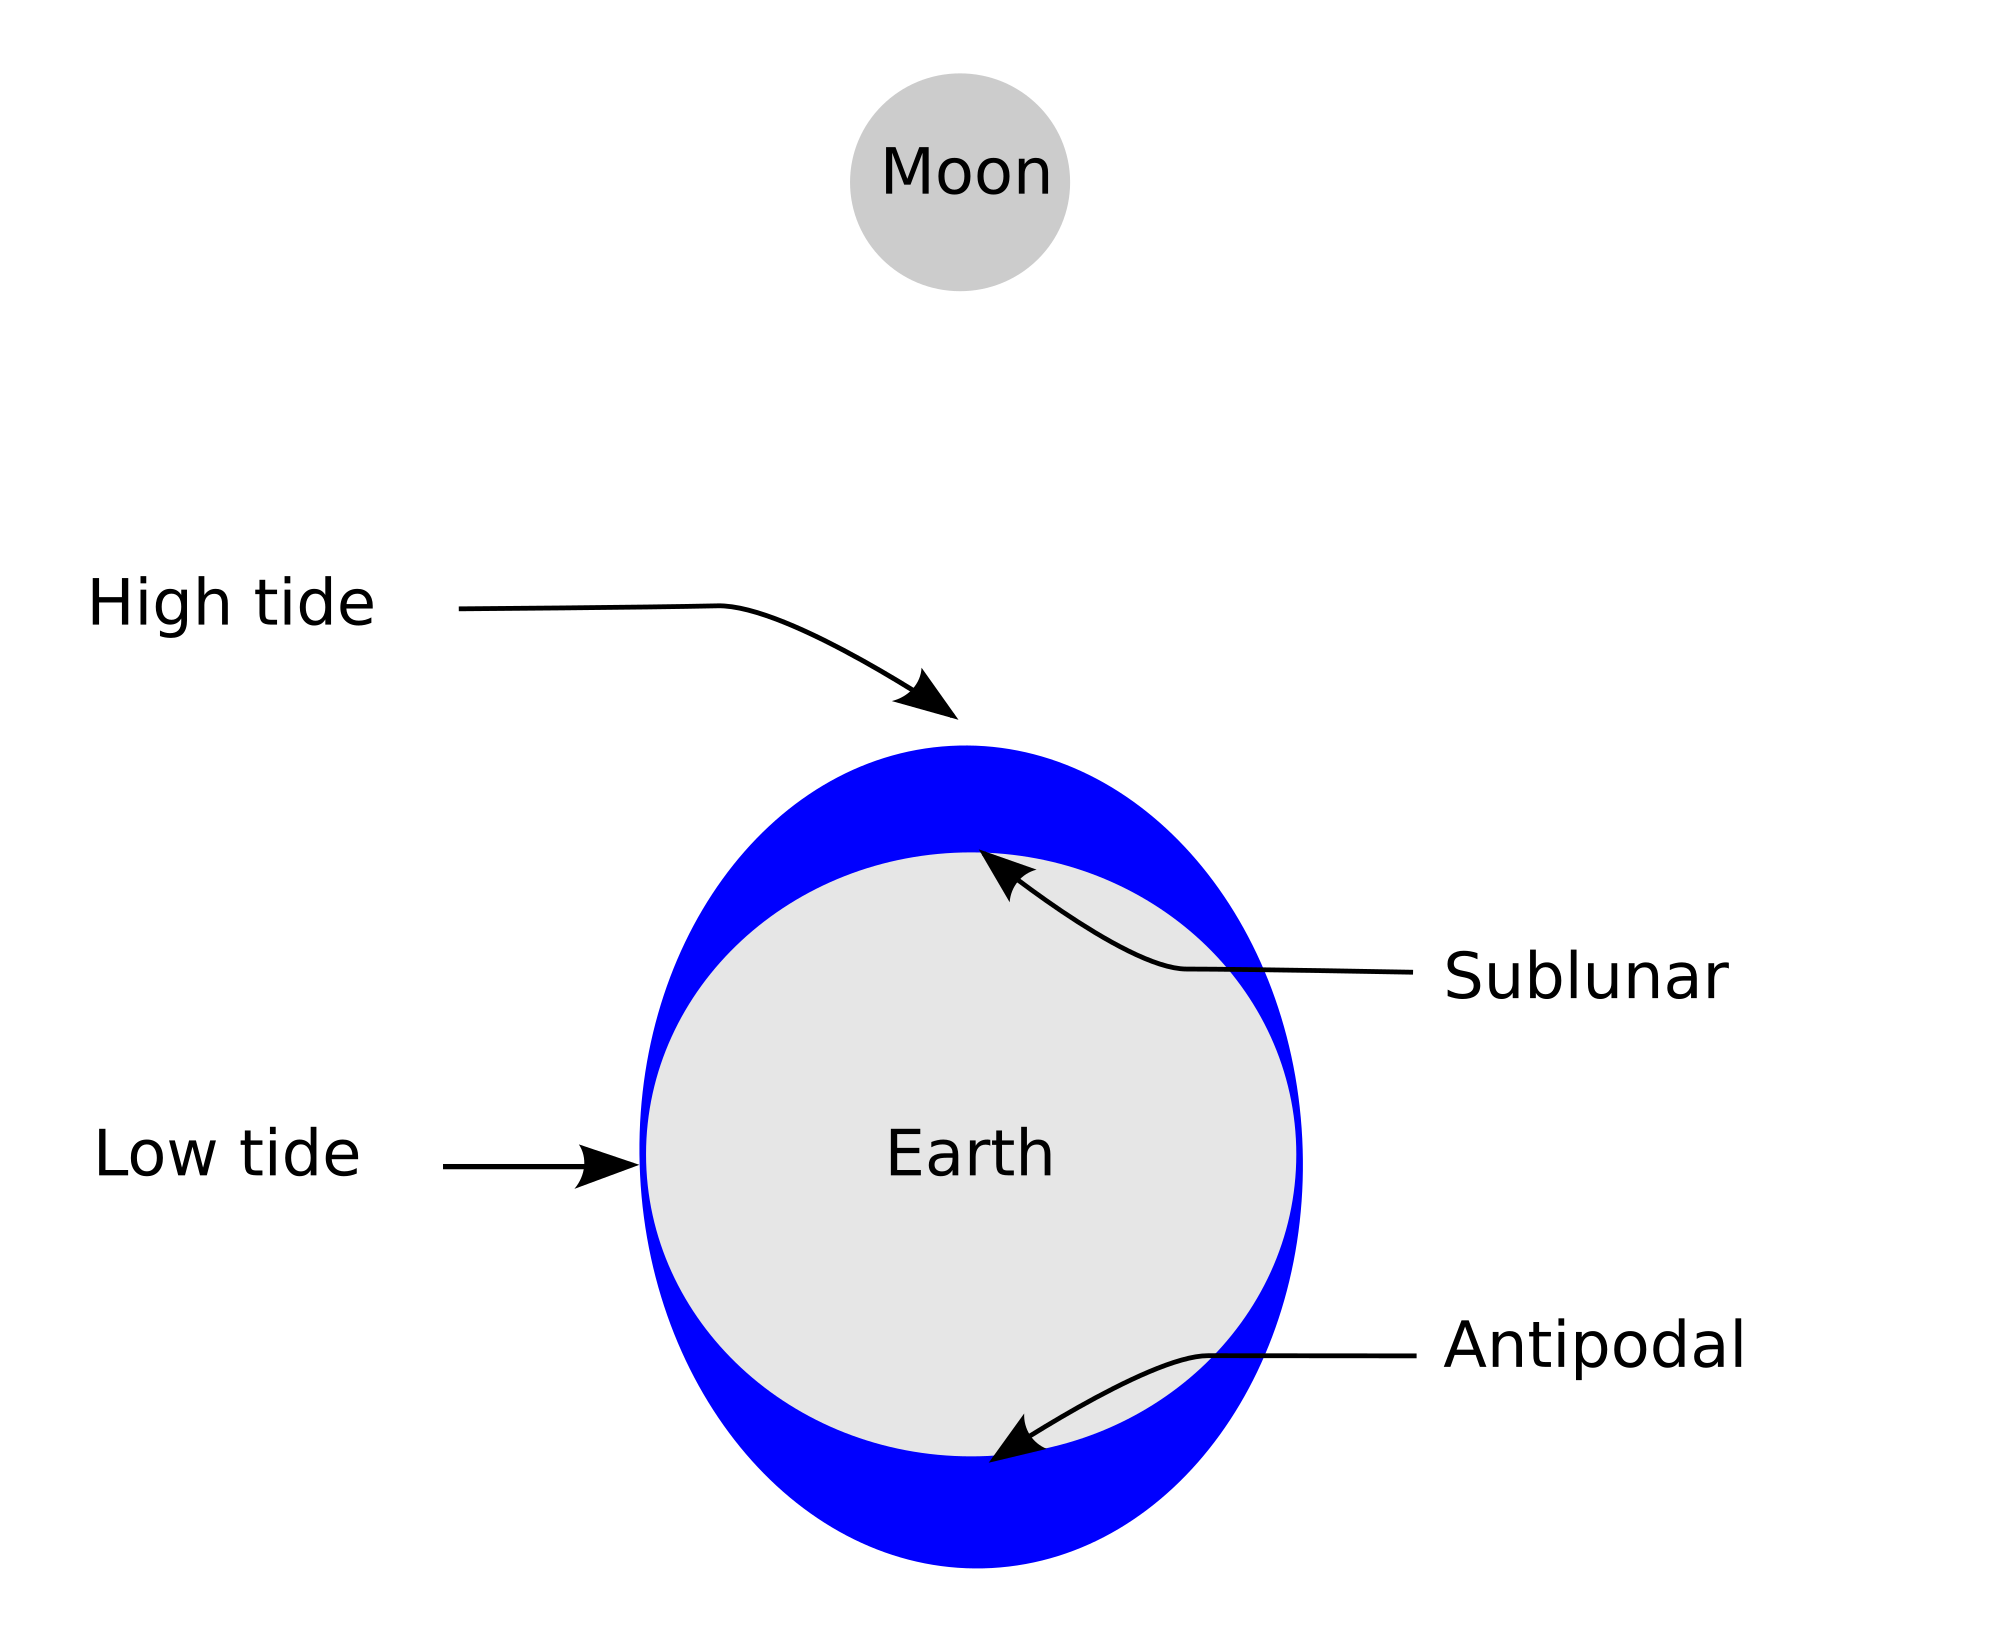
Because the gravitational field created by the Moon weakens with distance from the Moon, it exerts a slightly stronger than average force on the side of the Earth facing the Moon, and a slightly weaker force on the opposite side. The Moon thus tends to "stretch" the Earth slightly along the line connecting the two bodies. The solid Earth deforms a bit, but ocean water, being fluid, is free to move much more in response to the tidal force, particularly horizontally (see equilibrium tide).
As the Earth rotates, the magnitude and direction of the tidal force at any particular point on the Earth's surface change constantly; although the ocean never reaches equilibrium—there is never time for the fluid to "catch up" to the state it would eventually reach if the tidal force were constant—the changing tidal force nonetheless causes rhythmic changes in sea surface height.

When there are two high tides each day with different heights (and two low tides also of different heights), the pattern is called a mixed semi-diurnal tide.[12]
Lunar distance
[edit]


The changing distance separating the Moon and Earth also affects tide heights. When the Moon is closest, at perigee, the range increases, and when it is at apogee, the range shrinks. Six or eight times a year perigee coincides with either a new or full moon causing perigean spring tides with the largest tidal range. The difference between the height of a tide at perigean spring tide and the spring tide when the moon is at apogee depends on location but can be as large as a foot higher.[13]
Other constituents
[edit]These include solar gravitational effects, the obliquity (tilt) of the Earth's Equator and rotational axis, the inclination of the plane of the lunar orbit and the elliptical shape of the Earth's orbit of the Sun.
A compound tide (or overtide) results from the shallow-water interaction of its two parent waves.[14]
Phase and amplitude
[edit]
Because the M2 tidal constituent dominates in most locations, the stage or phase of a tide, denoted by the time in hours after high water, is a useful concept. Tidal stage is also measured in degrees, with 360° per tidal cycle. Lines of constant tidal phase are called cotidal lines, which are analogous to contour lines of constant altitude on topographical maps, and when plotted form a cotidal map or cotidal chart.[17] High water is reached simultaneously along the cotidal lines extending from the coast out into the ocean, and cotidal lines (and hence tidal phases) advance along the coast. Semi-diurnal and long phase constituents are measured from high water, diurnal from maximum flood tide. This and the discussion that follows is precisely true only for a single tidal constituent.
For an ocean in the shape of a circular basin enclosed by a coastline, the cotidal lines point radially inward and must eventually meet at a common point, the amphidromic point. The amphidromic point is at once cotidal with high and low waters, which is satisfied by zero tidal motion. (The rare exception occurs when the tide encircles an island, as it does around New Zealand, Iceland and Madagascar.) Tidal motion generally lessens moving away from continental coasts, so that crossing the cotidal lines are contours of constant amplitude (half the distance between high and low water) which decrease to zero at the amphidromic point. For a semi-diurnal tide the amphidromic point can be thought of roughly like the center of a clock face, with the hour hand pointing in the direction of the high water cotidal line, which is directly opposite the low water cotidal line. High water rotates about the amphidromic point once every 12 hours in the direction of rising cotidal lines, and away from ebbing cotidal lines. This rotation, caused by the Coriolis effect, is generally clockwise in the southern hemisphere and counterclockwise in the northern hemisphere. The difference of cotidal phase from the phase of a reference tide is the epoch. The reference tide is the hypothetical constituent "equilibrium tide" on a landless Earth measured at 0° longitude, the Greenwich meridian.[18]
In the North Atlantic, because the cotidal lines circulate counterclockwise around the amphidromic point, the high tide passes New York Harbor approximately an hour ahead of Norfolk Harbor. South of Cape Hatteras the tidal forces are more complex, and cannot be predicted reliably based on the North Atlantic cotidal lines.
History
[edit]History of tidal theory
[edit]Investigation into tidal physics was important in the early development of celestial mechanics, with the existence of two daily tides being explained by the Moon's gravity. Later the daily tides were explained more precisely by the interaction of the Moon's and the Sun's gravity.
Seleucus of Seleucia theorized around 150 BC that tides were caused by the Moon. The influence of the Moon on bodies of water was also mentioned in Ptolemy's Tetrabiblos.[c]
In De temporum ratione (The Reckoning of Time) of 725 Bede linked semidurnal tides and the phenomenon of varying tidal heights to the Moon and its phases. Bede starts by noting that the tides rise and fall 4/5 of an hour later each day, just as the Moon rises and sets 4/5 of an hour later.[20] He goes on to emphasise that in two lunar months (59 days) the Moon circles the Earth 57 times and there are 114 tides.[21] Bede then observes that the height of tides varies over the month. Increasing tides are called malinae and decreasing tides ledones and that the month is divided into four parts of seven or eight days with alternating malinae and ledones.[22] In the same passage he also notes the effect of winds to hold back tides.[22] Bede also records that the time of tides varies from place to place. To the north of Bede's location (Monkwearmouth) the tides are earlier, to the south later.[23] He explains that the tide "deserts these shores in order to be able all the more to be able to flood other [shores] when it arrives there" noting that "the Moon which signals the rise of tide here, signals its retreat in other regions far from this quarter of the heavens".[23]
Later medieval understanding of the tides was primarily based on works of Muslim astronomers, which became available through Latin translation starting from the 12th century.[24] Abu Ma'shar al-Balkhi (d. circa 886), in his Introductorium in astronomiam, taught that ebb and flood tides were caused by the Moon.[24] Abu Ma'shar discussed the effects of wind and Moon's phases relative to the Sun on the tides.[24] In the 12th century, al-Bitruji (d. circa 1204) contributed the notion that the tides were caused by the general circulation of the heavens.[24]
Simon Stevin, in his 1608 De spiegheling der Ebbenvloet (The theory of ebb and flood), dismissed a large number of misconceptions that still existed about ebb and flood. Stevin pleaded for the idea that the attraction of the Moon was responsible for the tides and spoke in clear terms about ebb, flood, spring tide and neap tide, stressing that further research needed to be made.[25][26]
In 1609 Johannes Kepler also correctly suggested that the gravitation of the Moon caused the tides,[d] which he based upon ancient observations and correlations.
Galileo Galilei in his 1632 Dialogue Concerning the Two Chief World Systems, whose working title was Dialogue on the Tides, gave an explanation of the tides. The resulting theory, however, was incorrect as he attributed the tides to the sloshing of water caused by the Earth's movement around the Sun. He hoped to provide mechanical proof of the Earth's movement. The value of his tidal theory is disputed. Galileo rejected Kepler's explanation of the tides.
Isaac Newton (1642–1727) was the first person to explain tides as the product of the gravitational attraction of astronomical masses. His explanation of the tides (and many other phenomena) was published in the Principia (1687)[28][29] and used his theory of universal gravitation to explain the lunar and solar attractions as the origin of the tide-generating forces.[e] Newton and others before Pierre-Simon Laplace worked the problem from the perspective of a static system (equilibrium theory), that provided an approximation that described the tides that would occur in a non-inertial ocean evenly covering the whole Earth.[28] The tide-generating force (or its corresponding potential) is still relevant to tidal theory, but as an intermediate quantity (forcing function) rather than as a final result; theory must also consider the Earth's accumulated dynamic tidal response to the applied forces, which response is influenced by ocean depth, the Earth's rotation, and other factors.[30]
In 1740, the Académie Royale des Sciences in Paris offered a prize for the best theoretical essay on tides. Daniel Bernoulli, Leonhard Euler, Colin Maclaurin and Antoine Cavalleri shared the prize.[31]
Maclaurin used Newton's theory to show that a smooth sphere covered by a sufficiently deep ocean under the tidal force of a single deforming body is a prolate spheroid (essentially a three-dimensional oval) with major axis directed toward the deforming body. Maclaurin was the first to write about the Earth's rotational effects on motion. Euler realized that the tidal force's horizontal component (more than the vertical) drives the tide. In 1744 Jean le Rond d'Alembert studied tidal equations for the atmosphere which did not include rotation.
In 1770 James Cook's barque HMS Endeavour grounded on the Great Barrier Reef. Attempts were made to refloat her on the following tide which failed, but the tide after that lifted her clear with ease. Whilst she was being repaired in the mouth of the Endeavour River Cook observed the tides over a period of seven weeks. At neap tides both tides in a day were similar, but at springs the tides rose 7 feet (2.1 m) in the morning but 9 feet (2.7 m) in the evening.[32]
Pierre-Simon Laplace formulated a system of partial differential equations relating the ocean's horizontal flow to its surface height, the first major dynamic theory for water tides. The Laplace tidal equations are still in use today. William Thomson, 1st Baron Kelvin, rewrote Laplace's equations in terms of vorticity which allowed for solutions describing tidally driven coastally trapped waves, known as Kelvin waves.[33][34][35]
Others including Kelvin and Henri Poincaré further developed Laplace's theory. Based on these developments and the lunar theory of E W Brown describing the motions of the Moon, Arthur Thomas Doodson developed and published in 1921[36] the first modern development of the tide-generating potential in harmonic form: Doodson distinguished 388 tidal frequencies.[37] Some of his methods remain in use.[38]
History of tidal observation
[edit]

From ancient times, tidal observation and discussion has increased in sophistication, first marking the daily recurrence, then tides' relationship to the Sun and moon. Pytheas travelled to the British Isles about 325 BC and seems to be the first to have related spring tides to the phase of the moon.
In the 2nd century BC, the Hellenistic astronomer Seleucus of Seleucia correctly described the phenomenon of tides in order to support his heliocentric theory.[39] He correctly theorized that tides were caused by the moon, although he believed that the interaction was mediated by the pneuma. He noted that tides varied in time and strength in different parts of the world. According to Strabo (1.1.9), Seleucus was the first to link tides to the lunar attraction, and that the height of the tides depends on the moon's position relative to the Sun.[40]
The Naturalis Historia of Pliny the Elder collates many tidal observations, e.g., the spring tides are a few days after (or before) new and full moon and are highest around the equinoxes, though Pliny noted many relationships now regarded as fanciful. In his Geography, Strabo described tides in the Persian Gulf having their greatest range when the moon was furthest from the plane of the Equator. All this despite the relatively small amplitude of Mediterranean basin tides. (The strong currents through the Euripus Strait and the Strait of Messina puzzled Aristotle.) Philostratus discussed tides in Book Five of The Life of Apollonius of Tyana. Philostratus mentions the moon, but attributes tides to "spirits". In Europe around 730 AD, the Venerable Bede described how the rising tide on one coast of the British Isles coincided with the fall on the other and described the time progression of high water along the Northumbrian coast.
The first tide table in China was recorded in 1056 AD primarily for visitors wishing to see the famous tidal bore in the Qiantang River. The first known British tide table is thought to be that of John Wallingford, who died Abbot of St. Albans in 1213, based on high water occurring 48 minutes later each day, and three hours earlier at the Thames mouth than upriver at London.[41]
In 1614 Claude d'Abbeville published the work "Histoire de la mission de pères capucins en l'Isle de Maragnan et terres circonvoisines", where he exposed that the Tupinambá people already had an understanding of the relation between the Moon and the tides before Europe.[42]
William Thomson (Lord Kelvin) led the first systematic harmonic analysis of tidal records starting in 1867. The main result was the building of a tide-predicting machine using a system of pulleys to add together six harmonic time functions. It was "programmed" by resetting gears and chains to adjust phasing and amplitudes. Similar machines were used until the 1960s.[43]
The first known sea-level record of an entire spring–neap cycle was made in 1831 on the Navy Dock in the Thames Estuary. Many large ports had automatic tide gauge stations by 1850.
John Lubbock was one of the first to map co-tidal lines, for Great Britain, Ireland and adjacent coasts, in 1840.[44] William Whewell expanded this work ending with a nearly global chart in 1836.[45] In order to make these maps consistent, he hypothesized the existence of a region with no tidal rise or fall where co-tidal lines meet in the mid-ocean. The existence of such an amphidromic point, as they are now known, was confirmed in 1840 by Captain William Hewett, RN, from careful soundings in the North Sea.[46][47][33]
Much later, in the late 20th century, geologists noticed tidal rhythmites, which document the occurrence of ancient tides in the geological record, notably in the Carboniferous.[48][49]
Physics
[edit]Basic theory of two tides
[edit]The two tidal bulges arise from the difference in the Moon’s gravitational pull across Earth: relative to the force acting on Earth’s centre, the pull on the near-side oceans is slightly stronger, drawing the water toward the Moon to form the first bulge, while the pull on the far-side oceans is slightly weaker, so that region lags behind the solid Earth, producing the second bulge.[50][51] Both the oceans' water and the solid Earth experience these differences in pull, but the rigid Earth resists deformation and keeps its roughly spherical shape, while the fluid redistributes to match the imbalance, forming the bulges.[52]
Forces
[edit]The tidal force produced by a massive object (Moon, hereafter) on a small particle located on or in an extensive body (Earth, hereafter) is the vector difference between the gravitational force exerted by the Moon on the particle, and the gravitational force that would be exerted on the particle if it were located at the Earth's center of mass.
Whereas the gravitational force subjected by a celestial body on Earth varies inversely as the square of its distance to the Earth, the maximal tidal force varies inversely as, approximately, the cube of this distance.[53] If the tidal force caused by each body were instead equal to its full gravitational force (which is not the case due to the free fall of the whole Earth, not only the oceans, towards these bodies) a different pattern of tidal forces would be observed, e.g. with a much stronger influence from the Sun than from the Moon: The solar gravitational force on the Earth is on average 179 times stronger than the lunar, but because the Sun is on average 389 times farther from the Earth, its field gradient is weaker. The overall proportionality is

where M is the mass of the heavenly body, d is its distance, ρ is its average density, and r is its radius. The ratio r/d is related to the angle subtended by the object in the sky. Since the Sun and the Moon have practically the same diameter in the sky, the tidal force of the Sun is less than that of the Moon because its average density is much less, and it is only 46% as large as the lunar,[f] thus during a spring tide, the Moon contributes 69% while the Sun contributes 31%. More precisely, the lunar tidal acceleration (along the Moon–Earth axis, at the Earth's surface) is about 1.1×10⁻⁷ g, while the solar tidal acceleration (along the Sun–Earth axis, at the Earth's surface) is about 0.52×10⁻⁷ g, where g is the gravitational acceleration at the Earth's surface.[g] The effects of the other planets vary as their distances from Earth vary. When Venus is closest to Earth, its effect is 0.000113 times the solar effect.[54] At other times, Jupiter or Mars may have the most effect.

The ocean's surface is approximated by a surface referred to as the geoid, which takes into consideration the gravitational force exerted by the earth as well as centrifugal force due to rotation. Now consider the effect of massive external bodies such as the Moon and Sun. These bodies have strong gravitational fields that diminish with distance and cause the ocean's surface to deviate from the geoid. They establish a new equilibrium ocean surface which bulges toward the moon on one side and away from the moon on the other side. The earth's rotation relative to this shape causes the daily tidal cycle. The ocean surface tends toward this equilibrium shape, which is constantly changing, and never quite attains it. When the ocean surface is not aligned with it, it's as though the surface is sloping, and water accelerates in the down-slope direction.
Equilibrium
[edit]The equilibrium tide is the idealized tide assuming a landless Earth.[55] It would produce a tidal bulge in the ocean, elongated towards the attracting body (Moon or Sun). It is not caused by the vertical pull nearest or farthest from the body, which is very weak; rather, it is caused by the tangential or tractive tidal force, which is strongest at about 45 degrees from the body, resulting in a horizontal tidal current.[h] [i] [j][59]
Laplace's tidal equations
[edit]Ocean depths are much smaller than their horizontal extent. Thus, the response to tidal forcing can be modelled using the Laplace tidal equations which incorporate the following features:
- The vertical (or radial) velocity is negligible, and there is no vertical shear—this is a sheet flow.
- The forcing is only horizontal (tangential).
- The Coriolis effect appears as an inertial force (fictitious) acting laterally to the direction of flow and proportional to velocity.
- The surface height's rate of change is proportional to the negative divergence of velocity multiplied by the depth. As the horizontal velocity stretches or compresses the ocean as a sheet, the volume thins or thickens, respectively.
The boundary conditions dictate no flow across the coastline and free slip at the bottom.
The Coriolis effect (inertial force) steers flows moving towards the Equator to the west and flows moving away from the Equator toward the east, allowing coastally trapped waves. Finally, a dissipation term can be added which is an analog to viscosity.
Amplitude and cycle time
[edit]The theoretical amplitude of oceanic tides caused by the Moon is about 54 centimetres (21 in) at the highest point, which corresponds to the amplitude that would be reached if the ocean possessed a uniform depth, there were no landmasses, and the Earth were rotating in step with the Moon's orbit. The Sun similarly causes tides, of which the theoretical amplitude is about 25 centimetres (9.8 in) (46% of that of the Moon) with a cycle time of 12 hours. At spring tide the two effects add to each other to a theoretical level of 79 centimetres (31 in), while at neap tide the theoretical level is reduced to 29 centimetres (11 in). Since the orbits of the Earth about the Sun, and the Moon about the Earth, are elliptical, tidal amplitudes change somewhat as a result of the varying Earth–Sun and Earth–Moon distances. This causes a variation in the tidal force and theoretical amplitude of about ±18% for the Moon and ±5% for the Sun. If both the Sun and Moon were at their closest positions and aligned at new moon, the theoretical amplitude would reach 93 centimetres (37 in).
Real amplitudes differ considerably, not only because of depth variations and continental obstacles, but also because wave propagation across the ocean has a natural period of the same order of magnitude as the rotation period: if there were no land masses, it would take about 30 hours for a long wavelength surface wave to propagate along the Equator halfway around the Earth (by comparison, the Earth's lithosphere has a natural period of about 57 minutes). Earth tides, which raise and lower the bottom of the ocean, and the tide's own gravitational self attraction are both significant and further complicate the ocean's response to tidal forces.
Dissipation
[edit]Earth's tidal oscillations introduce dissipation at an average rate of about 3.75 terawatts.[60] About 98% of this dissipation is by marine tidal movement.[61] Dissipation arises as basin-scale tidal flows drive smaller-scale flows which experience turbulent dissipation. This tidal drag creates torque on the moon that gradually transfers angular momentum to its orbit, and a gradual increase in Earth–moon separation. The equal and opposite torque on the Earth correspondingly decreases its rotational velocity. Thus, over geologic time, the moon recedes from the Earth, at about 3.8 centimetres (1.5 in)/year, lengthening the terrestrial day.[k]
Day length has increased by about 2 hours in the last 600 million years. Assuming (as a crude approximation) that the deceleration rate has been constant, this would imply that 70 million years ago, day length was on the order of 1% shorter with about 4 more days per year.
Bathymetry
[edit]
The shape of the shoreline and the ocean floor changes the way that tides propagate, so there is no simple, general rule that predicts the time of high water from the Moon's position in the sky. Coastal characteristics such as underwater bathymetry and coastline shape mean that individual location characteristics affect tide forecasting; actual high water time and height may differ from model predictions due to the coastal morphology's effects on tidal flow. However, for a given location the relationship between lunar altitude and the time of high or low tide (the lunitidal interval) is relatively constant and predictable, as is the time of high or low tide relative to other points on the same coast. For example, the high tide at Norfolk, Virginia, U.S., predictably occurs approximately two and a half hours before the Moon passes directly overhead.
Land masses and ocean basins act as barriers against water moving freely around the globe, and their varied shapes and sizes affect the size of tidal frequencies. As a result, tidal patterns vary. For example, in the U.S., the East coast has predominantly semi-diurnal tides, as do Europe's Atlantic coasts, while the West coast predominantly has mixed tides.[63][64][65] Human changes to the landscape can also significantly alter local tides.[66]
Observation and prediction
[edit]Timing
[edit]
The tidal forces due to the Moon and Sun generate very long waves which travel all around the ocean following the paths shown in co-tidal charts. The time when the crest of the wave reaches a port then gives the time of high water at the port. The time taken for the wave to travel around the ocean also means that there is a delay between the phases of the Moon and their effect on the tide. Springs and neaps in the North Sea, for example, are two days behind the new/full moon and first/third quarter moon. This is called the tide's age.[67][68]
The ocean bathymetry greatly influences the tide's exact time and height at a particular coastal point. There are some extreme cases; the Bay of Fundy, on the east coast of Canada, is often stated to have the world's highest tides because of its shape, bathymetry, and its distance from the continental shelf edge.[69] Measurements made in November 1998 at Burntcoat Head in the Bay of Fundy recorded a maximum range of 16.3 metres (53 ft) and a highest predicted extreme of 17 metres (56 ft).[70][71] Similar measurements made in March 2002 at Leaf Basin, Ungava Bay in northern Quebec gave similar values (allowing for measurement errors), a maximum range of 16.2 metres (53 ft) and a highest predicted extreme of 16.8 metres (55 ft).[70][71] Ungava Bay and the Bay of Fundy lie similar distances from the continental shelf edge, but Ungava Bay is only free of pack ice for about four months every year while the Bay of Fundy rarely freezes.
Southampton in the United Kingdom has a double high water caused by the interaction between the M2 and M4 tidal constituents (Shallow water overtides of principal lunar).[72] Portland has double low waters for the same reason. The M4 tide is found all along the south coast of the United Kingdom, but its effect is most noticeable between the Isle of Wight and Portland because the M2 tide is lowest in this region.
Because the oscillation modes of the Mediterranean Sea and the Baltic Sea do not coincide with any significant astronomical forcing period, the largest tides are close to their narrow connections with the Atlantic Ocean. Extremely small tides also occur for the same reason in the Gulf of Mexico and Sea of Japan. Elsewhere, as along the southern coast of Australia, low tides can be due to the presence of a nearby amphidrome.
Analysis
[edit]
Isaac Newton's theory of gravitation first enabled an explanation of why there were generally two tides a day, not one, and offered hope for a detailed understanding of tidal forces and behavior. Although it may seem that tides could be predicted via a sufficiently detailed knowledge of instantaneous astronomical forcings, the actual tide at a given location is determined by astronomical forces accumulated by the body of water over many days. In addition, accurate results would require detailed knowledge of the shape of all the ocean basins—their bathymetry, and coastline shape.
Current procedure for analysing tides follows the method of harmonic analysis introduced in the 1860s by William Thomson. It is based on the principle that the astronomical theories of the motions of Sun and Moon determine a large number of component frequencies, and at each frequency there is a component of force tending to produce tidal motion, but that at each place of interest on the Earth, the tides respond at each frequency with an amplitude and phase peculiar to that locality. At each place of interest, the tide heights are therefore measured for a period of time sufficiently long (usually more than a year in the case of a new port not previously studied) to enable the response at each significant tide-generating frequency to be distinguished by analysis, and to extract the tidal constants for a sufficient number of the strongest known components of the astronomical tidal forces to enable practical tide prediction. The tide heights are expected to follow the tidal force, with a constant amplitude and phase delay for each component. Because astronomical frequencies and phases can be calculated with certainty, the tide height at other times can then be predicted once the response to the harmonic components of the astronomical tide-generating forces has been found.
The main patterns in the tides are
- the twice-daily variation
- the difference between the first and second tide of a day
- the spring–neap cycle
- the annual variation
The Highest Astronomical Tide is the perigean spring tide when both the Sun and Moon are closest to the Earth.
When confronted by a periodically varying function, the standard approach is to employ Fourier series, a form of analysis that uses sinusoidal functions as a basis set, having frequencies that are zero, one, two, three, etc. times the frequency of a particular fundamental cycle. These multiples are called harmonics of the fundamental frequency, and the process is termed harmonic analysis. If the basis set of sinusoidal functions suit the behaviour being modelled, relatively few harmonic terms need to be added. Orbital paths are very nearly circular, so sinusoidal variations are suitable for tides.
For the analysis of tide heights, the Fourier series approach has in practice to be made more elaborate than the use of a single frequency and its harmonics. The tidal patterns are decomposed into many sinusoids having many fundamental frequencies, corresponding (as in the lunar theory) to many different combinations of the motions of the Earth, the Moon, and the angles that define the shape and location of their orbits.
For tides, then, harmonic analysis is not limited to harmonics of a single frequency.[l] In other words, the harmonies are multiples of many fundamental frequencies, not just of the fundamental frequency of the simpler Fourier series approach. Their representation as a Fourier series having only one fundamental frequency and its (integer) multiples would require many terms, and would be severely limited in the time-range for which it would be valid.
The study of tide height by harmonic analysis was begun by Laplace, William Thomson (Lord Kelvin), and George Darwin. A.T. Doodson extended their work, introducing the Doodson Number notation to organise the hundreds of resulting terms. This approach has been the international standard ever since, and the complications arise as follows: the tide-raising force is notionally given by sums of several terms. Each term is of the form

where
- Ao is the amplitude,
- ω is the angular frequency, usually given in degrees per hour, corresponding to t measured in hours,
- p is the phase offset with regard to the astronomical state at time t = 0.
There is one term for the Moon and a second term for the Sun. The phase p of the first harmonic for the Moon term is called the lunitidal interval or high water interval.
The next refinement is to accommodate the harmonic terms due to the elliptical shape of the orbits. To do so, the value of the amplitude is taken to be not a constant, but varying with time, about the average amplitude Ao. To do so, replace Ao in the above equation with A(t) where A is another sinusoid, similar to the cycles and epicycles of Ptolemaic theory. This gives

which is to say an average value Ao with a sinusoidal variation about it of magnitude Aa, with frequency ωa and phase pa. Substituting this for Ao in the original equation gives a product of two cosine factors:

Given that for any x and y

it is clear that a compound term involving the product of two cosine terms each with their own frequency is the same as three simple cosine terms that are to be added at the original frequency and also at frequencies which are the sum and difference of the two frequencies of the product term. (Three, not two terms, since the whole expression is .) Consider further that the tidal force on a location depends also on whether the Moon (or the Sun) is above or below the plane of the Equator, and that these attributes have their own periods also incommensurable with a day and a month, and it is clear that many combinations result. With a careful choice of the basic astronomical frequencies, the Doodson Number annotates the particular additions and differences to form the frequency of each simple cosine term.


Remember that astronomical tides do not include weather effects. Also, changes to local conditions (sandbank movement, dredging harbour mouths, etc.) away from those prevailing at the measurement time affect the tide's actual timing and magnitude. Organisations quoting a "highest astronomical tide" for some location may exaggerate the figure as a safety factor against analytical uncertainties, distance from the nearest measurement point, changes since the last observation time, ground subsidence, etc., to avert liability should an engineering work be overtopped. Special care is needed when assessing the size of a "weather surge" by subtracting the astronomical tide from the observed tide.
Careful Fourier data analysis over a nineteen-year period (the National Tidal Datum Epoch in the U.S.) uses frequencies called the tidal harmonic constituents. Nineteen years is preferred because the Earth, Moon and Sun's relative positions repeat almost exactly in the Metonic cycle of 19 years, which is long enough to include the 18.613 year lunar nodal tidal constituent. This analysis can be done using only the knowledge of the forcing period, but without detailed understanding of the mathematical derivation, which means that useful tidal tables have been constructed for centuries.[73] The resulting amplitudes and phases can then be used to predict the expected tides. These are usually dominated by the constituents near 12 hours (the semi-diurnal constituents), but there are major constituents near 24 hours (diurnal) as well. Longer term constituents are 14 day or fortnightly, monthly, and semiannual. Semi-diurnal tides dominated coastline, but some areas such as the South China Sea and the Gulf of Mexico are primarily diurnal. In the semi-diurnal areas, the primary constituents M2 (lunar) and S2 (solar) periods differ slightly, so that the relative phases, and thus the amplitude of the combined tide, change fortnightly (14 day period).[74]
In the M2 plot above, each cotidal line differs by one hour from its neighbors, and the thicker lines show tides in phase with equilibrium at Greenwich. The lines rotate around the amphidromic points counterclockwise in the northern hemisphere so that from Baja California Peninsula to Alaska and from France to Ireland the M2 tide propagates northward. In the southern hemisphere this direction is clockwise. On the other hand, M2 tide propagates counterclockwise around New Zealand, but this is because the islands act as a dam and permit the tides to have different heights on the islands' opposite sides. (The tides do propagate northward on the east side and southward on the west coast, as predicted by theory.)
The exception is at Cook Strait where the tidal currents periodically link high to low water. This is because cotidal lines 180° around the amphidromes are in opposite phase, for example high water across from low water at each end of Cook Strait. Each tidal constituent has a different pattern of amplitudes, phases, and amphidromic points, so the M2 patterns cannot be used for other tide components.
Example calculation
[edit]


Because the Moon is moving in its orbit around the Earth and in the same sense as the Earth's rotation, a point on the Earth must rotate slightly further to catch up so that the time between semi-diurnal tides is not twelve but 12.4206 hours—a bit over twenty-five minutes extra. The two peaks are not equal. The two high tides a day alternate in maximum heights: lower high (just under three feet), higher high (just over three feet), and again lower high. Likewise for the low tides.
When the Earth, Moon, and Sun are in line (Sun–Earth–Moon, or Sun–Moon–Earth) the two main influences combine to produce spring tides; when the two forces are opposing each other as when the angle Moon–Earth–Sun is close to ninety degrees, neap tides result. As the Moon moves around its orbit it changes from north of the Equator to south of the Equator. The alternation in high tide heights becomes smaller, until they are the same (at the lunar equinox, the Moon is above the Equator), then redevelop but with the other polarity, waxing to a maximum difference and then waning again.
Current
[edit]The tides' influence on current or flow is much more difficult to analyze, and data is much more difficult to collect. A tidal height is a scalar quantity and varies smoothly over a wide region. A flow is a vector quantity, with magnitude and direction, both of which can vary substantially with depth and over short distances due to local bathymetry. Also, although a water channel's center is the most useful measuring site, mariners object when current-measuring equipment obstructs waterways. A flow proceeding up a curved channel may have similar magnitude, even though its direction varies continuously along the channel. Surprisingly, flood and ebb flows are often not in opposite directions. Flow direction is determined by the upstream channel's shape, not the downstream channel's shape. Likewise, eddies may form in only one flow direction.
Nevertheless, tidal current analysis is similar to tidal heights analysis: in the simple case, at a given location the flood flow is in mostly one direction, and the ebb flow in another direction. Flood velocities are given positive sign, and ebb velocities negative sign. Analysis proceeds as though these are tide heights.
In more complex situations, the main ebb and flood flows do not dominate. Instead, the flow direction and magnitude trace an ellipse over a tidal cycle (on a polar plot) instead of along the ebb and flood lines. In this case, analysis might proceed along pairs of directions, with the primary and secondary directions at right angles. An alternative is to treat the tidal flows as complex numbers, as each value has both a magnitude and a direction.
Tide flow information is most commonly seen on nautical charts, presented as a table of flow speeds and bearings at hourly intervals, with separate tables for spring and neap tides. The timing is relative to high water at some harbour where the tidal behaviour is similar in pattern, though it may be far away.
As with tide height predictions, tide flow predictions based only on astronomical factors do not incorporate weather conditions, which can completely change the outcome.
The tidal flow through Cook Strait between the two main islands of New Zealand is particularly interesting, as the tides on each side of the strait are almost exactly out of phase, so that one side's high water is simultaneous with the other's low water. Strong currents result, with almost zero tidal height change in the strait's center. Yet, although the tidal surge normally flows in one direction for six hours and in the reverse direction for six hours, a particular surge might last eight or ten hours with the reverse surge enfeebled. In especially boisterous weather conditions, the reverse surge might be entirely overcome so that the flow continues in the same direction through three or more surge periods.
A further complication for Cook Strait's flow pattern is that the tide at the south side (e.g. at Nelson) follows the common bi-weekly spring–neap tide cycle (as found along the west side of the country), but the north side's tidal pattern has only one cycle per month, as on the east side: Wellington, and Napier.
The graph of Cook Strait's tides shows separately the high water and low water height and time, through November 2007; these are not measured values but instead are calculated from tidal parameters derived from years-old measurements. Cook Strait's nautical chart offers tidal current information. For instance the January 1979 edition for 41°13.9′S 174°29.6′E / 41.2317°S 174.4933°E (northwest of Cape Terawhiti) refers timings to Westport while the January 2004 issue refers to Wellington. Near Cape Terawhiti in the middle of Cook Strait the tidal height variation is almost nil while the tidal current reaches its maximum, especially near the notorious Karori Rip. Aside from weather effects, the actual currents through Cook Strait are influenced by the tidal height differences between the two ends of the strait and as can be seen, only one of the two spring tides at the north west end of the strait near Nelson has a counterpart spring tide at the south east end (Wellington), so the resulting behaviour follows neither reference harbour.[citation needed]
Power generation
[edit]Tidal energy can be extracted by two means: inserting a water turbine into a tidal current, or building ponds that release/admit water through a turbine. In the first case, the energy amount is entirely determined by the timing and tidal current magnitude. However, the best currents may be unavailable because the turbines would obstruct ships. In the second, the impoundment dams are expensive to construct, natural water cycles are completely disrupted, ship navigation is disrupted. However, with multiple ponds, power can be generated at chosen times. So far, there are few installed systems for tidal power generation (most famously, La Rance at Saint Malo, France) which face many difficulties. Aside from environmental issues, simply withstanding corrosion and biological fouling pose engineering challenges.
Tidal power proponents point out that, unlike wind power systems, generation levels can be reliably predicted, save for weather effects. While some generation is possible for most of the tidal cycle, in practice turbines lose efficiency at lower operating rates. Since the power available from a flow is proportional to the cube of the flow speed, the times during which high power generation is possible are brief.
Navigation
[edit]
Tidal flows are important for navigation, and significant errors in position occur if they are not accommodated. Tidal heights are also important; for example many rivers and harbours have a shallow "bar" at the entrance which prevents boats with significant draft from entering at low tide.
Until the advent of automated navigation, competence in calculating tidal effects was important to naval officers. The certificate of examination for lieutenants in the Royal Navy once declared that the prospective officer was able to "shift his tides".[75]
Tidal flow timings and velocities appear in tide charts or a tidal stream atlas. Tide charts come in sets. Each chart covers a single hour between one high water and another (they ignore the leftover 24 minutes) and show the average tidal flow for that hour. An arrow on the tidal chart indicates the direction and the average flow speed (usually in knots) for spring and neap tides. If a tide chart is not available, most nautical charts have "tidal diamonds" which relate specific points on the chart to a table giving tidal flow direction and speed.
The standard procedure to counteract tidal effects on navigation is to (1) calculate a "dead reckoning" position (or DR) from travel distance and direction, (2) mark the chart (with a vertical cross like a plus sign) and (3) draw a line from the DR in the tide's direction. The distance the tide moves the boat along this line is computed by the tidal speed, and this gives an "estimated position" or EP (traditionally marked with a dot in a triangle).

Nautical charts display the water's "charted depth" at specific locations with "soundings" and the use of bathymetric contour lines to depict the submerged surface's shape. These depths are relative to a "chart datum", which is typically the water level at the lowest possible astronomical tide (although other datums are commonly used, especially historically, and tides may be lower or higher for meteorological reasons) and are therefore the minimum possible water depth during the tidal cycle. "Drying heights" may also be shown on the chart, which are the heights of the exposed seabed at the lowest astronomical tide.
Tide tables list each day's high and low water heights and times. To calculate the actual water depth, add the charted depth to the published tide height. Depth for other times can be derived from tidal curves published for major ports. The rule of twelfths can suffice if an accurate curve is not available. This approximation presumes that the increase in depth in the six hours between low and high water is: first hour — 1/12, second — 2/12, third — 3/12, fourth — 3/12, fifth — 2/12, sixth — 1/12.
Biological aspects
[edit]Intertidal ecology
[edit]
Intertidal ecology is the study of ecosystems between the low- and high-water lines along a shore. At low water, the intertidal zone is exposed (or emersed), whereas at high water, it is underwater (or immersed). Intertidal ecologists therefore study the interactions between intertidal organisms and their environment, as well as among the different species. The most important interactions may vary according to the type of intertidal community. The broadest classifications are based on substrates — rocky shore or soft bottom.
Intertidal organisms experience a highly variable and often hostile environment, and have adapted to cope with and even exploit these conditions. One easily visible feature is vertical zonation, in which the community divides into distinct horizontal bands of specific species at each elevation above low water. A species' ability to cope with desiccation determines its upper limit, while competition with other species sets its lower limit.
Humans use intertidal regions for food and recreation. Overexploitation can damage intertidals directly. Other anthropogenic actions such as introducing invasive species and climate change have large negative effects. Marine Protected Areas are one option communities can apply to protect these areas and aid scientific research.
Biological rhythms
[edit]The approximately 12-hour and fortnightly tidal cycle has large effects on intertidal[76] and marine organisms.[77] Hence their biological rhythms tend to occur in rough multiples of these periods.[78] Many other animals such as the vertebrates, display similar circatidal rhythms.[79] Examples include gestation and egg hatching. In humans, the menstrual cycle lasts roughly a lunar month, an even multiple of the tidal period. Such parallels at least hint at the common descent of all animals from a marine ancestor.[80]
Other tides
[edit]When oscillating tidal currents in the stratified ocean flow over uneven bottom topography, they generate internal waves with tidal frequencies. Such waves are called internal tides.
Shallow areas in otherwise open water can experience rotary tidal currents, flowing in directions that continually change and thus the flow direction (not the flow) completes a full rotation in 12+1⁄2 hours (for example, the Nantucket Shoals).[81]
In addition to oceanic tides, large lakes can experience small tides and even planets can experience atmospheric tides and Earth tides. These are continuum mechanical phenomena. The first two take place in fluids. The third affects the Earth's thin solid crust surrounding its semi-liquid interior (with various modifications).
Lake tides
[edit]Large lakes such as Superior and Erie can experience tides of 1 to 4 cm (0.39 to 1.6 in), but these can be masked by meteorologically induced phenomena such as seiche.[82] The tide in Lake Michigan is described as 1.3 to 3.8 cm (0.5 to 1.5 in)[83] or 4.4 cm (1+3⁄4 in).[84] This is so small that other larger effects completely mask any tide, and as such these lakes are considered non-tidal.[85]
Atmospheric tides
[edit]Atmospheric tides are negligible at ground level and aviation altitudes, masked by weather's much more important effects. Atmospheric tides are both gravitational and thermal in origin and are the dominant dynamics from about 80 to 120 kilometres (50 to 75 mi), above which the molecular density becomes too low to support fluid behavior.
Earth tides
[edit]Earth tides or terrestrial tides affect the entire Earth's mass, which acts similarly to a liquid gyroscope with a very thin crust. The Earth's crust shifts (in/out, east/west, north/south) in response to lunar and solar gravitation, ocean tides, and atmospheric loading. While negligible for most human activities, terrestrial tides' semi-diurnal amplitude can reach about 55 centimetres (22 in) at the Equator—15 centimetres (5.9 in) due to the Sun—which is important in GPS calibration and VLBI measurements. Precise astronomical angular measurements require knowledge of the Earth's rotation rate and polar motion, both of which are influenced by Earth tides. The semi-diurnal M2 Earth tides are nearly in phase with the Moon with a lag of about two hours.[citation needed]
Galactic tides
[edit]Galactic tides are the tidal forces exerted by galaxies on stars within them and satellite galaxies orbiting them. The galactic tide's effects on the Solar System's Oort cloud are believed to cause 90 percent of long-period comets.[86]
Misnomers
[edit]Tsunamis, the large waves that occur after earthquakes, are sometimes called tidal waves, but this name is given by their resemblance to the tide, rather than any causal link to the tide. Other phenomena unrelated to tides but using the word tide are rip tide, storm tide, hurricane tide, and black or red tides. Many of these usages are historic and refer to the earlier meaning of tide as "a portion of time, a season" and "a stream, current or flood".[87]
See also
[edit]- Aquaculture – Farming of aquatic organisms
- Clairaut's theorem – Theorem about gravity
- Coastal erosion – Displacement of land along the coastline
- Establishment of a port – Measurement in astronomy
- Head of tide, also known as tidal reach, or tidal limit – Furthest point upstream where a river is affected by tidal fluctuations
- Hough function – Eigenfunctions of Laplace's tidal equations which govern fluid motion on a rotating sphere
- King tide – Especially high spring tide
- Lunar Laser Ranging experiment – Measuring the distance between the Earth and the Moon with laser light
- Lunar phase – Shape of the Moon's sunlit portion as viewed from Earth
- Raised beach, also known as Marine terrace – Emergent coastal landform
- Mean high water spring – Level of water from which depths displayed on a nautical chart are measured
- Mean low water spring – Level of water from which depths displayed on a nautical chart are measured
- Orbit of the Moon – The Moon's circuit around Earth
- Primitive equations – Equations to approximate global atmospheric flow
- Tidal barrage – Dam-like structure
- Tidal island – Island accessible by foot at low tide
- Tidal locking – Situation in which an astronomical object's orbital period matches its rotational period
- Tidal prism – Volume of water in an estuary or inlet between mean high tide and mean low tide
- Tidal resonance – Enhanced tide due to ocean resonance
- Tidal river – River where flow and level are influenced by tides
- Tidal stream generator – Type of tidal power generation technology
- Tidal triggering of earthquakes – Idea that tidal forces may induce seismicity
- Tide pool – Rocky pool on a seashore, separated from the sea at low tide, filled with seawater
- Tideline – Where two ocean currents converge
- Tides in marginal seas – Dynamics of tidal wave deformation in the shallow waters of the marginal seas
Notes
[edit]- ^ Coastal orientation and geometry affects the phase, direction, and amplitude of amphidromic systems, coastal Kelvin waves as well as resonant seiches in bays. In estuaries, seasonal river outflows influence tidal flow.
- ^ Tide tables usually list mean lower low water (mllw, the 19 year average of mean lower low waters), mean higher low water (mhlw), mean lower high water (mlhw), mean higher high water (mhhw), as well as perigean tides. These are mean values in the sense that they derive from mean data.[6]
- ^ "The moon, too, as the heavenly body nearest the earth, bestows her effluence most abundantly upon mundane things, for most of them, animate or inanimate, are sympathetic to her and change in company with her; the rivers increase and diminish their streams with her light, the seas turn their own tides with her rising and setting, ... "[19]
- ^ "Orbis virtutis tractoriæ, quæ est in Luna, porrigitur utque ad Terras, & prolectat aquas sub Zonam Torridam, ... Celeriter vero Luna verticem transvolante, cum aquæ tam celeriter sequi non possint, fluxus quidem fit Oceani sub Torrida in Occidentem, ... " (The sphere of the lifting power, which is [centered] in the moon, is extended as far as to the earth and attracts the waters under the torrid zone, ... However the moon flies swiftly across the zenith; because the waters cannot follow so quickly, the tide of the ocean under the torrid [zone] is indeed made to the west, ..."[27]
- ^ See for example, in the 'Principia' (Book 1) (1729 translation), Corollaries 19 and 20 to Proposition 66, on pages 251–254, referring back to page 234 et seq.; and in Book 3 Propositions 24, 36 and 37, starting on page 255.
- ^ According to NASA the lunar tidal force is 2.21 times larger than the solar.
- ^ See Tidal force – Mathematical treatment and sources cited there.
- ^ "The ocean does not produce tides as a direct response to the vertical forces at the bulges. The tidal force is only about 1 ten millionth the size of the gravitational force owing to the Earth's gravity. It is the horizontal component of the tidal force that produces the tidal bulge, causing fluid to converge at the sublunar and antipodal points and move away from the poles, causing a contraction there." (...) "The projection of the tidal force onto the horizontal direction is called the tractive force (see Knauss, Fig. 10.11). This force causes an acceleration of water towards the sublunar and antipodal points, building up water until the pressure gradient force from the bulging sea surface exactly balances the tractive force field."[56]
- ^ "While the solar and lunar envelopes are thought of as representing the actual ocean waters, another very important factor must be recognized. The components of the tide-generating forces acting tangentially along the water surface turn out to be the most important. Just as it is easier to slide a bucket of water across a floor rather than to lift it, the horizontal tractive components move the waters toward the points directly beneath and away from the sun or moon far more effectively than the vertical components can lift them. These tractive forces are most responsible for trying to form the ocean into the symmetrical egg-shaped distensions (the tide potential, the equilibrium tide). They reach their maximums in rings 45° from the points directly beneath and away from the sun or moon."[57]
- ^ "... the gravitational effect that causes the tides is much too weak to lift the oceans 12 inches vertically away from the earth. It is possible, however, to move the oceans horizontally within the earth's gravitational field. This gathers the oceans toward two points where the height of the water becomes elevated by the converging volume of water."[58]
- ^ The day is currently lengthening at a rate of about 0.002 seconds per century.[62]
- ^ To demonstrate this Tides Home Page offers a tidal height pattern converted into an .mp3 sound file, and the rich sound is quite different from a pure tone.
References
[edit]- ^ Reddy, M.P.M. & Affholder, M. (2002). Descriptive physical oceanography: State of the Art. Taylor & Francis. p. 249. ISBN 90-5410-706-5. OCLC 223133263. Archived from the original on 2023-09-16. Retrieved 2022-01-05 – via Google Books.
- ^ Hubbard, Richard (1893). Boater's Bowditch: The Small Craft American Practical Navigator. McGraw-Hill Professional. p. 54. ISBN 0-07-136136-7. OCLC 44059064. Archived from the original on 2023-09-16. Retrieved 2022-01-05 – via Google Books.
{{cite book}}: ISBN / Date incompatibility (help) - ^ "Tidal lunar day". NOAA. Archived from the original on 2018-08-17. Retrieved 2007-04-07. Do not confuse with the astronomical lunar day on the Moon. A lunar zenith is the Moon's highest point in the sky.
- ^ Mukherjee, Swapna; Ghosh, Kaushik Kiran; Chanda, Abhra (2023). Environmental Oceanography and Coastal Dynamics. Cham: Springer International Publishing. pp. 1–25. doi:10.1007/978-3-031-34422-0_1. ISBN 978-3-031-34421-3.
- ^ Mellor, George L. (1996). Introduction to physical oceanography. Springer. p. 169. ISBN 1-56396-210-1.
- ^ "Glossary of Coastal Terminology: H–M". Washington Department of Ecology, State of Washington. Archived from the original on 21 November 2017. Retrieved 5 April 2007.
- ^ "Definitions of tidal terms". Land Information New Zealand. Archived from the original on 30 August 2014. Retrieved 20 February 2017.
- ^ Swerdlow, Noel M.; Neugebauer, Otto (1984). Mathematical astronomy in Copernicus's De revolutionibus. Vol. 1. Springer-Verlag. p. 76. ISBN 0-387-90939-7. Archived from the original on 2023-09-16. Retrieved 2020-11-22 – via Google Books.
- ^ a b Harris, D.L. (1981). Tides and Tidal Datums in the United States. Special report (Coastal Engineering Research Center (U.S.))). United States Army Corps of Engineers, Coastal Engineering Research Center. p. 32. Archived from the original on 2023-09-16. Retrieved 2021-08-24 – via Google Books.
- ^ "neap²". Oxford English Dictionary (2nd ed.). Oxford University Press. 1989. Old English (example given from AD 469: forðganges nip – without the power of advancing). The Danish niptid is probably from the English. The English term neap-flood (from which neap tide comes) seems to have been in common use by AD 725.
- ^ "Ocean Tides and Magnetic Fields". NASA Visualization Studio. NASA. 30 December 2016. Archived from the original on 27 November 2020. Retrieved 20 November 2020.
- ^ "Types and causes of tidal cycles". U.S. National Oceanic and Atmospheric Administration (NOAA) National Ocean Service (Education section). Archived from the original on February 1, 2012.
- ^ "What is a perigean spring tide?". National Oceanic and Atmospheric Administration. 26 February 2021. Archived from the original on 30 July 2021. Retrieved 16 July 2021.
- ^ Le Provost, Christian (1991). "Generation of Overtides and compound tides (review)". In Parker, Bruce B. (ed.). Tidal Hydrodynamics. John Wiley & Sons. ISBN 978-0-471-51498-5.
- ^ Accad, Y. & Pekeris, C.L. (November 28, 1978). "Solution of the Tidal Equations for the M2 and S2 Tides in the World Oceans from a Knowledge of the Tidal Potential Alone". Philosophical Transactions of the Royal Society of London A. 290 (1368): 235–266. Bibcode:1978RSPTA.290..235A. doi:10.1098/rsta.1978.0083. S2CID 119526571.
- ^ "Tide forecasts". New Zealand: National Institute of Water & Atmospheric Research. Archived from the original on 2008-10-14. Retrieved 2008-11-07. Including animations of the M2, S2 and K1 tides for New Zealand.
- ^ Marchuk, Guri I.; Kagan, B. A. (6 December 2012). Dynamics of Ocean Tides. Springer. ISBN 9789400925717. Archived from the original on 16 September 2023. Retrieved 22 November 2020 – via Google Books.
- ^ Schureman, Paul (1971). Manual of harmonic analysis and prediction of tides. U.S. Coast and geodetic survey. p. 204. Archived from the original on 2017-08-08. Retrieved 2018-01-14.
- ^ Ptolemy (1940). "2". Tetrabiblos. Vol. 1. Translated by Robbins, Frank E. Cambridge, Massachusetts: Harvard University Press.
- ^ Bede (1999). The Reckoning of Time. Translated by Wallis, Faith. Liverpool University Press. p. 82. ISBN 0-85323-693-3. Archived from the original on 9 April 2023. Retrieved 1 June 2018 – via Google Books.
- ^ Bede 1999, p. 83.
- ^ a b Bede 1999, p. 84.
- ^ a b Bede 1999, p. 85.
- ^ a b c d Tolmacheva, Marina (2014). Glick, Thomas F. (ed.). Medieval Science, Technology, and Medicine: An Encyclopedia: Geography, Chorography. Routledge. p. 188. ISBN 978-1135459321.
- ^ "Simon Stevin" (PDF) (pdf) (in Dutch). Flanders Marine Institute. Archived (PDF) from the original on 2014-08-05. Retrieved 2014-06-01.
- ^ Palmerino, Carla Rita; Thijssen, J.M.M.H. (31 August 2004). The Reception of the Galilean Science of Motion in Seventeenth-Century Europe. Springer Science+Business Media. p. 200. ISBN 978-1-4020-2455-9. Archived from the original on 12 April 2022. Retrieved 29 November 2022 – via Google Books.
- ^ Johannes Kepler, Astronomia nova ... (1609), p. 5 of the Introductio in hoc opus (Introduction to this work). From page 5:
- ^ a b Lisitzin, E. (1974). "2 "Periodical sea-level changes: Astronomical tides"". Sea-Level Changes, (Elsevier Oceanography Series). Vol. 8. p. 5.
- ^ "What Causes Tides?". U.S. National Oceanic and Atmospheric Administration (NOAA) National Ocean Service (Education section). Archived from the original on 2016-08-20. Retrieved 2009-09-06.
- ^ Wahr, J. (1995). Earth Tides in "Global Earth Physics", American Geophysical Union Reference Shelf #1. pp. 40–46.
- ^ Euler, Leonhard; Aiton, Eric J. (1996). Commentationes mechanicae et astronomicae ad physicam pertinentes. Springer Science+Business Media. pp. 19–. ISBN 978-3-7643-1459-0 – via Google Books.
- ^ Thomson, Thomas, ed. (March 1819). "On Capt. Cook's Account of the Tides". Annals of Philosophy. XIII. London: Baldwin, Cradock and Joy: 204. Archived from the original on 26 August 2016. Retrieved 25 July 2015.
- ^ a b Zuosheng, Y.; Emery, K.O. & Yui, X. (July 1989). "Historical Development and Use of Thousand-Year-Old Tide-Prediction Tables". Limnology and Oceanography. 34 (5): 953–957. Bibcode:1989LimOc..34..953Z. doi:10.4319/lo.1989.34.5.0953.
- ^ Cartwright, David E. (1999). Tides: A Scientific History. Cambridge, UK: Cambridge University Press. ISBN 9780521621458.
- ^ Case, James (March 2000). "Understanding Tides – From Ancient Beliefs to Present-day Solutions to the Laplace Equations". SIAM News. 33 (2).
- ^ Doodson, A.T. (December 1921). "The Harmonic Development of the Tide-Generating Potential". Proceedings of the Royal Society of London A. 100 (704): 305–329. Bibcode:1921RSPSA.100..305D. doi:10.1098/rspa.1921.0088.
- ^ Casotto, S. & Biscani, F. (April 2004). "A fully analytical approach to the harmonic development of the tide-generating potential accounting for precession, nutation, and perturbations due to figure and planetary terms". AAS Division on Dynamical Astronomy. 36 (2): 67. Bibcode:2004DDA....35.0805C.
- ^ Moyer, T.D. (2003). Formulation for observed and computed values of Deep Space Network data types for navigation (PDF). Deep-space communications and navigation. Vol. 3. Wiley. pp. 126–128. ISBN 0-471-44535-5. Archived from the original (PDF) on 2004-10-16.
- ^ Flussi e riflussi [Ebbs and flows] (in Italian). Milano: Feltrinelli. 2003. ISBN 88-07-10349-4.
- ^ van der Waerden, B.L. (1987). "The Heliocentric System in Greek, Persian and Hindu Astronomy". Annals of the New York Academy of Sciences. 500 (1): 525–545 [527]. Bibcode:1987NYASA.500..525V. doi:10.1111/j.1749-6632.1987.tb37224.x. S2CID 222087224.
- ^ Cartwright, D.E. (1999). "Tides, A Scientific History". Eos Transactions. 80 (36): 11, 18. Bibcode:1999EOSTr..80..408A. doi:10.1029/99EO00304.
- ^ "Astronomia indígena prevê influência da lua sobre as marés antes de Galileu e Newton" [Indigenous astronomy predicts moon's influence on tides before Galileo and Newton] (in Brazilian Portuguese). 2009-06-19. Retrieved 2021-12-11.
- ^ "The Doodson–Légé Tide Predicting Machine". Proudman Oceanographic Laboratory. Archived from the original on 2009-03-20. Retrieved 2008-10-03.
- ^ Lubbock, J.W. (1831). "On the tides on the coast of Great Britain". The Philosophical Magazine. 9 (53): 333–335. doi:10.1080/14786443108647618.
- ^ Whewell, William (1836). "Researches on the tides, sixth series. On the results of an extensive system of tide observations made on the coasts of Europe and America in June 1835". Philosophical Transactions of the Royal Society of London. 126: 289–341. Bibcode:1836RSPT..126..289W.
- ^ Hewett, William (1841). "Tide observations in the North Sea". The Nautical Magazine: 180–183.
- ^ Cartwright, David Edgar (17 August 2000). Tides: A Scientific History. Cambridge University Press. ISBN 978-0-521-79746-7. OCLC 1001932580.
- ^ Kuecher, Gerald J.; Woodland, Bertram G.; Broadhurst, Frederick M. (1 September 1990). "Evidence of deposition from individual tides and of tidal cycles from the Francis Creek Shale (host rock to the Mazon Creek Biota), Westphalian D (Pennsylvanian), northeastern Illinois". Sedimentary Geology. 68 (3): 211–221. Bibcode:1990SedG...68..211K. doi:10.1016/0037-0738(90)90113-8. ISSN 0037-0738.
- ^ Archer, Allen W; Kuecher, Gerald J; Kvale, Erik P (1995). "The Role of Tidal-Velocity Asymmetries in the Deposition of Silty Tidal Rhythmites (Carboniferous, Eastern Interior Coal Basin, U.S.A.)". SEPM Journal of Sedimentary Research. 65: 408–416. doi:10.1306/d42680d6-2b26-11d7-8648000102c1865d.
- ^ Richard, Feynman. "The Feynman Lectures on Physics Vol. I Ch. 7: The Theory of Gravitation". www.feynmanlectures.caltech.edu. Retrieved 2025-06-30.
- ^ Feynman, Richard (October 24, 2020). "Feynman's Lectures on Physics – The Law of Gravitation". YouTube. Retrieved 5 December 2024.
- ^ Melchior, Paul (1983). The tides of the planet Earth. Oxford.
- ^ Young, C. A. (1889). A Textbook of General Astronomy (PDF). p. 288. Archived (PDF) from the original on 2019-10-05. Retrieved 2018-08-13.
- ^ "Interplanetary Low Tide". Science Mission Directorate. 2000-05-03. Archived from the original on 2023-06-04. Retrieved 2023-06-25.
- ^ "Equilibrium tide". AMS Glossary. 2020-09-02. Archived from the original on 2020-08-01. Retrieved 2020-09-02.
- ^ Thompson, LuAnne (2006). "Physical Processes in the Ocean" (PDF). Archived (PDF) from the original on 2020-09-28. Retrieved 2020-06-27.
- ^ Hicks, S.D. (2006). Understanding Tides (PDF) (Report). NOAA. Archived (PDF) from the original on 2022-01-20. Retrieved 2020-09-02.
- ^ Mccully, James Greig (2006). Beyond The Moon: A Conversational, Common Sense Guide To Understanding The Tides, World Scientific. World Scientific. ISBN 9789814338189. Archived from the original on 2023-09-16. Retrieved 2022-01-05 – via Google Books.
- ^ "What Physics Teachers Get Wrong about Tides! - PBS Space Time". PBS LearningMedia. 2020-06-17. Archived from the original on 2020-10-21. Retrieved 2020-06-27.
- ^ Munk, W.; Wunsch, C. (1998). "Abyssal recipes II: energetics of tidal and wind mixing". Deep-Sea Research Part I. 45 (12): 1977. Bibcode:1998DSRI...45.1977M. doi:10.1016/S0967-0637(98)00070-3.
- ^ Ray, R.D.; Eanes, R.J.; Chao, B.F. (1996). "Detection of tidal dissipation in the solid Earth by satellite tracking and altimetry". Nature. 381 (6583): 595. Bibcode:1996Natur.381..595R. doi:10.1038/381595a0. S2CID 4367240.
- ^ Lecture 2: The Role of Tidal Dissipation and the Laplace Tidal Equations by Myrl Hendershott. GFD Proceedings Volume, 2004, WHOI Notes by Yaron Toledo and Marshall Ward.
- ^ "map showing world distribution of tide patterns, semi-diurnal, diurnal and mixed semi-diurnal". U.S. National Oceanic and Atmospheric Administration (NOAA) National Ocean Service (Education section). Archived from the original on 2018-08-27. Retrieved 2009-09-05.
- ^ Thurman, H.V. (1994). Introductory Oceanography (7th ed.). New York: Macmillan Publishers. pp. 252–276.ref
- ^ Ross, D.A. (1995). Introduction to Oceanography. New York: HarperCollins. pp. 236–242.
- ^ Witze, Alexandra (5 July 2020). "How humans are altering the tides of the oceans". BBC Future. BBC. Archived from the original on 6 July 2020. Retrieved 8 July 2020.
- ^ "Glossary of Meteorology". American Meteorological Society. Archived from the original on 2021-05-08. Retrieved 2021-04-02.
- ^ Webster, Thomas (1837). The elements of physics. Printed for Scott, Webster, and Geary. p. 168.
- ^ "FAQ". Archived from the original on February 12, 2012. Retrieved June 23, 2007.
- ^ a b O'Reilly, C.T.R.; Solvason, Ron & Solomon, Christian (2005). Ryan, J. (ed.). "Where are the World's Largest Tides". BIO Annual Report "2004 in Review". Washington, D.C.: Biotechnol. Ind. Org.: 44–46.
- ^ a b O'reilly, Charles T.; Solvason, Ron; Solomon, Christian (2005). "Resolving the World's largest tides" (PDF). In Percy, J.A; Evans, A.J.; Wells, P.G.; Rolston, S.J. (eds.). The Changing Bay of Fundy-Beyond 400 years, Proceedings of the 6th Bay of Fundy Workshop, Cornwallis, Nova Scotia, Sept. 29, 2004 to October 2, 2004. Environment Canada-Atlantic Region, Occasional Report no. 23. Dartmouth, N.S. and Sackville, N.B. Archived (PDF) from the original on August 27, 2016. Retrieved April 1, 2013.
- ^ Pingree, R.D.; Maddock, L. (1978). "The M4 tide in the English Channel derived from a non-linear numerical model of the M2 tide". Deep-Sea Research. 25: 53–63.
- ^ Center for Operational Oceanographic Products and Services, National Ocean Service, National Oceanic and Atmospheric Administration (January 2000). "Tide and Current Glossary" (PDF). Silver Spring, MD. Archived (PDF) from the original on 2007-01-28. Retrieved 2007-04-05.
{{cite web}}: CS1 maint: multiple names: authors list (link) - ^ "Harmonic Constituents". NOAA. Archived from the original on 2007-03-17. Retrieved 2007-04-05.
- ^ Society for Nautical Research (1958). The Mariner's Mirror. Archived from the original on 2023-09-16. Retrieved 2009-04-28 – via Google Books.
- ^ Bos, A.R.; Gumanao, G.S.; van Katwijk, M.M.; Mueller, B.; Saceda, M.M. & Tejada, R.P. (2011). "Ontogenetic habitat shift, population growth, and burrowing behavior of the Indo-Pacific beach star Archaster typicus (Echinodermata: Asteroidea)". Marine Biology. 158 (3): 639–648. Bibcode:2011MarBi.158..639B. doi:10.1007/s00227-010-1588-0. PMC 3873073. PMID 24391259.
- ^ Bos, A.R. & Gumanao, G.S. (2012). "The lunar cycle determines availability of coral reef fishes on fish markets". Journal of Fish Biology. 81 (6): 2074–2079. Bibcode:2012JFBio..81.2074B. doi:10.1111/j.1095-8649.2012.03454.x. PMID 23130702.
- ^ Naylor, Ernest (2010-02-04). "Chapter 5: Lunar and semilunar biorhythms". Chronobiology of Marine Organisms. Cambridge University Press. ISBN 978-1-139-48494-7. Archived from the original on 2023-09-16. Retrieved 2022-01-03 – via Google Books.
- ^ Zhu, Bokai; Dacso, Clifford C.; O'Malley, Bert W. (2018-07-01). "Unveiling "Musica Universalis" of the Cell: A Brief History of Biological 12-Hour Rhythms". Journal of the Endocrine Society. 2 (7): 727–752. doi:10.1210/js.2018-00113. ISSN 2472-1972. PMC 6025213. PMID 29978151. Archived from the original on 2023-09-16. Retrieved 2022-01-03.
- ^ Darwin, Charles (1871). The Descent of Man, and Selection in Relation to Sex. London: John Murray.
- ^ Le Lacheur, Embert A. (April 1924). "Tidal currents in the open sea: Subsurface tidal currents at Nantucket Shoals Light Vessel". Geographical Review. 14 (2): 282–286. Bibcode:1924GeoRv..14..282L. doi:10.2307/208104. JSTOR 208104. Archived from the original on 16 September 2023. Retrieved 4 February 2012.
- ^ "Do the Great Lakes have tides?". Great Lakes Information Network. October 1, 2000. Archived from the original on 2017-12-30. Retrieved 2010-02-10.
- ^ Calder, Vince. "Tides on Lake Michigan". Argonne National Laboratory. Archived from the original on 2019-08-15. Retrieved 2019-08-14.
- ^ Dunkerson, Duane. "moon and Tides". Astronomy Briefly. Archived from the original on 2010-01-15. Retrieved 2010-02-10.
- ^ "Do the Great Lakes have tides?". National Ocean Service. NOAA. Archived from the original on 2016-04-23. Retrieved 2016-04-26.
- ^ Nurmi, P.; Valtonen, M.J. & Zheng, J.Q. (2001). "Periodic variation of Oort Cloud flux and cometary impacts on the Earth and Jupiter". Monthly Notices of the Royal Astronomical Society. 327 (4): 1367–1376. Bibcode:2001MNRAS.327.1367N. doi:10.1046/j.1365-8711.2001.04854.x.
- ^ "tide". Oxford English Dictionary. Vol. XVIII (2nd ed.). Oxford University Press. 1989. p. 64.
Further reading
[edit]- 150 Years of Tides on the Western Coast: The Longest Series of Tidal Observations in the Americas Archived 2011-05-05 at the Wayback Machine NOAA (2004).
- Eugene I. Butikov: A dynamical picture of the ocean tides Archived 2008-09-11 at the Wayback Machine
- Tides and centrifugal force Archived 2007-05-12 at the Wayback Machine: Why the centrifugal force does not explain the tide's opposite lobe (with nice animations).
- O. Toledano et al. (2008): Tides in asynchronous binary systems Archived 2017-08-09 at the Wayback Machine
- Gaylord Johnson "How Moon and Sun Generate the Tides" Archived 2023-09-16 at the Wayback Machine Popular Science, April 1934
- Simon, Bernard (2013) [2007]. Coastal Tides. Translated by Manley, David. Institut océanographique, Fondation Albert Ier, Prince de Monaco. ISBN 978-2-903581-83-1. Archived from the original on 2022-11-13. Retrieved 2021-10-18.
External links
[edit]- NOAA Tides and Currents information and data
- History of tide prediction Archived 2015-05-09 at the Wayback Machine
- Department of Oceanography, Texas A&M University Archived 2016-03-04 at the Wayback Machine
- UK Admiralty Easytide
- UK, South Atlantic, British Overseas Territories and Gibraltar tide times from the UK National Tidal and Sea Level Facility
- Tide Predictions for Australia, South Pacific & Antarctica
- Tide and Current Predictor, for stations around the world
| Overview | |
|---|---|
| Subfields | |
| Physical phenomena | |
| Related disciplines | |


| International | |
|---|---|
| National | |
| Other | |
Fundamentals
Definition and Types
Tides are the periodic rise and fall of sea levels in oceans, gulfs, bays, and estuaries, primarily caused by the gravitational interactions between Earth, the Moon, and the Sun.[1] These interactions produce alternating bulges in Earth's oceans, resulting in the observed vertical movements that typically occur twice daily, though patterns vary by location.[11] Tides are classified by their frequency and pattern into three main types: semidiurnal, diurnal, and mixed. Semidiurnal tides feature two high waters and two low waters each lunar day (approximately 24 hours and 50 minutes), with the highs and lows of roughly equal height; this type dominates along the U.S. East Coast.[8] Diurnal tides have one high water and one low water per lunar day, commonly observed in the Gulf of Mexico.[8] Mixed tides, often semidiurnal in character, exhibit two unequal high waters and two unequal low waters daily; they prevail along the U.S. West Coast and Pacific islands.[8] The tide range refers to the vertical difference between high water and the subsequent low water.[12] Regions are categorized by mean spring tidal range as microtidal (<2 m), mesotidal (2–4 m), or macrotidal (>4 m).[13] Macrotidal areas, such as the Bay of Fundy where ranges exceed 10 m (up to 16 m during extreme tides), experience amplified effects due to coastal funneling.[14] In contrast, microtidal regions like the upper Gulf Coast have ranges around 0.5 m.[15] Tidal datums serve as reference elevations for measuring water levels relative to the tide. Mean sea level (MSL) is the arithmetic mean of hourly heights over a 19-year National Tidal Datum Epoch.[12] Mean higher high water (MHHW) is the average of the higher high water heights over the same epoch, used for delineating coastal boundaries and flood risks.[16]Tidal Cycles and Patterns
Tidal cycles are primarily driven by the Earth's rotation relative to the Moon, resulting in a lunar day of approximately 24 hours and 50 minutes, which is the time it takes for the Moon to return to the same position in the sky.[17] This extended period compared to the solar day causes successive high tides to occur roughly 50 minutes later each day, shifting the timing of tidal peaks and troughs progressively throughout the month.[18] In most coastal regions, this manifests as semidiurnal tides, featuring two high tides and two low tides per lunar day; the tide going out—also known as the falling, outgoing, or ebb tide—occurs between a high tide and the following low tide, during which water levels recede from the shore.[19] though the exact pattern can vary by location.[19] Spring tides occur when the Sun, Moon, and Earth are aligned in syzygy—during new and full moons—causing their gravitational pulls to reinforce each other and produce the highest tidal ranges of the cycle.[18] Conversely, neap tides take place when the Sun and Moon are at right angles to each other in quadrature—during the first and third quarter moons—resulting in partially opposing gravitational effects that lead to the lowest tidal ranges.[19] These alignments alternate predictably, with spring tides exhibiting ranges up to twice those of neap tides in many areas, such as along the U.S. East Coast where differences can exceed 2 meters.[20] The interplay of these alignments creates a fortnightly cycle, spanning about 14.8 days from spring to neap tide and back, as the Moon completes half its orbit around Earth relative to the Sun.[19] Over the full lunar month of approximately 29.5 days, tidal ranges thus vary systematically, with two spring-neap sequences per month, allowing predictable forecasting for navigation and coastal activities.[20] For instance, in the Bay of Fundy, Canada, the fortnightly modulation amplifies extreme ranges up to 16 meters during springs, with neap tides featuring smaller ranges.[18] Local tidal patterns are further shaped by coastal geography, such as the configuration of shorelines and bays, which can amplify or dampen these cycles through resonance and funneling effects.[7] In enclosed basins like estuaries, these features may enhance diurnal components or alter timing, leading to mixed tidal regimes distinct from the global semidiurnal norm.[18]Causes and Mechanisms
Gravitational and Centrifugal Forces
The tides on Earth are primarily driven by the interplay of gravitational forces from the Moon and centrifugal effects arising from the Earth-Moon orbital motion. The Moon's gravitational pull is not uniform across the Earth's surface due to the inverse-square law of gravity; it is strongest on the side of Earth facing the Moon and weakest on the opposite side.[18] This differential gravitational acceleration, known as the tidal force or gravitational gradient, causes the ocean water to be pulled more strongly toward the Moon on the near side, creating a tidal bulge aligned with the Moon.[4] On the far side, the weaker pull relative to the Earth's center results in a second bulge, where water is effectively left behind as the planet is accelerated toward the Moon.[18] The centrifugal force emerges from the rotation of the Earth-Moon system around their common center of mass, or barycenter, which lies approximately 1,068 miles beneath Earth's surface.[18] This force acts outward uniformly across Earth, directed away from the barycenter, and contributes to the far-side bulge by counteracting the Moon's gravity less effectively at greater distances.[4] Together, these forces produce two tidal bulges per lunar orbit: one on the sublunar point due predominantly to the enhanced gravitational attraction and one on the antipodal point influenced by the centrifugal effect and reduced gravity.[18] The net tide-generating force is the vector sum of the gravitational and centrifugal components, with the horizontal tractive component drawing water toward the bulges and zero at points 90 degrees from the Moon-Earth line.[18] Earth's rotation plays a crucial role in how these bulges affect observers on the surface. As Earth spins on its axis once every 24 hours, any fixed point rotates beneath the stationary bulges (relative to the Moon), experiencing two high tides and two low tides per lunar day of about 24 hours and 50 minutes.[4] This alignment ensures that the bulges appear to move across the oceans from the perspective of a rotating observer.[21] The equilibrium tide theory provides a foundational model for understanding these forces by assuming a static, global ocean response to the combined potential. In this framework, the tidal potential due to the Moon, after accounting for the uniform and linear terms that are balanced in the orbital frame, is given by the quadrupolar component: where is the gravitational constant, is the Moon's mass, is the Earth-Moon distance, is the radial distance from Earth's center (approximately Earth's radius at the surface), is the angle from the Earth-Moon line, and is the second Legendre polynomial.[22] This potential describes the deformation of the ocean surface into an ellipsoid elongated along the Moon-Earth axis, with the varying -dependent term driving the differential forces.[22] The equilibrium model idealizes the bulges' height as about 0.36 meters for the Moon's contribution alone, though real tides are amplified by dynamic effects.[21]Lunar and Solar Influences
The Moon exerts the dominant influence on Earth's tides due to its proximity, generating a tidal force approximately 2.2 times stronger than that of the Sun, despite the Sun's vastly greater mass. This force arises from the differential gravitational pull across Earth's diameter, proportional to the celestial body's mass divided by the cube of its distance to Earth (). The Moon's mass is about 1/27,000,000 that of the Sun (or precisely, ), but its distance is roughly 390 times closer, yielding this enhanced effect.[23][24] The Sun's tidal contribution is significant but secondary, producing tides with an amplitude about 46% of the lunar tide's amplitude. During alignments of the Earth, Moon, and Sun—known as syzygies, occurring at new and full moons—their gravitational forces reinforce each other, resulting in spring tides with greater range. Conversely, at quadrature (first and third quarter moons), the forces are nearly perpendicular, partially canceling to produce neap tides with reduced range. In the simple equilibrium model, spring tide ranges are approximately times neap tide ranges, where and are lunar and solar amplitudes; with , this ratio is about 2.7, though observed ratios vary from 2.5 to 3.3 in deep oceans due to dynamic effects.[22][25][26] The inclinations of the Moon's orbit (about 5.1° to the ecliptic) and the ecliptic itself (23.4° to Earth's equator) introduce declination effects, tilting the tidal bulges relative to the equator and causing latitudinal variations in tide types. The Moon's declination oscillates up to ±28.5° over fortnightly cycles due to its orbital nodes, while the Sun's reaches ±23.5° annually at solstices. These shifts amplify diurnal components at higher latitudes, leading to mixed semidiurnal-diurnal tides poleward of about 30° latitude, whereas equatorial regions experience predominantly semidiurnal tides when declinations are low.[27][28][21]Tidal Constituents and Variations
Primary Constituents
Tidal variations are modeled as the superposition of numerous sinusoidal harmonic constituents, each arising from periodic celestial motions of the Earth, Moon, and Sun relative to one another. These constituents represent the basic building blocks of the tide, with their amplitudes and phases determined through harmonic analysis of observed data. In total, up to 37 primary astronomical constituents are commonly used, though a few dominate the overall signal in most locations.[29][30] The principal semidiurnal constituents are M₂, the principal lunar semidiurnal tide with a period of 12.42 hours, and S₂, the principal solar semidiurnal tide with a period of 12.00 hours. M₂ originates from the direct gravitational attraction of the Moon on Earth's oceans, accounting for the Earth's rotation and the Moon's orbital motion around Earth; it is typically the largest constituent, often contributing more than half of the total tidal energy in many coastal regions.[29][30] S₂ stems from the Sun's direct gravitational effect, modulated by Earth's daily rotation, and is roughly 46% the amplitude of M₂ due to the Sun's greater distance from Earth.[29] The interaction between M₂ and S₂ drives the spring-neap tidal cycle.[30] Diurnal constituents include K₁, the luni-solar diurnal tide with a period of 23.93 hours, and O₁, the principal lunar diurnal tide with a period of 25.82 hours. K₁ results from the combined gravitational influences of the Moon and Sun, particularly their declinational effects as seen from Earth.[29][30] O₁ arises primarily from the Moon's declination, the variation in its position north or south of the celestial equator.[29] These diurnal components contribute to tidal inequalities and are prominent in regions with mixed or predominantly diurnal tides.[30] Over longer timescales, the amplitudes of these constituents are modulated by the 18.6-year nodal cycle, caused by the precession of the Moon's orbital nodes relative to the ecliptic plane. This cycle introduces periodic variations in the declination of the Moon and Sun, affecting the equilibrium tide potential; for example, M₂ amplitude varies by about ±4%, K₁ by ±11%, and O₁ by ±18%.[29] Accurate tidal predictions thus require accounting for these nodal corrections, typically over a 19-year epoch.[29]Amplitude, Phase, and Range Variations
The amplitude of the tide at any location results from the vector addition of multiple harmonic constituents, each characterized by its own amplitude and phase, leading to modulation through interference patterns. When constituent phases align, constructive interference amplifies the total amplitude, as seen in spring tides where the principal lunar semidiurnal constituent (M₂) and the solar semidiurnal constituent (S₂) combine in phase, producing higher high waters and lower low waters. In contrast, destructive interference occurs during neap tides when these constituents are approximately 90 degrees out of phase, resulting in reduced overall amplitude and more moderate tidal ranges. This vector summation is fundamental to harmonic tidal analysis, where the resultant tide height is the scalar sum of phasors in the complex plane.[29] Phase differences among constituents and relative to astronomical forcing arise primarily from the propagation of tidal waves across ocean basins, introducing lags or leads that alter the timing of high and low waters. The phase lag δ represents the delay between the observed tidal maximum and the equilibrium position predicted from celestial mechanics, influenced by factors such as continental barriers and frictional dissipation during propagation. This can be expressed in the phase equation: where is the time, is a reference time (often lunar transit), is the constituent period, and δ accounts for local propagation effects, typically measured in degrees or hours. For instance, the phase lag of the M₂ constituent can vary by several hours across a single ocean basin, as depicted in cotidal charts showing progressive delays from the open ocean toward coasts.[29] Tidal ranges exhibit significant variations due to changes in the Earth-Moon distance over the lunar orbit's 27.55-day anomalistic month. At perigee, when the Moon is closest to Earth, the tidal-generating force increases, enhancing amplitudes by up to 40% compared to apogee, where the Moon is farthest and the force diminishes accordingly; this stems from the inverse cube dependence of gravitational force on distance, with the perigee-apogee ratio yielding a force modulation of approximately 1.4:1 for lunar tides. Solar perturbations contribute smaller variations, with a force ratio of about 1.11:1 between perihelion and aphelion, further modulating ranges when aligned with lunar cycles, such as during perigean spring tides that can exceed average ranges by 20-50% in susceptible locations.[31][28] Local factors, including resonance in semi-enclosed basins like bays and estuaries, can amplify or distort these variations by exciting natural oscillations that align with tidal periods, leading to enhanced ranges without altering the underlying astronomical drivers. For example, resonance may cause surging motions that increase tidal amplitudes in specific coastal systems, though the effect diminishes with frictional losses.[32]Theoretical Models
Equilibrium Tide Theory
The equilibrium tide theory posits a simplified model of tidal behavior on Earth, assuming a static ocean that instantaneously adjusts to the gravitational potentials induced by the Moon and Sun. This theory envisions a perfectly spherical Earth covered entirely by a uniform, frictionless layer of water that responds without inertia or dynamic effects to the tide-generating forces.[25][21] Under these conditions, the ocean surface deforms into a shape that maintains hydrostatic equilibrium with the combined gravitational and centrifugal potentials.[1] The tide height in this model is derived from the tidal potential, which arises primarily from the Moon's gravitational influence. The equilibrium tide height as a function of colatitude (measured from the sub-lunar point) is given by where is the gravitational constant, is the Moon's mass, is Earth's radius, is the acceleration due to gravity at Earth's surface, and is the Earth-Moon distance. This expression ensures a zero global mean height and captures the latitudinal variation, with the factor corresponding to the associated Legendre function normalized for the quadrupolar deformation. The derivation stems from expanding the gravitational potential in spherical harmonics and balancing it against the geopotential to find the equipotential surface that the ocean follows. A similar but smaller term applies for the Sun, scaled by its mass and greater distance. This model predicts two symmetric tidal bulges: one facing the Moon and one on the opposite side of Earth, resulting from the differential gravitational pull and the centrifugal force due to the Earth-Moon orbital motion. As Earth rotates beneath these fixed bulges with a period matching the lunar orbital cycle, locations experience two high tides and two low tides per lunar day (approximately 24 hours and 50 minutes), producing a purely semidiurnal tide with highs and lows separated by about 6 hours and 12 minutes.[21][25] Despite its conceptual elegance, the equilibrium tide theory has significant limitations, as it neglects the complexities of real ocean dynamics. The predicted maximum amplitude is unrealistically small, around 0.5 meters for the lunar contribution, compared to observed tidal ranges of 1 to 10 meters or more in many coastal areas. This discrepancy arises because the model assumes an idealized, global ocean without continents, shallow depths, or frictional dissipation that amplify tides in reality.[33][34]Dynamic Tide Theory
The dynamic theory of tides provides a more realistic framework for understanding tidal behavior by incorporating the effects of Earth's rotation, ocean basin geometry, and frictional forces, which the equilibrium theory overlooks. Unlike the equilibrium model, which assumes an instantaneous global response to gravitational forces, the dynamic approach treats tides as propagating waves influenced by shallow water dynamics, where wave speed is determined by with as gravity and as water depth.[35] This propagation is governed by shallow water wave equations that account for variations in ocean depth and continental boundaries, which impose reflective conditions that shape tidal patterns.[36] Additionally, the Coriolis force deflects tidal crests— to the right in the Northern Hemisphere and to the left in the Southern—leading to rotational wave propagation and phase lags relative to the direct lunar or solar forcing.[35] A central feature of dynamic tide theory is the formation of amphidromic systems in ocean basins, where tidal crests rotate around a central node (amphidromic point) with minimal tidal range, while cotidal lines—connecting points of simultaneous high water—radiate outward like spokes. In the Northern Hemisphere, this rotation is counterclockwise around the node, driven by the Coriolis effect and coastal Kelvin waves that propagate with the coast on the right; the opposite occurs in the Southern Hemisphere.[36] These systems arise from the interaction of incoming tidal waves with basin boundaries, resulting in co-rotating patterns that explain regional variations, such as the progression of high tide times across the North Atlantic.[35] Basin dimensions further modify tidal amplitudes through resonance effects, where certain tidal frequencies align with natural oscillation modes, amplifying waves akin to seiches in semi-enclosed waters. For instance, the North Sea exhibits quarter-wave resonance for semi-diurnal tides, as its length approximates one-quarter of the Kelvin wave wavelength, enhancing amplitudes in the southern bight through constructive interference with incoming Atlantic tides.[37] This resonance depends on factors like basin width and depth, which influence wave speed and frictional damping, leading to pronounced tidal ranges in resonant areas compared to non-resonant ones.[37] In contrast to the equilibrium theory's direct response, dynamic tides operate as co-oscillating forced waves, where ocean basins respond to periodic forcing from adjacent open oceans, delayed by propagation time and modified by local geography. This results in tides that are not globally synchronous but vary in timing and amplitude, with phase differences that can span hours across continents.[36]Mathematical Formulations
The mathematical formulations for tidal dynamics are grounded in the linearized shallow-water equations, adapted to include the tidal forcing potential. These equations, known as Laplace's tidal equations, describe the evolution of sea surface height and horizontal velocities in a rotating frame on a spherical Earth, assuming hydrostatic balance and shallow fluid depth relative to the wavelength. The continuity equation in its linearized form is where is the sea surface elevation anomaly, is the mean water depth, and is the depth-integrated horizontal velocity vector. The momentum equations are with as the Coriolis parameter ( is Earth's angular velocity and the latitude), the gravitational acceleration, and the tidal potential arising from lunar and solar gravitational perturbations. These equations neglect nonlinear advection and bottom friction in their basic form but can be extended accordingly. Solutions to Laplace's tidal equations for global tides are obtained by separation of variables into normal modes, which represent free oscillations of the ocean under the linearized system. Assuming time-harmonic forcing (where is the tidal frequency), the equations decouple into spatial eigenfunctions for elevation and velocity fields on the sphere. These modes, often expanded in spherical harmonics, capture the resonant structure of basin-scale tides, with eigenvalues determining the equivalent depths and phase speeds for each mode. The forced response combines these modes to match observed tidal patterns, enabling representation of semidiurnal (e.g., M) and diurnal constituents.[38] Tidal dissipation arises primarily from frictional processes in the equations, converting barotropic tidal energy into internal waves and heat, with a global average rate of approximately 3.7 terawatts (TW). This energy loss is parameterized by the tidal quality factor , defined as the ratio of the maximum tidal energy stored in the ocean to the energy dissipated per tidal cycle, where lower indicates higher dissipation efficiency. For Earth's oceanic tides, effective values range from about 20 to 30, reflecting the phase lag between the tidal potential and response. Bathymetry introduces spatial variations in water depth , altering the propagation of tidal waves through changes in phase speed , which decreases over shallower regions. This depth gradient causes refraction of tidal wavefronts, analogous to Snell's law, bending rays toward shallower areas and amplifying amplitudes near coasts via energy conservation. Such effects are incorporated by solving the equations over variable , leading to focusing or shadowing in complex topographies.[39]Historical Development
Ancient and Early Modern Observations
Ancient observations of tides date back to the Greek explorer Pytheas of Massalia in the 4th century BCE, who during his voyages to northern Europe became the first recorded figure to link tidal movements to the phases of the Moon, noting the regularity of high and low waters in regions like the Atlantic coasts.[40] His accounts, preserved through later writers such as Strabo and Pliny the Elder, described extreme tidal ranges in areas such as the Bristol Channel, where he reported rises of up to 80 cubits (about 35-40 meters), though likely exaggerated as actual maximum ranges in the region are around 15 meters, highlighting the phenomenon's variability and lunar correlation.[41] In the 2nd century BCE, Seleucus of Seleucia proposed that tides were caused by the Moon's attraction, with tidal height varying with the Moon's distance from Earth.[42] In the medieval period, Islamic scholars advanced empirical understanding of tidal periodicity. Abu Rayhan al-Biruni, in the 11th century, documented observations of tidal variations tied to lunar phases in his work Tahqiq ma li-l-Hind, noting how high tides corresponded to the Moon's position and attributing the ebb and flow to celestial influences, based on reports from Indian coastal regions.[43] Concurrently in Europe, the Venerable Bede, writing in the early 8th century in De Temporum Ratione, provided one of the earliest systematic descriptions of semidiurnal tides, explaining their twice-daily cycle as synchronized with the Moon's orbit and recognizing that local phase differences caused variations across ports, such as those along the North Sea coasts.[44] By the 12th century, practical tidal records emerged in European navigational aids, with manuscript diagrams like the late-12th-century Rota (tidal wheel) illustrating monthly tidal cycles aligned with lunar ages to assist sailors in ports facing significant ranges, including those in the English Channel and Bristol, where extreme tides necessitated careful timing for shipping.[45] These empirical tools reflected accumulated port-specific observations, emphasizing the need for localized predictions amid the region's pronounced tidal bores and ranges exceeding 10 meters. In the 17th and 18th centuries, scientific observations gained precision through systematic surveys. Isaac Newton, in his Philosophiæ Naturalis Principia Mathematica (1687), offered the first gravitational explanation for tides, positing that the Moon and Sun's attractions deformed Earth's oceans into bulges, with interference patterns explaining semidiurnal cycles and regional variations. Building on this, Edmond Halley conducted detailed tidal surveys in the English Channel aboard the HMS Paramour in 1701, recording high-water times at multiple sites to map tidal propagation, producing the first empirical tidal chart that illustrated progressive wave delays from Land's End to the Thames, akin to early cotidal patterns.[46] These efforts marked a shift from qualitative records to quantitative data essential for navigation in tidally complex areas like the Channel.Evolution of Tidal Theory
The foundational explanation of tides as gravitational phenomena originated with Isaac Newton in his 1687 work Philosophiæ Naturalis Principia Mathematica, where he described the tidal bulges on Earth as resulting from the Moon's and Sun's gravitational pulls, incorporating a centrifugal force component in his equilibrium model; however, this model inaccurately assumed a static ocean and overestimated tidal forces.[44][29] In the late 18th century, Pierre-Simon Laplace advanced tidal understanding through his dynamic theory, developed between 1775 and 1778 and detailed in Mécanique Céleste (1799), which integrated hydrodynamics to account for Earth's rotation and ocean responses, separating tides into diurnal, semidiurnal, and long-period components using a tidal potential framework.[29][44] Early 19th-century refinements included Thomas Young's contributions in the 1810s, particularly his 1813 paper in Nicholson's Journal and entries in the Encyclopædia Metropolitana, which incorporated frictional effects to better explain tidal dissipation and irregularities in shallow waters.[47] The mid-19th century saw William Thomson (Lord Kelvin) introduce harmonic analysis in 1867, building on Laplace's ideas to decompose tides into sinusoidal components for prediction, which facilitated the development of mechanical tide-predicting machines.[29] In the 1920s, Arthur Doodson expanded this approach at the Liverpool Tidal Institute, identifying over 400 tidal constituents based on the lunar theory of E.W. Brown, enabling more precise global predictions through the Doodson-Legendre expansion.[29] The advent of computers in the post-1960s era shifted focus to numerical models, simulating complex ocean dynamics and bathymetry to refine dynamic theory beyond harmonic methods.[29] Modern advancements have leveraged satellite altimetry, with the TOPEX/Poseidon mission launched in 1992 providing the first global tidal maps and validating models by revealing that about one-third of tidal energy dissipates in deep oceans rather than solely on continental shelves.[48] Recent projections incorporate climate change effects, showing that sea-level rise—observed at an average of approximately 3.7 mm/year from 1993 to 2023, with recent acceleration—will amplify tidal ranges and flooding risks in coastal regions by altering hydrodynamic interactions, with global models forecasting up to 10-20% increases in extreme sea levels by 2100 under high-emission scenarios.[49][50][51]Measurement and Prediction
Observational Methods
Tide gauges have long served as the primary instruments for measuring water levels associated with tides. Traditional tide gauges often employed stilling wells, which are vertical pipes connected to the sea that dampen wave action to provide stable water level readings, typically measured via floats or staffs.[52] These mechanical systems, dating back centuries, have largely been supplanted by digital sensors in modern setups. Contemporary tide gauges predominantly use pressure sensors, either acoustic or hydrostatic, submerged below the water surface to detect changes in water pressure corresponding to sea level variations.[53] The National Oceanic and Atmospheric Administration (NOAA) operates the National Water Level Observation Network (NWLON), comprising over 200 automated tide stations across the United States and territories, which collect continuous water level data using these pressure sensors to monitor tides with high temporal resolution.[54] To measure tidal currents, or tidal streams, acoustic Doppler current profilers (ADCPs) are widely utilized. These instruments emit acoustic pulses into the water column and analyze the Doppler shift in echoes reflected from particles or scatterers to determine current velocity profiles vertically and horizontally.[55] ADCPs can be deployed in bottom-mounted, moored, or vessel-mounted configurations, enabling detailed mapping of tidal flow speeds and directions over depths ranging from shallow coastal zones to the open ocean.[56] For instance, ship-mounted ADCPs have been employed to capture the spatial and temporal variations in tidal currents during complete tidal cycles, revealing phase differences and amplitude gradients in estuarine and shelf environments.[57] Satellite-based observations have revolutionized global tidal monitoring since the 1990s through radar altimetry missions in the Jason continuity series. These satellites, including Jason-1 (launched 2001), Jason-2 (2008), Jason-3 (2016), and Sentinel-6 (launched 2020), measure sea surface height (SSH) by calculating the two-way travel time of radar pulses reflected from the ocean surface, providing along-track data with centimeter-level accuracy.[58] The series has mapped tidal signals across 95% of the ice-free ocean every 10 days, enabling the derivation of global tidal constituents and mean sea level variations influenced by tides.[59] Complementing these, the Surface Water and Ocean Topography (SWOT) mission, launched in 2022, uses wide-swath interferometric altimetry to provide higher-resolution SSH measurements, enhancing tidal mapping in coastal and riverine areas.[60] Complementing altimetry, GNSS-equipped buoys offer real-time, localized SSH measurements by tracking the vertical position of the buoy's antenna using global navigation satellite systems, achieving millimeter precision in dynamic coastal settings.[61] These buoys are particularly valuable for validating satellite data and monitoring short-term tidal fluctuations in areas inaccessible to fixed gauges.[62] Tidal reference levels, or datums, are established to standardize measurements relative to fixed benchmarks. The Lowest Astronomical Tide (LAT) represents the lowest level of the predicted astronomical tide expected under average meteorological conditions over a 19-year National Tidal Datum Epoch (NTDE).[63] These datums are computed through harmonic analysis of long-term tide gauge records, typically spanning at least 19 years to capture the full metonic cycle of lunar phases, ensuring statistical reliability in separating astronomical tides from other influences.[16] NOAA's methodology involves averaging high and low waters after filtering non-tidal components, providing a consistent vertical reference for charting, engineering, and scientific applications.[64]Analytical and Numerical Prediction
Harmonic analysis is a fundamental method for tide prediction, involving the decomposition of observed water level time series into sinusoidal components known as tidal constituents. These constituents correspond to specific astronomical frequencies arising from the gravitational interactions of the Earth, Moon, and Sun, as well as nonlinear effects in shallow waters. The process employs least-squares fitting to determine the amplitudes and phase lags (epochs) of these constituents from historical data, minimizing the squared residuals between observed and modeled values. This simultaneous fitting of multiple constituents accounts for overlapping frequencies through nodal corrections and related adjustments, enabling the generation of harmonic constants essential for forecasting. The technique, refined by organizations like NOAA's Center for Operational Oceanographic Products and Services (CO-OPS), typically analyzes data over periods ranging from 29 days to 19 years to resolve up to 149 constituents, depending on data length and location-specific dynamics.[29] A historical variant, the Admiralty method, developed for practical tidal forecasting, uses precomputed harmonic constants from short observation series (15–29 days) to predict hourly heights at ports worldwide. Detailed in the Admiralty Manual of Tides, this approach fits basis functions to data via least-squares principles, incorporating satellite-derived adjustments for modern applications, and remains influential for its efficiency in operational settings like navigation.[65] Numerical modeling complements harmonic analysis by solving the governing equations of tidal motion on spatial grids, particularly for regions where local bathymetry and coastline geometry introduce complexities beyond simple sinusoidal sums. These models solve the shallow-water equations—linearized forms of the Navier-Stokes equations for barotropic flow—using finite-difference schemes to simulate tidal propagation, friction, and dissipation across global or regional domains. The TPXO series, for instance, represents a widely used global model that assimilates satellite altimetry data (e.g., from TOPEX/Poseidon) into a finite-difference barotropic framework, yielding high-resolution tidal elevations and currents with errors below 3 cm in open oceans. Such models provide boundary conditions for regional simulations and improve predictions in data-sparse areas by incorporating physics-based dynamics. Short-term tide predictions, typically spanning days to months, rely on precomputed harmonic constants to generate tide tables, which list predicted high and low water times and heights at specific stations. NOAA produces these tables for over 3,000 U.S. locations by summing the contributions of 37 primary constituents, updated annually to reflect minor observational refinements. Real-time adjustments for meteorological influences, such as storm surges or wind-driven setup, are applied operationally through systems like the Physical Oceanographic Real-Time System (PORTS), which overlay harmonic predictions with nowcasts from coupled hydrodynamic models to account for non-tidal residuals.[29] For long-term predictions extending years or decades, harmonic methods incorporate secular variations, notably the 18.6-year lunar nodal cycle, which modulates tidal amplitudes and phases through node factors and in the prediction formula. This cycle, arising from the precession of the Moon's orbital nodes, causes gradual changes in diurnal inequality and range, requiring updates to harmonic constants every 19 years to align with the National Tidal Datum Epoch used by NOAA. Almanacs, such as the U.S. Nautical Almanac published by the U.S. Naval Observatory, integrate these adjustments into extended tidal forecasts, ensuring consistency with astronomical ephemerides for applications like coastal planning.[29]Practical Examples and Calculations
One practical example of tidal prediction involves calculating the approximate time of high tide at a specific location using the dominant semidiurnal constituents M2 (principal lunar) and S2 (principal solar), which together account for much of the tidal variation in many coastal areas. For Bridgeport, Connecticut, on September 1, 1991, the M2 constituent has an amplitude of 3.185 feet and a phase of -127.24 degrees relative to a reference time of midnight, while the S2 has an amplitude of 0.538 feet and a phase of -343.66 degrees.[66] The height contribution from each is given by and , where /hour (period hours) and /hour (period hours). To find the time of high tide dominated by M2, solve (mod ), yielding hours after midnight, or roughly 4:23 AM; the S2 contribution shifts this slightly depending on alignment, but for spring tides when phases align, the total height peaks near this time.[66][29] A notable case study is the Bay of Fundy in eastern Canada, where the tidal range reaches up to 16 meters due to resonance in the Gulf of Maine-Fundy basin, which amplifies the incoming tidal wave near the natural period of the system (approximately 13.3 hours for semidiurnal tides). This resonance boosts the amplitudes of constituents like M2 and S2; for instance, at the head of the bay in Minas Basin, the M2 amplitude can exceed 7 meters, compared to less than 1 meter in the open Atlantic. The total water level is approximated as , where during spring tides, constructive interference yields heights up to 8 meters above mean sea level, resulting in the observed 16-meter range from low to high tide.[67][68][69] Tidal predictions can deviate from astronomical models due to non-astronomical factors, such as storm surges driven by wind and atmospheric pressure, which can alter water levels by tens of centimeters through tide-surge interactions and superelevation. These meteorological effects introduce errors that oscillate over time, particularly during high-wind events, and are not captured in pure harmonic predictions.[70][29] For everyday use, modern tools like the free XTide software enable users to generate accurate tidal predictions by applying harmonic analysis to global datasets, producing graphs, tables, and calendars for any location without manual computation. XTide relies on established constituent data from sources like NOAA and supports predictions far into the future or past.[71]Practical Applications
Navigation and Coastal Engineering
Tidal currents, driven by the rise and fall of tides, present significant navigational challenges for maritime vessels, particularly in regions with strong tidal streams such as the English Channel, where speeds can reach up to 5 knots (approximately 2.6 m/s) during peak flows.[72] These currents can alter a vessel's course, reduce effective speed over ground, and complicate maneuvering, especially in narrow channels or during docking, necessitating precise planning to avoid grounding or collision.[29] Mariners rely on tide tables, which provide predicted times and heights of high and low tides as well as current directions and speeds, to determine safe passage windows and adjust routes accordingly.[73] For instance, crossings in the English Channel often require vessels to time departures with favorable tidal streams to maintain efficiency and safety, using tools like numerical prediction models for real-time adjustments.[74] In harbor design, tidal ranges dictate the need for dredging to maintain navigable depths during low tide, creating "tidal windows" for larger ships to enter or exit without risking stranding. Ports in tidal estuaries, such as those on the River Thames, incorporate locks and barriers to manage fluctuating water levels and facilitate safe transit. The Thames Barrier, for example, features ten navigable spans and associated locks that allow vessels to pass during operational closures, ensuring continuous access while protecting against high tides.[75] These structures are engineered to accommodate typical tidal ranges of 6-7 meters in the Thames estuary, with dredging operations routinely maintaining channel depths to support commercial traffic.[76] Safety concerns in tidal waters include hazards like tidal bores—sudden upstream surges of water that can capsize small craft—and rip currents enhanced by outgoing tides, which pull swimmers and lightweight vessels seaward at speeds exceeding 2 meters per second. Notable examples include the Severn Bore in the UK, where bore heights up to 2 meters create turbulent conditions hazardous for navigation outside designated times.[77] International standards from the International Hydrographic Organization (IHO) mandate the inclusion of tidal predictions on nautical charts, specifying cotidal lines and current data to inform mariners of these risks and promote safer passage.[78] Compliance with IHO S-44 survey standards ensures that charted tidal information meets accuracy requirements for safe navigation in varying coastal environments.[78] Coastal engineering addresses tidal influences through structures like breakwaters and seawalls, designed to mitigate erosion by accounting for tidal ranges and associated wave action. Detached breakwaters, for instance, are positioned to interrupt longshore sediment transport and reduce wave energy on beaches, with effectiveness varying by tidal regime—suitable for shingle beaches across all ranges but limited on sand in macro-tidal areas exceeding 4 meters.[79] Seawalls, often constructed with curved or stepped faces, incorporate toe protection such as riprap or gabions to prevent scour from tidal currents and breaking waves, with crest elevations set above mean high water plus storm surge to withstand overtopping.[80] In the U.S., the U.S. Army Corps of Engineers guidelines emphasize filters and aprons in seawall designs to handle tidal fluctuations, as seen in projects like the Galveston Seawall, where structures rise 17 feet above the base to counter storm surges and erosion in an area with minimal tidal ranges of about 0.5 meters.[80] These measures stabilize shorelines by dissipating wave forces and limiting sediment loss during ebb and flood cycles.[79]Tidal Energy Generation
Tidal energy generation harnesses the predictable movements of ocean tides to produce renewable electricity, primarily through the capture of potential and kinetic energy. Potential energy arises from the vertical rise and fall of sea levels during high and low tides, which can exceed 12 meters in some locations, and is typically converted using structures like barrages or lagoons that impound water and release it through turbines to drive generators. Kinetic energy, on the other hand, is derived from the horizontal flow of tidal currents during flood and ebb phases, extracted via submerged turbines that rotate under the force of moving water. These principles enable continuous power output aligned with tidal cycles, distinguishing tidal energy from intermittent sources like solar or wind.[81][82] Key technologies include horizontal-axis tidal stream turbines, which resemble underwater wind turbines and operate efficiently in currents exceeding 2 meters per second, achieving power conversion efficiencies of approximately 20-40% depending on design and site conditions. A notable example is the SeaGen turbine, a 1.2 MW horizontal-axis system with twin 16-meter rotors deployed in Strangford Lough, Northern Ireland, in 2008 and operated until 2016, which demonstrated reliable grid-connected operation and served as a prototype for commercial-scale stream energy extraction. Tidal lagoons represent an alternative for potential energy capture, consisting of offshore enclosures with turbines embedded in their walls; unlike shore-connected barrages, lagoons can be positioned flexibly in coastal waters to minimize land-based disruption while generating power bidirectionally during tidal filling and emptying.[83][84][81] Prominent projects illustrate the scalability of these technologies. The Sihwa Lake Tidal Power Station in South Korea, operational since 2011, is the world's largest installation at 254 MW capacity, utilizing a barrage across an artificial lake to generate electricity for over 500,000 households through ten 25.4 MW bulb turbines. In Scotland, the MeyGen project in the Pentland Firth reached 6 MW in its Phase 1 demonstration array by 2018, comprising four 1.5 MW horizontal-axis turbines on gravity foundations, with Phase 1A operational since 2018 and expansions planned but delayed as of 2025, aiming toward 398 MW total. Globally, the technically harvestable tidal resource is estimated at around 1 TW near coastal areas, sufficient to meet a significant portion of worldwide electricity demand if fully developed.[85][82][86] Despite these advancements, tidal energy faces substantial challenges, including high capital costs—such as over USD 3,000/kW for large barrages—and environmental effects like altered sediment transport that can impact coastal ecosystems and navigation. Recent studies as of 2025 indicate that while turbine wakes may influence local hydrodynamics, widespread ecological disruption fears are often overstated, though site-specific monitoring remains essential. Emerging floating tidal systems address deployment hurdles in deeper waters; for instance, Orbital Marine Power's O2 platform, a 2 MW floating horizontal-axis turbine deployed in Scotland since 2021, has advanced commercialization, with ongoing efforts including potential U.S. sites as of 2025.[81][87][88]Ecological and Biological Impacts
Intertidal Ecosystems
The intertidal zone, shaped by the rhythmic submersion and exposure due to tides, is divided into distinct vertical zones based on the duration and frequency of tidal inundation. The supralittoral or splash zone lies above the highest high tide mark, experiencing only spray from waves, where desiccation-resistant species like lichens and certain algae predominate, with barnacles such as Balanus glandula exhibiting adaptations like tight shell closure to minimize water loss during prolonged air exposure.[89][90] The midlittoral or intertidal zone is alternately submerged and exposed by average tides, supporting a diverse array of organisms including mussels (Mytilus californianus), sea stars (Pisaster ochraceus), and macroalgae like Fucus species, which have evolved tolerances to fluctuating salinity and temperature.[91][92] Below this, the sublittoral or lower intertidal fringe remains submerged most of the time except during extreme low tides, hosting kelp beds and mobile invertebrates like crabs and anemones that are adapted to near-constant immersion but occasional aerial exposure.[90] These zonation patterns are primarily determined by tidal range and exposure gradients, creating sharp boundaries in species distribution that reflect selective pressures from tidal cycles.[89] Intertidal ecosystems harbor exceptional biodiversity, with complex food webs anchored by primary producers such as microalgae, seaweeds, and epiphytic algae that form the base for herbivores like grazing snails and limpets.[93] Invertebrates, including barnacles, polychaete worms, and bivalves, serve as intermediaries, preyed upon by carnivores such as predatory whelks and shore crabs, while birds like oystercatchers and plovers forage on exposed mudflats and rocky shores, linking intertidal production to terrestrial and avian trophic levels.[94] These interactions foster resilience, as seen in rocky shores where mussel beds provide habitat for over 100 associated species, enhancing overall community stability.[95] Tidal flushing plays a critical role in nutrient cycling, importing dissolved nutrients and organic matter from adjacent coastal waters during high tide and exporting waste, which sustains high productivity rates in productive systems like salt marshes.[96] This dynamic exchange prevents nutrient limitation, supporting detrital pathways where decomposed algae fuel microbial communities and subsurface food chains.[97] Human activities exacerbate tidal stresses in intertidal habitats, with pollution from urban runoff introducing contaminants like heavy metals and plastics that bioaccumulate in filter-feeding invertebrates, disrupting food web dynamics and reducing biodiversity in affected areas.[98] Habitat loss from coastal development, such as shoreline armoring and dredging, fragments zonation patterns and amplifies erosion during tidal cycles, leading to the decline of foundational species like oysters in estuarine intertidal zones.[99] Conservation efforts, including the establishment of marine protected areas (MPAs), mitigate these impacts by restricting exploitation and restoring natural tidal flows; for instance, MPAs along California's coast have increased invertebrate densities through reduced trampling and harvesting.[100][101] Climate change, particularly accelerating sea-level rise, is reshaping intertidal zonation by compressing habitable space and shifting species distributions upward, with low-lying zones like mudflats potentially losing 10-20% of area per decade in vulnerable regions.[102] In mangrove-dominated intertidal systems, rising waters have driven seaward migration at rates of 18 m/year in some Southeast Asian sites, offsetting inland habitat loss but exposing new areas to salinity stress and erosion.[103] A 2022 study in South Florida documented mangrove expansion into former salt marsh zones at 9.41 mm/year sea-level rise rates, altering biodiversity by favoring salt-tolerant species while threatening freshwater-dependent communities.[104] Similarly, 2025 analyses of Everglades ecosystems revealed mixed responses, with mangrove shifts reducing carbon sequestration in some wetlands by altering tidal inundation patterns.[105] These changes highlight the need for adaptive management to preserve intertidal resilience amid ongoing tidal alterations.[106]Circatidal Rhythms in Organisms
Circatidal rhythms are endogenous biological clocks in marine organisms that approximate the 12.4-hour tidal cycle, enabling anticipation of tidal immersion and exposure even in constant conditions. These rhythms are entrained by environmental zeitgebers such as hydrostatic pressure changes, temperature fluctuations, and water flow, allowing intertidal species to synchronize behaviors like feeding, reproduction, and burrowing with tidal phases.[107] In fiddler crabs (Uca spp.), circatidal rhythms drive swarming and foraging activity, with peaks during low tide exposure when crabs emerge from burrows to feed, persisting as free-running cycles of approximately 12.4 hours in laboratory conditions without tidal cues. Similarly, in reef-building corals (Acropora spp.), these rhythms entrain spawning events, where gamete release is timed to coincide with outgoing tides shortly after sunset, ensuring larval dispersal; the semidiurnal tidal immersion cycle acts as a key entrainer alongside diurnal light cues.[108][109][110] Mechanisms underlying entrainment involve sensory detection of tidal signals, including mechanoreceptors that respond to water flow and pressure variations, which reset the internal clock to maintain phase with local tides. Lunar cues, particularly moonlight intensity and timing, further synchronize these rhythms by modulating circalunidian (24.8-hour) cycles that interact with the circatidal clock, enhancing precision across lunar phases.[107][111] Representative examples illustrate behavioral adaptations tied to these rhythms. Grunion fish (Leuresthes tenuis) undertake spawning runs on sandy beaches during the highest spring tides, three to four nights after full or new moons, when females deposit eggs in damp sand wetted by receding waves, with males fertilizing them in a brief, synchronized event. In oysters (Crassostrea spp.), valve opening and filter-feeding peak during immersion at high tide, governed by circatidal components in their molecular clock genes that can oscillate at tidal frequencies under entrainment.[112][113] Evolutionarily, circatidal rhythms confer survival advantages by optimizing foraging during nutrient-rich low tides while minimizing exposure to aquatic predators during high tides, and facilitating reproduction when larvae face reduced predation risk in dispersing currents. These adaptations likely arose in intertidal ancestors to exploit predictable tidal predictability, enhancing fitness in dynamic coastal environments.[107][114] However, anthropogenic disruptions such as artificial light at night (ALAN) can desynchronize these rhythms; for instance, in corals, ALAN shifts spawning one to three days closer to the full moon, potentially reducing fertilization success by misaligning with optimal tidal flows. In fiddler crabs and oysters, ALAN alters activity peaks and valve behaviors, impairing energy acquisition and increasing vulnerability to predators.[115][116]Related Phenomena
Earth and Solid Tides
Solid Earth tides refer to the elastic deformations of the planet's crust induced by the differential gravitational attractions of the Moon and Sun, resulting in periodic vertical and horizontal displacements of the surface. These tides cause the solid Earth to bulge and recede twice daily, with maximum vertical displacements reaching up to 40 cm, primarily at equatorial latitudes.[117] Such deformations are measured using highly sensitive instruments, including superconducting gravimeters, which detect associated gravity variations with amplitudes of several hundred microgals, and GPS receivers for direct displacement observations.[118] The elastic response of the Earth to tidal forcing is quantified by the Love and Shida numbers, which describe the ratios of induced displacements and potential perturbations to the applied tidal potential. For the dominant degree-2 tidal harmonics, the vertical Love number is approximately 0.60, indicating that the actual vertical displacement is about 60% of the equilibrium tide height, while the horizontal Shida number is around 0.08, reflecting smaller lateral shifts.[118] These values, derived from models like the Preliminary Reference Earth Model (PREM), account for the Earth's layered structure and are essential for interpreting observational data.[118] Globally, solid Earth tides exhibit semidiurnal dominance, with the principal lunar constituent M (period of approximately 12.42 hours) accounting for the largest amplitudes, up to about 30 cm vertically near the equator.[118] This pattern arises from the alignment of the tidal bulge with the Moon's orbital plane and varies latitudinally as , where is the colatitude.[118] In applications, solid Earth tide models are critical for correcting geodetic measurements, such as those from GPS and very long baseline interferometry, where uncorrected tidal displacements can introduce errors exceeding 30 cm in vertical positions.[117] They also inform earthquake monitoring by revealing how tidal stresses modulate fault slip, with studies linking semidiurnal peaks to increased seismicity rates.[118] Additionally, these tides interact with ocean loading effects, where redistributed ocean water masses amplify crustal deformations by up to 10-20% in coastal regions, necessitating combined models for precise geophysical analysis.[119]Atmospheric and Oceanic Tides
Atmospheric tides manifest as global-scale oscillations in atmospheric pressure, temperature, and winds, primarily exhibiting diurnal (24-hour) and semidiurnal (12-hour) periodicities. These tides are driven predominantly by the differential solar heating of the Earth's atmosphere, which causes thermal expansion and contraction, rather than gravitational forces from the Moon or Sun. The semidiurnal component, often the most prominent at the surface, produces pressure variations with amplitudes typically around 0.5 millibars (mb), detectable worldwide but strongest in tropical regions due to intense solar insolation.[120][121] This solar forcing excites waves that propagate vertically and horizontally, influencing the middle and upper atmosphere up to altitudes of about 100 km, where ozone absorption further amplifies the semidiurnal tide around 50 km.[122] In contrast to oceanic tides, which are mainly gravitational, atmospheric tides are thermal in origin, with the migrating diurnal tide (denoted as S1) arising from longitudinal variations in solar heating due to land-sea thermal contrasts and topography. The S1 tide propagates westward with the Sun's apparent motion (zonal wavenumber s = -1), achieving pressure amplitudes of approximately 0.5–0.7 mb over continental areas, where sensible heat fluxes from sun-warmed land enhance the response, compared to weaker oceanic signatures.[123][124] Gravitational lunar influences contribute only marginally to these tides, typically less than 10% of the solar thermal forcing, making atmospheric tides distinct from the lunisolar-driven oceanic cycles.[125] The coupling between atmospheric and oceanic tides occurs through wind-driven setup and pressure loading, where atmospheric pressure variations and surface winds alter sea surface heights, often amplifying or modifying oceanic responses. Low-pressure systems reduce overlying air weight, causing inverse barometer effects that raise sea levels by about 1 cm per mb drop, while winds pile water against coastlines, contributing to setups of several meters during storms.[19] The Sea, Lake, and Overland Surges from Hurricanes (SLOSH) model, developed by the National Oceanic and Atmospheric Administration (NOAA), numerically simulates these interactions by solving shallow-water equations with parametric wind and pressure fields to forecast storm surges, aiding coastal flood predictions with resolutions down to 200 meters.[126][127] Observations of atmospheric tides rely on ground-based barometers, which have recorded semidiurnal pressure oscillations since the 19th century, revealing global patterns tied to solar heating and confirming amplitudes of 0.3–0.7 mb in the tropics.[128] Satellite altimetry and gravimetry missions, such as GRACE and Jason series, provide complementary global views by measuring sea surface height perturbations from atmospheric loading and internal tide responses, highlighting influences on large-scale circulation like the Hadley cell.[129] These datasets demonstrate how atmospheric tides modulate tropospheric winds and contribute to interannual variability in global circulation patterns.[130]Inland and Lake Tides
Inland tides manifest in enclosed water bodies such as large lakes and rivers, where gravitational forces from the Moon and Sun induce subtle water level fluctuations independent of oceanic influences. These effects arise primarily from direct tidal potential—the gravitational gradient across the water body—combined with barometric pressure changes that alter water density and level via the inverted barometer effect.[131] In lakes, these mechanisms produce seiche-like oscillations, where the water surface responds resonantly to periodic loading, though amplitudes remain minimal due to the basins' limited size and frictional damping. Lake tides are characteristically small, often on the centimeter scale, as the enclosed nature of these basins prevents amplification from coastal resonance seen in oceans. For instance, in Lake Superior, the principal lunar semidiurnal M2 tidal constituent exhibits an amplitude of about 5 cm, driven solely by astronomical forcing without any oceanic propagation.[133] Similarly, other Great Lakes show tidal responses under 5 cm, frequently overshadowed by larger meteorological variations like wind setup or seiches.[134] These tides follow semidiurnal and diurnal cycles but contribute only marginally to overall water level dynamics in such systems.[135] In river systems, particularly estuaries, tidal effects propagate upstream from the ocean, creating progressive waves that can form pronounced bores in funnel-shaped channels with strong tidal ranges. The Amazon River exemplifies this, where the incoming tide generates a bore known as the pororoca, reaching heights exceeding 4 m and traveling hundreds of kilometers inland before damping due to channel friction and bed roughness.[136] This upstream propagation diminishes with distance, as energy dissipates through turbulence and width variations, limiting significant tidal influence to the lower reaches.[137] Studies of Great Lakes tides reveal long-term modulations, including the 18.6-year lunar nodal cycle, which tilts the Moon's orbital plane and varies tidal forcing amplitudes by up to 20% over this period.[16] Observations from lake-level gauges confirm these nodal variations in the small tidal signals, influencing mean water levels on decadal scales alongside climatic factors.[138] Such cycles have practical implications for water management, as they affect long-term forecasting for navigation, coastal infrastructure, and ecosystem planning in the Great Lakes basin, where precise level predictions mitigate risks to shipping and water diversion.[139]References
- https://www.coastalwiki.org/wiki/Shallow-water_wave_theory
- https://en.wikisource.org/wiki/Dictionary_of_National_Biography%2C_1885-1900/Young%2C_Thomas_%281773-1829%29
- https://www.coastalwiki.org/wiki/Hard_coastal_protection_structures
- https://www.coastalwiki.org/wiki/Rocky_shore_habitat
- https://ntrs.[nasa](/page/NASA).gov/api/citations/19780014614/downloads/19780014614.pdf